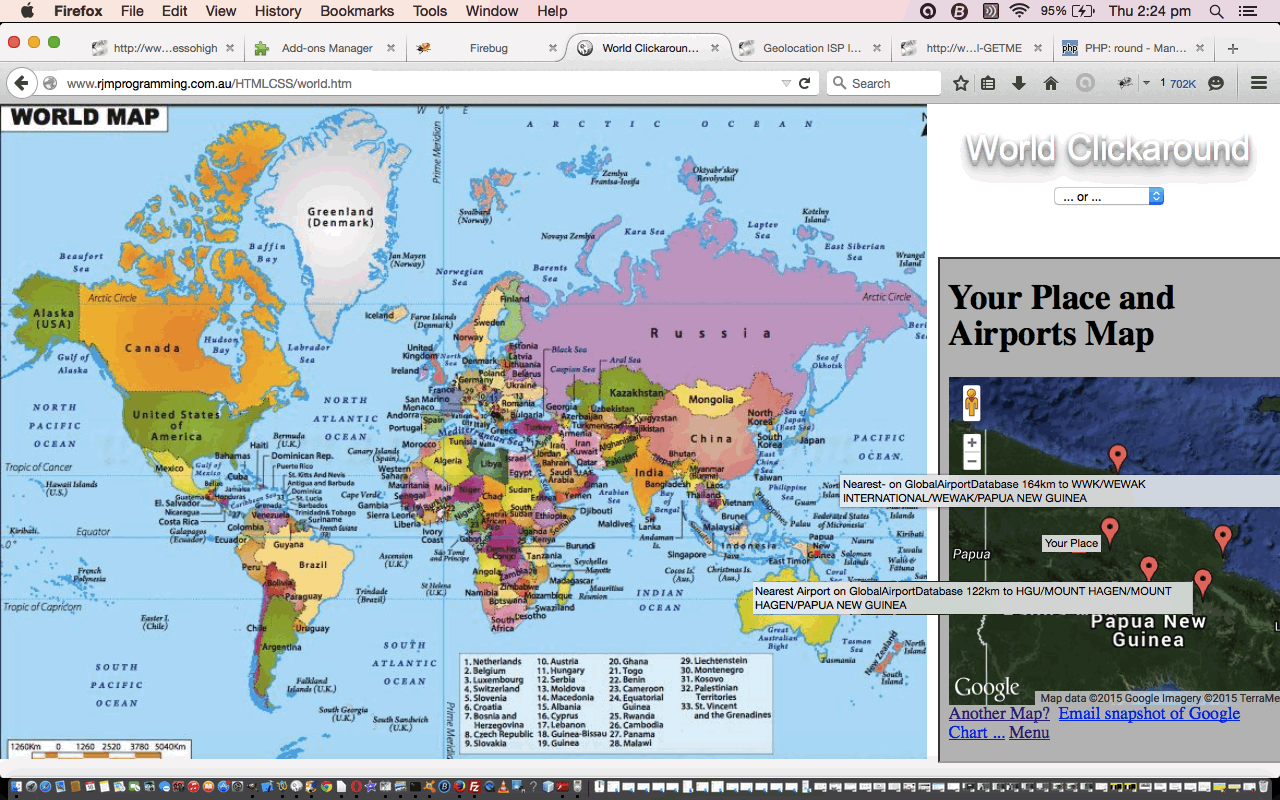
HTML5 brought in the incredibly useful “canvas” element, for the first time. Its existence opens up a whole new world of possibilities for web applications that are graphical by nature, as we saw yesterday with HTML5 Canvas Map Clickaround Primer Tutorial as shown below. Today, we extend that functionality as of yesterday, by adding the use of a public data feed to enhance the information we present with the Google Map “iframe” we use, and for this we need to thank, profusely, The Global Airport Database project by Arash Partow … thanks very much. Now this database (really a file), as you can imagine, has data that changes over time, so is probably best used as a data feed. Nevertheless, the exercise of using it as a snapshot is useful, and we go ahead and show the nearest 4 airports on the database, in that Google Map “iframe” as of April, 2015.
This involved the use of PHP (intair.php) to read the file and parse it, which wasn’t hard as it contains well formed “:” delimited data, and there is just the check needed for security hidden data given a latitude and longitude of zero … unless I’m mistaken, and where the water goes down the sink the other way as you cross the equator due south of London has several hundred microscopic airports run by ants … what a movie script?!
With the canvas element’s drawImage() method, we use to position the image map of interest, you can draw more than your own geometrical constructs, you can have an image, and that image could be a map, as for today’s “World Clickaround” web application (with access to maps of Brazil and Ireland and United States of America too), where you click on the map (and thanks to mapsofworld.com for downloadable free maps here) to show a Google Map of interest via Google Chart Map Chart. Maybe you can use the map of the World to …
- plan a trip
- look up where relatives live
- count the fire hydrants in Monaco
This web application calls on tiny bits of mapping knowledge, namely the “orientation” of your “map”, as you are effectively digitizing to show where you want your Google Map to zoom in on.
Please have a go of our live run or download the HTML programming source code you could call world.htm (brazil.htm, ireland.htm, united_states.htm), or do both?!
From yesterday, this is how we got to today … there was new PHP you could call intair.php … and then there was changed HTML, the changes for which look like … world.htm, brazil.htm, ireland.htm, united_states.htm
Previous relevant HTML5 Canvas Map Clickaround Primer Tutorial is shown below.
HTML5 brought in the incredibly useful “canvas” element, for the first time. Its existence opens up a whole new world of possibilities for web applications that are graphical by nature.
With the canvas element’s drawImage() method you can draw more than your own geometrical constructs, you can have an image, and that image could be a map, as for today’s “Ireland Clickaround” web application (with access to maps of Brazil and United States of America and the World too), where you click on the map (and thanks to mapsofworld.com for downloadable free maps here) to show a Google Map of interest via Google Chart Map Chart. Maybe you can use the map of Ireland to …
- plan a trip
- look up where relatives live
- imagine you’re in O’Connell Street
This web application calls on tiny bits of mapping knowledge, namely the “orientation” of your “map”, as you are effectively digitizing to show where you want your Google Map to zoom in on.
This is one of those occasions that your (simple) software is a lot more effective using the Mercator map projection (that exaggerates the polar areas (like you might have had at school) because the simple latitude and longitude distances everywhere are the same (but relative areas definitely are not (ie. much bigger than reality near the poles))). Unfortunately, our United States of America projection is not Mercator, but you’ll still get a “ball park” Google Maps feel.
So we can have it that if the user doesn’t zoom, they need no orientation checks, but otherwise we need to determine a scale, by the user clicking on Dublin, on the map, and from that, we can work out the scaling that needs to be applied, as the top left co-ordinate is arranged to be (0,0) via the style=”position: absolute; top:0; left:0; “ part of …
<canvas id="canvaselement" width=600 height=600 style="position: absolute; top:0; left:0; " />
Please have a go of our live run or download the HTML programming source code you could call ireland.html (brazil.html, united_states.html, world.html), or do both?!
If this was interesting you may be interested in this too.
If this was interesting you may be interested in this too.


