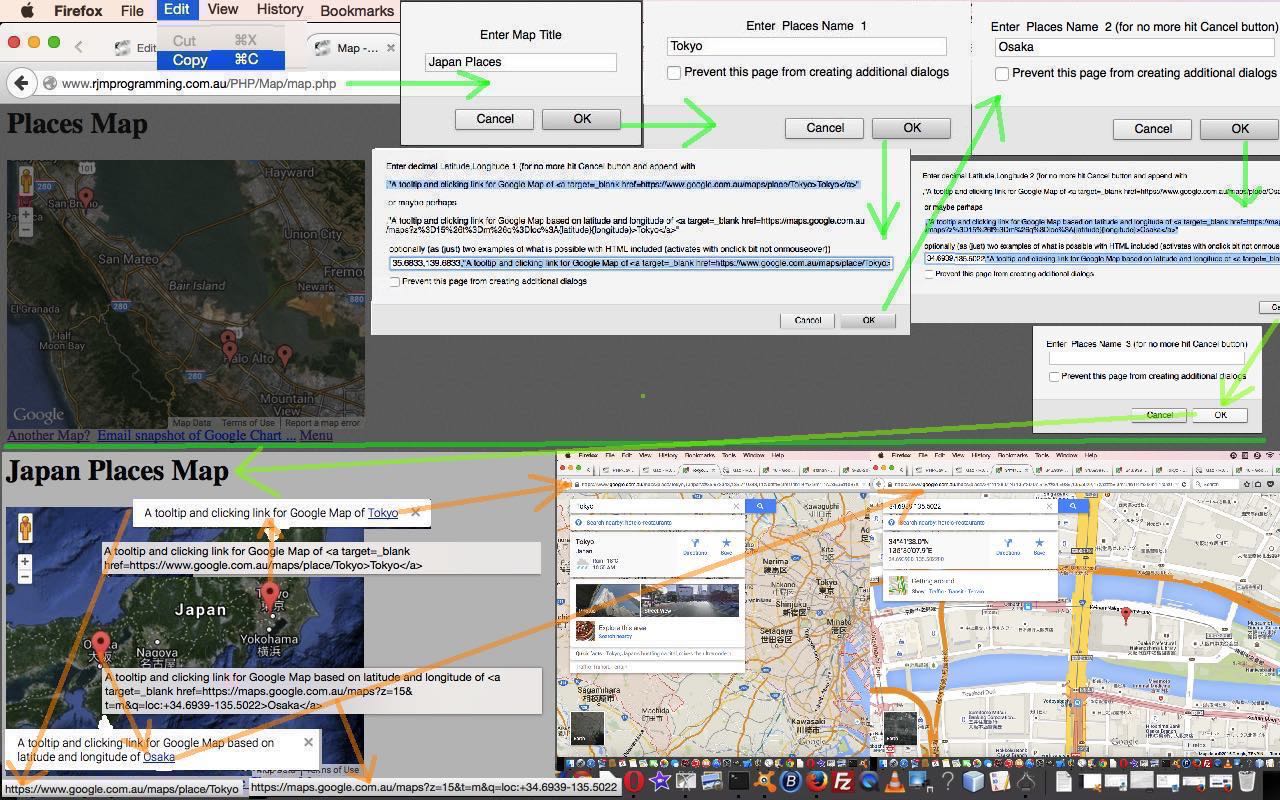
They say “the knee bone’s connected to the thigh bone” then they say “the thigh bone’s connected to the … hip bone” then they say “let’s call the whole thing off” … sometimes.
Today we say “the onmouseover event is connected to the onclick event” then we say “the onclick event is connected to the online woooooorld” … “do … the hokey pokey” x3 … “that’s what the onclick event preceeded by the onmouseover event within the environs you are encountering … is all about”.
That news is pretty good actually, because it means mobile users are not missing out on much not having easy access to any onmouseover (ie. hover) functionality … they’ll still reach any onclick logic you present them, in the default case of events where onclick is a valid “touch” event as well.
So the data structure of arrangements to allow for this onclick functionality is intrinsically the same as allowed for yesterday with the PHP/Javascript/HTML Google Chart Map Tooltips Tutorial as shown below, but we just check for some more delimitation issue matters, and our updated prompting window logic gets quite “blurby” as per the Javascript (via PHP) …
 echo " datalinesuffix = prompt('Enter decimal Latitude,Longitude ' + thisline + extra +  ' (for no more hit Cancel button and append with ' + '\\n\\n' + ',\"A tooltip and clicking link for Google Map of <a target=_blank href=https://www.google.com.au/maps/place/' + encodeURIComponent(dlp2) + '>' + dlp2 + '</a>\" ' + '\\n\\n' + ' or maybe perhaps ' + '\\n\\n' + ',\"A tooltip and clicking link for Google Map based on latitude and longitude of <a target=_blank href=https://maps.google.com.au/maps?' + encodeURIComponent('z=15&t=m&q=loc:') + '{latitude}{longitude}>' + dlp2 + '</a>\"' + '\\n\\n' + ' optionally (as (just) two examples of what is possible with HTML included (activates with onclick bit not onmouseover))', thisdef); " . "\n";

 echo ' if (datalinesuffix != null) { if (datalinesuffix.indexOf("{latitude}") != -1) { dlsa=datalinesuffix.split(","); if (dlsa[0].indexOf("-") == -1) { datalinesuffix=datalinesuffix.replace("{latitude}",encodeURIComponent("+" + dlsa[0]));  } else { datalinesuffix=datalinesuffix.replace("{latitude}",encodeURIComponent(dlsa[0]));  }  } if (datalinesuffix.indexOf("{longitude}") != -1) { dlsa=datalinesuffix.split(","); if (dlsa.length > 1) { if (dlsa[1].indexOf("-") == -1) { datalinesuffix=datalinesuffix.replace("{longitude}",encodeURIComponent("+" + dlsa[1]));  } else { datalinesuffix=datalinesuffix.replace("{longitude}",encodeURIComponent(dlsa[1])); }  }  }    } ' . "\n";
… as again we are making use of $_GET[] parameters coming into the PHP at the server side.
The bigger picture plan for how this helps something else we are trying will become apparent over time … in the fullness of time … at the appropriate juncture of juxtapositions.
Let’s see some PHP code in live action for this tutorial where you define your map characteristics and data.
Link to Google Chart Tools “spiritual home” … via Google.
Link to Google Chart Tools Map information … via Google.
Link to Google Chart tooltips information … via Google.
Link to some downloadable PHP programming code … rename to map.php which changed from yesterday as per this link.
Previous relevant PHP/Javascript/HTML Google Chart Map Tooltips Tutorial is shown below.
Here is a tutorial that is revisiting Google Graphs API, or Google Chart Tools, and its Map functionality, which we first talked about with PHP/Javascript/HTML Google Chart Map Tutorial as shown below. Please read …
Google Chart Tools provide a perfect way to visualize data on your website. From simple line charts to complex hierarchical tree maps, the chart galley provides a large number of well-designed chart types. Populating your data is easy using the provided client- and server-side tools.
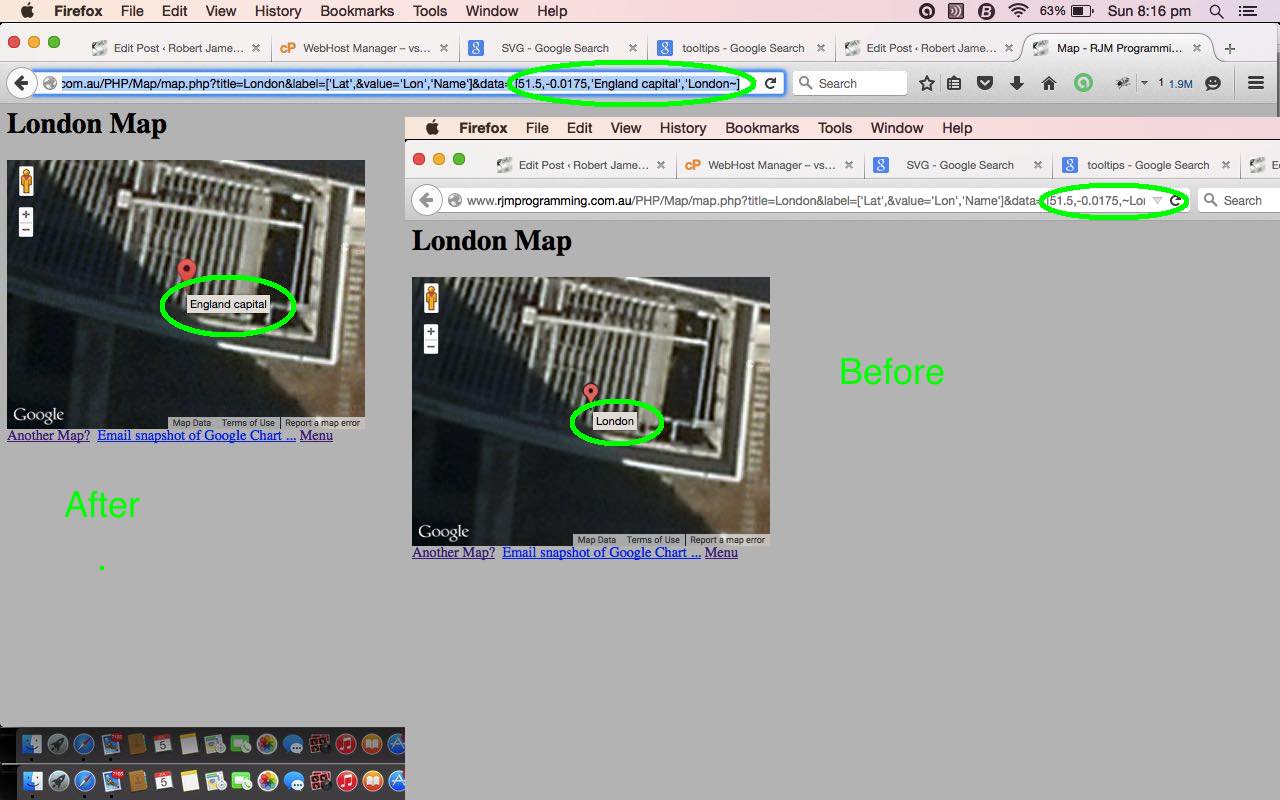
Why are we revisiting? Well, we are interested in the interactive side to this wonderful product. We are going to start with a look into “tooltips”. Tooltips are those optional informational features of some webpages that happen when hovering over an HTML element, principally through the filling out of an HTML element’s title global attribute.. Google Charts functionality amounts to the use of Javascript, and, these days, SVG HTML elements, so “tooltips” are very relevant to the “user experience” when using Google Charts. With the Map Chart, the latitude, laongitude set is combined with a title, which can be the default “tooltip” shown, as this is all fine for many usages, but we want to extend it so that that title doesn’t have to be the tooltip.
The integration of this added functionality into the Google Chart Map Chart involves adding an extra “string” column to the data table as per the bold bits of the new Javascript (via PHP) snippet …
 if (isset($_GET['value']) && (isset($_GET['tooltip']) || strpos($GETdata, "'") !== false)) {

  echo "   var data = new google.visualization.DataTable(); /" . "/" . $GETlabel . $GETvalue . " \n";

  echo "   data.addColumn('number', '" . str_replace("'","",str_replace(",","",str_replace("['","",$GETlabel))) . "');  \n";

  echo "   data.addColumn('number', " . str_replace(",", "); data.addColumn({'type': 'string', 'role': 'tooltip', 'p': {'html': true}}); data.addColumn('string', ", str_replace("]","",$GETvalue)) . ");  \n";

  echo "   data.addRows([ \n";

  echo str_replace("''" . "''", "''", str_replace("~", "'", substr($GETdata,1)));

  echo "   ]); \n";

 } else {


      echo ' var data = google.visualization.arrayToDataTable([ ' . "\n";

      echo " " . $GETlabel . $GETvalue . " \n";

      echo str_replace("''" . "''", "''", str_replace("~", "'", $GETdata));

      echo "        ]);\n";

 }
… making use of $_GET[] parameters coming into the PHP at the server side … you’ll find that Javascript loves to work with PHP as one of those Fred and Ginger relationships of the programming world … you’ll be happier writing Javascript from your PHP too … try it and you’ll see the advantages time and again and again and again … did we leave out one? … and again.
The bigger picture plan for how this helps something else we are trying will hopefully become apparent over time.
Let’s see some PHP code in live action for this tutorial where you define your map characteristics and data.
Link to Google Chart Tools “spiritual home” … via Google.
Link to Google Chart Tools Map information … via Google.
Link to Google Chart tooltips information … via Google.
Link to some downloadable PHP programming code … rename to map.php which changed from the days of Google Charts Emailing Primer Tutorial as per this link.
Previous relevant PHP/Javascript/HTML Google Chart Map Tutorial is shown below.
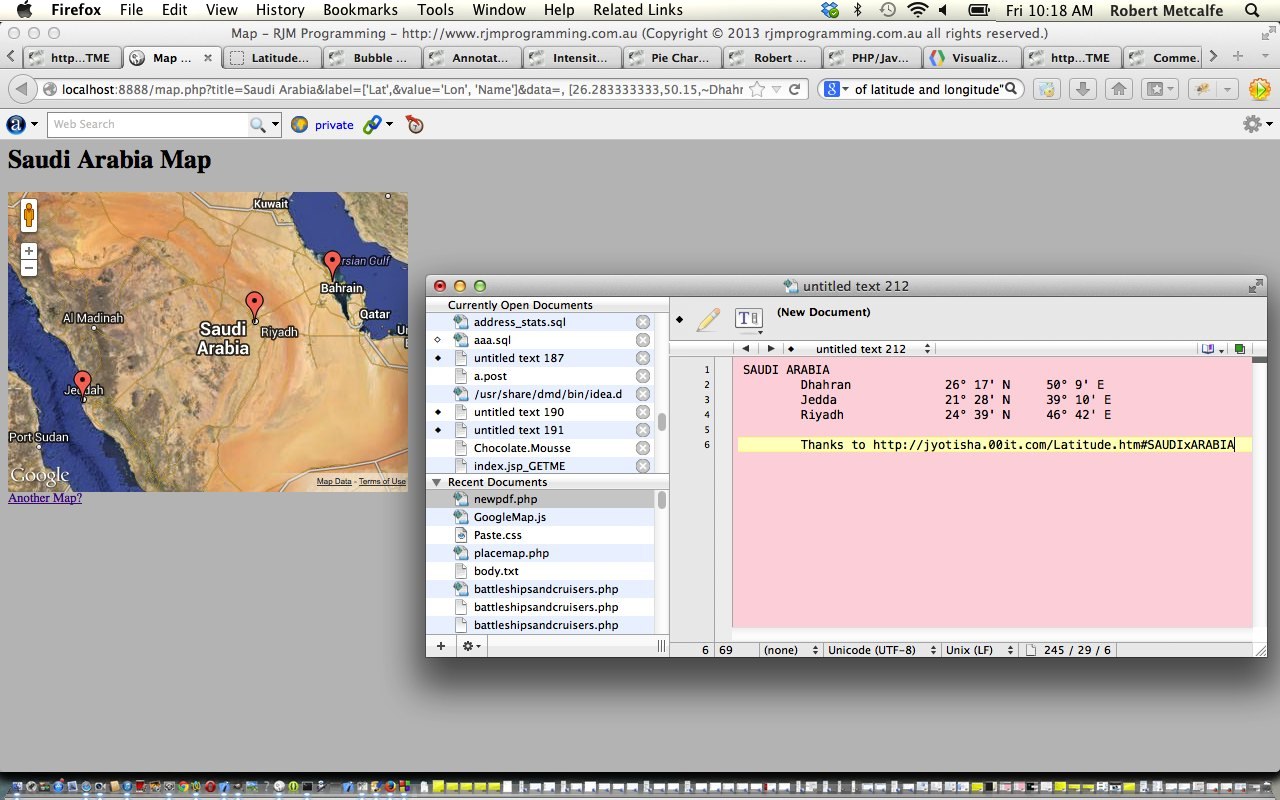
Here is a tutorial that introduces you to Google Graphs API, or Google Chart Tools, and its Map functionality.
Google Chart Tools provide a perfect way to visualize data on your website. From simple line charts to complex hierarchical tree maps, the chart galley provides a large number of well-designed chart types. Populating your data is easy using the provided client- and server-side tools.
Let’s see some PHP code in live action for this tutorial where you define your map characteristics and data.
Link to Google Chart Tools “spiritual home” … via Google.
Link to Google Chart Tools Map information … via Google.
Link to some downloadable PHP programming code … rename to map.php.
If this was interesting you may be interested in this too.
If this was interesting you may be interested in this too.
If this was interesting you may be interested in this too.


