HTML/Javascript Canvas Venn Diagram Tutorial
โœ‚๐Ÿƒ๐Ÿพโ€โ™€๏ธ๐Ÿƒ๐Ÿผโ€โ™‚๏ธ
๐Ÿ“–

HTML/Javascript Canvas Venn Diagram Tutorial

HTML/Javascript Canvas Venn Diagram Tutorial

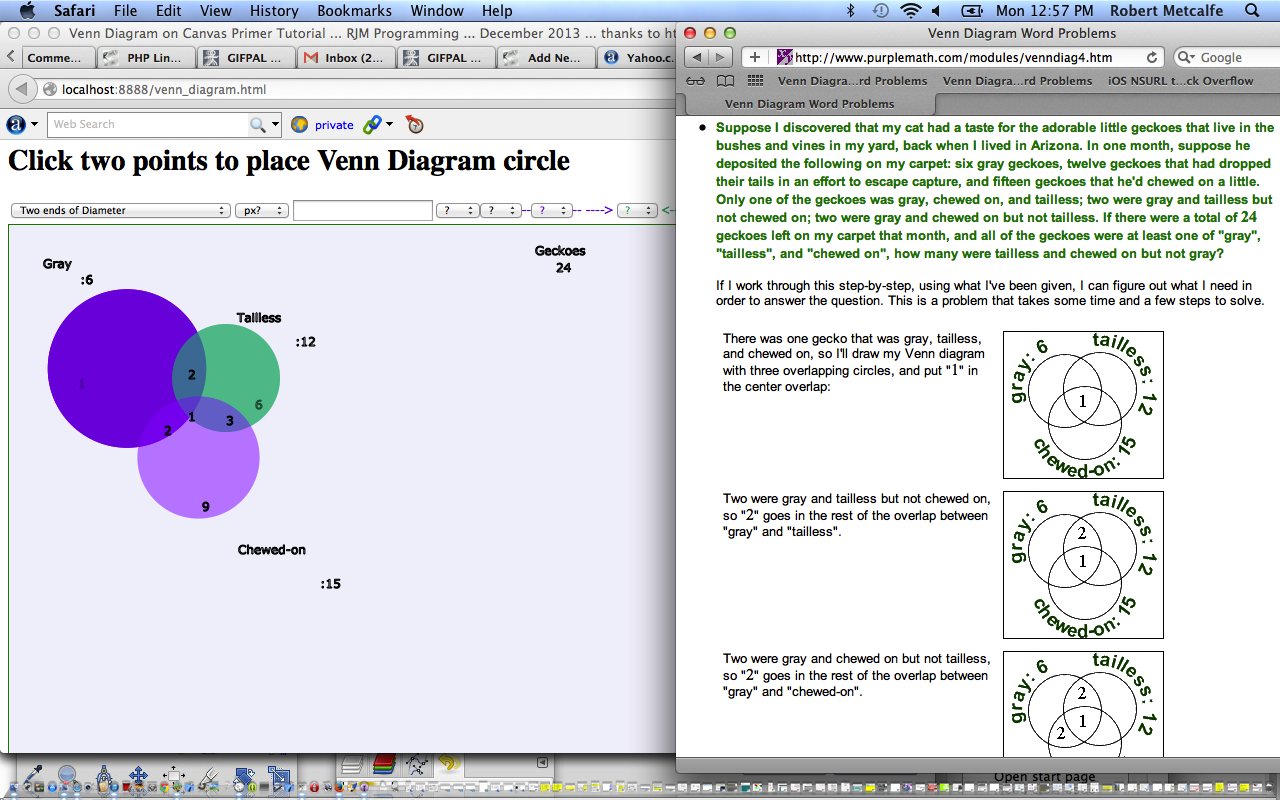
Here is a liveโœ‚run showing some client-side basics in HTML and Javascript that can be used to create your own Venn Diagrams. Were Venn Diagrams something you learnt at school, to do with โ€œset theoryโ€? It can be an interesting area of mathematics, and statistics, perhaps. In todayโ€™s tutorial we do an example involving Geckoes โ€ฆ yes, Geckoes โ€ฆ not echoes โ€ฆ but, Geckoes โ€ฆ the inspiration for which came from this great link (thanks). You can read about it from Wikipedia here.

This HTML/Javascript solution uses an HTML canvas element, which you can first read about, at this blog, here.

You may want to read more at HTML Canvas Reference as a generic reference, or here, at the tutorial javascript โ€“ How do I add a simple onClick event handler to a canvas element? โ€“ Stack Overflow.

Here is a very useful link that helped with an algorithm to determine if two circles intercept โ€ฆ thanks.

Link to some downloadable HTML programming code โ€ฆ rename to venn_diagramโšซhtml

If this was interesting you may be interested in this too.

This entry was posted in eLearning, Tutorials and tagged , , , , , , . Bookmark the permalink.

Leave a Reply

Your email address will not be published. Required fields are marked *