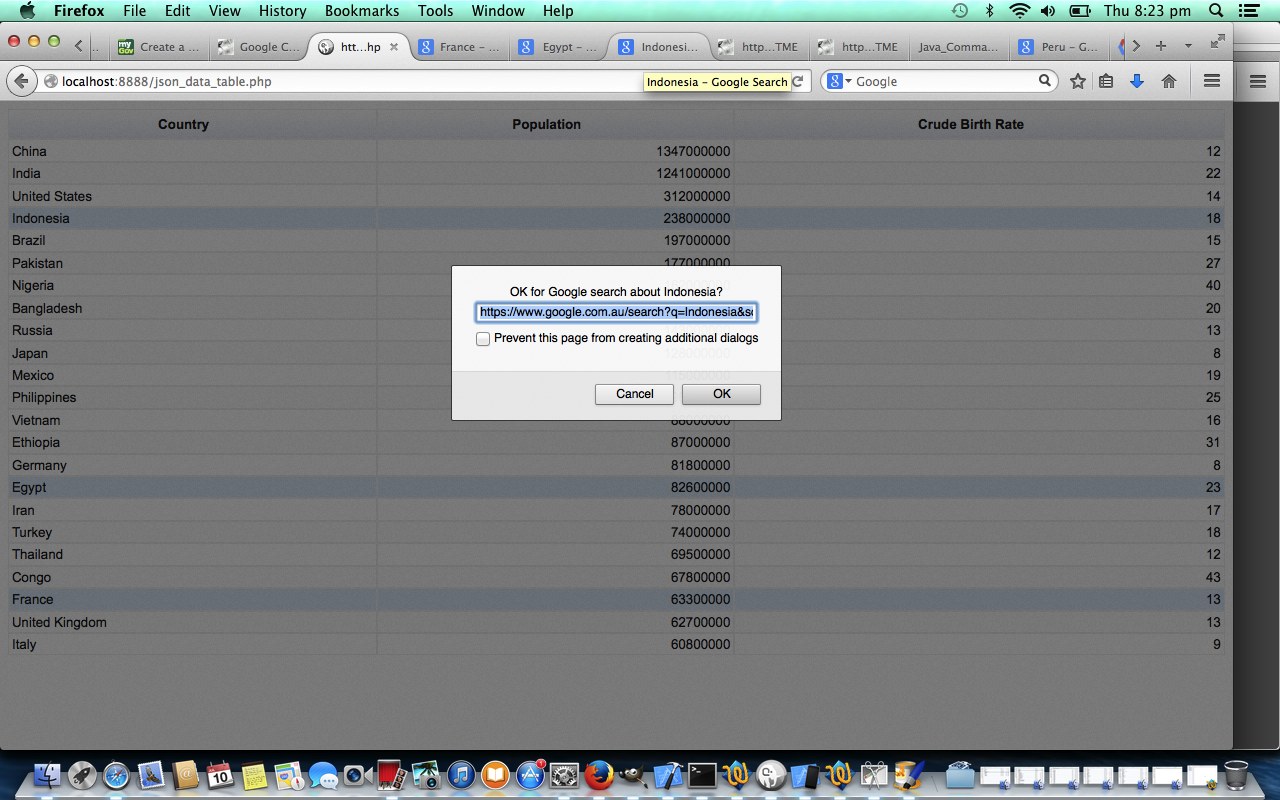
Here is a tutorial that re-introduces you to Google Graphs API, or Google Chart Tools, and its JSON Data Table functionality which we talked about last time with PHP/Javascript/HTML Google Chart JSON Data Table Import of CSV Tutorial as shown below. Today we extend the functionality talk by adding some event logic for when we click on a table row.
Google Chart Tools provide a perfect way to visualize data on your website. From simple line charts to complex hierarchical tree maps, the chart galley provides a large number of well-designed chart types. Populating your data is easy using the provided client- and server-side tools.
Thanks to the World Bank for some statistics which helped a lot.
Let’s see some PHP code in live action for this tutorial where you see a JSON Data Table derived from a filename passed as a parameter in the URL. The data shown is based on a CSV file of a previous PHP/Javascript/HTML Google Chart Intensity Map Tutorial shown below.
Link to Google Chart Tools “spiritual home” … via Google.
Link to Google Chart Tools JSON Data Table information … via Google.
Link to Google Chart Tools Event information … via Google.
Link to some downloadable PHP programming code … rename to chart_editor_in.php.
Link to some downloadable PHP programming code … rename to json_data_table_events.php.
Link to some downloadable input CSV data … rename to Google_Chart_Intensity_Chart_Tutorial_as.CSV.
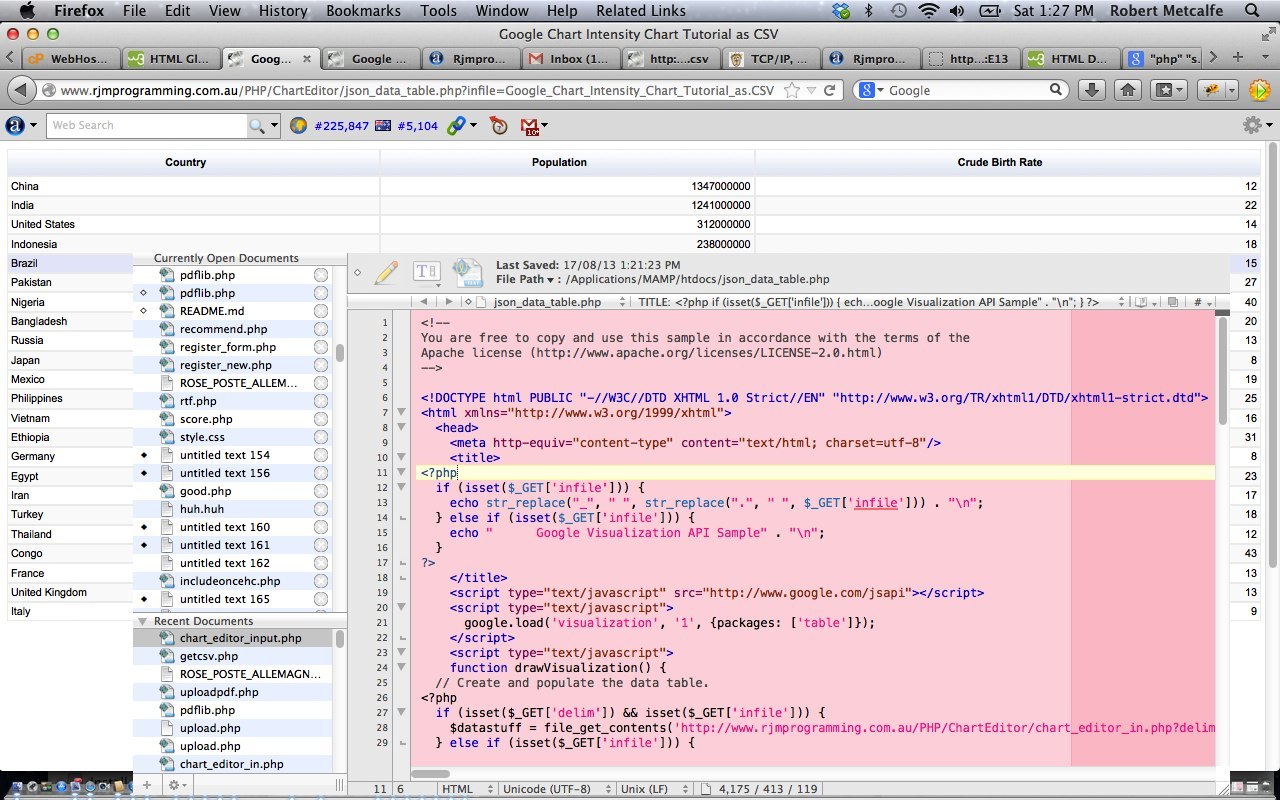
Here is the way we got from the tutorial logic below to this tutorial’s source code’s logic here.
Previous PHP/Javascript/HTML Google Chart JSON Data Table Import of CSV Tutorial is shown below.
Here is a tutorial that introduces you to Google Graphs API, or Google Chart Tools, and its JSON Data Table functionality.
Google Chart Tools provide a perfect way to visualize data on your website. From simple line charts to complex hierarchical tree maps, the chart galley provides a large number of well-designed chart types. Populating your data is easy using the provided client- and server-side tools.
Thanks to the World Bank for some statistics which helped a lot.
Let’s see some PHP code in live action for this tutorial where you see a JSON Data Table derived from a filename passed as a parameter in the URL. The data shown is based on a CSV file of a previous PHP/Javascript/HTML Google Chart Intensity Map Tutorial shown below.
Link to Google Chart Tools “spiritual home” … via Google.
Link to Google Chart Tools JSON Data Table information … via Google.
Link to some downloadable PHP programming code … rename to chart_editor_in.php.
Link to some downloadable PHP programming code … rename to json_data_table.php.
Link to some downloadable input CSV data … rename to Google_Chart_Intensity_Chart_Tutorial_as.CSV.
Previous PHP/Javascript/HTML Google Chart Intensity Map Tutorial below …
Here is a tutorial that introduces you to Google Graphs API, or Google Chart Tools, and its Intensity Map functionality.
Google Chart Tools provide a perfect way to visualize data on your website. From simple line charts to complex hierarchical tree maps, the chart galley provides a large number of well-designed chart types. Populating your data is easy using the provided client- and server-side tools.
Thanks to the World Bank for some statistics which helped a lot.
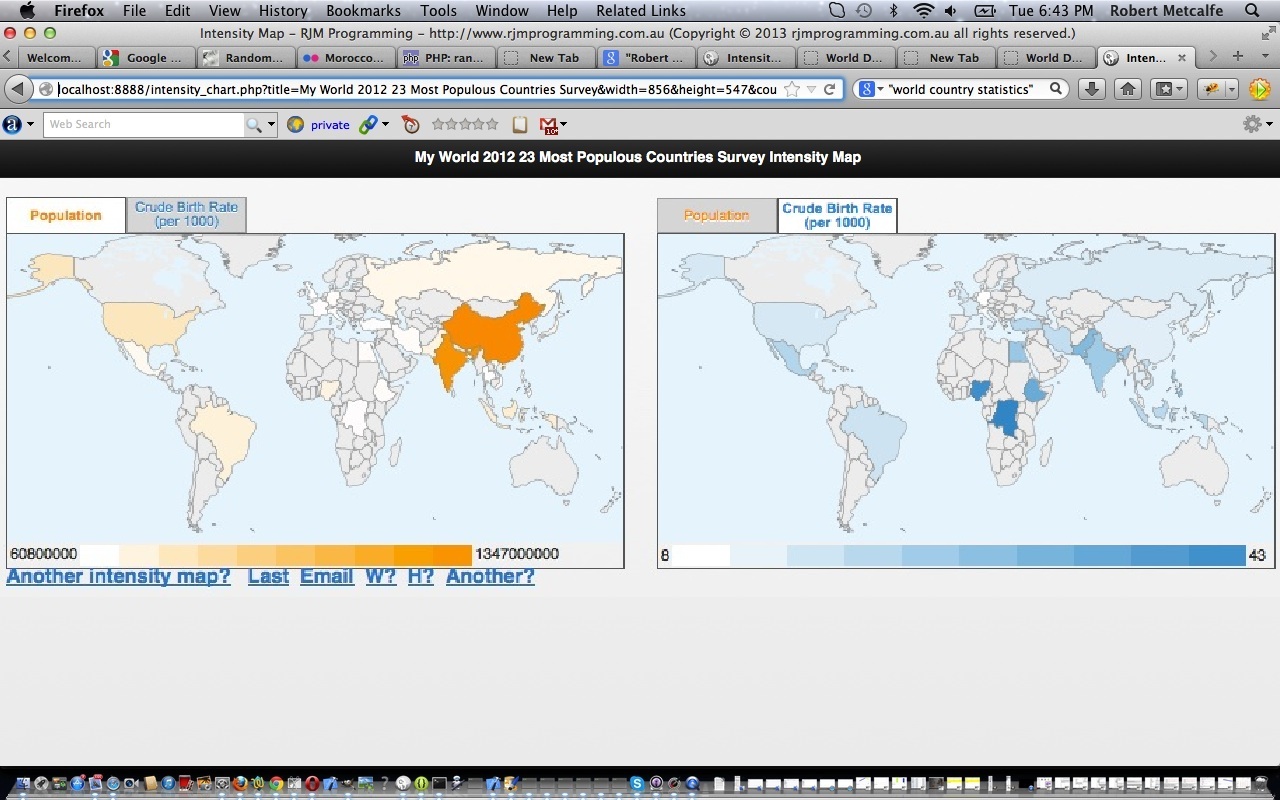
Let’s see some PHP code in live action for this tutorial where you define your intensity map characteristics and data.
Now part of an Android App called Geo Chart++ in July 2013.
Link to Google Chart Tools “spiritual home” … via Google.
Link to Google Chart Tools Intensity Map information … via Google.
Link to some downloadable PHP programming code … rename to intensity_chart.php.
If this was interesting you may be interested in this too.
If this was interesting you may be interested in this too.
If this was interesting you may be interested in this too.


