
Walking Trip

📅

Tcl/Tk macOS and Xcode Revisit Tutorial
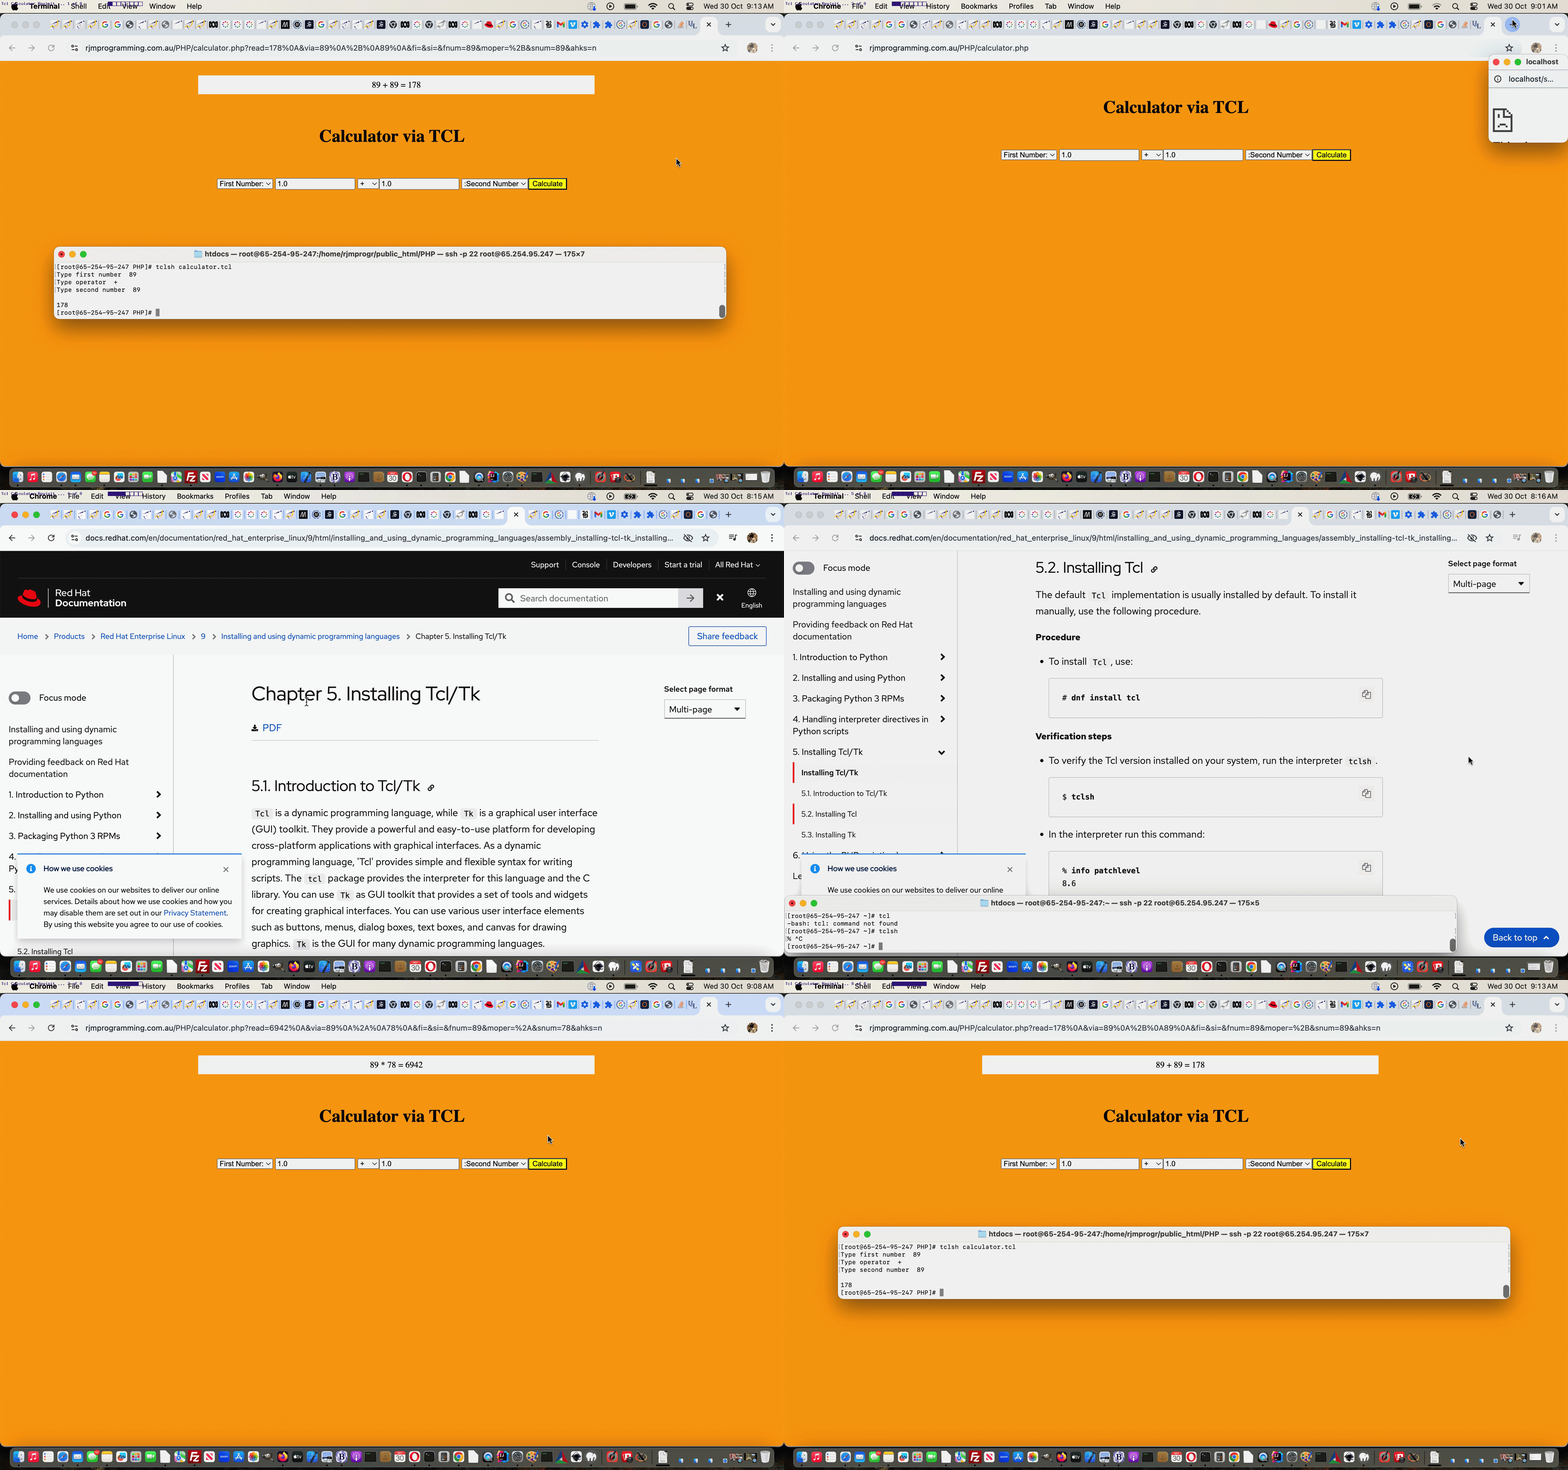
Rather than trying to get the GUI side of Tcl, called Tk, working on our AlmaLinux public web server, we settled for a Tcl only web application there when we presented Tcl and Javascript and PHP Calculator AlmaLinux Tutorial.
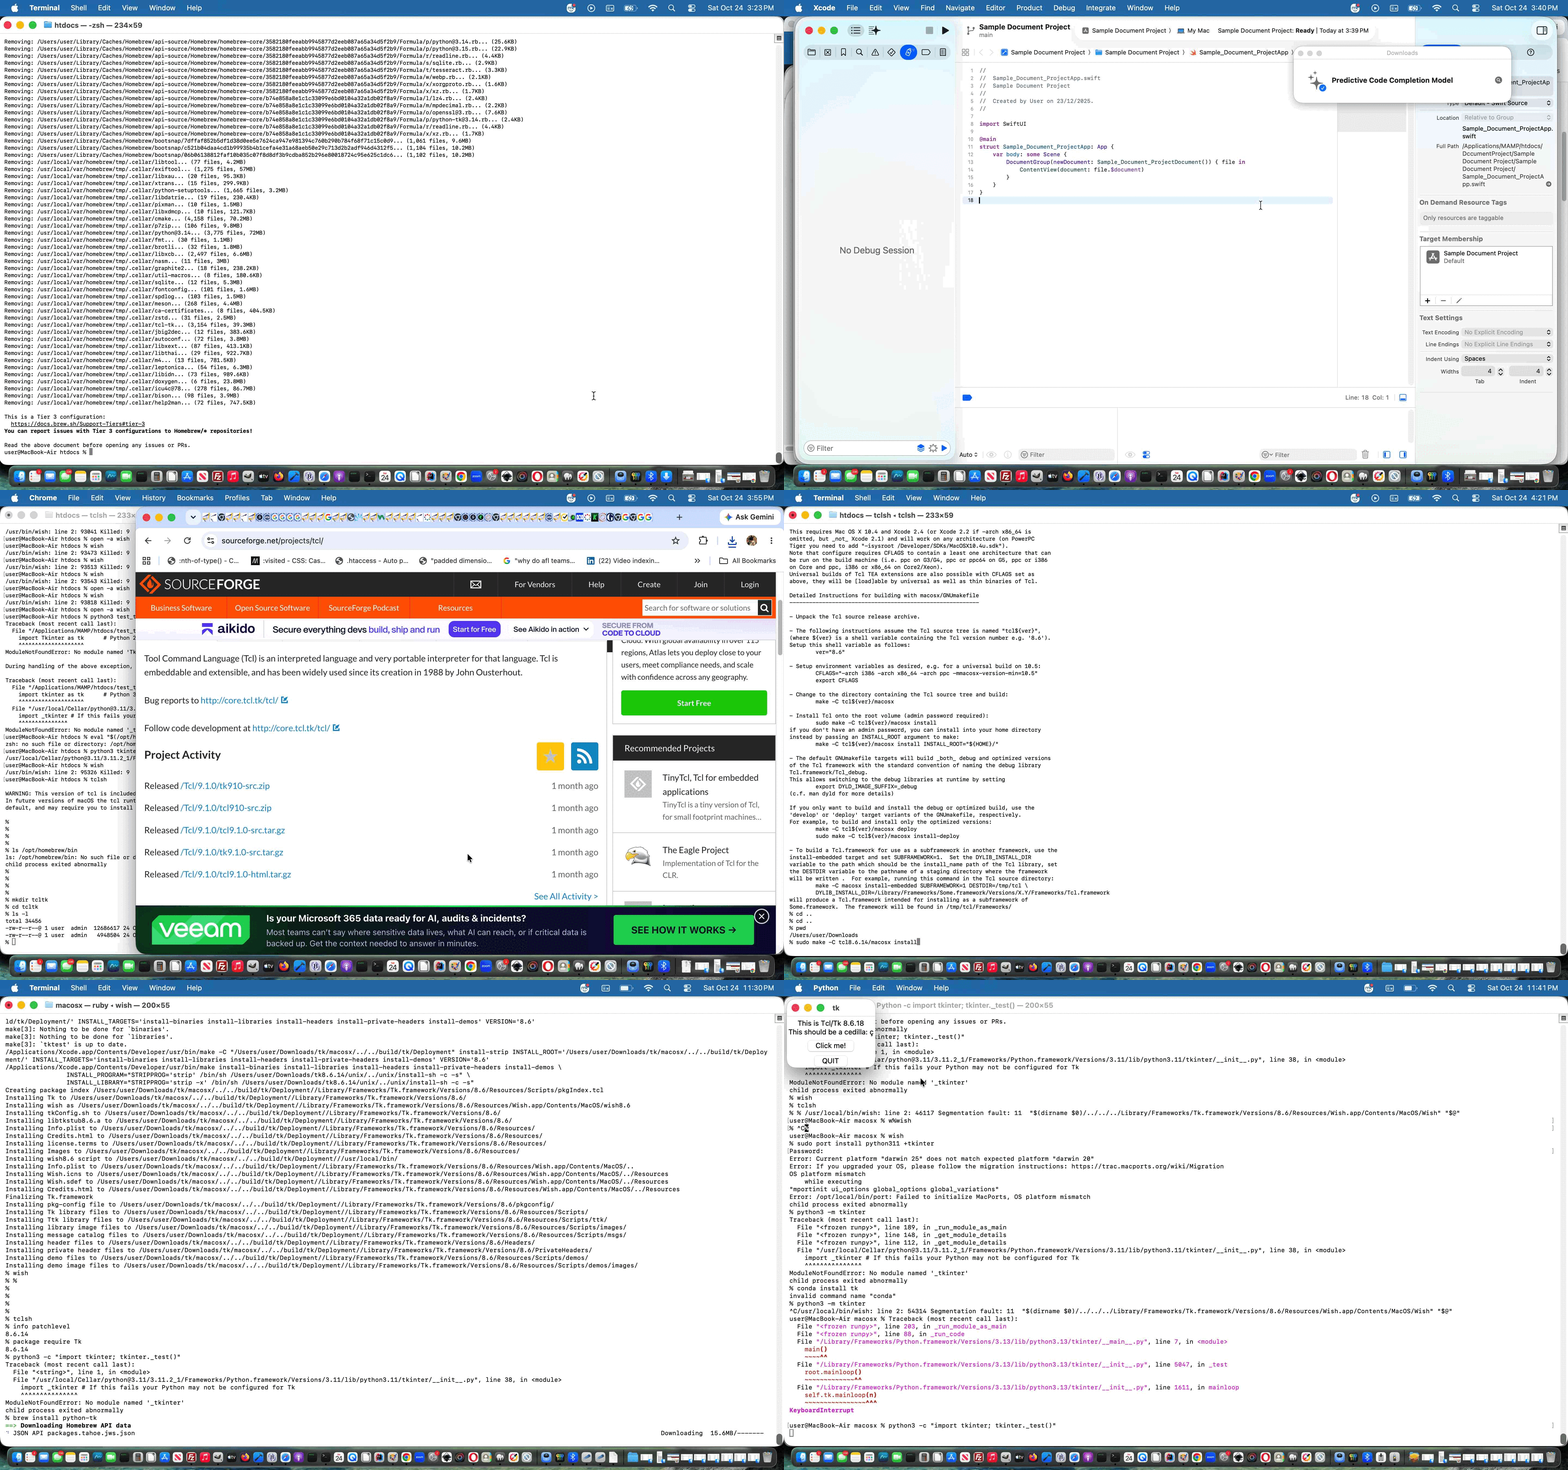
But here, on our local macOS, only using Mac Silicon chips, and this is important these days here in October 2026 with macOS Tahoe 26.6.1 Apple M1 chip, revisiting Tcl/Tk thoughts as we did yesterday, we wanted to reach at the end of our first day’s foray, as kilometermilestones …
clang --version
tclsh
wish
info patchlevel     # coming back 8.6.14 for us ... but read on

package require Tk  # coming back 8.6.14 for us ... but read on
python3 -c "import tkinter; tkinter._test()"
For us, here, with our macOS Mac Silicon chip scenario, after online research, we settled for version …
8.6.14
… ie. tcl8.6.14 and tk8.6.14 to be the ones of interest (ie. our ideal version is 8.6.14), and to avoid Homebrew as your installer. Wish may work with open -a Wish ahead of any installs, out of the box, but if it is not using your ideal version, that is not going to cut it to go onto your own future development work. Perhaps, here, we should say, in all likelihood, along your install path to that first day’s mission statement achievement …
You’ll run into command line errors (and Xcode IDE errors, as applicable).
But what we’d say to that, as a general good idea, is to pick out whole relevant (don’t start with /) error message individual lines (from command line work and/or from Xcode Version 26.6 (17F113) IDE work) and feed all that relevant error line into a Google search box, accessing the advice of the great Open Source online community, thanks, to see what advice you get, and below, we’ve collected some of the ones we got to …
is there a way other than wish to see whether tk and tcl are working on macos?
can tkinter be installed to python3 on macos not using homebrew?
Error: Current platform “darwin 25” does not match expected platform “darwin 20”
… on our quest highlighted by, getting right, commands …
xcode-select --install
sudo xcodebuild -runFirstLaunch
cd ~/Downloads   # having downloaded tcl8.66.14 and tk8.6.14 from SourceForge webpages

# extracted in their ~/Downloads place both tcl8.6.14-src.tar.gz and tk8.6.14-src.tar.gz creating tcl8.6.14 and tk8.6.14 subfolders

# mv tcl8.6.14 tcl

# mv tk8.6.14 tk

# extracted in their ~/Downloads place both tcl8.6.14-src.tar.gz and tk8.6.14-src.tar.gz again, creating tcl8.6.14 and tk8.6.14 subfolders to end up with four subfolders to work with

make -C tcl8.6.14/macosx

sudo make -C tcl8.6.14/macosx install

make -C tk8.6.14/macosx

sudo make -C tk8.6.14/macosx install
… and maybe there’ll be file permission issues and there may be reasons to create macosx subfolders off macosx subfolders that may happen involving Xcode IDE but we ended up with more joy back at Terminal command line work just using make, it seemed to us.
So, our own tailored Tcl/Tk development work? That awaits!
Previous relevant Tcl and Javascript and PHP Calculator AlmaLinux Tutorial is shown below.
Tcl and Javascript and PHP Calculator AlmaLinux Tutorial
We want to research the wonderful …
… on the AlmaLinux environment of the Apache/PHP/MySql web server we’re using here to host the RJM Programming domain.
We’re just touching on tcl ideas today, revisiting Tcl and Javascript and PHP Calculator Tutorial‘s calculator web application. We had in there some code scouring any local web server systems you may have, and getting the localhost:8888 port arrangements wrong for our local MAMP Apache/PHP/MySql web server, and this was causing unnecessary issues, especially because “tclsh” works, for us, up at AlmaLinux. How can we tell? We took on the excellent advice of Installing Tcl/Tk, and tried …
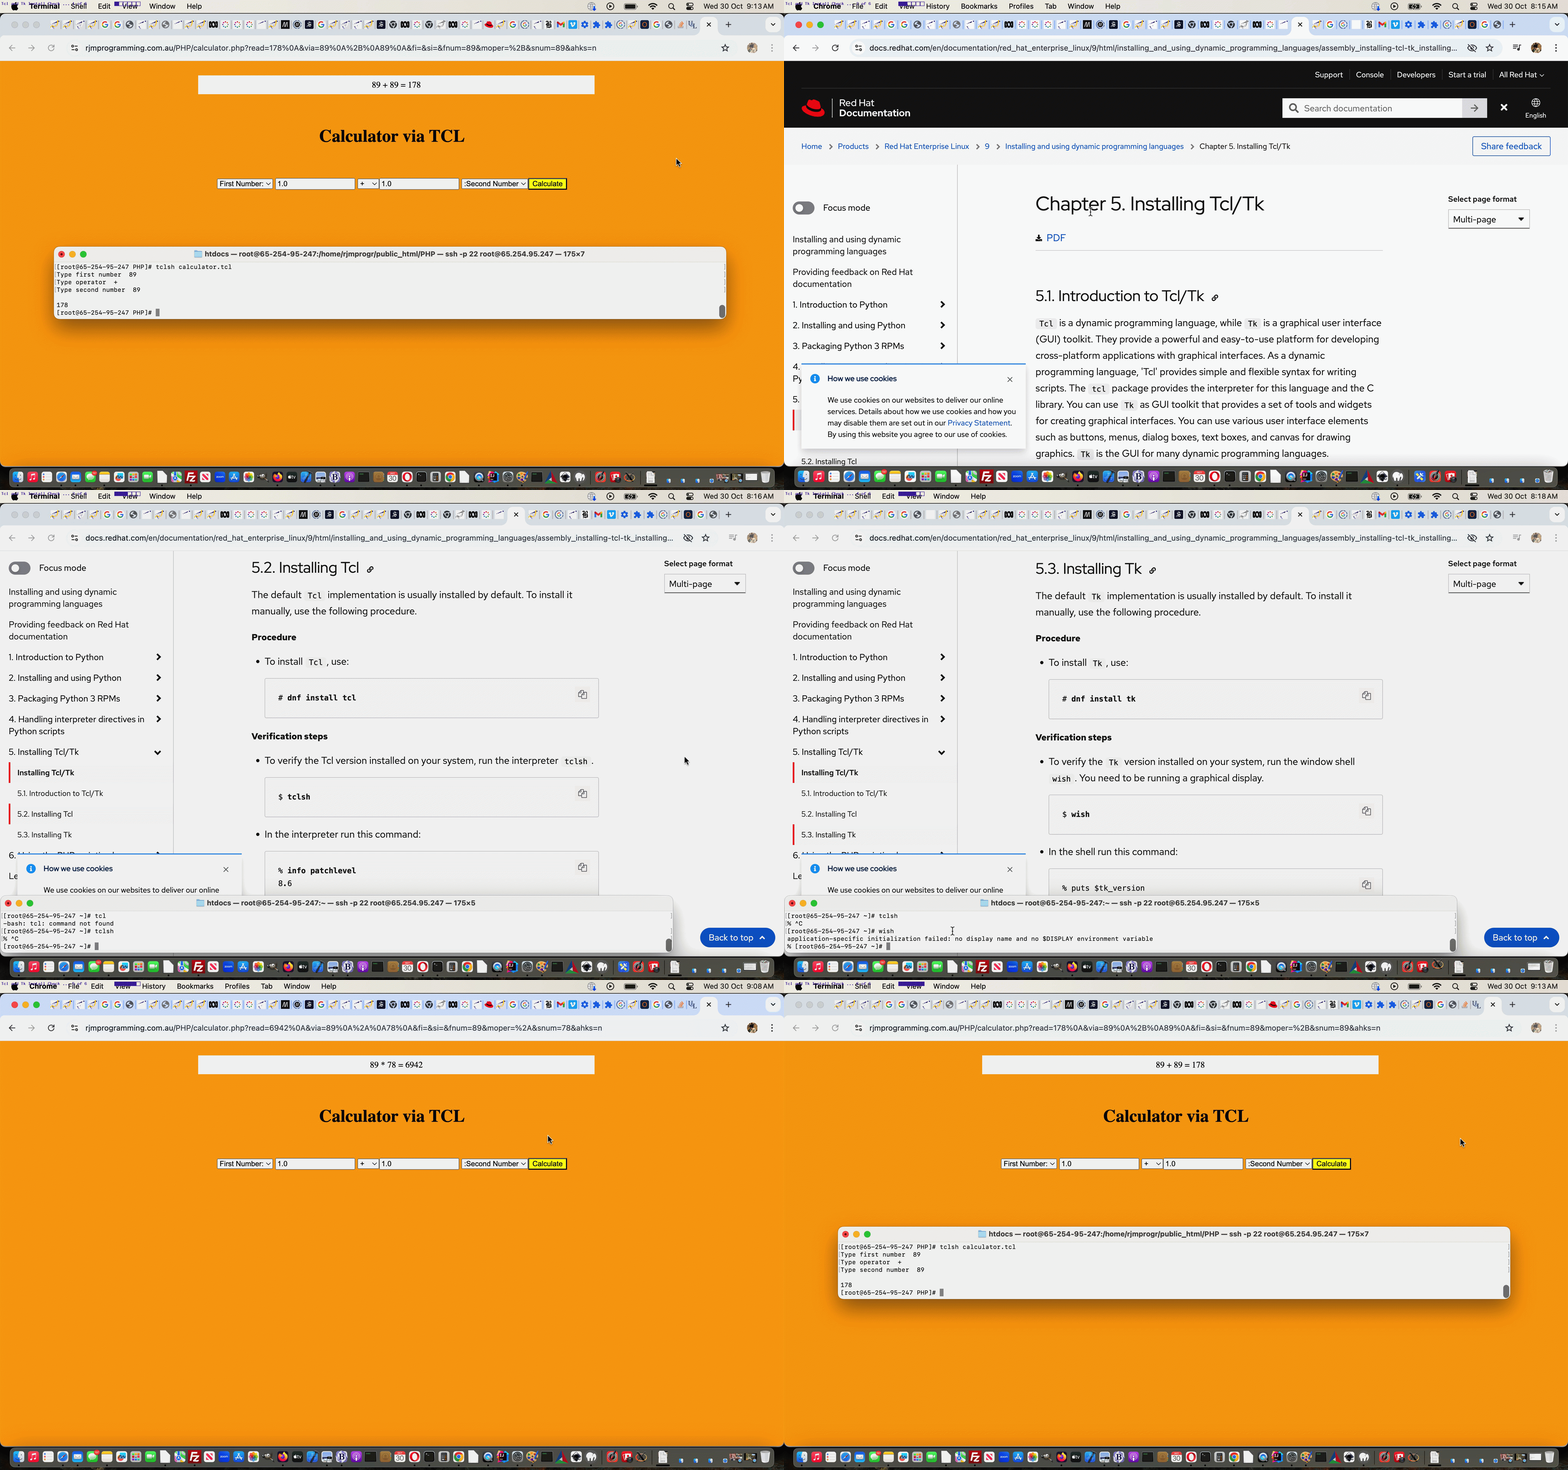
tclsh
… on the command line (and “exit” gets you out of it) with success. Yayyyyy!!! That’s tcl installed already, else we’d have gone dnf install tcl
That’s enough installing for today’s purposes, as we do not call on the tk GUI side of things for our calculator. But, to check on the install part to this, try …
wish
… on the command line, and check that there is a wishful response whether that be erroneous (as we were, so far, with AlmaLinux command line) or not, else we’d have gone dnf install tk
All that sorted, and we’re “good to go” with the changed calculator.php Calculator web application calling on our unchanged calculator.tcl TCL source code, as below …
Another woooorrrrlllldddd, perhaps?!
Previous relevant Tcl and Javascript and PHP Calculator Tutorial is shown below.
Tcl and Javascript and PHP Calculator Tutorial
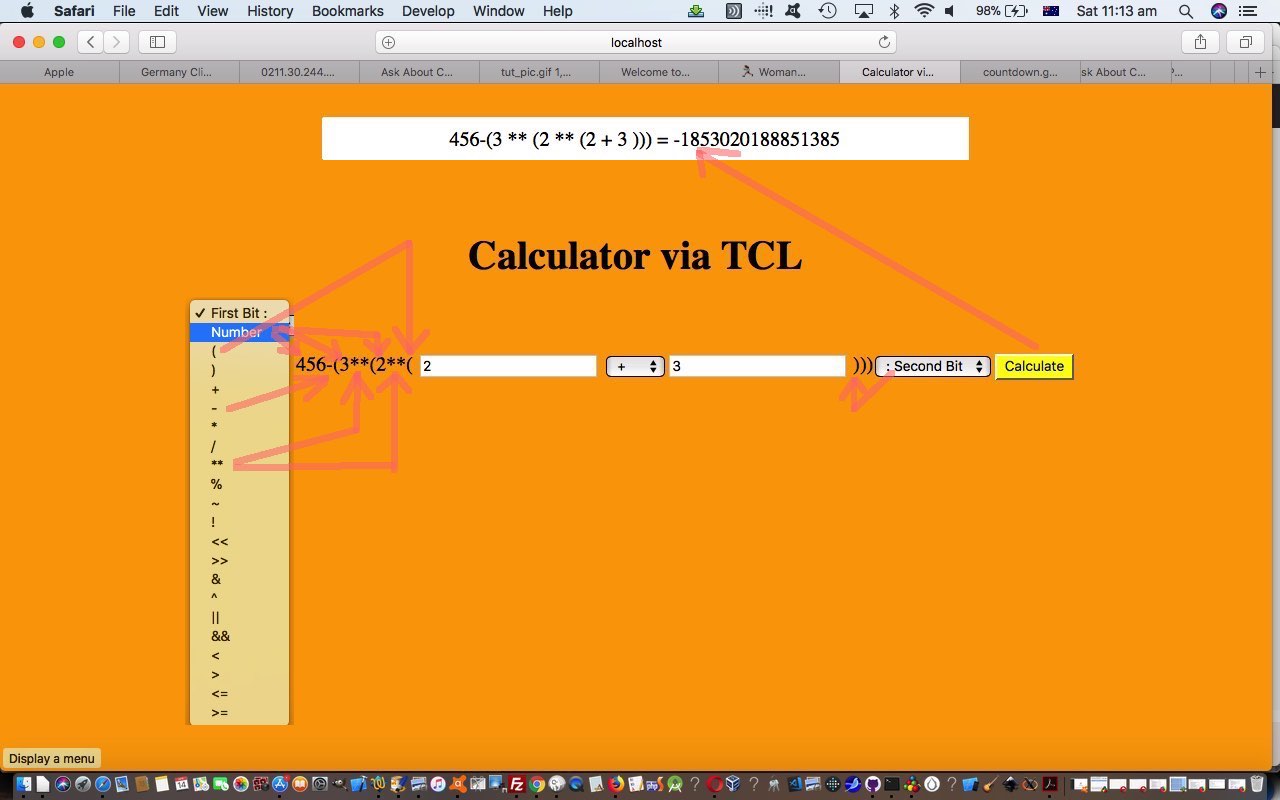
It’s a “blown mind” that has led me to involve Javascript to make the incarnation of our calculator of Tcl and PHP Calculator Tutorial allow for some round bracket functionality around the TCL (expr) “kernel” (sorry, Unix … my apologies LinusLinux). The nexus between what a user may enter, versus the hierarchy needs of TCL’s expr command just blew my mind, manperson!
So what did we turn to? Modernizing one’s thinking? We’re onto it? But we digress. Well, well.
We turned to Javascript’s eval function, not PHP’s eval, nor TCL’s eval version, thanks, but no thanks. Nevertheless … and didn’t you just know that “but” would be insulted by the paragraph above?! … use of Javascript eval (for round bracketing scenarios or operator hierarchy scenarios) is not the “cakewalk” that you may imagine. That is because …
6 ** 2 // in TCL "to the power of" operator syntax (which remains our web application display choice for the user) has ...

Math.pow(6, 2)  // Javascript equivalent (behind the scenes)
… so we need to cater for that possibility. The Javascript logic is called at the document.body onload event.
As we often do here, the “progression” of logic was to convert some “hardcoded” HTML text (specifically “First Number:” and “:Second Number”) into HTML select (dropdown) elements to the left and to the right (respectively) of the “TCL kernel”, with additional options for the round bracketing the user may want. These dropdowns move out to the edges of the webpage as they make room for user entered additions to the calculation complexity of what they want to calculate. The “Math.pow()” logic needed benefits from the event timing thoughts on the dropdown’s onchange event logic, otherwise you’d be doing that dreaded of all dreadeds, in many programmers’ worlds methinks, tracking back through entered “calculator equation” texts to discover when a numerical value becomes an operator, a horrible job when a minus sign can be either, for example. These same “horrible” programming tasks would have been at the fore to making a “TCL only backend solution” come to pass, we are sure, too.
Can you see from all this how well (clientside) Javascript works with (serverside) PHP? They are a very potent duo, because it is like two bites at the cherry, every time, with their different timings of the application of their logics.
The downloadable PHP source code calculator.php changed this way to achieve this extension of functionality still supervising an unchanged calculator.tcl TCL source code script, and here is a live run link for you to try this calculator for yourself.
Previous relevant Tcl and PHP Calculator Tutorial is shown below.
Tcl and PHP Calculator Tutorial
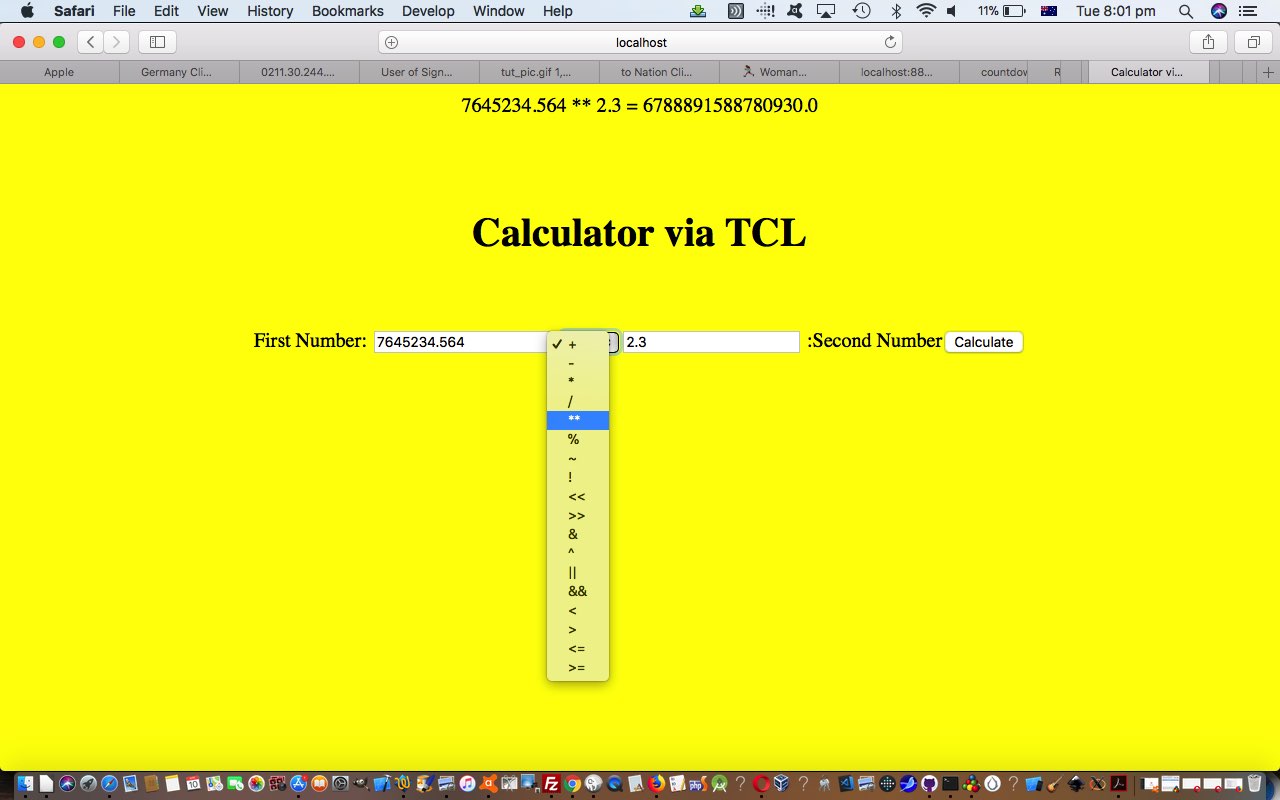
The Tcl and PHP Primer Tutorial was a foretaste to today’s calculator web application that …
exec("tclsh calculator.tcl < calculator.txt | tail -1 > calculator.out");
Crucial to the TCL’s backend role is TCL’s expr command, as a determinant regarding what today’s calculator is capable of.
Here is a link to some downloadable PHP source code calculator.php supervising calculator.tcl TCL source code, and here is a live run link.
Previous relevant Tcl and PHP Primer Tutorial … http://www.tcl.tk/software/tcltk/ is shown below.
Tcl and PHP Primer Tutorial ... http://www.tcl.tk/software/tcltk/
Have you heard of Tcl/Tk? Think maybe you could introduce yourself to it with Tcl/Tk So Brilliant (but where do you start?) Primer Tutorial as shown below.
The Tcl in Tcl/Tk refers to the scripting side of things, while the Tk is a GUI framework. On some (maybe lots) of Linux or unix web servers, such as the one for this domain here at www.rjmprogramming.com.au Tcl scripting is available and that means Tcl could be used by PHP, as a server side language to use the exec method to ask something of Tcl and get something back, half of which is the arrangement we’d like to have when feeding our babies.
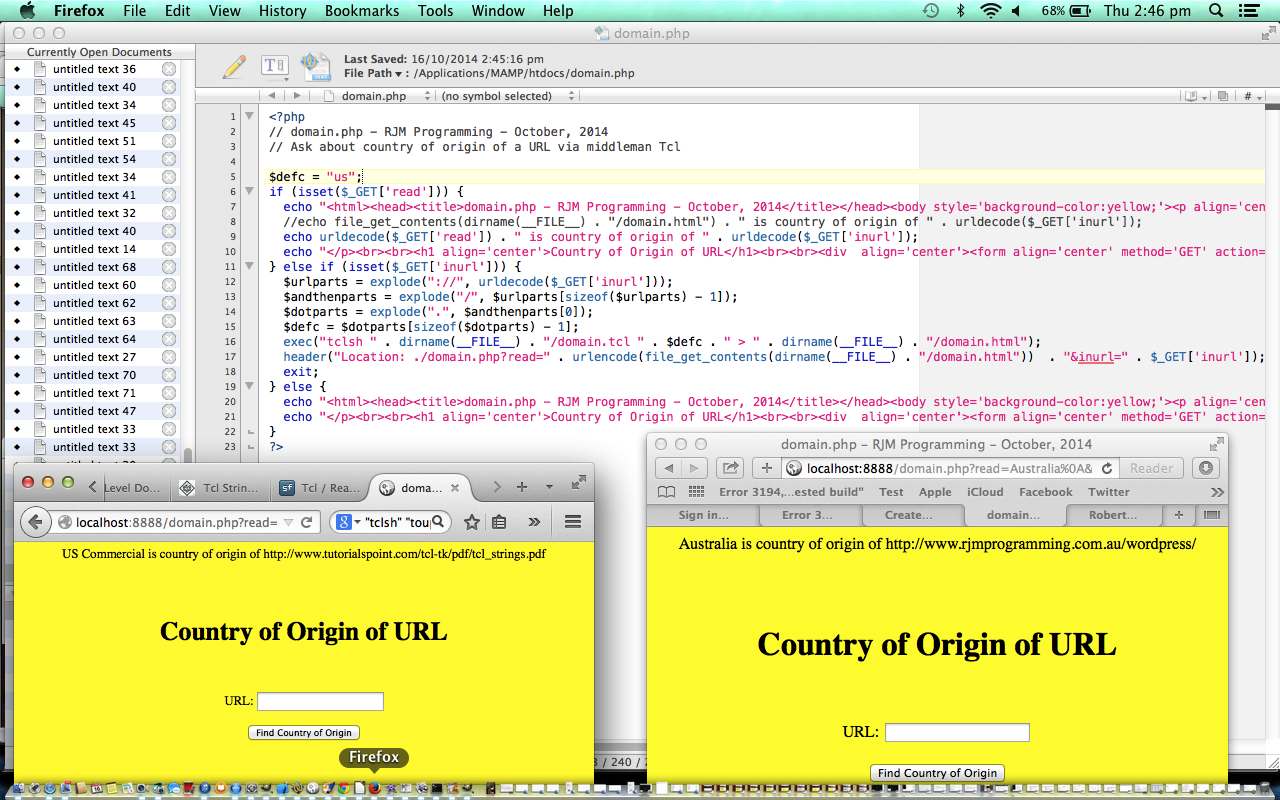
Today we write a webpage for finding the Country of Origin of a designated URL where PHP supervises Tcl:
Here is a link to some downloadable PHP source code domain.php supervising domain.tcl TCL source code, and here is a live run link.
Thanks to:
Previous relevant Tcl/Tk So Brilliant (but where do you start?) Primer Tutorial is shown below.
Tcl/Tk So Brilliant (but where do you start?) Primer Tutorial ... http://www.tcl.tk/software/tcltk/
Have you heard of Tcl/Tk?
Tcl/Tk is open source (based on a BSD-style license), so you can use it and modify it virtually any way you want, including for commercial uses.
With Tcl/Tk have used in conjunction with C++ and Python (look out for Tkinter).
Use it for Games Programming (it makes pretty cute GUIs … you may disagree?!) and it used to work back at Mac OS X 10.5.8/XCode 3.0 (am going to try Mac OS X 10.7.5 … any advice anywhere?) and had it going on Windows XP with Visual Studio Express as well. It has a lot of cross-platform strengths.
Think Tcl/Tk is really really good.
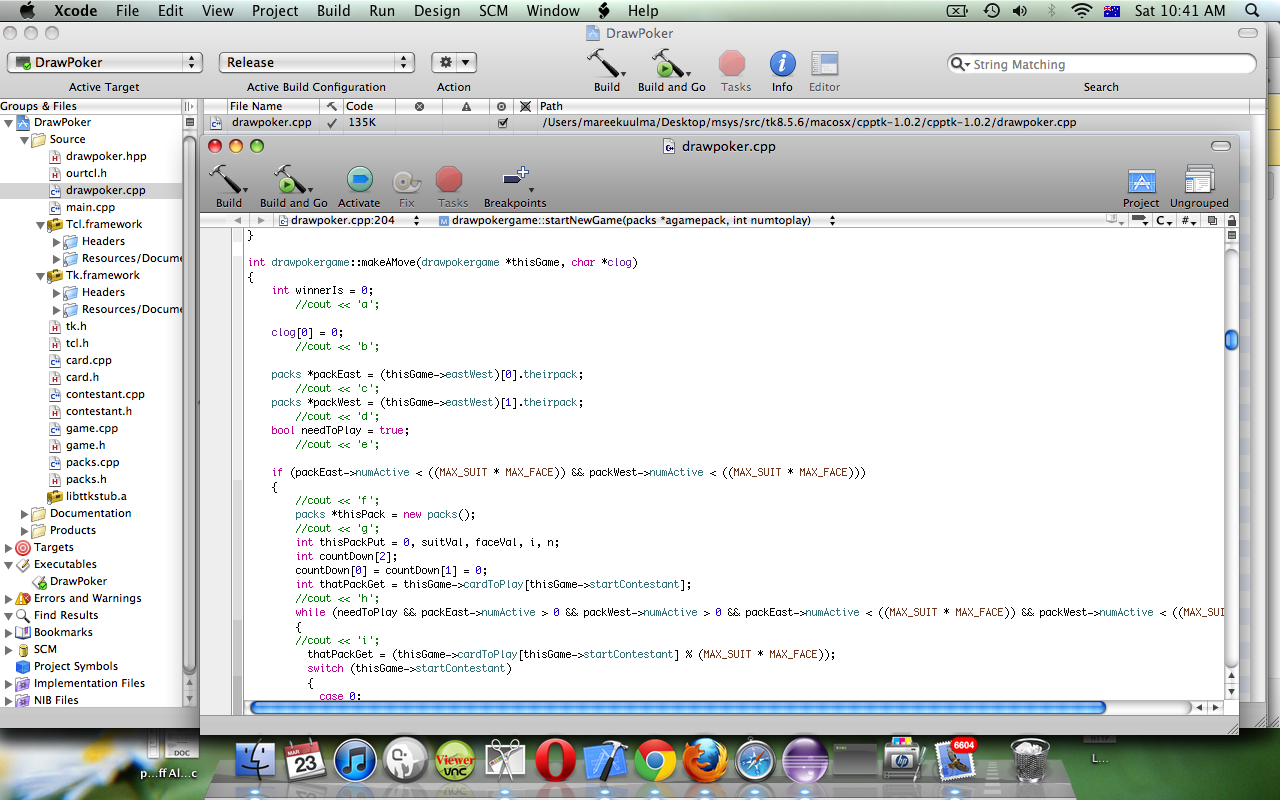
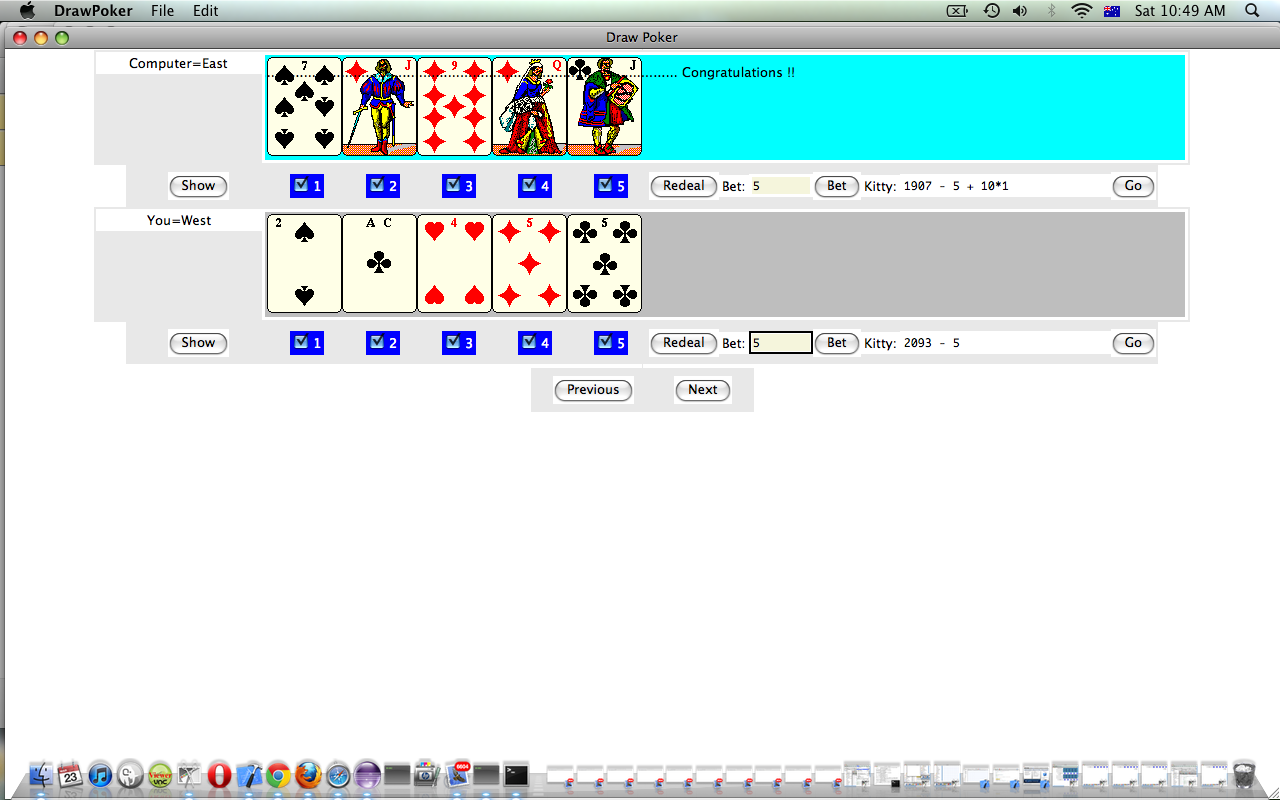
In this primer tutorial you can see a Draw Poker game as an XCode project, see it Build and in action, then see how to arrange for *.dmg Package Distribution via Package Manager.
Link to Tcl/Tk website … Home of Tcl/Tk … where quote up the top resides
Link to Tcl/Tk jobs done … Tcl/Tk jobs done … personal experience
If this was interesting you may be interested in this too.
If this was interesting you may be interested in this too.
If this was interesting you may be interested in this too.
If this was interesting you may be interested in this too.
If this was interesting you may be interested in this too.
If this was interesting you may be interested in this too.
WordPress Mobile Ontouchmove Event Tutorial
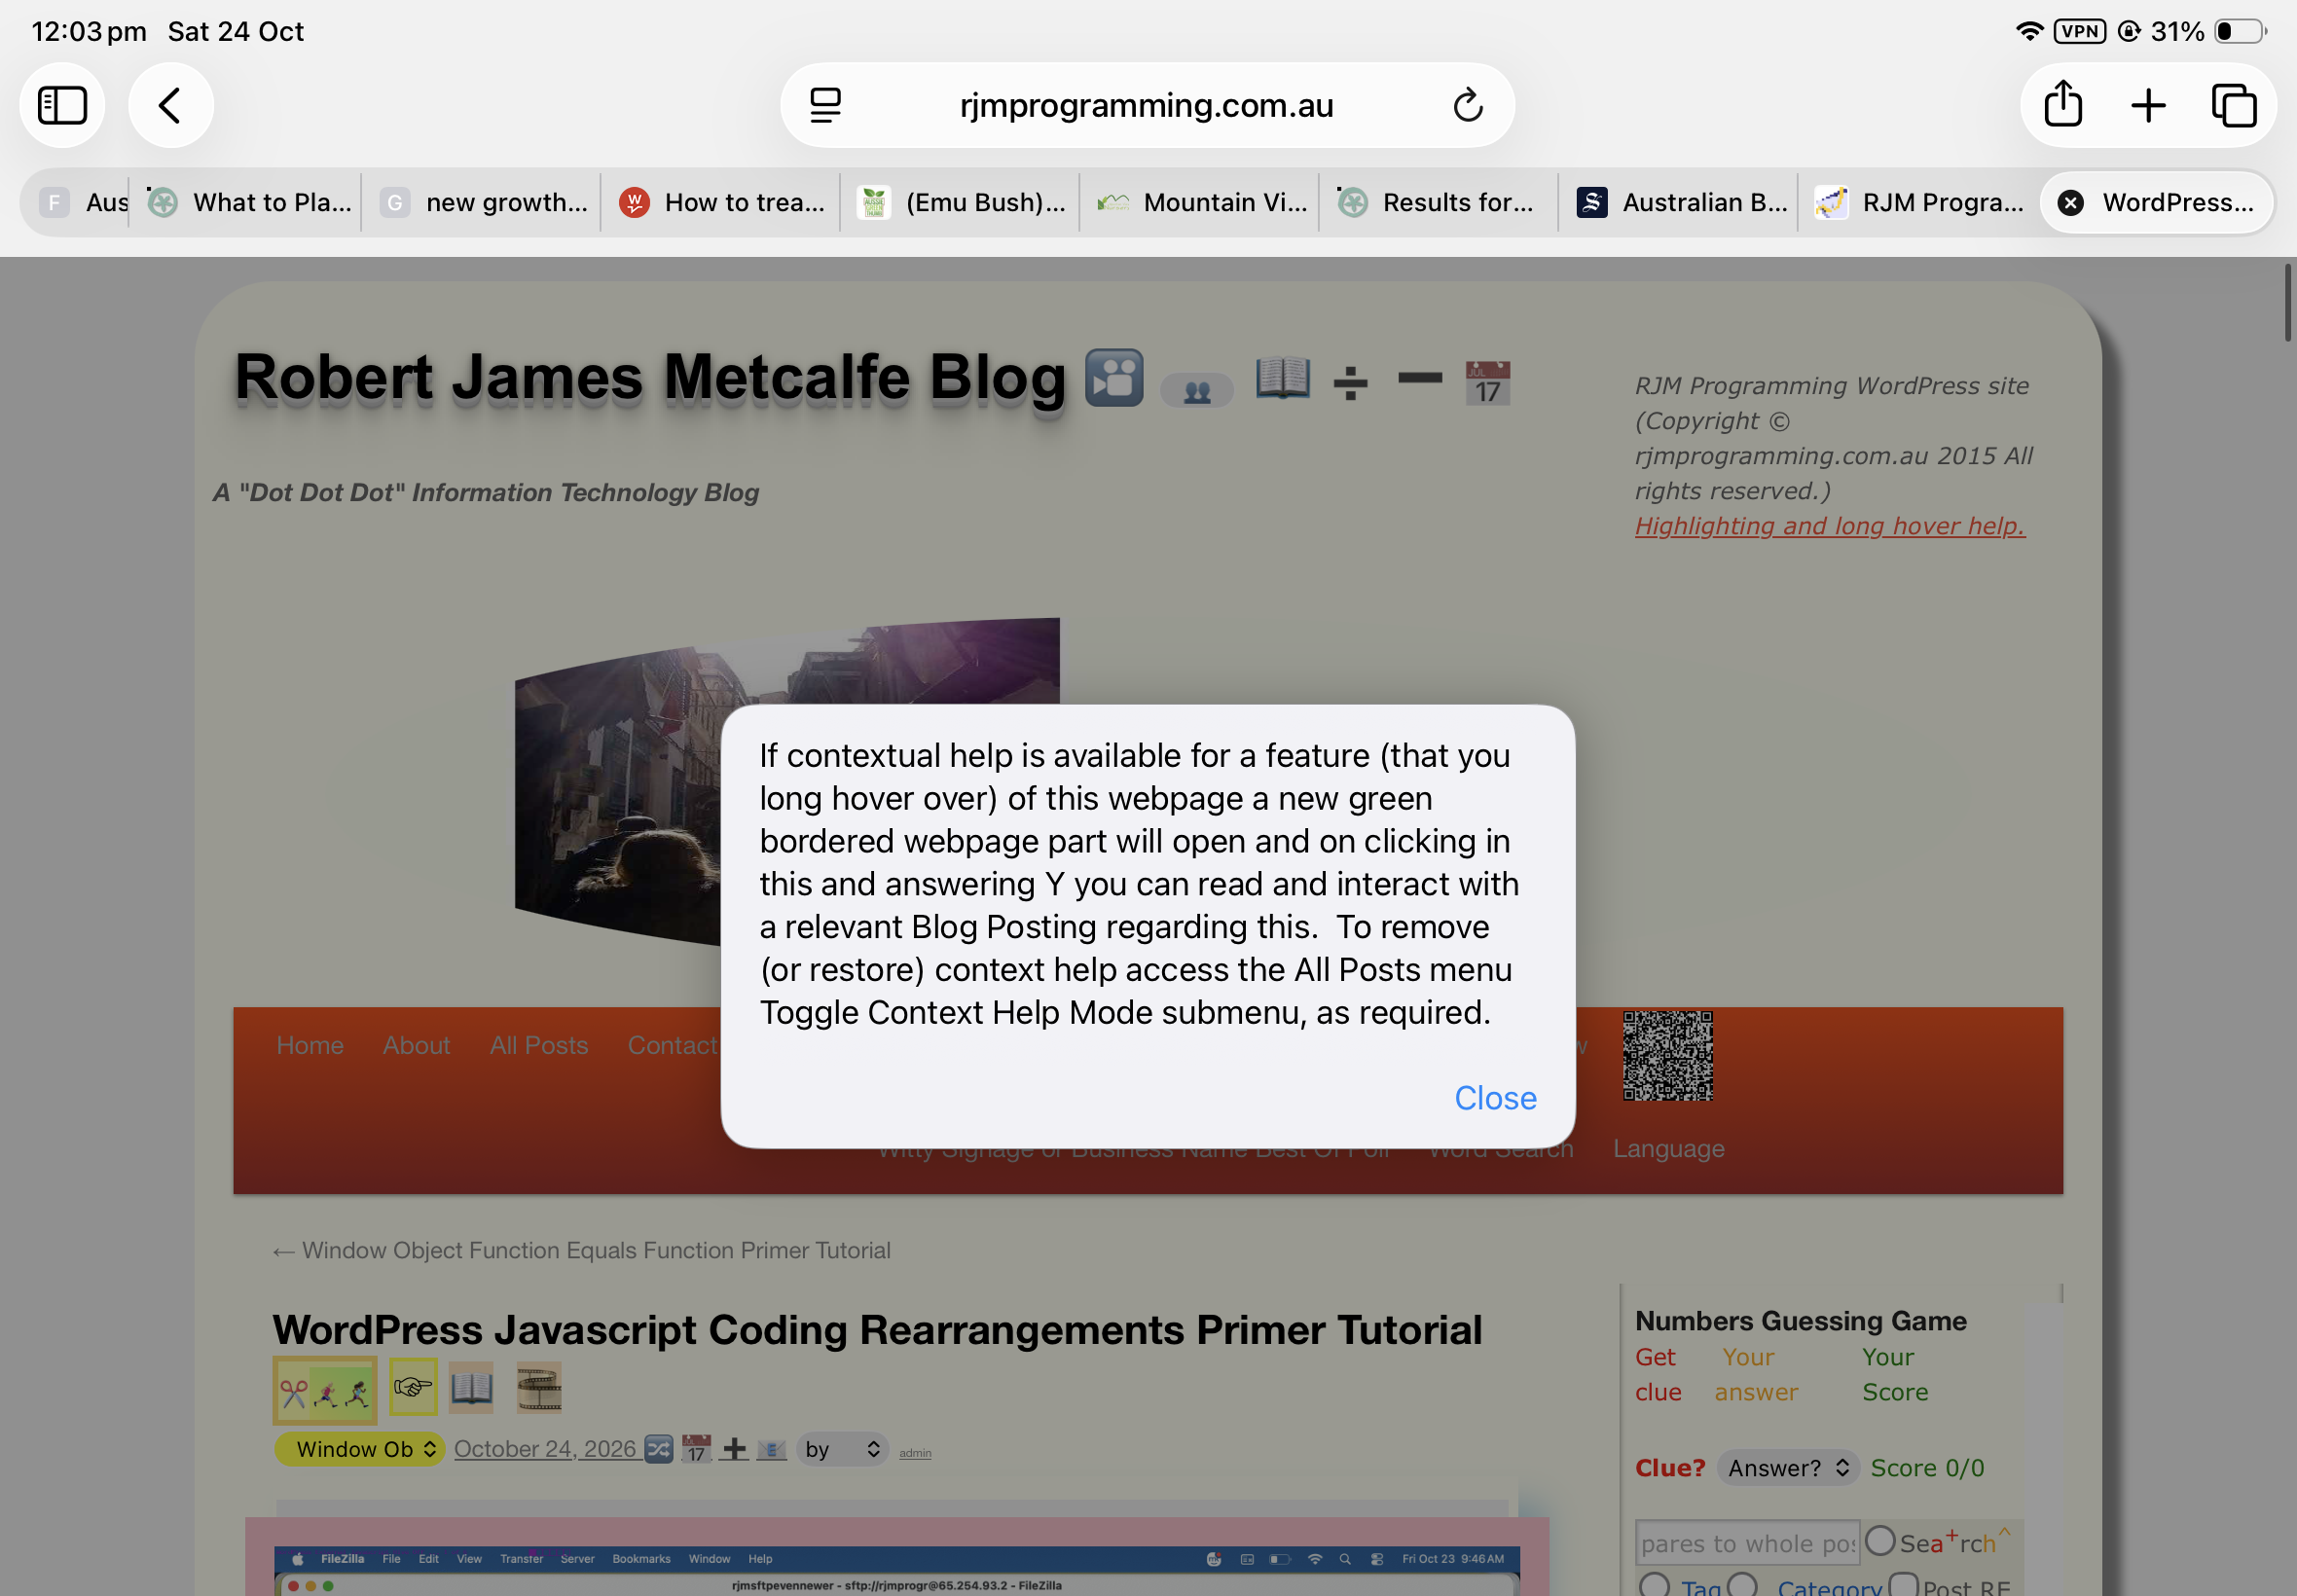
For a while now we’ve been trying out, on rarefied occasions, for mobile device usage, an …
ontouchmove="alert(this.title);"
… pared down idea, in an …
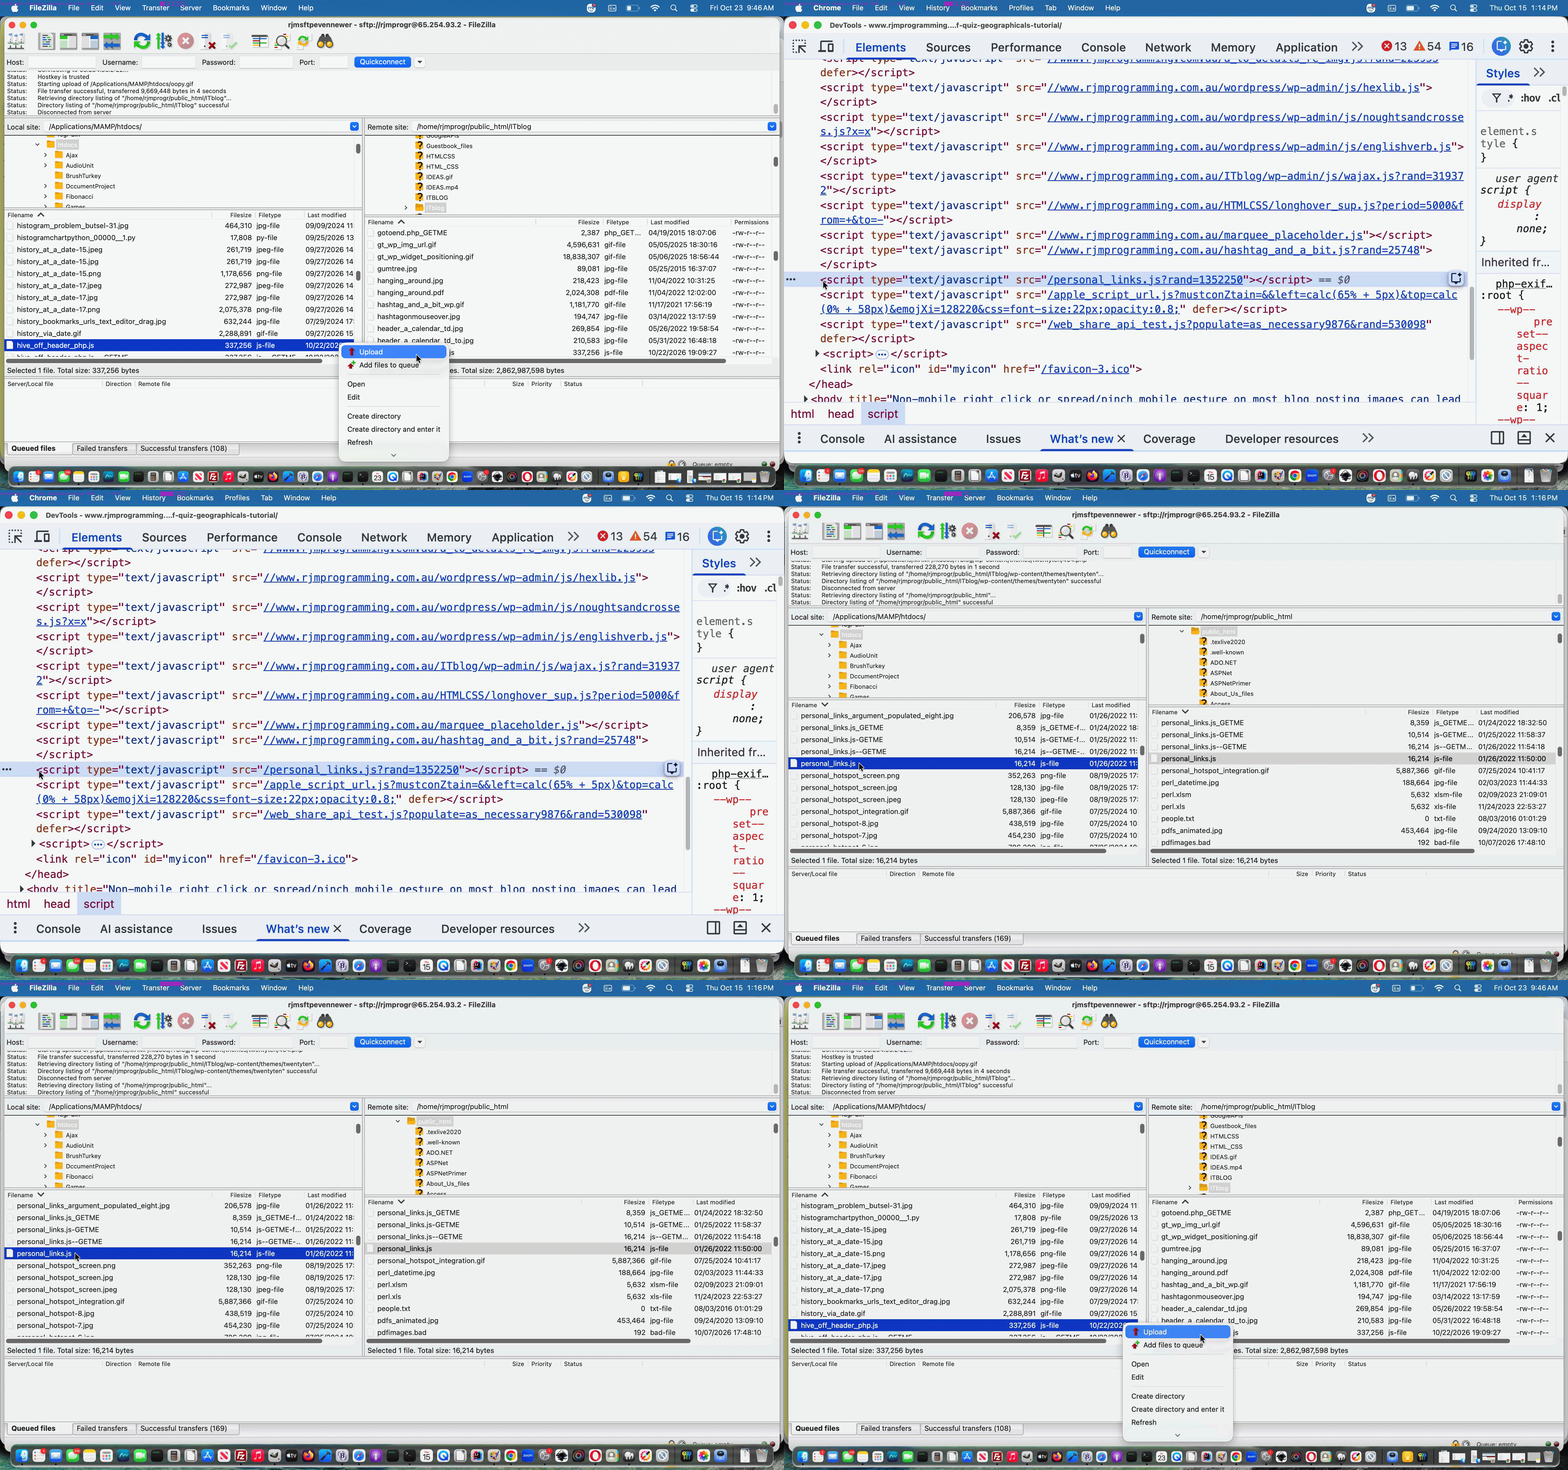
And because the second idea above will probably never be possible for mobile users, we have introduced into our nuanced ontouchmove=”alert(this.title);” idea changes for a lot of this WordPress blog’s webpages you are reading, a bit of what we’d say is “hand holding” in the new Javascript code, (similarly to the ways of WordPress Javascript Coding Rearrangements Primer Tutorial), as per the changed hive_off_header_php.js‘s “at document.body onload event” intervening …
  var lastelo=null;


  // New mobile ontouchmove idea ... October, 2026

  if (navigator.userAgent.match(/Android|BlackBerry|iPhone|iPad|iPod|Opera Mini|IEMobile/i) || eval(String.fromCharCode(32).trim() + navigator.maxTouchPoints) > 0) {

    var jhoare=0, khoare=0, ihoare=[], elthingos=['a','span', 'font', 'sup', 'sub', 'table', 'select', 'button', 'textarea', 'input', 'h1', 'h2', 'h3', 'h4', 'code', 'blockquote'];  // 'p',

    for (khoare=0; khoare<elthingos.length; khoare++) {

     ihoare=document.getElementsByTagName(elthingos[khoare]);

     for (jhoare=0; jhoare<ihoare.length; jhoare++) {

      if (('' + ihoare[jhoare].outerHTML).indexOf(' ontouchmove=') == -1 && ('' + ihoare[jhoare].outerHTML.split('>')[0]).replace(' title=""', '').replace(" title=''", "").indexOf(' title=') != -1) {

         ihoare[jhoare].ontouchmove=function(event){ otmalert(event); };

      } else if (elthingos[khoare] == 'a' && ('' + ihoare[jhoare].outerHTML.split('>')[0]).replace(' title=""', '').replace(" title=''", "").indexOf(' title=') == -1 && ('' + ihoare[jhoare].outerHTML.split('>')[0]).replace(' href=""', '').replace(" href=''", "").indexOf(' href=') != -1) {

         ihoare[jhoare].title='' + ihoare[jhoare].href;

         ihoare[jhoare].ontouchmove=function(event){ otmalert(event); };

      } else if (('' + ihoare[jhoare].outerHTML.split('>')[0]).replace(' title=""', '').replace(" title=''", "").indexOf(' title=') == -1 && ('' + ihoare[jhoare].outerHTML.split('>gt;')[0]).replace(' class=""', '').replace(" class=''", "").indexOf(' class=') != -1) {

         ihoare[jhoare].title='Class ' + ihoare[jhoare].className;

         ihoare[jhoare].ontouchmove=function(event){ otmalert(event); };

      }

     }

    }

  }
… where the mild “hand holding” occurs potentially creating “on the fly” title attributes occasionally to potentially provide more information to your more curious mobile user readers of this blog, who, behind the scenes, access the following new Javascript function …
  function otmalert(eloev) {

    eloev.stopPropagation();

    if (eloev.target != lastelo) {

      lastelo=eloev.target;

      if (('' + lastelo.title) != '') {

        alert(lastelo.title);

      }

    }

  }
… in their travels.
Oh, by the way, mobile users out there reading this blog, now “exploratory wiggling” is advisory!
Previous relevant WordPress Javascript Coding Rearrangements Primer Tutorial is shown below.
WordPress Javascript Coding Rearrangements Primer Tutorial
If you are a regular reader here reading yesterday’s Window Object Function Equals Function Primer Tutorial‘s …
… using (from within the clientside realms of the coding of this WordPress.org blog’s) Javascript …
… what might have zipped through your mind could have been the connecting phrase …
… from within good ol’ TwentyTen theme’s header.php …
… or somesuch. Because that has been what we normally do. Don’t get me wrong though, with the rearrangement idea blurb below, we could persist arranging it that way (and if the Javascript relies on PHP, we still do), but that recent Performance Review we last referenced with PHP MySql WordPress Blog Apache Restart Watchdog Tutorial got us to “see the light” somewhat and reorganize a bit regarding how Javascript code within this WordPress.org blog is organized. And so, read on.
Did you feel let down with PHP MySql WordPress Blog Performance PHP-FPM Configuration Tutorial when we said …
Codex loop.php WordPress error 404 event PHP Overuse of file_get_contents Rearrange use of file_get_contents …
passing more work to crontab/curl overnight run
… and did not go into more detail?! So were we, but we had to think on this a lot to flesh it out, and looked into the often used around here PHP function …
To our reckoning, until recently, we’d never tried PHP file_get_contents with more than one parameter. But, perhaps, it helps website bandwidth to start using those other parametersarguments (you say either, but we say neither … let’s call the whole thing off!)?
Within the 404.php (HTTP Error 404 “Not Found”) PHP file_get_contents calls what was being asked content wise included all that webpage Javascript written into good ol’ TwentyTen theme’s header.php … ouch regarding bandwidth! And so it led us to rearrange as per …
<script type='text/javascript' src='//www.rjmprogramming.com.au/ITblog/hive_off_header_php.js?rand=<?php echo rand(0,1986754); ?>'></script>
… to, we’re thinking …
$thisbpc=file_get_contents('http://www.rjmprogramming.com.au/ITblog/?p=' . $pnumis, FALSE, NULL, 0, 150000);
However, that is part one of two, to this part of the Performance Review. Part two will be explained in days to come.
Previous relevant Window Object Function Equals Function Primer Tutorial is shown below.
Window Object Function Equals Function Primer Tutorial
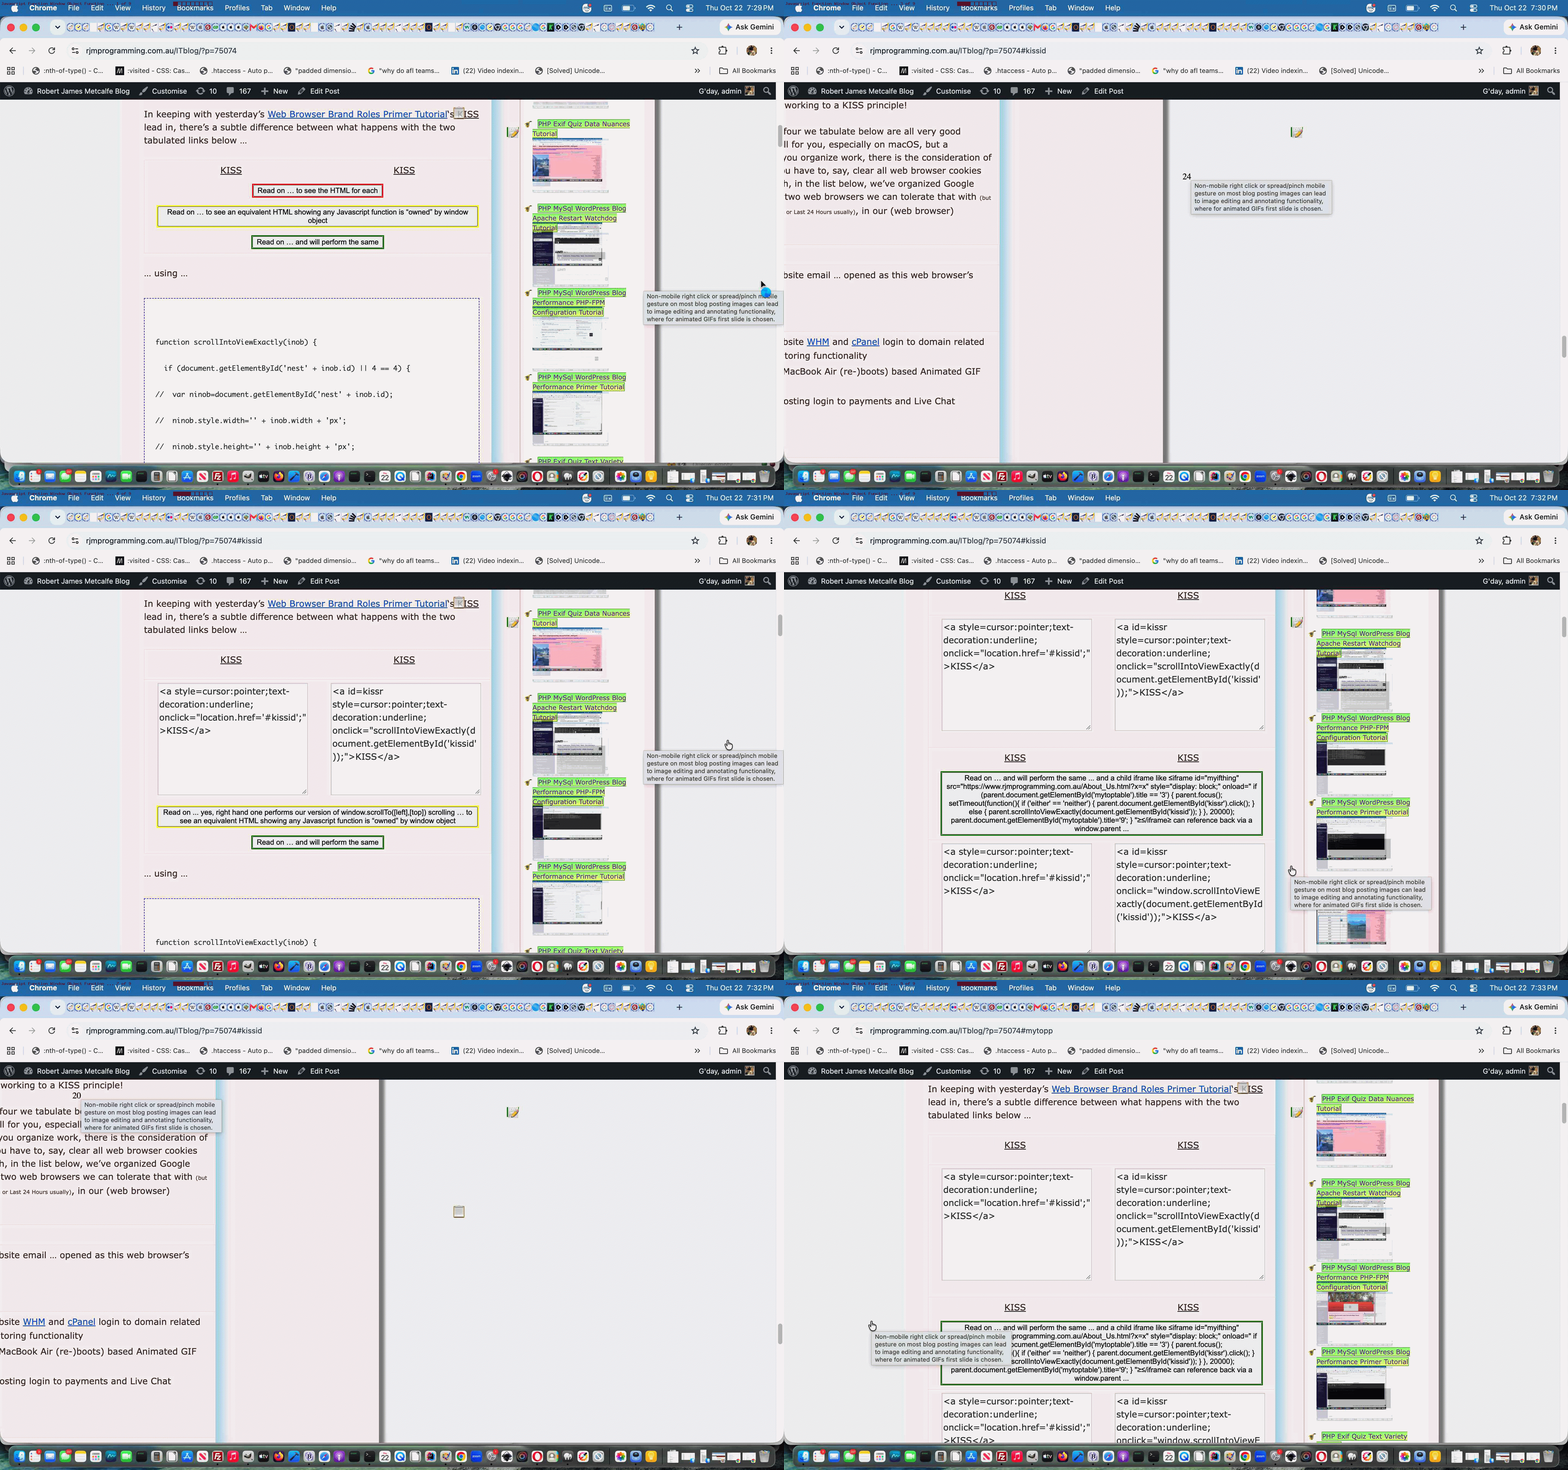
In keeping with yesterday’s Web Browser Brand Roles Primer Tutorial‘s KISS lead in, there’s a subtle difference between what happens with the two tabulated links below …
| KISS | KISS |
… using (from within the clientside realms of the coding of this WordPress.org blog’s) Javascript …
function scrollIntoViewExactly(inob) {

  if (document.getElementById('nest' + inob.id) || 4 == 4) {

//  var ninob=document.getElementById('nest' + inob.id);

//  ninob.style.width='' + inob.width + 'px';

//  ninob.style.height='' + inob.height + 'px';

  //inob.style.display='inline-block';

//  ninob.style.display='inline-block';

//  forceVerticalOverflow(ninob);

  //document.body.style.whiteSpace='nowrap';

//  document.body.style.overflow='scroll';// Safely sets horizontal scroll across all modern browsers

  var inobr=inob.getBoundingClientRect();

  //alert('' + inobr.width + ',' + inobr.height);

  //alert('' + document.body.scrollLeft);

  //alert('' + eval('' + inobr.left) + ',' + eval('' + inobr.top));

  //alert('{ left:' + Math.floor(eval('' + inobr.left) + eval('' + document.body.scrollLeft)) + ', top:' + Math.floor(eval('' + inobr.top) + eval('' + document.body.scrollTop)) +  ", behavior: 'smooth' }");

//  ninob.style.overflowX='scroll';

//  ninob.style.maxWidth='' + ninob.style.width;

  //inob.innerHTML+=' ';

  //ninob.style.maxHeight='200px';

//  ninob.style.overflowY='scroll';

//  alert(ninob.outerHTML);

  //var innardsare='{ left:' + Math.floor(eval('' + inobr.left) + eval('' + document.body.scrollLeft)) + ', top:' + Math.floor(eval('' + inobr.top) + eval('' + document.body.scrollTop)) + ", behavior: 'smooth' }";

  // left: Math.floor(eval('' + inobr.left) + eval('' + document.body.scrollLeft)),

  var ioffis=eval(eval(screen.width - eval('' + document.getElementById('content').getBoundingClientRect().width)) / 2);

  thenx=Math.floor(eval('' + inobr.left) + eval('' + document.body.scrollLeft) + eval('' + document.body.offsetLeft) + ioffis);

  const innardsare = {

   top: eval(120 + Math.floor(eval('' + inobr.top) + eval('' + document.body.scrollTop))),

   behavior: 'smooth'

  };

  const xinnardsare = {

   left: Math.floor(eval('' + inobr.left) + eval('' + document.body.scrollLeft) + eval('' + document.body.offsetLeft) + ioffis),

   behavior: 'auto'

  };

  if (7 == 7) {

  location.href='#' + inob.id;

  } else {

//  alert(isScrollable(ninob));

  forceVerticalOverflow(document.body);

  //alert(isScrollable(document.body));

  //alert(innardsare);

  window.scrollTo(innardsare);

  //alert(Math.floor(eval('' + inobr.left) + eval('' + document.body.scrollLeft)));

  //setTimeout(function(){ document.body.style.overflowX = 'auto';  document.body.scrollBy(xinnardsare); }, 8000);

  //setTimeout(function(){ alert(thenx); document.scrollingElement.scrollLeft='' + thenx + ''; }, 8000);

  }

  setTimeout(function(){

  //document.body.overflowX='scroll';

  document.body.style.cursor='progress';

  document.body.style.marginLeft='-' + thenx + 'px'; //inob.scrollLeft=thenx;

  inob.setAttribute('data-cb', '25');

  setTimeout(countback, 1000);

  setTimeout(function(){

  document.body.style.cursor='pointer';

  document.body.style.marginLeft='0px'; //inob.scrollLeft=thenx;

  }, 25000);

  }, 1000);

  if (3 == 5) {

  setTimeout(function(){

  //document.body.style.whiteSpace='nowrap';

  //document.body.style.overflow='scroll';// Safely sets horizontal scroll across all modern browsers

if (document.scrollingElement) {

    document.scrollingElement.scrollLeft = thenx;

} else {

    // Fallback for older browsers

    document.documentElement.scrollLeft = thenx;

    document.body.scrollLeft = thenx;

}

  }, 5000);

  }

  } else {

  window.scrollIntoView(inob);

  }

}
Previous relevant Web Browser Brand Roles Primer Tutorial is shown below.
Web Browser Brand Roles Primer Tutorial
With a job, the day to day organization can be important, and is likely to be crucial to achieving goals.
We spend a lot of time around web browser applications, being into I.T. and creating web applications, in particular.
We’ve organized macOS MacBook Air usage mainly, around one major disk folder and four brands of web browser, the folder being, for us is …
/Applications/MAMP/htdocs
Huh?! Well, being into PHP as our “all things server” programming language, and having installed (many versions) of MAMP, as our Apache/PHP/MySql local web server brand of choice, and by default /Applications/MAMP/htdocs is MAMP’s Document Root (and defaulting to port 8888) corresponding to URL …
http://localhost:8888
Even with compiling language work, we’ll often use subfolders off /Applications/MAMP/htdocs … working to a KISS principle!
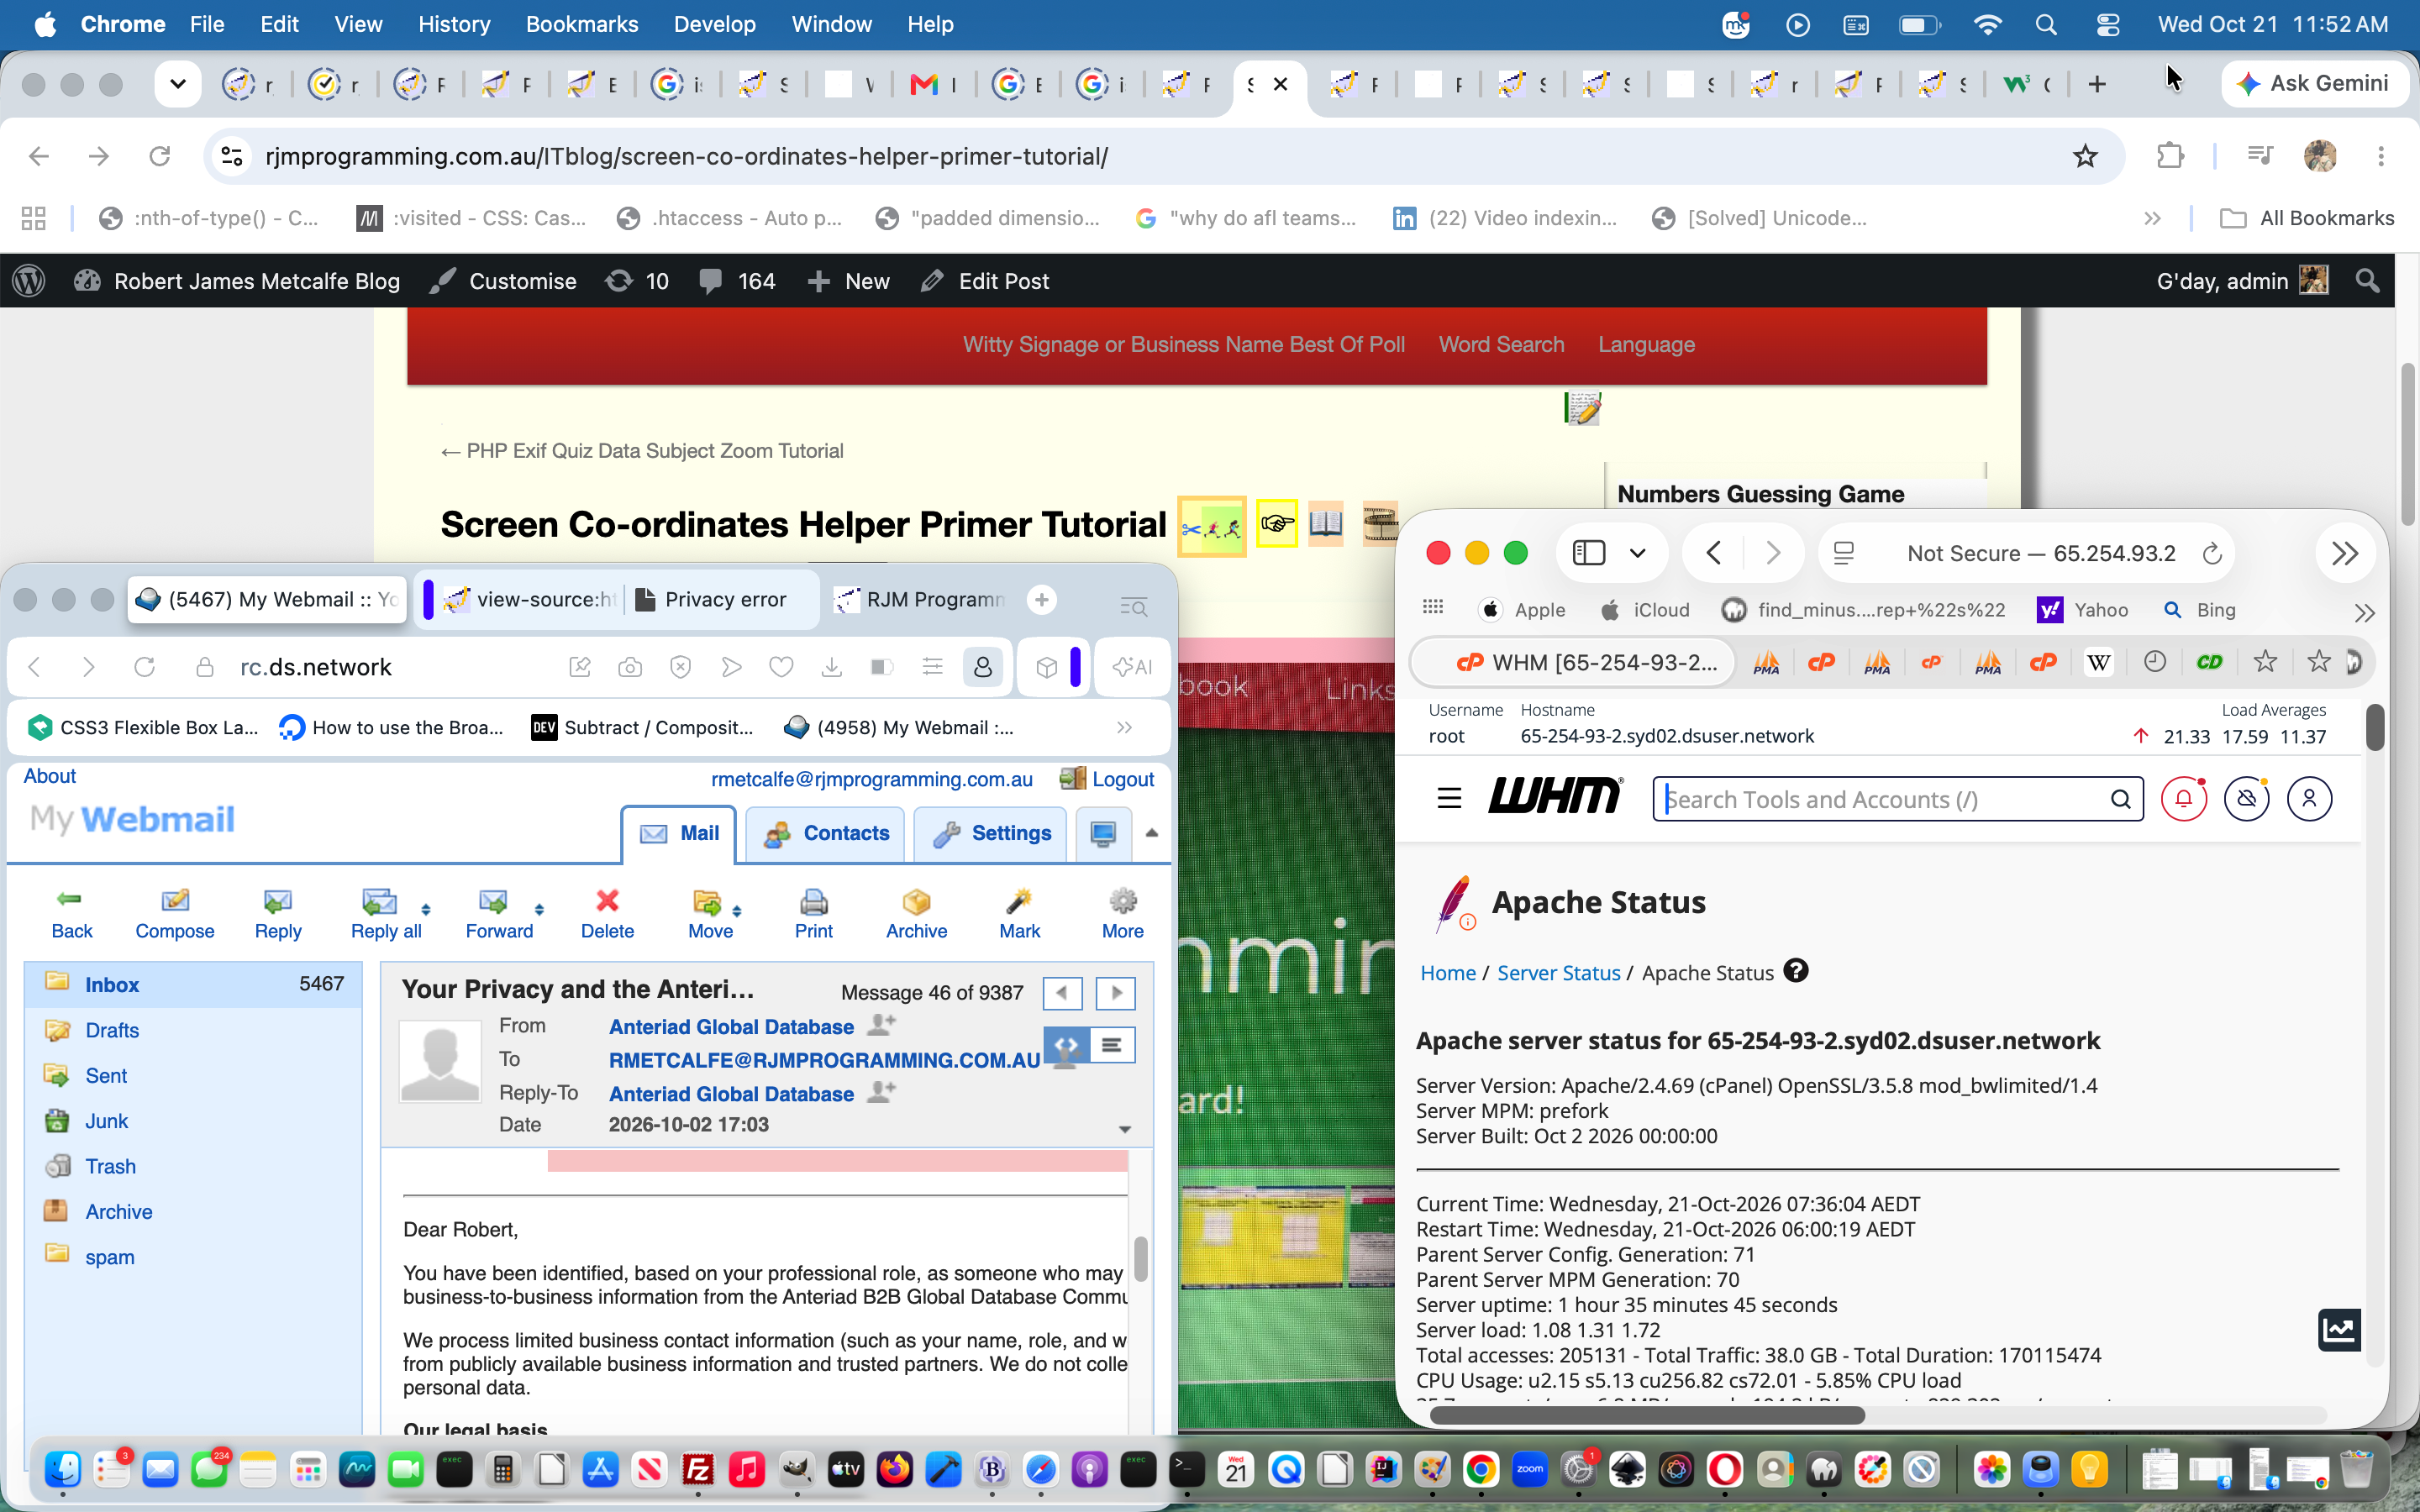
Turning to web browsers, the four we tabulate below are all very good products, and can all work well for you, especially on macOS, but a consideration to do with how you organize work, there is the consideration of what work life will be like if you have to, say, clear all web browser cookies and data, for instance. As such, in the list below, we’ve organized Google Chrome and/or Firefox as the two web browsers we can tolerate that with (but prefer to just clear Last Hour or Last 15 Minutes or Last 24 Hours usually), in our (web browser) Organization Table below …
| Opera |
|---|
|
| Safari |
|
| Firefox |
|
| Google Chrome |
|
When there are jobs requiring command line needing to be seen next to a web browser rendition, macOS Terminal application windows can easily be arranged to not overlap any web browser brand window from the list above.
Screenshots on macOS have moved on from good ol’ Grab with the very easy keyboard shortcut …
control-command-shift-3
… working really well with good ol’ macOS version of PaintBrush‘s File->New from Clipboard functionality. Preview is good for PDF creation and compilation functionality. Gimp is good for blurring and other filtering requirements.
More and more we’ll use AirDrop to transfer from iPad or iPhone to the macOS MacBook Air, or use that iOS device’s Mail sharing option to download to the macOS MacBook Air Downloads folder usually, and then, usually, this will be copied to good ol’ /Applications/MAMP/htdocs (or a subfolder off this, especially if what is copied is a *.zip file (extracted)).
Crontab on the macOS MacBook Air has an “every minute” check of good ol’ /Applications/MAMP/htdocs changed (within last minute) *.png (primarily coming out of Paintbrush File->Save As… functionality) or *.[Hh][Ee][Ii][Cc] (off iPhone or iPad Camera app usage) ready for (PHP calling of) ImageMagick‘s convertion to versions of *.[Jj][Pp]*[Gg] images.
Uploads to (and downloads from) the RJM Programming domain are all conducted via sftp connections using the FileZilla macOS desktop application.
TextWrangler is our favourite text editor by a very large margin!
If this was interesting you may be interested in this too.
If this was interesting you may be interested in this too.
If this was interesting you may be interested in this too.
If this was interesting you may be interested in this too.
WordPress Javascript Coding Rearrangements Primer Tutorial
If you are a regular reader here reading yesterday’s Window Object Function Equals Function Primer Tutorial‘s …
… using (from within the clientside realms of the coding of this WordPress.org blog’s) Javascript …
… what might have zipped through your mind could have been the connecting phrase …
… from within good ol’ TwentyTen theme’s header.php …
… or somesuch. Because that has been what we normally do. Don’t get me wrong though, with the rearrangement idea blurb below, we could persist arranging it that way (and if the Javascript relies on PHP, we still do), but that recent Performance Review we last referenced with PHP MySql WordPress Blog Apache Restart Watchdog Tutorial got us to “see the light” somewhat and reorganize a bit regarding how Javascript code within this WordPress.org blog is organized. And so, read on.
Did you feel let down with PHP MySql WordPress Blog Performance PHP-FPM Configuration Tutorial when we said …
Codex loop.php WordPress error 404 event PHP Overuse of file_get_contents Rearrange use of file_get_contents …
passing more work to crontab/curl overnight run
… and did not go into more detail?! So were we, but we had to think on this a lot to flesh it out, and looked into the often used around here PHP function …
To our reckoning, until recently, we’d never tried PHP file_get_contents with more than one parameter. But, perhaps, it helps website bandwidth to start using those other parametersarguments (you say either, but we say neither … let’s call the whole thing off!)?
Within the 404.php (HTTP Error 404 “Not Found”) PHP file_get_contents calls what was being asked content wise included all that webpage Javascript written into good ol’ TwentyTen theme’s header.php … ouch regarding bandwidth! And so it led us to rearrange as per …
<script type='text/javascript' src='//www.rjmprogramming.com.au/ITblog/hive_off_header_php.js?rand=<?php echo rand(0,1986754); ?>'></script>
… to, we’re thinking …
$thisbpc=file_get_contents('http://www.rjmprogramming.com.au/ITblog/?p=' . $pnumis, FALSE, NULL, 0, 150000);
However, that is part one of two, to this part of the Performance Review. Part two will be explained in days to come.
Previous relevant Window Object Function Equals Function Primer Tutorial is shown below.
Window Object Function Equals Function Primer Tutorial
In keeping with yesterday’s Web Browser Brand Roles Primer Tutorial‘s KISS lead in, there’s a subtle difference between what happens with the two tabulated links below …
| KISS | KISS |
… using (from within the clientside realms of the coding of this WordPress.org blog’s) Javascript …
function scrollIntoViewExactly(inob) {

  if (document.getElementById('nest' + inob.id) || 4 == 4) {

//  var ninob=document.getElementById('nest' + inob.id);

//  ninob.style.width='' + inob.width + 'px';

//  ninob.style.height='' + inob.height + 'px';

  //inob.style.display='inline-block';

//  ninob.style.display='inline-block';

//  forceVerticalOverflow(ninob);

  //document.body.style.whiteSpace='nowrap';

//  document.body.style.overflow='scroll';// Safely sets horizontal scroll across all modern browsers

  var inobr=inob.getBoundingClientRect();

  //alert('' + inobr.width + ',' + inobr.height);

  //alert('' + document.body.scrollLeft);

  //alert('' + eval('' + inobr.left) + ',' + eval('' + inobr.top));

  //alert('{ left:' + Math.floor(eval('' + inobr.left) + eval('' + document.body.scrollLeft)) + ', top:' + Math.floor(eval('' + inobr.top) + eval('' + document.body.scrollTop)) +  ", behavior: 'smooth' }");

//  ninob.style.overflowX='scroll';

//  ninob.style.maxWidth='' + ninob.style.width;

  //inob.innerHTML+=' ';

  //ninob.style.maxHeight='200px';

//  ninob.style.overflowY='scroll';

//  alert(ninob.outerHTML);

  //var innardsare='{ left:' + Math.floor(eval('' + inobr.left) + eval('' + document.body.scrollLeft)) + ', top:' + Math.floor(eval('' + inobr.top) + eval('' + document.body.scrollTop)) + ", behavior: 'smooth' }";

  // left: Math.floor(eval('' + inobr.left) + eval('' + document.body.scrollLeft)),

  var ioffis=eval(eval(screen.width - eval('' + document.getElementById('content').getBoundingClientRect().width)) / 2);

  thenx=Math.floor(eval('' + inobr.left) + eval('' + document.body.scrollLeft) + eval('' + document.body.offsetLeft) + ioffis);

  const innardsare = {

   top: eval(120 + Math.floor(eval('' + inobr.top) + eval('' + document.body.scrollTop))),

   behavior: 'smooth'

  };

  const xinnardsare = {

   left: Math.floor(eval('' + inobr.left) + eval('' + document.body.scrollLeft) + eval('' + document.body.offsetLeft) + ioffis),

   behavior: 'auto'

  };

  if (7 == 7) {

  location.href='#' + inob.id;

  } else {

//  alert(isScrollable(ninob));

  forceVerticalOverflow(document.body);

  //alert(isScrollable(document.body));

  //alert(innardsare);

  window.scrollTo(innardsare);

  //alert(Math.floor(eval('' + inobr.left) + eval('' + document.body.scrollLeft)));

  //setTimeout(function(){ document.body.style.overflowX = 'auto';  document.body.scrollBy(xinnardsare); }, 8000);

  //setTimeout(function(){ alert(thenx); document.scrollingElement.scrollLeft='' + thenx + ''; }, 8000);

  }

  setTimeout(function(){

  //document.body.overflowX='scroll';

  document.body.style.cursor='progress';

  document.body.style.marginLeft='-' + thenx + 'px'; //inob.scrollLeft=thenx;

  inob.setAttribute('data-cb', '25');

  setTimeout(countback, 1000);

  setTimeout(function(){

  document.body.style.cursor='pointer';

  document.body.style.marginLeft='0px'; //inob.scrollLeft=thenx;

  }, 25000);

  }, 1000);

  if (3 == 5) {

  setTimeout(function(){

  //document.body.style.whiteSpace='nowrap';

  //document.body.style.overflow='scroll';// Safely sets horizontal scroll across all modern browsers

if (document.scrollingElement) {

    document.scrollingElement.scrollLeft = thenx;

} else {

    // Fallback for older browsers

    document.documentElement.scrollLeft = thenx;

    document.body.scrollLeft = thenx;

}

  }, 5000);

  }

  } else {

  window.scrollIntoView(inob);

  }

}
Previous relevant Web Browser Brand Roles Primer Tutorial is shown below.
Web Browser Brand Roles Primer Tutorial
With a job, the day to day organization can be important, and is likely to be crucial to achieving goals.
We spend a lot of time around web browser applications, being into I.T. and creating web applications, in particular.
We’ve organized macOS MacBook Air usage mainly, around one major disk folder and four brands of web browser, the folder being, for us is …
/Applications/MAMP/htdocs
Huh?! Well, being into PHP as our “all things server” programming language, and having installed (many versions) of MAMP, as our Apache/PHP/MySql local web server brand of choice, and by default /Applications/MAMP/htdocs is MAMP’s Document Root (and defaulting to port 8888) corresponding to URL …
http://localhost:8888
Even with compiling language work, we’ll often use subfolders off /Applications/MAMP/htdocs … working to a KISS principle!
Turning to web browsers, the four we tabulate below are all very good products, and can all work well for you, especially on macOS, but a consideration to do with how you organize work, there is the consideration of what work life will be like if you have to, say, clear all web browser cookies and data, for instance. As such, in the list below, we’ve organized Google Chrome and/or Firefox as the two web browsers we can tolerate that with (but prefer to just clear Last Hour or Last 15 Minutes or Last 24 Hours usually), in our (web browser) Organization Table below …
| Opera |
|---|
|
| Safari |
|
| Firefox |
|
| Google Chrome |
|
When there are jobs requiring command line needing to be seen next to a web browser rendition, macOS Terminal application windows can easily be arranged to not overlap any web browser brand window from the list above.
Screenshots on macOS have moved on from good ol’ Grab with the very easy keyboard shortcut …
control-command-shift-3
… working really well with good ol’ macOS version of PaintBrush‘s File->New from Clipboard functionality. Preview is good for PDF creation and compilation functionality. Gimp is good for blurring and other filtering requirements.
More and more we’ll use AirDrop to transfer from iPad or iPhone to the macOS MacBook Air, or use that iOS device’s Mail sharing option to download to the macOS MacBook Air Downloads folder usually, and then, usually, this will be copied to good ol’ /Applications/MAMP/htdocs (or a subfolder off this, especially if what is copied is a *.zip file (extracted)).
Crontab on the macOS MacBook Air has an “every minute” check of good ol’ /Applications/MAMP/htdocs changed (within last minute) *.png (primarily coming out of Paintbrush File->Save As… functionality) or *.[Hh][Ee][Ii][Cc] (off iPhone or iPad Camera app usage) ready for (PHP calling of) ImageMagick‘s convertion to versions of *.[Jj][Pp]*[Gg] images.
Uploads to (and downloads from) the RJM Programming domain are all conducted via sftp connections using the FileZilla macOS desktop application.
TextWrangler is our favourite text editor by a very large margin!
If this was interesting you may be interested in this too.
If this was interesting you may be interested in this too.
If this was interesting you may be interested in this too.
Window Object Function Equals Function Primer Tutorial
In keeping with yesterday’s Web Browser Brand Roles Primer Tutorial‘s KISS lead in, there’s a subtle difference between what happens with the two tabulated links below …
| KISS | KISS |
… using (from within the clientside realms of the coding of this WordPress.org blog’s) Javascript …
function scrollIntoViewExactly(inob) {

  if (document.getElementById('nest' + inob.id) || 4 == 4) {

//  var ninob=document.getElementById('nest' + inob.id);

//  ninob.style.width='' + inob.width + 'px';

//  ninob.style.height='' + inob.height + 'px';

  //inob.style.display='inline-block';

//  ninob.style.display='inline-block';

//  forceVerticalOverflow(ninob);

  //document.body.style.whiteSpace='nowrap';

//  document.body.style.overflow='scroll';// Safely sets horizontal scroll across all modern browsers

  var inobr=inob.getBoundingClientRect();

  //alert('' + inobr.width + ',' + inobr.height);

  //alert('' + document.body.scrollLeft);

  //alert('' + eval('' + inobr.left) + ',' + eval('' + inobr.top));

  //alert('{ left:' + Math.floor(eval('' + inobr.left) + eval('' + document.body.scrollLeft)) + ', top:' + Math.floor(eval('' + inobr.top) + eval('' + document.body.scrollTop)) +  ", behavior: 'smooth' }");

//  ninob.style.overflowX='scroll';

//  ninob.style.maxWidth='' + ninob.style.width;

  //inob.innerHTML+=' ';

  //ninob.style.maxHeight='200px';

//  ninob.style.overflowY='scroll';

//  alert(ninob.outerHTML);

  //var innardsare='{ left:' + Math.floor(eval('' + inobr.left) + eval('' + document.body.scrollLeft)) + ', top:' + Math.floor(eval('' + inobr.top) + eval('' + document.body.scrollTop)) + ", behavior: 'smooth' }";

  // left: Math.floor(eval('' + inobr.left) + eval('' + document.body.scrollLeft)),

  var ioffis=eval(eval(screen.width - eval('' + document.getElementById('content').getBoundingClientRect().width)) / 2);

  thenx=Math.floor(eval('' + inobr.left) + eval('' + document.body.scrollLeft) + eval('' + document.body.offsetLeft) + ioffis);

  const innardsare = {

   top: eval(120 + Math.floor(eval('' + inobr.top) + eval('' + document.body.scrollTop))),

   behavior: 'smooth'

  };

  const xinnardsare = {

   left: Math.floor(eval('' + inobr.left) + eval('' + document.body.scrollLeft) + eval('' + document.body.offsetLeft) + ioffis),

   behavior: 'auto'

  };

  if (7 == 7) {

  location.href='#' + inob.id;

  } else {

//  alert(isScrollable(ninob));

  forceVerticalOverflow(document.body);

  //alert(isScrollable(document.body));

  //alert(innardsare);

  window.scrollTo(innardsare);

  //alert(Math.floor(eval('' + inobr.left) + eval('' + document.body.scrollLeft)));

  //setTimeout(function(){ document.body.style.overflowX = 'auto';  document.body.scrollBy(xinnardsare); }, 8000);

  //setTimeout(function(){ alert(thenx); document.scrollingElement.scrollLeft='' + thenx + ''; }, 8000);

  }

  setTimeout(function(){

  //document.body.overflowX='scroll';

  document.body.style.cursor='progress';

  document.body.style.marginLeft='-' + thenx + 'px'; //inob.scrollLeft=thenx;

  inob.setAttribute('data-cb', '25');

  setTimeout(countback, 1000);

  setTimeout(function(){

  document.body.style.cursor='pointer';

  document.body.style.marginLeft='0px'; //inob.scrollLeft=thenx;

  }, 25000);

  }, 1000);

  if (3 == 5) {

  setTimeout(function(){

  //document.body.style.whiteSpace='nowrap';

  //document.body.style.overflow='scroll';// Safely sets horizontal scroll across all modern browsers

if (document.scrollingElement) {

    document.scrollingElement.scrollLeft = thenx;

} else {

    // Fallback for older browsers

    document.documentElement.scrollLeft = thenx;

    document.body.scrollLeft = thenx;

}

  }, 5000);

  }

  } else {

  window.scrollIntoView(inob);

  }

}
Previous relevant Web Browser Brand Roles Primer Tutorial is shown below.
Web Browser Brand Roles Primer Tutorial
With a job, the day to day organization can be important, and is likely to be crucial to achieving goals.
We spend a lot of time around web browser applications, being into I.T. and creating web applications, in particular.
We’ve organized macOS MacBook Air usage mainly, around one major disk folder and four brands of web browser, the folder being, for us is …
/Applications/MAMP/htdocs
Huh?! Well, being into PHP as our “all things server” programming language, and having installed (many versions) of MAMP, as our Apache/PHP/MySql local web server brand of choice, and by default /Applications/MAMP/htdocs is MAMP’s Document Root (and defaulting to port 8888) corresponding to URL …
http://localhost:8888
Even with compiling language work, we’ll often use subfolders off /Applications/MAMP/htdocs … working to a KISS principle!
Turning to web browsers, the four we tabulate below are all very good products, and can all work well for you, especially on macOS, but a consideration to do with how you organize work, there is the consideration of what work life will be like if you have to, say, clear all web browser cookies and data, for instance. As such, in the list below, we’ve organized Google Chrome and/or Firefox as the two web browsers we can tolerate that with (but prefer to just clear Last Hour or Last 15 Minutes or Last 24 Hours usually), in our (web browser) Organization Table below …
| Opera |
|---|
|
| Safari |
|
| Firefox |
|
| Google Chrome |
|
When there are jobs requiring command line needing to be seen next to a web browser rendition, macOS Terminal application windows can easily be arranged to not overlap any web browser brand window from the list above.
Screenshots on macOS have moved on from good ol’ Grab with the very easy keyboard shortcut …
control-command-shift-3
… working really well with good ol’ macOS version of PaintBrush‘s File->New from Clipboard functionality. Preview is good for PDF creation and compilation functionality. Gimp is good for blurring and other filtering requirements.
More and more we’ll use AirDrop to transfer from iPad or iPhone to the macOS MacBook Air, or use that iOS device’s Mail sharing option to download to the macOS MacBook Air Downloads folder usually, and then, usually, this will be copied to good ol’ /Applications/MAMP/htdocs (or a subfolder off this, especially if what is copied is a *.zip file (extracted)).
Crontab on the macOS MacBook Air has an “every minute” check of good ol’ /Applications/MAMP/htdocs changed (within last minute) *.png (primarily coming out of Paintbrush File->Save As… functionality) or *.[Hh][Ee][Ii][Cc] (off iPhone or iPad Camera app usage) ready for (PHP calling of) ImageMagick‘s convertion to versions of *.[Jj][Pp]*[Gg] images.
Uploads to (and downloads from) the RJM Programming domain are all conducted via sftp connections using the FileZilla macOS desktop application.
TextWrangler is our favourite text editor by a very large margin!
If this was interesting you may be interested in this too.
If this was interesting you may be interested in this too.
Web Browser Brand Roles Primer Tutorial
With a job, the day to day organization can be important, and is likely to be crucial to achieving goals.
We spend a lot of time around web browser applications, being into I.T. and creating web applications, in particular.
We’ve organized macOS MacBook Air usage mainly, around one major disk folder and four brands of web browser, the folder being, for us is …
/Applications/MAMP/htdocs
Huh?! Well, being into PHP as our “all things server” programming language, and having installed (many versions) of MAMP, as our Apache/PHP/MySql local web server brand of choice, and by default /Applications/MAMP/htdocs is MAMP’s Document Root (and defaulting to port 8888) corresponding to URL …
http://localhost:8888
Even with compiling language work, we’ll often use subfolders off /Applications/MAMP/htdocs … working to a KISS principle!
Turning to web browsers, the four we tabulate below are all very good products, and can all work well for you, especially on macOS, but a consideration to do with how you organize work, there is the consideration of what work life will be like if you have to, say, clear all web browser cookies and data, for instance. As such, in the list below, we’ve organized Google Chrome and/or Firefox as the two web browsers we can tolerate that with (but prefer to just clear Last Hour or Last 15 Minutes or Last 24 Hours usually), in our (web browser) Organization Table below …
| Opera |
|---|
|
| Safari |
|
| Firefox |
|
| Google Chrome |
|
When there are jobs requiring command line needing to be seen next to a web browser rendition, macOS Terminal application windows can easily be arranged to not overlap any web browser brand window from the list above.
Screenshots on macOS have moved on from good ol’ Grab with the very easy keyboard shortcut …
control-command-shift-3
… working really well with good ol’ macOS version of PaintBrush‘s File->New from Clipboard functionality. Preview is good for PDF creation and compilation functionality. Gimp is good for blurring and other filtering requirements.
More and more we’ll use AirDrop to transfer from iPad or iPhone to the macOS MacBook Air, or use that iOS device’s Mail sharing option to download to the macOS MacBook Air Downloads folder usually, and then, usually, this will be copied to good ol’ /Applications/MAMP/htdocs (or a subfolder off this, especially if what is copied is a *.zip file (extracted)).
Crontab on the macOS MacBook Air has an “every minute” check of good ol’ /Applications/MAMP/htdocs changed (within last minute) *.png (primarily coming out of Paintbrush File->Save As… functionality) or *.[Hh][Ee][Ii][Cc] (off iPhone or iPad Camera app usage) ready for (PHP calling of) ImageMagick‘s convertion to versions of *.[Jj][Pp]*[Gg] images.
Uploads to (and downloads from) the RJM Programming domain are all conducted via sftp connections using the FileZilla macOS desktop application.
TextWrangler is our favourite text editor by a very large margin!
If this was interesting you may be interested in this too.
Screen Co-ordinates Helper Primer Tutorial
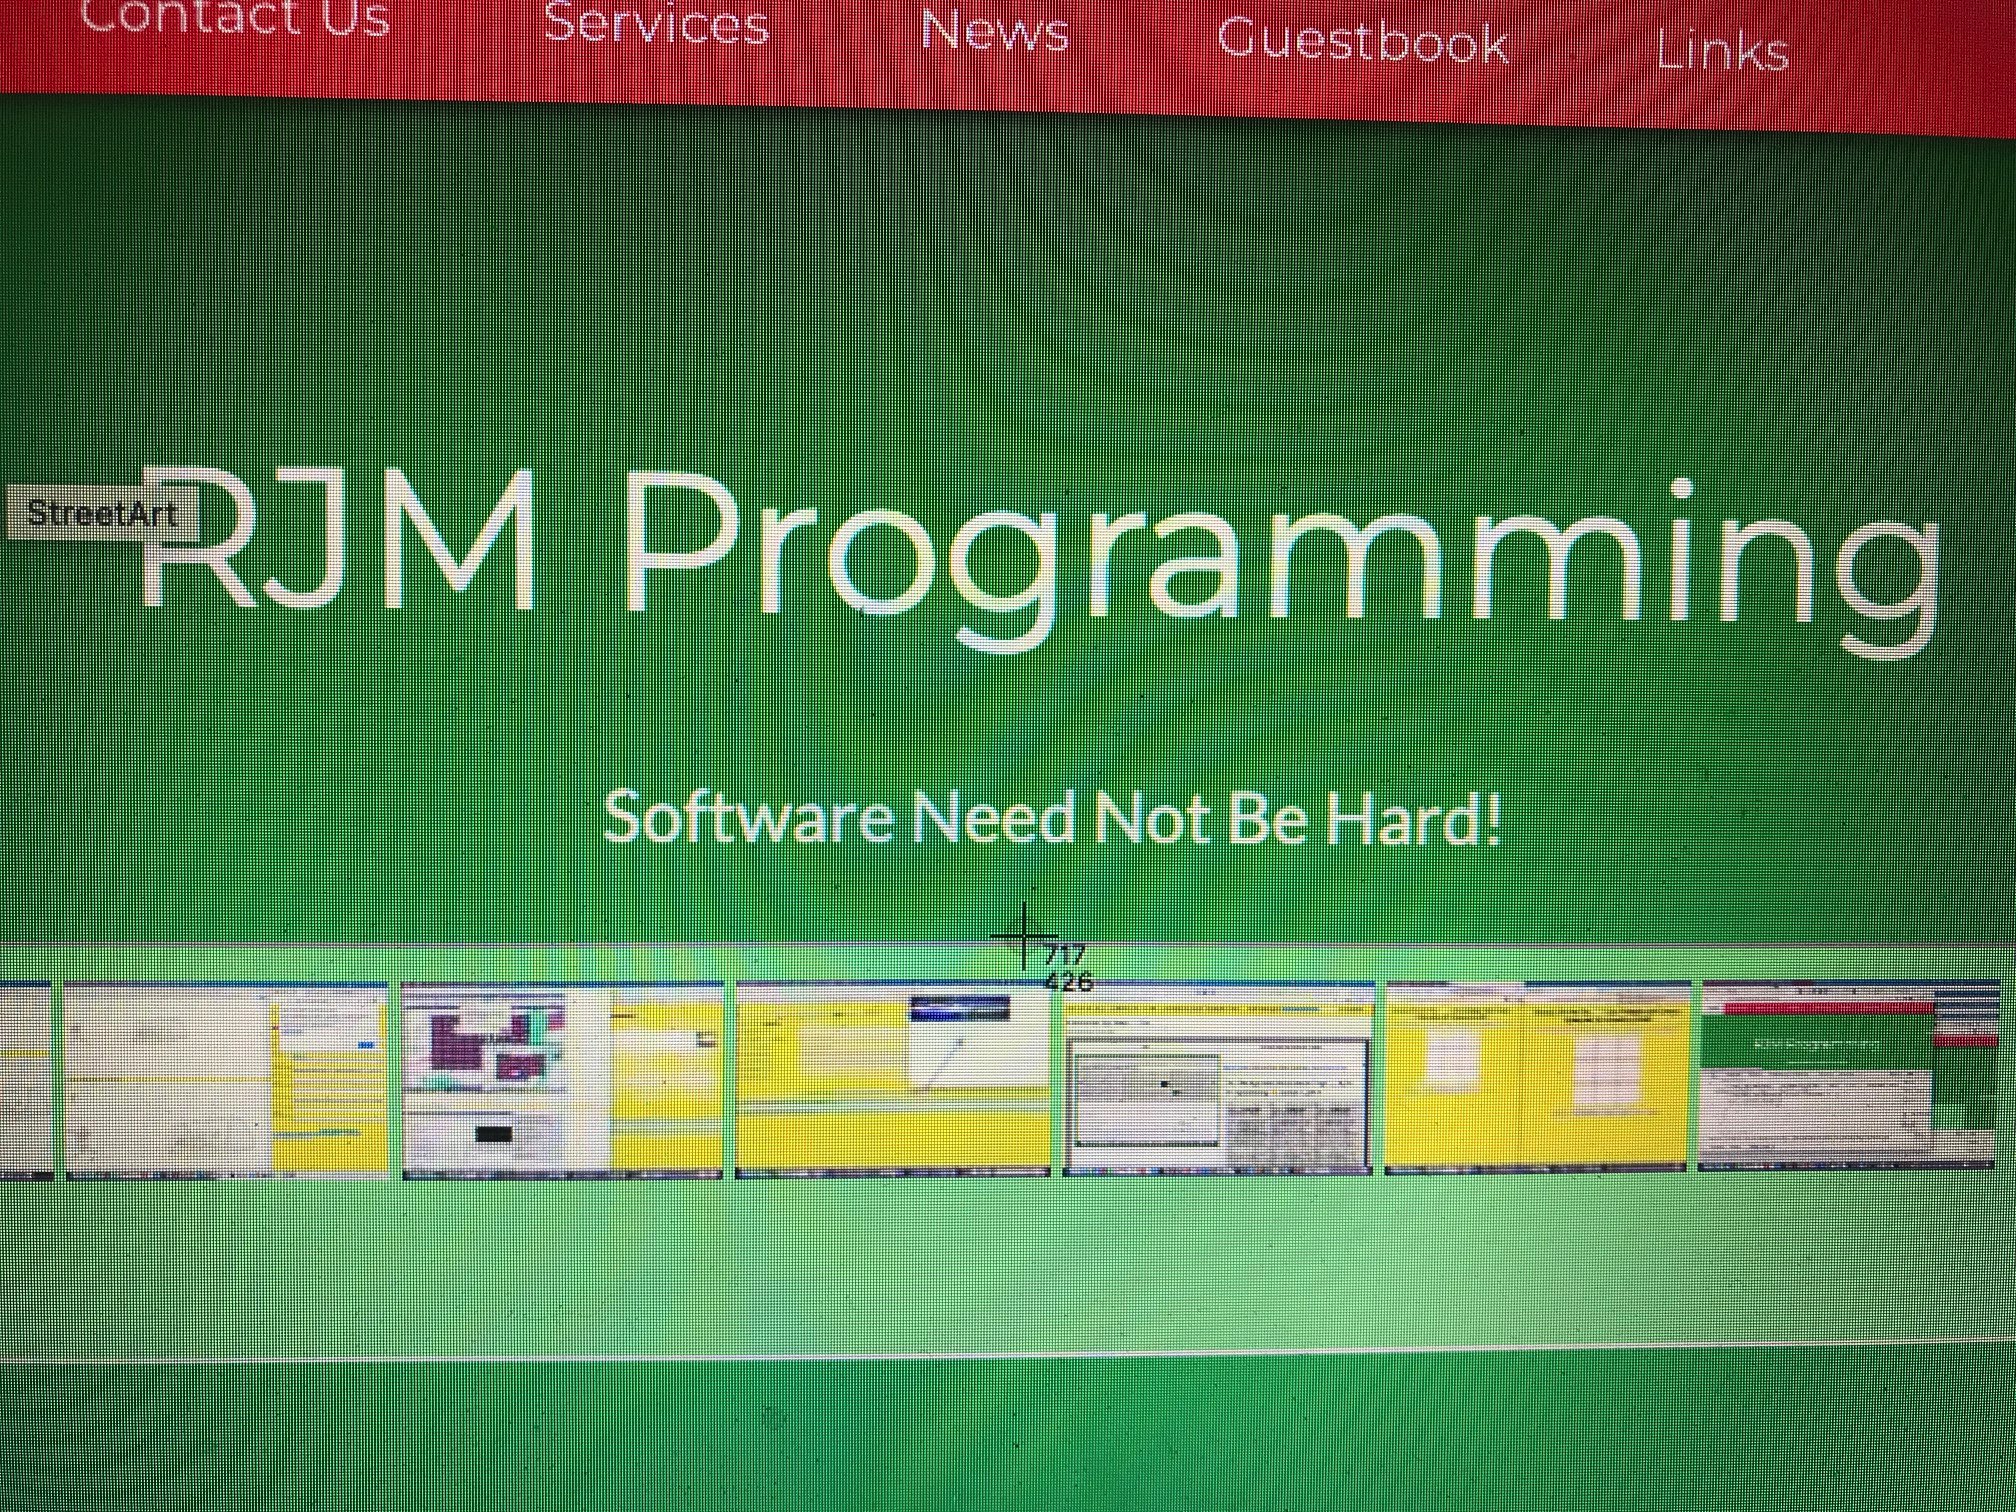
There’s a really good macOS keyboard shortcut we’d like to discuss today. It’s …
To take a screenshot of part of the screen, press Shift-Command-4 and then drag the cursor to outline the area you want to capture. If you want to capture a specific window, press Shift-Command-4. Hit the spacebar.
But it’s the “half-way” point with this we particularly noticed using web browsers. In the past when we’ve constructed HTML image maps we’ve often relied on Mobilefish.Com and its excellent Image Map Creation software to help us out, but this shift-command-4 keyboard shortcut’s way of displaying screen pixel co-ordinates could be another option here. Or it could be used in overlay position:absolute; left:[X]px; top:[Y]px; positioning scenarios, to good effect, we can envisage.
Mind you, other environments have their equivalents, too!
The woooooorrrrrllllllddd’s your better X and Y positioned oyyyyyyyster!
If this was interesting you may be interested in this too.
PHP Exif Quiz Data Subject Zoom Tutorial
Delving more into Exif data related issues, as with yesterday’s PHP Exif Quiz Data Nuances Tutorial, we were intrigued by Exif data items such as …
EXIF.SubjectLocation: 2014,1514,2218,1328
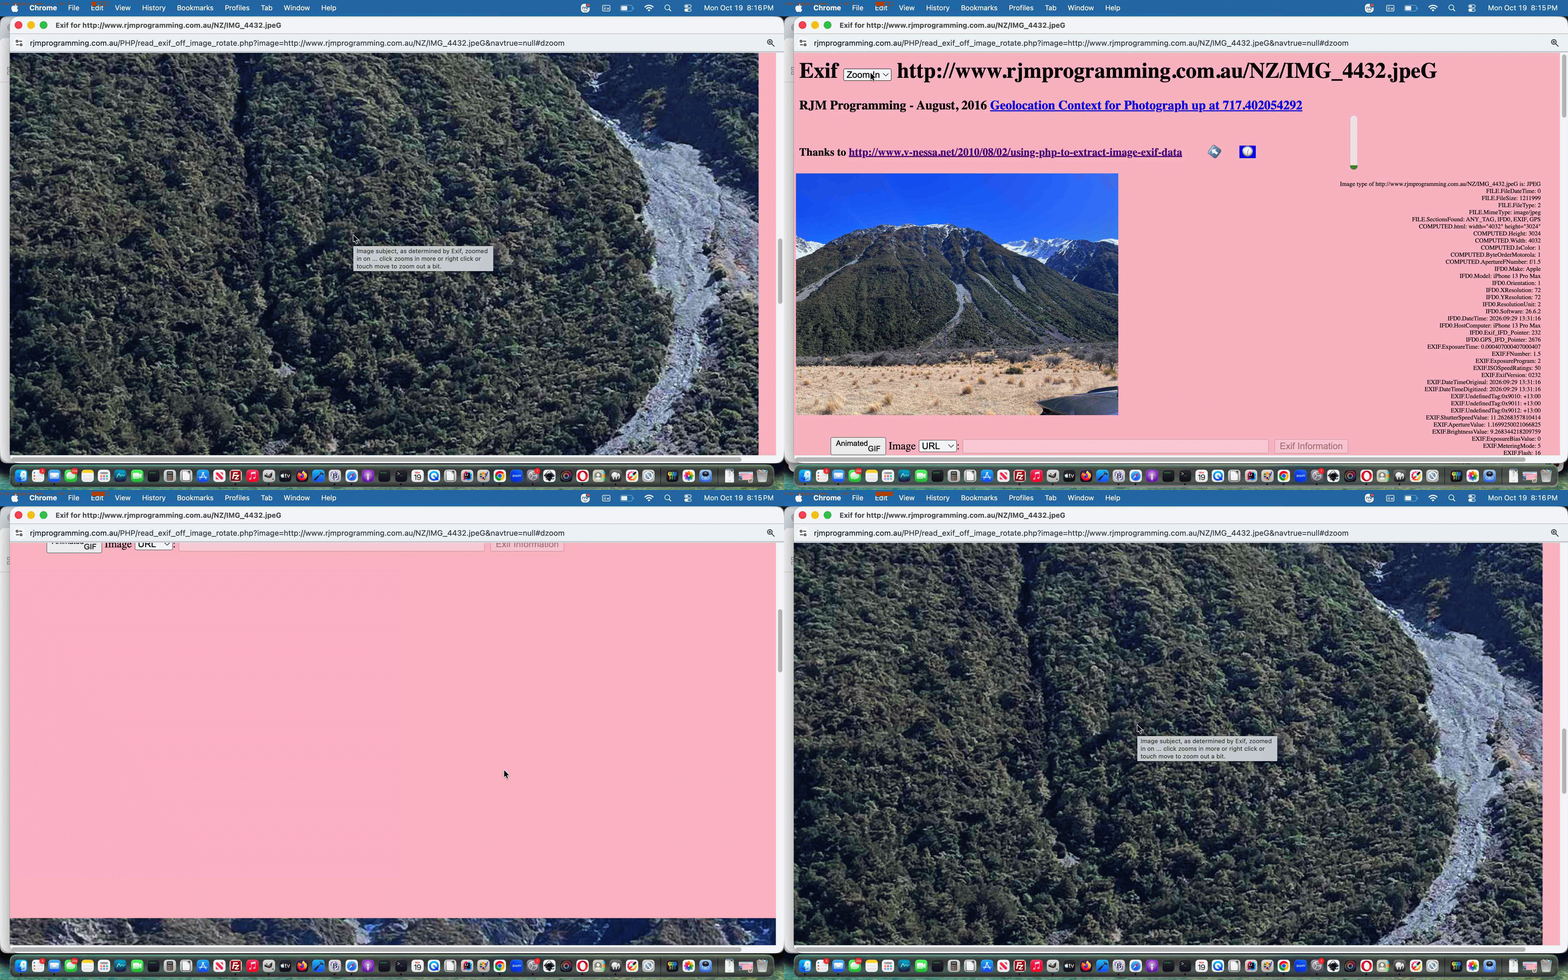
… and our research tells us sometimes it may go “EXIF.SubjectArea 2014,1514,2218,1328”. That research lead us to realize that Exif data item can be used to filter the photograph image data and clip and crop to the graphics part Exif assesses as the “subject” of the photograph.
We came up with the PHP …
<?php
    // Thanks to https://www.google.com/search?q=show+img+within+div+cropped&rlz=1C5OZZY_en&oq=show+img+within+div+cropped&gs_lcrp=EgZjaHJvbWUyBggAEEUYOTIJCAEQIRgKGKABMgkIAhAhGAoYoAEyBwgDECEYjwIyBwgEECEYjwLSAQg5Njc4ajBqN6gCALACAA&sourceid=chrome&source=chrome.ob&ie=UTF-8

    $clockline2.="\n document.getElementById('topsel').innerHTML+='<option id=optzoom value=zoomin>Zoom In</option>'; \n";

    $clockline2.="\n document.getElementById('optzoom').title=' ... on Exif photograph subject'; \n";

    $clockline2.="\n document.getElementById('dzoom').style.display='none'; \n";

    $clockline2.="\n document.getElementById('dzoom').style.overflow='hidden'; \n";

    $clockline2.="\n document.getElementById('dzoom').title='Image subject, as determined by Exif, zoomed in on ... click zooms in more or right click or touch move to zoom out a bit.'; \n";

    $clockline2.="\n document.getElementById('dzoom').style.height='" . $valsare[2] . "px'; \n"; // was width

    $clockline2.="\n document.getElementById('dzoom').style.width='" . $valsare[3] . "px'; \n";

    $clockline2.="\n document.getElementById('dzoom').innerHTML='<img onload=altize(this); id=izoom style=position:absolute;left:-" . ($valsare[1] - ($valsare[3] / 2)) . "px;top:-" . ($valsare[0] - ($valsare[2] / 2)) . "px; src=" . $image . " alt=></img>'; \n";

    $clockline2.="\n document.getElementById('dzoom').setAttribute('data-scale','0.104'); \n";

    //$clockline2.="\n document.getElementById('dzoom').style.transformOrigin='top left'; \n";

    $clockline2.="\n document.getElementById('dzoom').style.transform='scale(0.104)'; \n";

    $clockline2.="\n document.getElementById('izoom').onclick=function(event){  document.getElementById('dzoom').setAttribute('data-scale','' + eval(0.1 + eval(document.getElementById('dzoom').getAttribute('data-scale'))));   document.getElementById('dzoom').style.transform='scale(' + eval(document.getElementById('dzoom').getAttribute('data-scale')) + ')';   }; \n";

    $clockline2.="\n document.getElementById('izoom').oncontextmenu=function(event){ event.preventDefault(); document.getElementById('dzoom').setAttribute('data-scale','' + eval(-0.1 + eval(document.getElementById('dzoom').getAttribute('data-scale'))));   document.getElementById('dzoom').style.transform='scale(' + eval(document.getElementById('dzoom').getAttribute('data-scale')) + ')';   }; \n";

    $clockline2.="\n document.getElementById('izoom').ontouchmove=function(event){ event.preventDefault(); document.getElementById('dzoom').setAttribute('data-scale','' + eval(-0.1 + eval(document.getElementById('dzoom').getAttribute('data-scale'))));   document.getElementById('dzoom').style.transform='scale(' + eval(document.getElementById('dzoom').getAttribute('data-scale')) + ')';   }; \n";
?>
… using the changed PHP read_exif_off_image_rotate.php you might want to try standalone used in the Scenery Geolocation Quiz also shown below.
Stop Press
We ended up zooming away a lot … and it set us to trying this on some older Exif containing images. It taught us that Exif must change a lot through history and regarding the digital photography source device, we’re thinking?! These older Exif in our realm contained no EXIF.SubjectLocation nor EXIF.SubjectArea but always describe Width and Height (or Length) in some way shape or form. In this scenario, why not simulate our own EXIF.SubjectLocation: [midY],[midX],[imgHeight],[imgWidth] such that more people can “zoom about” using the changed PHP read_exif_off_image_rotate.php perhaps in standalone mode?
And while you’re there zooming round try right clicking (or touch moving) past the point the image becomes really small but discernible?!
Previous relevant PHP Exif Quiz Data Nuances Tutorial is shown below.
PHP Exif Quiz Data Nuances Tutorial
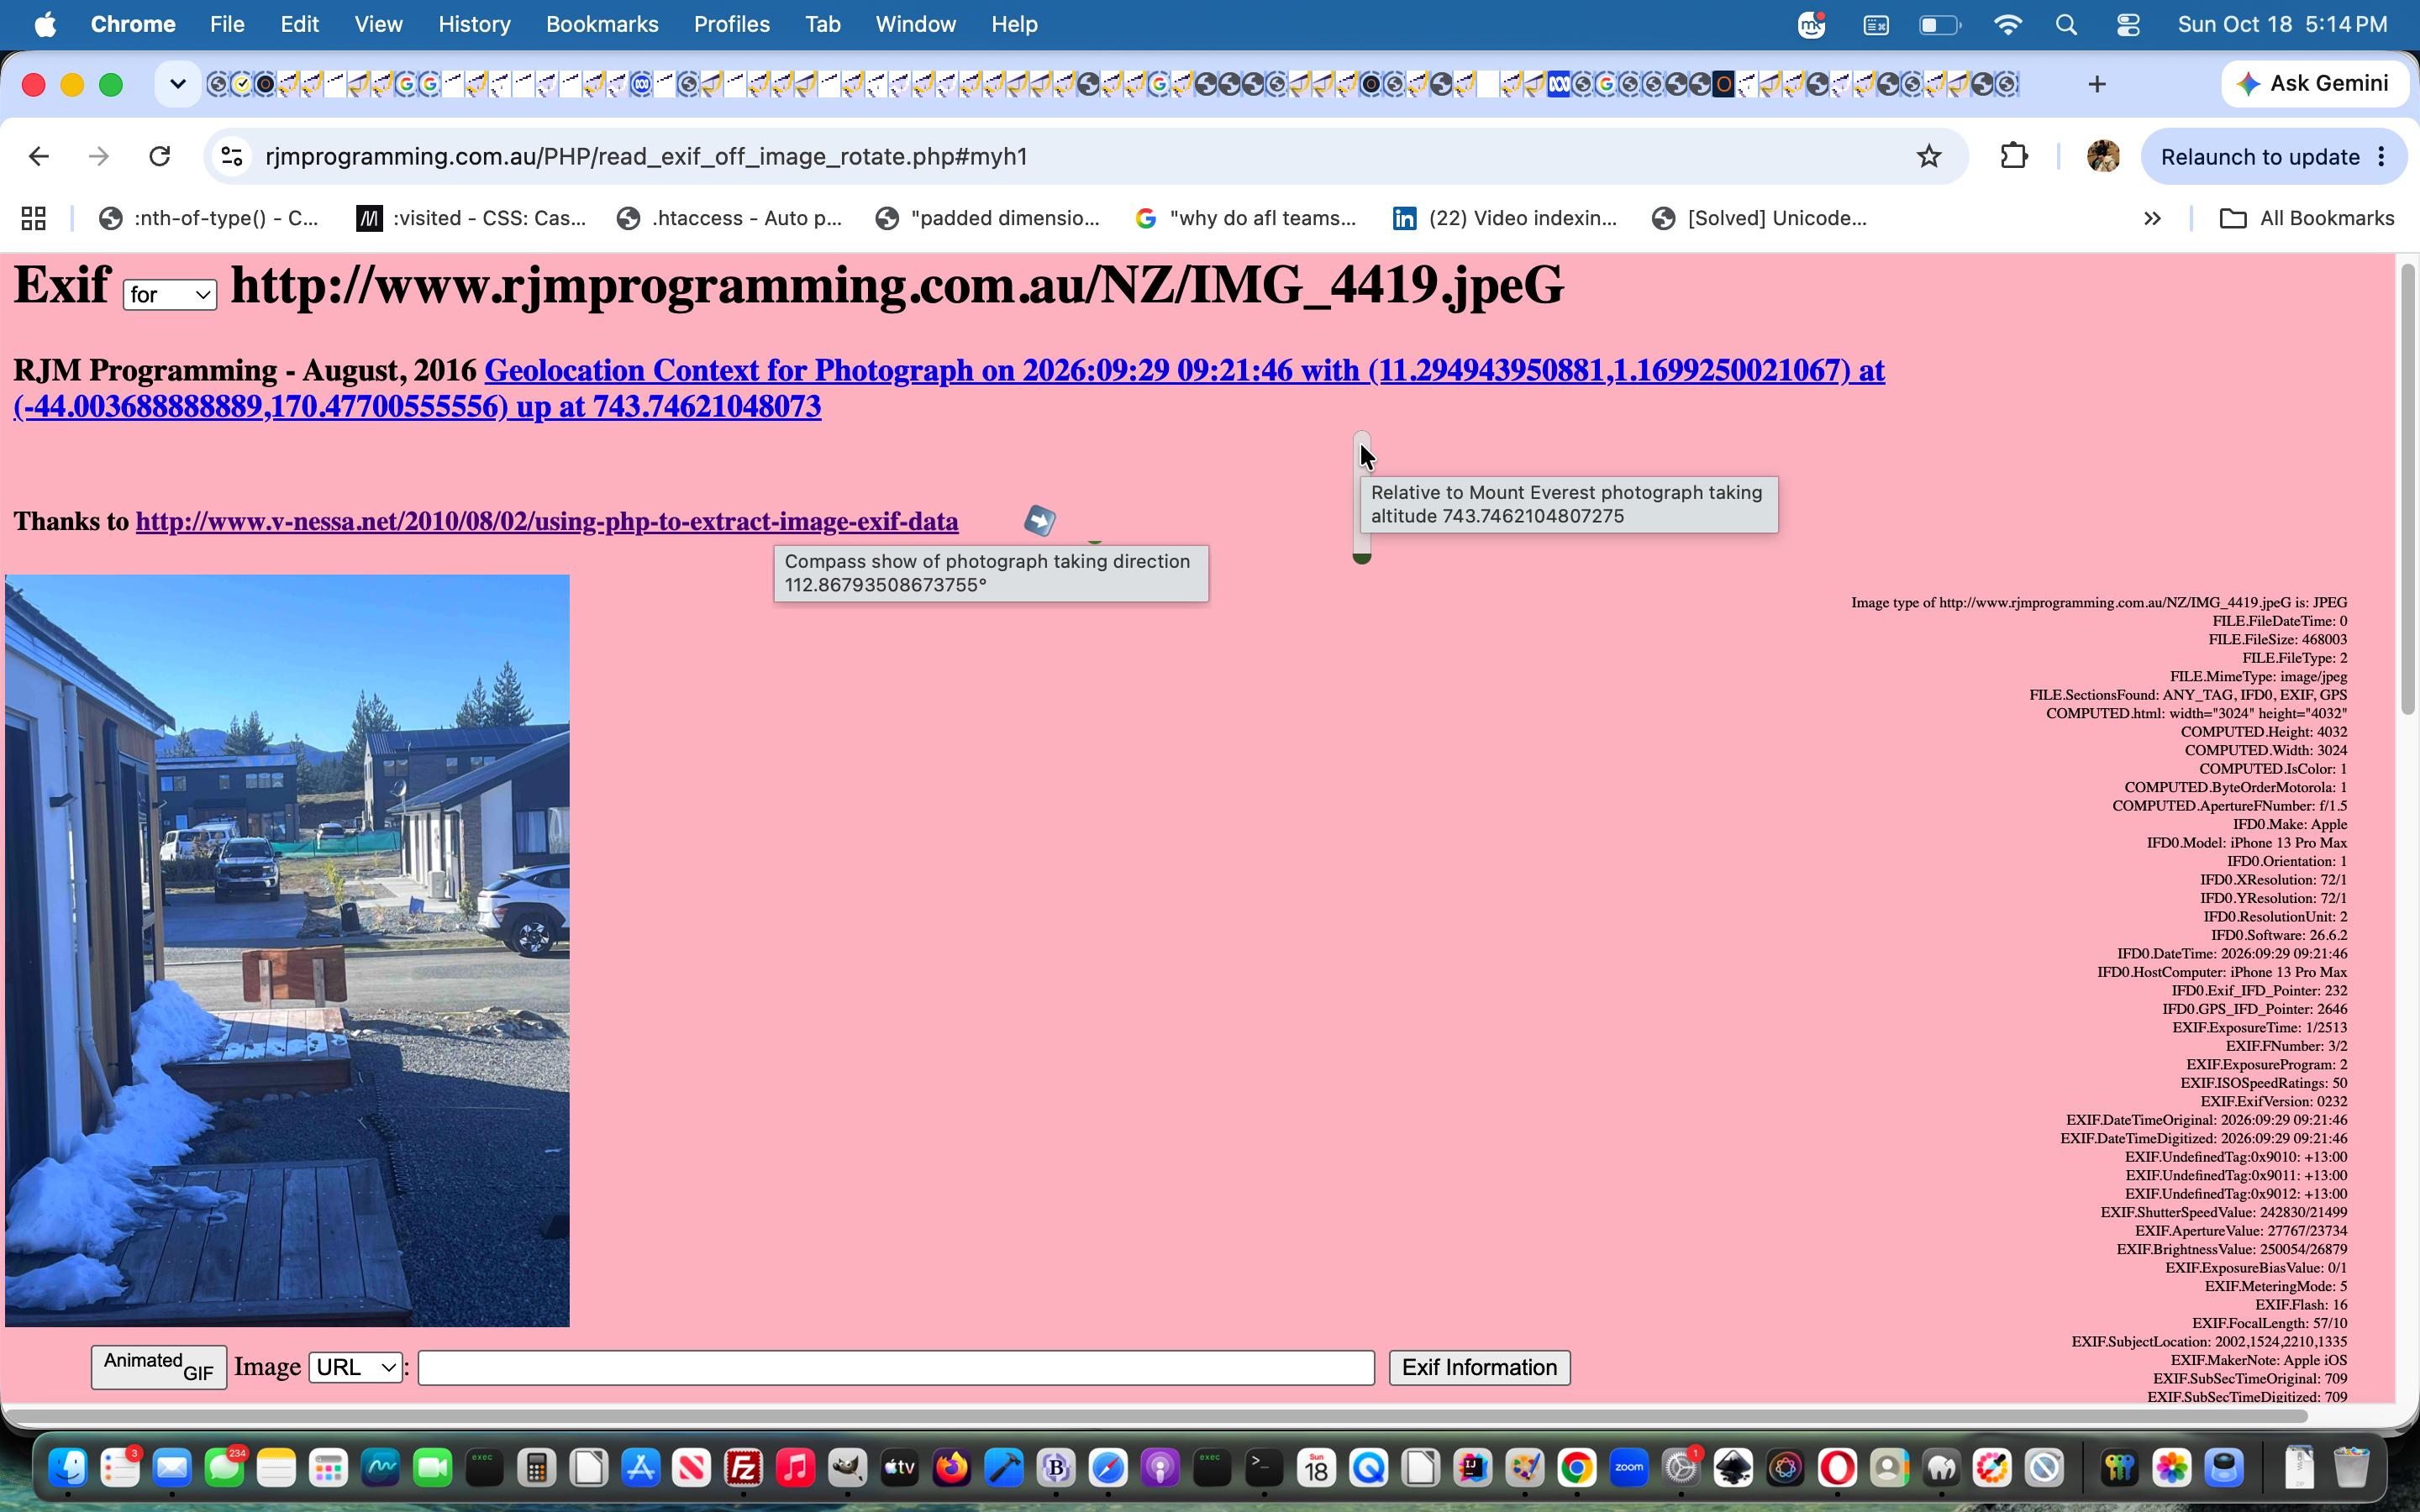
We think the recent PHP Exif Quiz Question and Answer Tutorial‘s underlying …
PHP reading image Exif data
… talents can be extended via a couple of visual ways to enhance and represent two Exif data related pieces of information, those being …
… via new Javascript …
<?php echo ”
    var ibrgis=0.0, valisd='';

    if (document.getElementById('exw') && document.getElementById('mycompass')) {

    if (document.getElementById('mycompass').innerHTML == '') {

      var elids=['mycompass', 'myaltitude'];

      var exifids=['ImgDirection:', 'GPSAltitude:'];

      var rotids=['-999', '-90'];

      var contideas=[String.fromCodePoint(0x2B06,0xFE0F),''];

      for (var iio=0; iio<elids.length; iio++) {

      if (document.getElementById(elids[iio])) {

      if (document.getElementById('exw').innerHTML.indexOf(exifids[iio]) != -1) {

        ibrgis=0.0;

        valisd=document.getElementById('exw').innerHTML.split(exifids[iio])[1].split('&')[0].split('<')[0].trim();

        if (valisd.indexOf('/') != -1) {

         ibrgis=eval(valisd);

        } else if (valisd.trim() != '') {

         ibrgis=eval(valisd);

        }

        if (contideas[iio] == '') {

        document.getElementById(elids[iio]).innerHTML='<progress style=opacity:0.8;accent-color:green;height:45px; value=' + Math.round(ibrgis) + ' min=0 max=8850></progress>';

        document.getElementById(elids[iio]).onclick=function(event){  alert(document.getElementById('myaltitude').title); };

        document.getElementById(elids[iio]).title=document.getElementById(elids[iio]).title.replace(/.$/g, ' ' + ibrgis + '');

        document.getElementById(elids[iio]).style.display='inline-block';

        document.getElementById(elids[iio]).style.transform = ('rotate(' + rotids[iio] + 'deg) scale(" . $snbs . ")');

        } else {

        document.getElementById(elids[iio]).innerHTML=contideas[iio];

        document.getElementById(elids[iio]).onclick=function(event){  alert(event.target.title); };

        document.getElementById(elids[iio]).title=document.getElementById(elids[iio]).title.replace(/.$/g, ' ' + ibrgis + String.fromCodePoint(0x00B0) + '');

        document.getElementById(elids[iio]).style.display='inline-block';

        document.getElementById(elids[iio]).style.transform = ('rotate(' + Math.round(ibrgis) + 'deg)');

        }

      }

      }

    }

    }

    }
“; ?>
… via …
Previous relevant PHP Exif Quiz Question and Answer Tutorial is shown below.
PHP Exif Quiz Question and Answer Tutorial
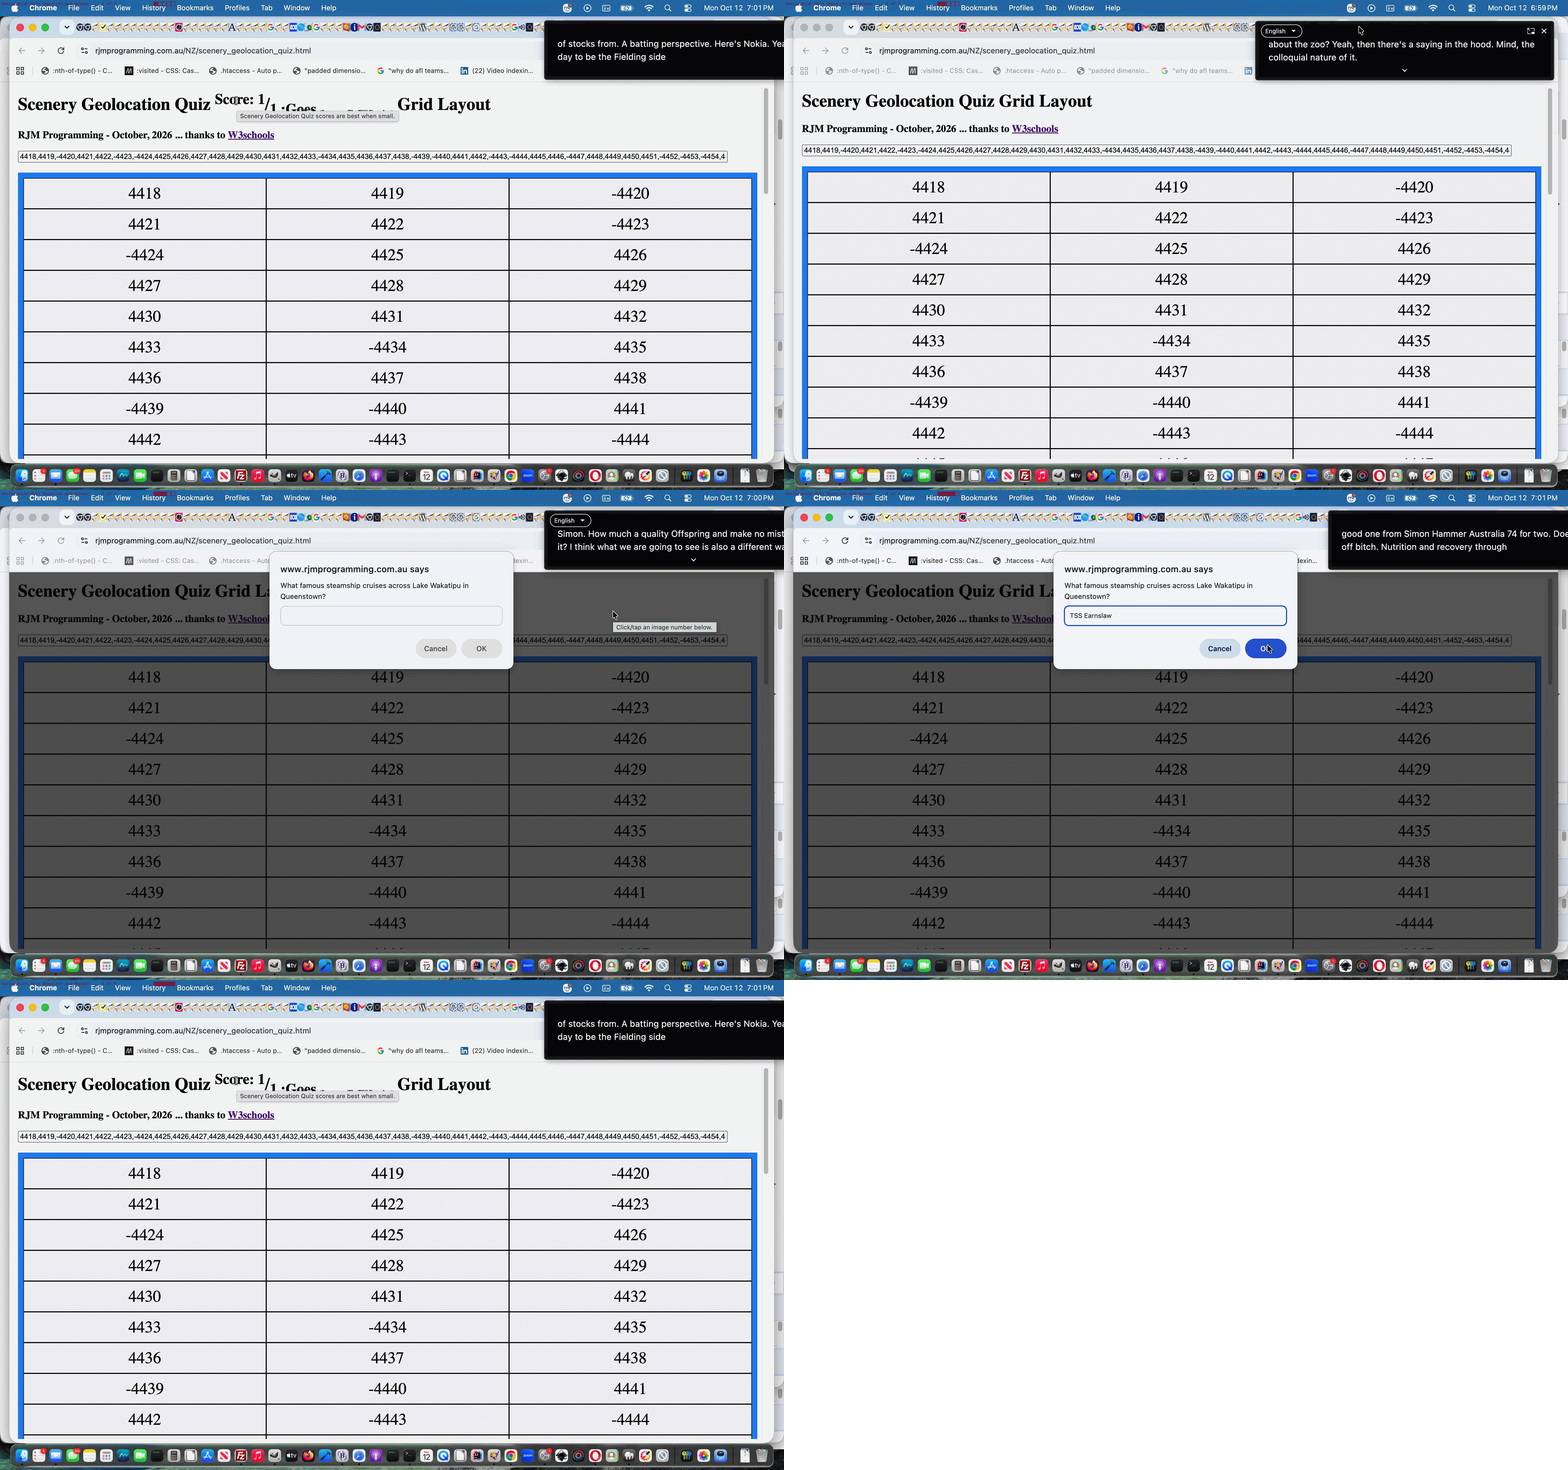
Regarding yesterday’s PHP Exif Quiz Geographicals Tutorial‘s Scenery Geolocation Quiz web application there were the image numbers which amounted to “unsuitable for Exif” purposes, which we negated, for us to consider, where to do nothing we deemed less ideal than to …
  var qs=["What is the tallest mountain on the South Island (and all of New Zealand)?",

  "What is the largest lake located on the South Island?",

  "In what year were the North Island and South Island officially named?",

  "Which famous historic church sits on the edge of Lake Tekapo?",

  "Which body of water separates the South Island from Stewart Island?",

  "What famous steamship cruises across Lake Wakatipu in Queenstown?",

  "Which limestone rock formations are a major tourist stop on the West Coast?",

  "What words could describe the character of the kea bird?",

  "What weight of wool in kilograms was Shrek as he exited the cave near Bendigo Station in 2004?",

  "What varietal of wine is grown in Central Otago?",

  "Is Cromwell's Big Fruit larger than Robertson's Big Potato?",

  "Is Lake Wanaka deeper than Sydney Harbour?",

  "Is Clutha River deeper than Sydney Harbour?",

  "What is the Māori name for New Zealand greenstone?",

  "In which river of the 1860s Otago gold rush was most gold found?",

  "Does New Zealand have a longer coastline than China?",

  "What sport do the All Whites play?",

  "What year were the All Blacks rugby team last beaten at Eden Park, here in October, 2026?",

  "If 73.6 million people, as of October 2026, live between latitude 45°N and 46°N how many million to nearest whole number live between latitude 45°S and 90°S?"];
  function quizimgid(divo) {

   var thisq=Math.floor(Math.random() * qs.length), wdsleft=0, ii=0, jj=0;

   if (divo.innerHTML.indexOf('-') == 0) {

   var ansis=prompt(qs[thisq], '');

   if (ansis == null) { ansis=''; }

   var wdsare=as[thisq].split(',')[0].split('(')[0].trim().replace(' / ',' ').replace(' at ',' ').toLowerCase().split(' ');

   wdsleft=wdsare.length;

   if (ansis.trim() != '') {

   var qansare=ansis.toLowerCase().split(' ');

   for (ii=0; ii<eval('' + qansare.length); ii++) {

     for (jj=0; jj<eval('' + wdsare.length); jj++) {

        if (wdsare[jj] == qansare[ii]) { wdsleft--;  }

     }

   }

   }

   if (wdsleft > 0) {

     forans=" <font size=1>(for answer " + as[thisq] + ")</font>";

   } else {

     forans=" <font size=6>(Congratulations!!)</font>";

   }

   document.getElementById('myh1').title='' + wdsleft;

   } else {

   divo.style.backgroundImage='url(//www.rjmprogramming.com.au/NZ/IMG_' + divo.innerHTML + '.jpeG)';

   divo.style.backgroundSize='contain';

   divo.style.backgroundRepeat='no-repeat';

   if (woo) {

     if (!woo.closed) {

       woo.close();

       woo=null;

     }

   }

   woo=window.open('//www.rjmprogramming.com.au/PHP/read_exif_off_image_rotate.php?image=http://www.rjmprogramming.com.au/NZ/IMG_' + divo.innerHTML + '.jpeG', '_blank', 'top=100,left=' + eval(-800 + screen.width) + ',width=800,height=800');

   }

  }
… as our way to add some variety to the quiz via a changed grid_fitting_in.html also shown below.
Previous relevant PHP Exif Quiz Geographicals Tutorial is shown below.
PHP Exif Quiz Geographicals Tutorial
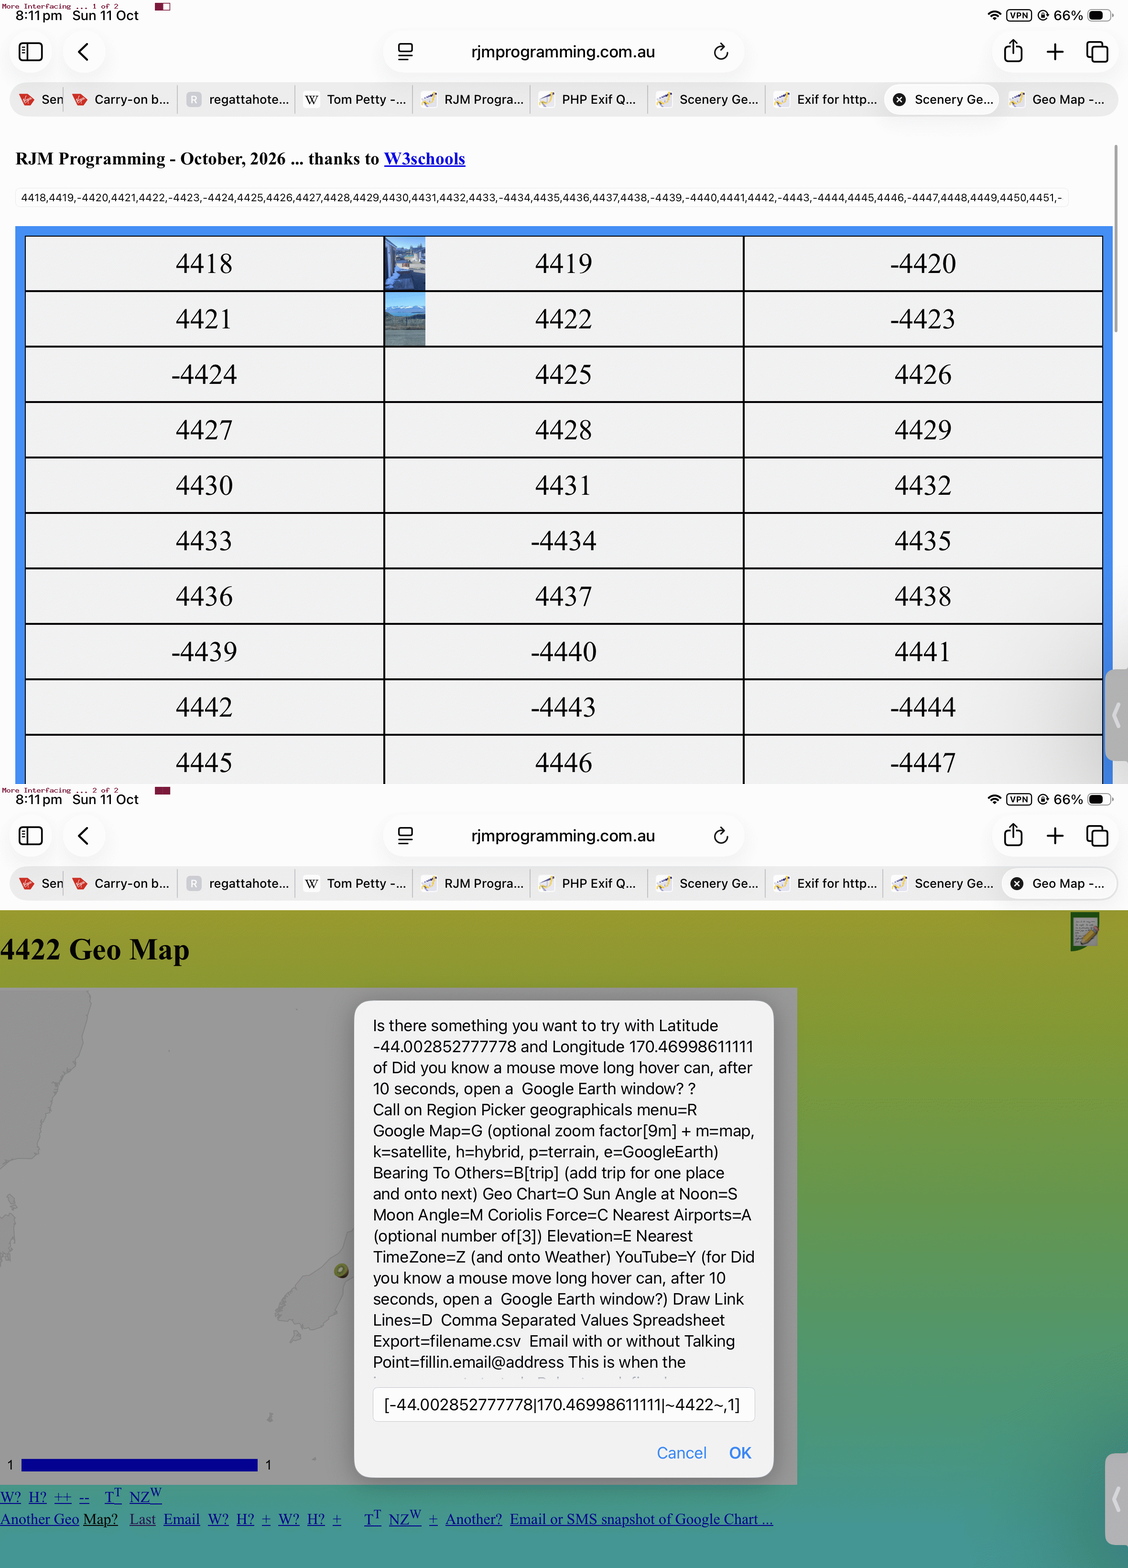
Yesterday’s PHP Exif Quiz Tutorial‘s Scenery Geolocation Quiz, as far as follow up “Geographicals Based Interfacings” went, offered …
… off which, it being “inhouse”, a click/tap offers other “Geographicals” (ie. latitude, longitude) based interfacing options … via …
Previous relevant PHP Exif Quiz Tutorial is shown below.
PHP Exif Quiz Tutorial
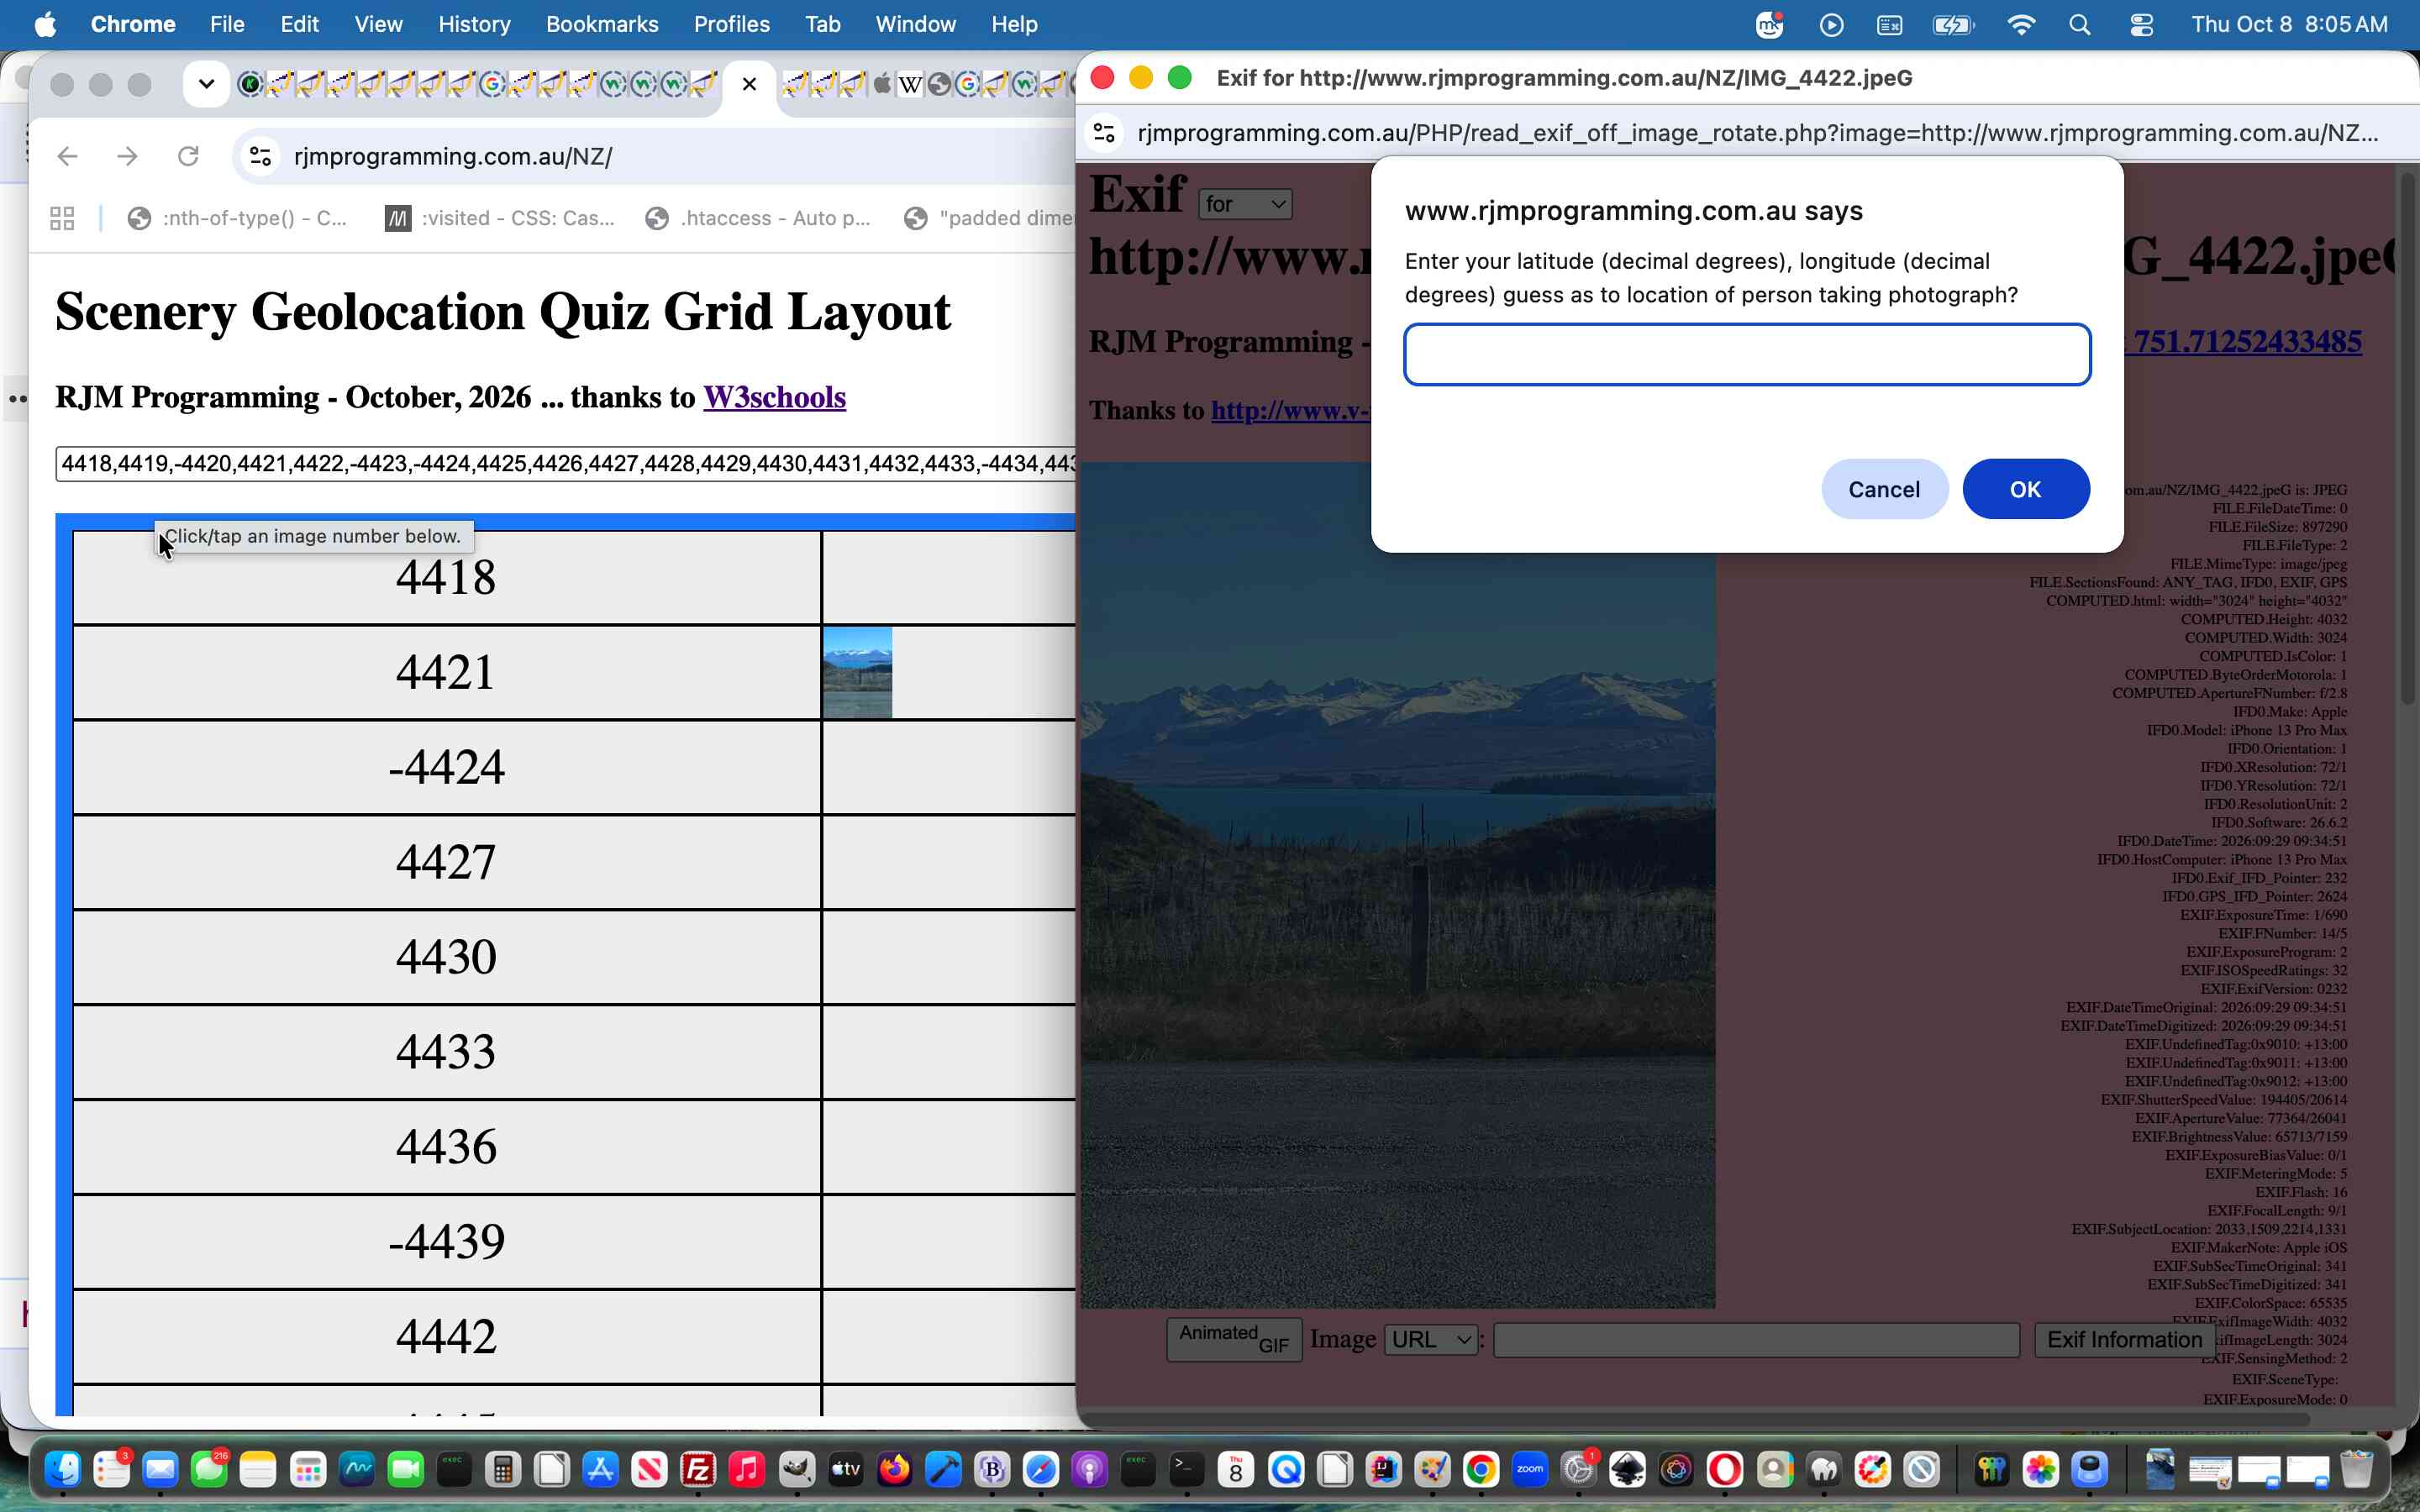
You guessed it? After yesterday’s …
… we’d be coming up with a …
Yay!!!!!!!!!!!!!!!!
Click here to see what we mean …
Did you know?
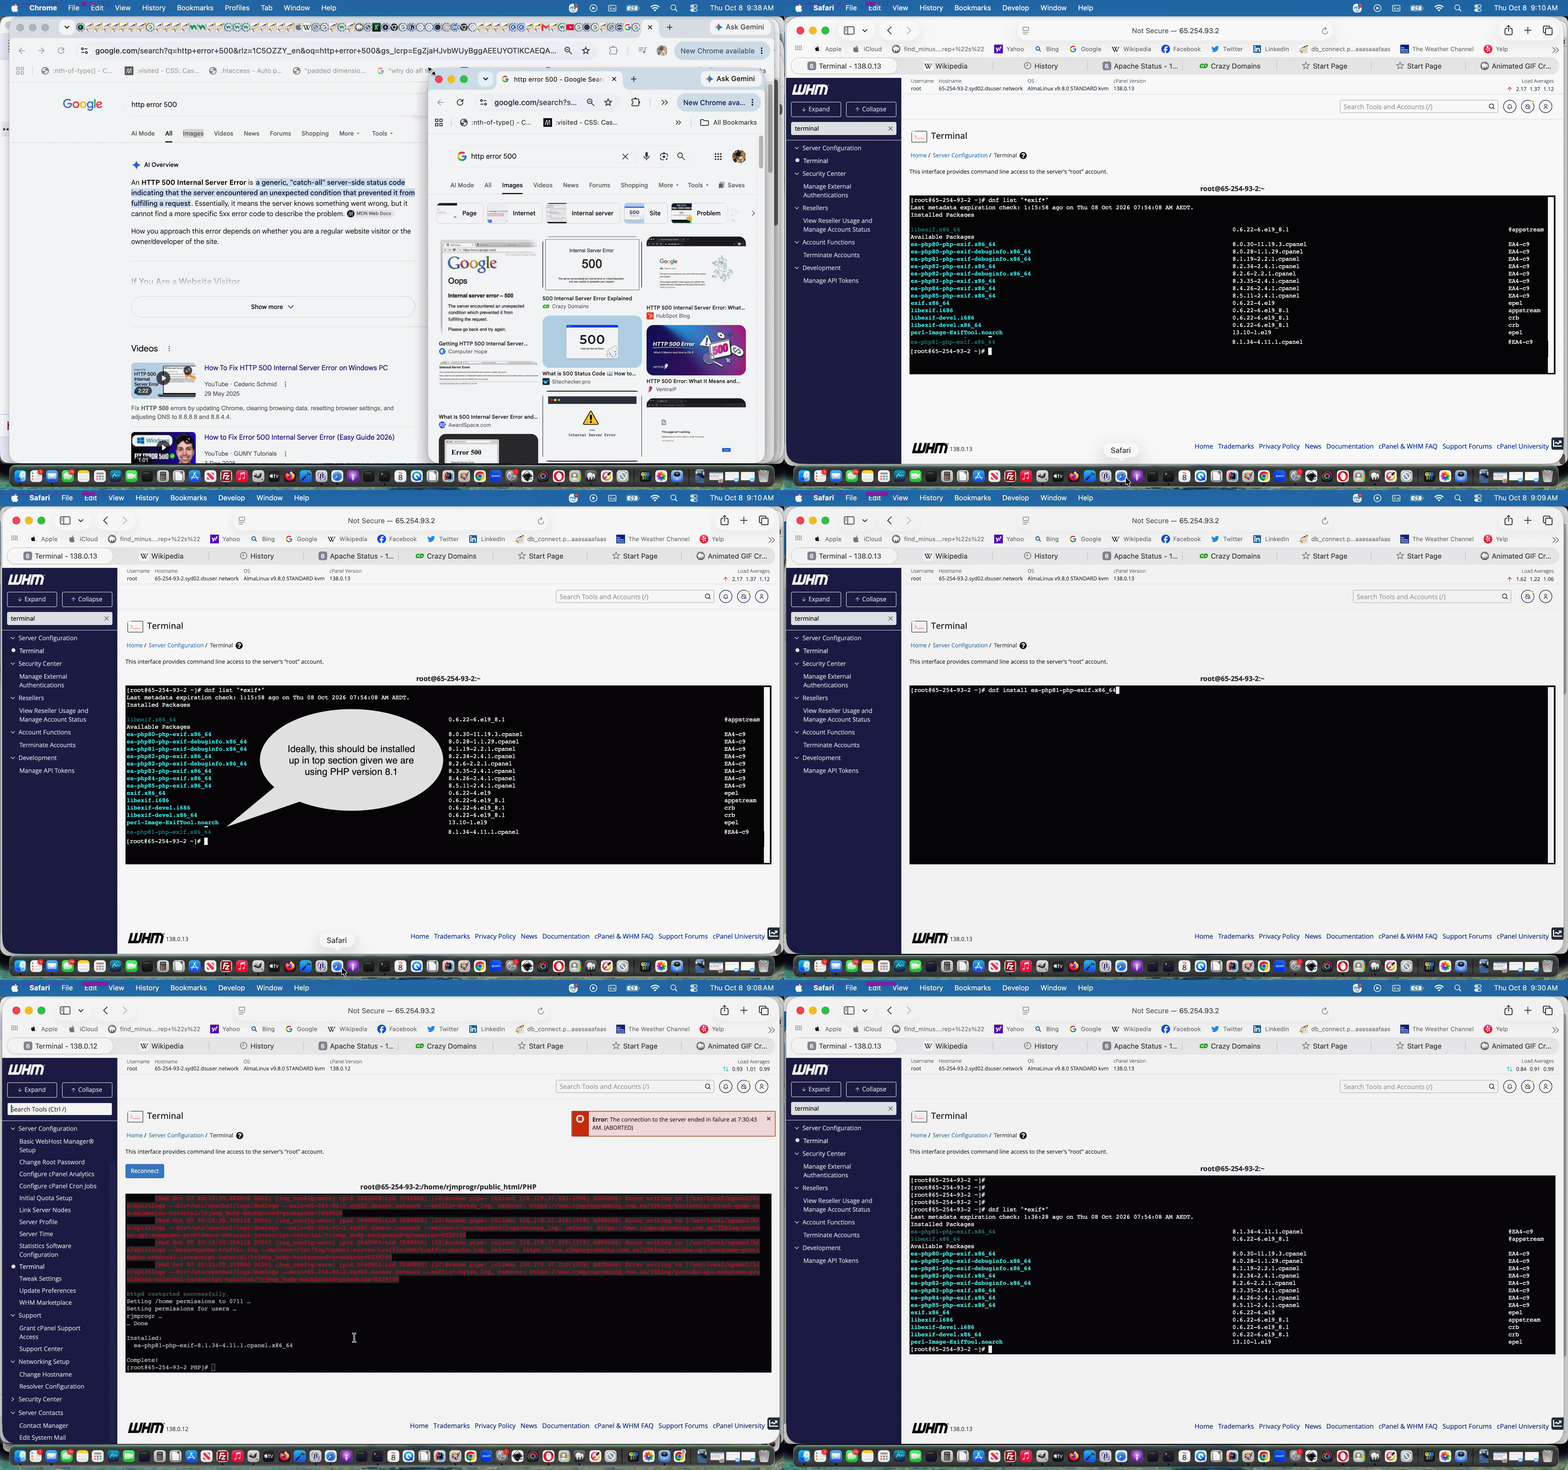
Regarding testing PHP web applications, especially up at our public RJM Programming website (more so because newer versions of AlmaLinux Apache/PHP/MySql configurations will drop some of the PHP modules you have previously (re-)installed, and you have to keep, at least for us, “stumbling onto” the issue), you can occasionally encounter …
HTTP Error Code 500 … Internal Error
… issues, as we did at one stage deploying the Scenery Geolocation Quiz above.
To both research the problem, and fix it we access the public RJM Programming AlmaLinux Apache/PHP/MySql website’s WHM cPanel environment’s web server command line accessing Terminal option, going …
Previous relevant PHP Exif Retention off iPhone Images Tutorial is shown below.
PHP Exif Retention off iPhone Images Tutorial
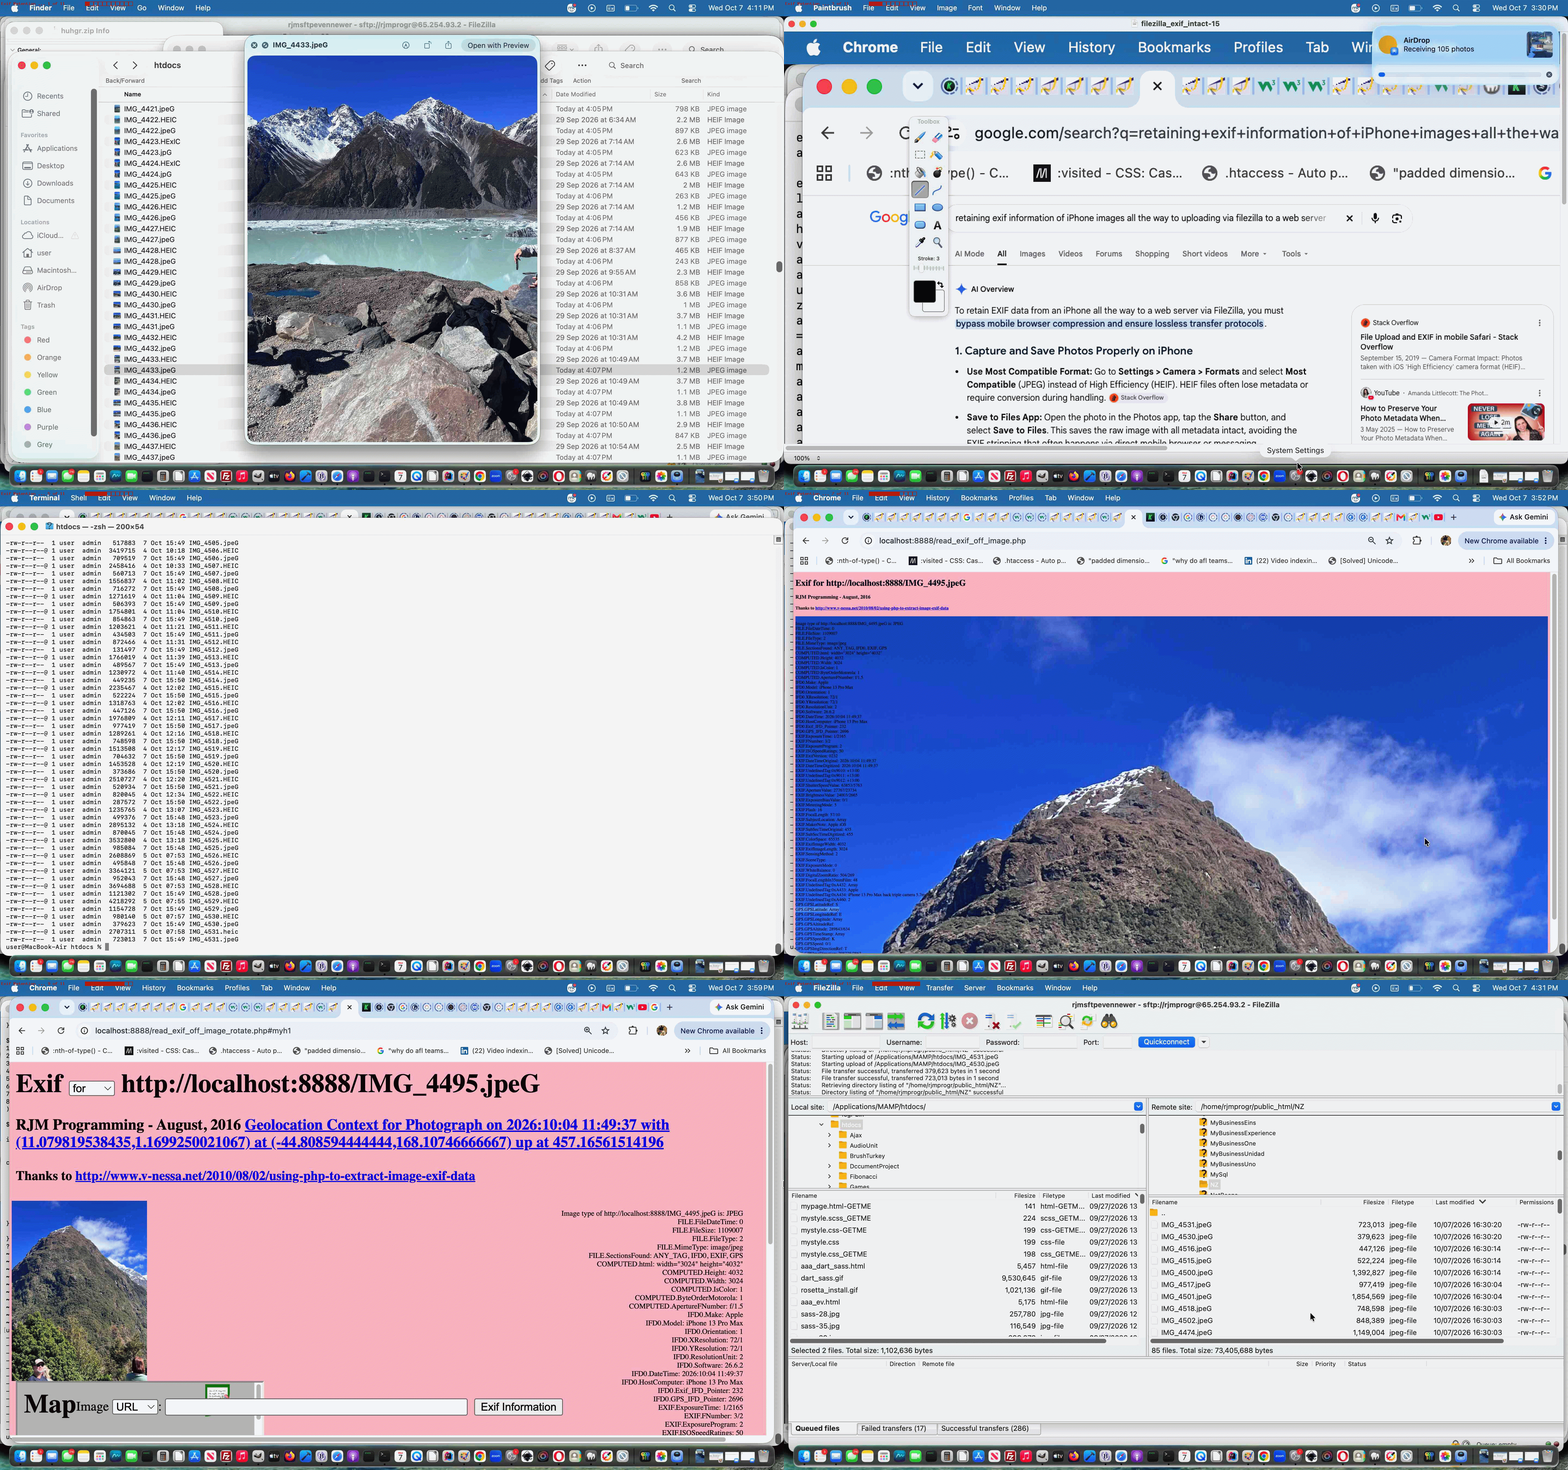
We have a new project on the go. We want to retain Exif information, that is contained within our iPhone’s *.HEIC formatted photographs, all the way through to some format and form of RJM Programming public website set of image media files.
And so, as well as referencing previous work such as that of PHP Exif Image Information Revisit Tutorial and Command Line ImageMagick HEIC to JPEG Image Creation Tutorial, we asked of Google retaining exif information of iPhone images all the way to uploading via filezilla to a web server, finding pertinent and useful the advice …
To retain EXIF data from an iPhone all the way to a web server via FileZilla, you must bypass mobile browser compression and ensure lossless transfer protocols.
AirDrop or Cable Transfer: Transfer the file from the Files app or Photos library to a Mac or PC using AirDrop or a direct USB cable.
And so, that is today’s first step on the new project, where if we cannot retain Exif the project is not worth continuing with.
Keep your hair on! It worked using our ImageMagick conversions to *.jpeG (from iPhone AirDropped *.HEIC) here on this MacBook Air and FileZilla (sftp) uploading those to our new folder on the RJM Programming web server for images like …

… as one example.
Previous relevant PHP Exif Image Information Revisit Tutorial is shown below.

PHP Exif Image Information Revisit Tutorial
Another “revisit” today to the PHP Exif Information web application displayer of PHP Exif Image Zip Mystery Game Hints Tutorial. Now supposing we put this scenario to you …
Now we ask you, in PHP, do you need to know the dimensions of that image to satisfy the requirements above? Well, we first thought (surely it must be) so, but going through the motions of doing today’s work, we realized that, though you can (for the PHP global $image variable with the image URL) …
list($width, $height, $type, $attr) = getimagesize($image);
… in PHP to determine those image dimensions, with the way our web application works, we didn’t need to, as you can “link” PHP with the CSS calc function to bypass any Javascript (eg. DOM) client script approach, abstracting the need to know hard and fast dimensions in PHP (and consequently not running into any window resizing or zooming issues (as a matter of fact, zooming up can make the Exif text information resize up quite nicely thank you very much and don’t mind if I do but we digress and so and usefully))
if ($image != "") {

  list($width, $height, $type, $attr) = getimagesize($image);

  // $iwidth=$width;

  // $iheight=$height;

  // $csswh=" width:" . $iwidth . "px; height:" . $iheight . "px; ";

  $csswh=" width: calc(100% - 10px); height: calc(100% - 220px); text-align: right; margin-right: 20px;  } form { position: absolute; left:50px; top: calc(100% - 45px); width:100%; height:40px; ";

}
… used later on to build up the HTML for the webpage, that also looks much better because the image and Exif wording are more likely to be separated from each other now …
$htmlis="<html><head>" . $javascript . "<style>" . $bcsscolour . " div { font-size:9px; overflow: visible; float:right; " . $csswh . " } </style><meta name='viewport' content='width=device-width, initial-scale=1, minimum-scale=0.25, maximum-scale=8, user-scalable=yes'><title>Exif for " . $image . "</title></head><body style='background-color:" . $bcolour . ";'><h1 id='myh1'>Exif <select onchange=\"if (this.value.length == 2) { top.alinktop=''; top.document.getElementById('dexif').innerHTML=''; top.location.href=top.document.URL.split('index.')[0]+'index-ssmhalf.html'; } else { var zipurl=prompt('Enter image zipfile URL for Mystery Trip game (good for 2 players)','mysterytrip.zip'); if (zipurl != null) { if (zipurl.toLowerCase().indexOf('.zip') != -1) { location.href=document.URL.split('#')[0].split('?')[0] + '?image=' + encodeURIComponent(zipurl); } } } \"><option value=''>for</option><option value=' '>zipfile</option>" . $anotheroption . "</select> " . $image . "</h1><h3>RJM Programming - August, 2016 <a id='ageolocation style='visibility:hidden;' href='#mygeolocation'>Geolocation Context for Photograph" . $various . "</a></h3><h4>Thanks to <a target=_blank title=Useful href=//www.v-nessa.net/2010/08/02/using-php-to-extract-image-exif-data>http://www.v-nessa.net/2010/08/02/using-php-to-extract-image-exif-data</a></h4><div onclick=\"window.open('" . $image . "','_blank','top=5,left=5');\" style='background-color:yellow; background: url(" . str_replace("/Applications/MAMP/htdocs/","http://localhost:8888/",$image) . ") no-repeat; background-position: 5px; background-size: contain; '><br>" . " Image type of " . $image . " is: " . $types[$imagetype];
The changed PHP read_exif_off_image_rotate.php includes these aesthetic and usability improvements you can test for yourself at this live run link.
Previous relevant PHP Exif Image Zip Mystery Game Hints Tutorial is shown below.
PHP Exif Image Zip Mystery Game Hints Tutorial
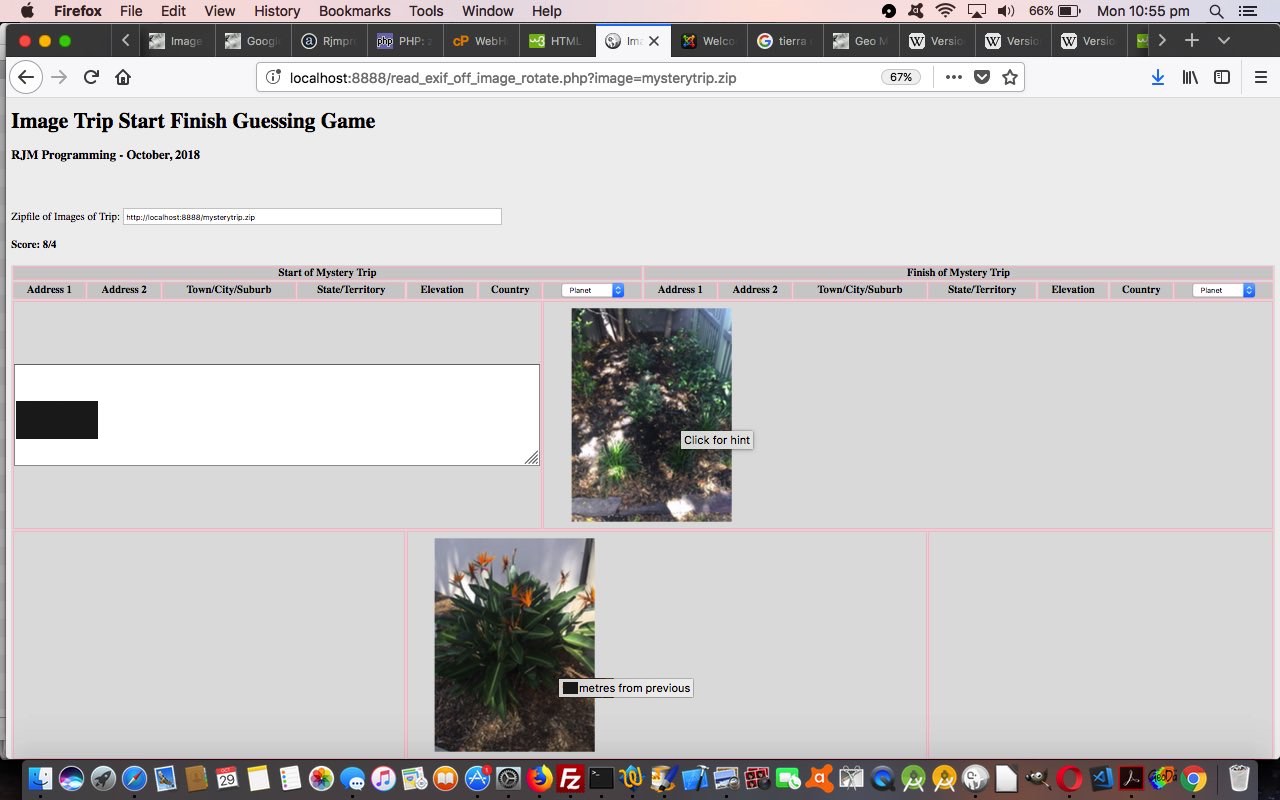
Just like with the recent PHP Wikipedia Geo Map Google Chart Tutorial we find a use for the talents of Google Chart …
… as we improve the functionality of our “Mystery Trip in Images Game” we started with yesterday’s PHP Exif Image Zip Mystery Game Primer Tutorial.
They are used respectively for …
And so today we can take you to a real zip file of JPEG images of a Mystery Trip, taken on an iPhone that you can try with a second player at this live run link.
The photos were taken deliberately to be obtuse, so as not to give the game away with their visual content. How are we able to give you hints in a programmatical sense? Well, on a JPEG coming out of an iPhone there is geodata (metadata latitude and longitude) stored that we access via Exif image attribute (PHP) methods.
The changed PHP read_exif_off_image_rotate.php includes these “best for two player” game interactive improvements, as well as allowing the user be able to reach this Mystery Game from old URL (simpler) arrangements, from older incarnations (you can read below).
Previous relevant PHP Exif Image Zip Mystery Game Primer Tutorial is shown below.
PHP Exif Image Zip Mystery Game Primer Tutorial
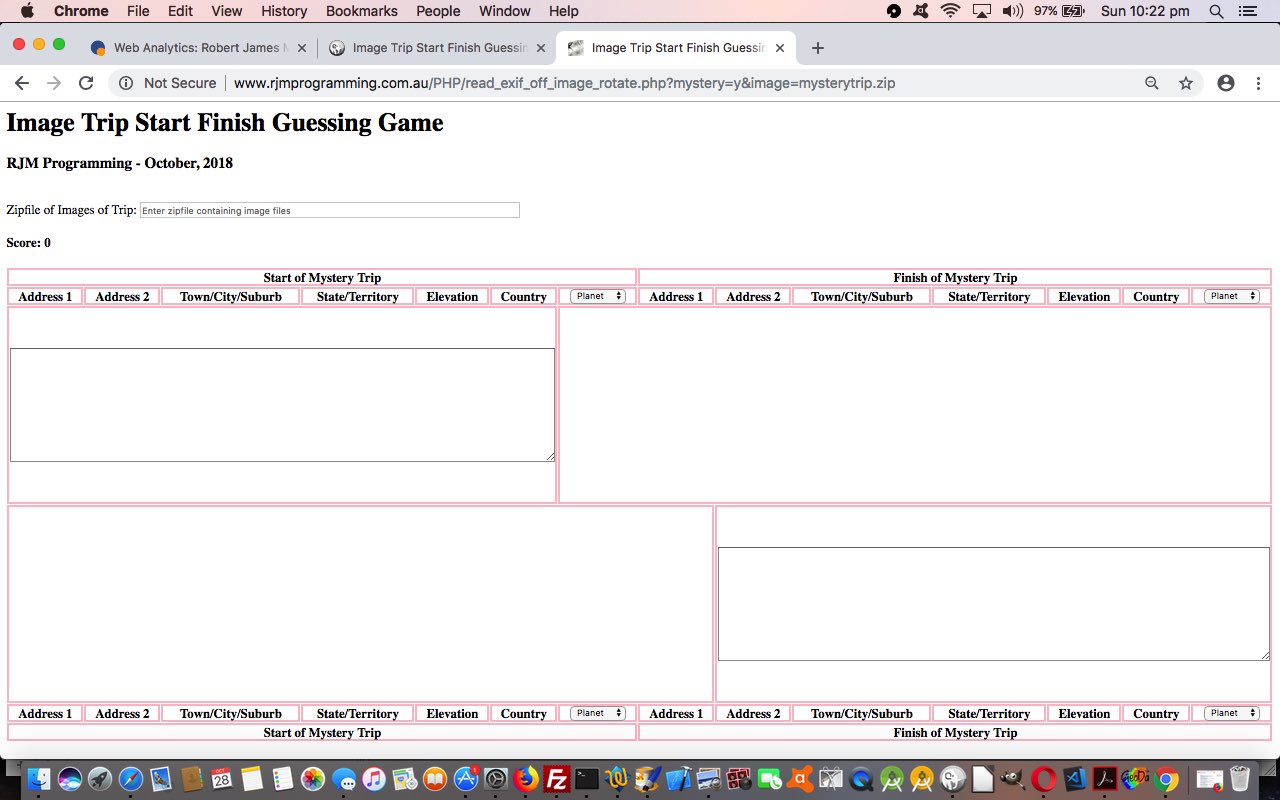
There’s a fair bit to the design of a new game we’re developing that uses the image metadata ideas from PHP Exif Image Information Rotation Tutorial in its workings.
Our early days work starts down the road by collecting zipfile and other pertinent Exif data item ideas off …
As you can see to simplify things we are introducing PHP zipfile coding to group together a set of photographs into the one file concept.
It will be tomorrow that you see a more complete and rounded game solution, and by then we can come up with a name for it too!
Feel free to try the changed read_exif_off_image_rotate.php live run to try out this game in an early incarnation.
Previous relevant PHP Exif Image Information Rotation Tutorial is shown below.

PHP Exif Image Information Rotation Tutorial
The “Stop Press” of PHP Exif Image Information Primer Tutorial as shown below, introduced us to some PHP able to glean quite a bit of really useful Exif information stored with an image file, perhaps straight off a digital camera or mobile phone or mobile tablet. We use the great advice of http://www.v-nessa.net/2010/08/02/using-php-to-extract-image-exif-data to cycle through this information.
This information was of interest regarding …
Sometimes you’ll see Gimp using exif functionality when it becomes aware of the possibility your image could be rotated to advantage
… as we saw Gimp doing this in relation to a photograph image coming off my Android Mobile Phone that we used, in its “rotated-by-Gimp” form, in our recent Mindfulness Follow Up Tutorial. But how about if we want to detect what Gimp detects, to fix this camera orientation issue ourselves? Well, in amongst the Exif information, we found …
IFD0.Orientation: 6 … and then surfing the web we found …… which gave us the means to apply a rotation the way Gimp does. How did we decide to apply this rotation? There are lots of ways, and we decided on this occasion to use CSS and apply a background image, with a transformation, to an HTML div element, also showing all that Exif information. We do this with new PHP you could call read_exif_off_image_rotate.php that has this corresponding new live run link. To get there, from where we’ve last been, take a skeg here.
So, coming back to our “clouds” photo we saw an Exif IFD0.Orientation value of 6 and consulted this useful link to find that we should rotate the image by 90 degrees. We do this with the HTML and inline CSS that goes, for the encasing HTML div element …
<div style='background-color:yellow; background: url(clouds.jpg); opacity:0.6;  norepeat; -webkit-transform: rotate(90deg); -moz-transform: rotate(90deg); -ms-transform: rotate(90deg); -o-transform: rotate(90deg); transform: rotate(90deg); '>

</div>
… in regard to using the original camera image …

Now you may have heard of geographical knowledge stored within photographs, and perhaps you’ll see the live run‘s (turn your head or computer) …
GPS.GPSVersion
… that if fleshed out, with other data elements underneath, would put that image into the category of those where geographical information resides. You may want to start reading more about (the huge topic of) “Geotagging” from this useful Wikipedia webpage … thanks.
Previous relevant PHP Exif Image Information Primer Tutorial is shown below.
PHP Exif Image Information Primer Tutorial
Our (Mac OS X laptop) local MAMP web server is an Apache/PHP/MySql web server. In this environment you can find out a lot with some PHP code as per …
<?php phpinfo(); ?>
… and if, in doing this, you find a reference to the “exif” Exchangeable Image Information functionality existing, you are a lucky candidate to introduce some image “interrogation” (but not this) logic to your PHP code.
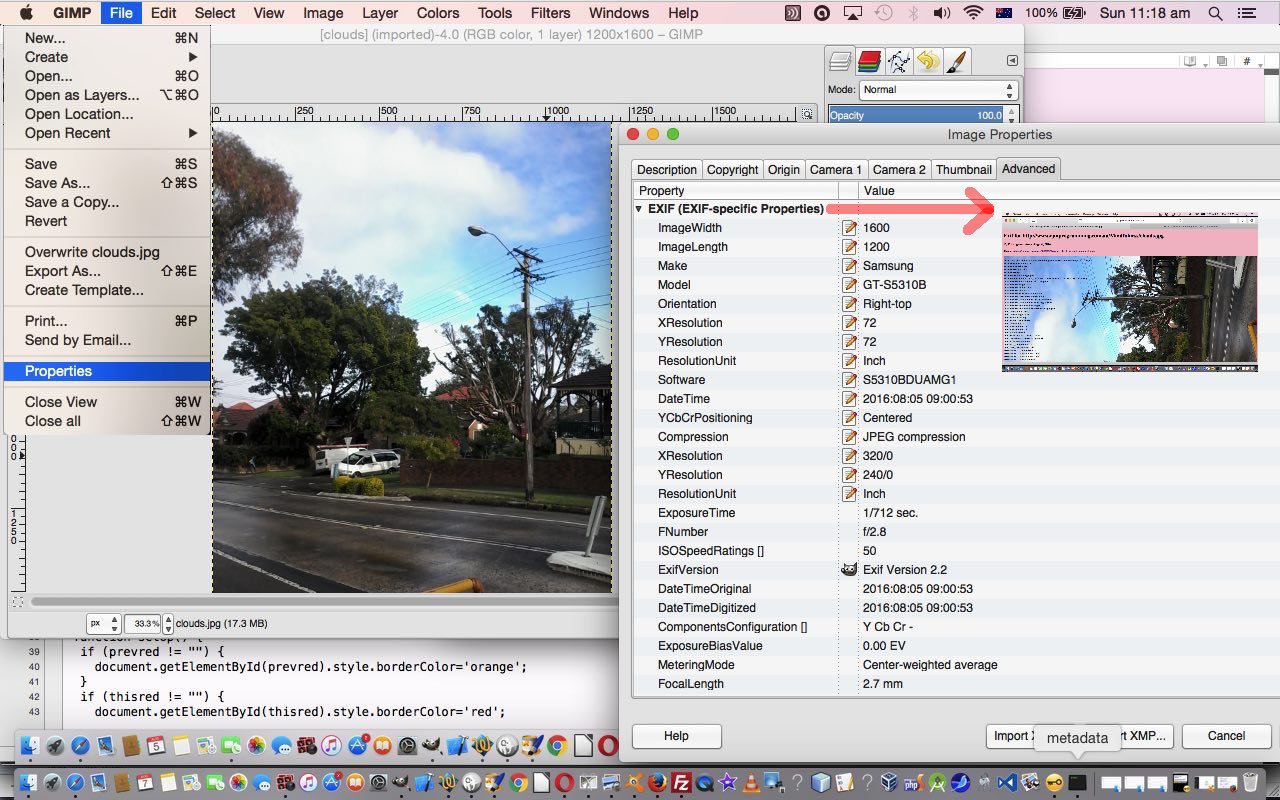
We followed a lot of the advice of the very useful link (thanks) to create some PHP called …
… where we may (or maybe not) be waking you up (before we go go ‘Cause I’m not plannin’ on going solo yo (to be honest, like)) … it’s a slow news day … to the fact that images can show on a web page but may not be all you would understand them to be … shock, horror!
Yes, an image that is a GIF in all but name will often display fine even if it’s been given a name like MyNameIs.Jpeg man person.
If this outrage makes you …
… then we’re here to tell you that you need to take a Bex and have a lie down.
In any case, there is a solution to this in PHP if the exif functionality is available to you, and this matter is of concern, and you can see us showing you how to test for that with the code above and this live run. Sometimes you’ll see Gimp using exif functionality when it becomes aware of the possibility your image could be rotated to advantage … we’ve had this happen and thanked Gimp with more than the usual toast and herbal tea offerings you’d be used to giving … we take it?!
Stop Press
As of 8/8/2016 (well, what do you know? … understood everywhere!?) we’re revisiting Exif and PHP to learn more and our tutorial picture now reflects the early days of the revisit and the new resultant PHP we wrote, that you could call read_exif_off_image.php, inspired, largely from http://www.v-nessa.net/2010/08/02/using-php-to-extract-image-exif-data (thanks), and has this live run link, the output of which is pointed to by the red arrow in the tutorial picture.
If this was interesting you may be interested in this too.
If this was interesting you may be interested in this too.
If this was interesting you may be interested in this too.
If this was interesting you may be interested in this too.
If this was interesting you may be interested in this too.
If this was interesting you may be interested in this too.
If this was interesting you may be interested in this too.
If this was interesting you may be interested in this too.
If this was interesting you may be interested in this too.
If this was interesting you may be interested in this too.
If this was interesting you may be interested in this too.
PHP Exif Quiz Data Nuances Tutorial
We think the recent PHP Exif Quiz Question and Answer Tutorial‘s underlying …
PHP reading image Exif data
… talents can be extended via a couple of visual ways to enhance and represent two Exif data related pieces of information, those being …
… via new Javascript …
<?php echo ”
    var ibrgis=0.0, valisd='';

    if (document.getElementById('exw') && document.getElementById('mycompass')) {

    if (document.getElementById('mycompass').innerHTML == '') {

      var elids=['mycompass', 'myaltitude'];

      var exifids=['ImgDirection:', 'GPSAltitude:'];

      var rotids=['-999', '-90'];

      var contideas=[String.fromCodePoint(0x2B06,0xFE0F),''];

      for (var iio=0; iio<elids.length; iio++) {

      if (document.getElementById(elids[iio])) {

      if (document.getElementById('exw').innerHTML.indexOf(exifids[iio]) != -1) {

        ibrgis=0.0;

        valisd=document.getElementById('exw').innerHTML.split(exifids[iio])[1].split('&')[0].split('<')[0].trim();

        if (valisd.indexOf('/') != -1) {

         ibrgis=eval(valisd);

        } else if (valisd.trim() != '') {

         ibrgis=eval(valisd);

        }

        if (contideas[iio] == '') {

        document.getElementById(elids[iio]).innerHTML='<progress style=opacity:0.8;accent-color:green;height:45px; value=' + Math.round(ibrgis) + ' min=0 max=8850></progress>';

        document.getElementById(elids[iio]).onclick=function(event){  alert(document.getElementById('myaltitude').title); };

        document.getElementById(elids[iio]).title=document.getElementById(elids[iio]).title.replace(/.$/g, ' ' + ibrgis + '');

        document.getElementById(elids[iio]).style.display='inline-block';

        document.getElementById(elids[iio]).style.transform = ('rotate(' + rotids[iio] + 'deg) scale(" . $snbs . ")');

        } else {

        document.getElementById(elids[iio]).innerHTML=contideas[iio];

        document.getElementById(elids[iio]).onclick=function(event){  alert(event.target.title); };

        document.getElementById(elids[iio]).title=document.getElementById(elids[iio]).title.replace(/.$/g, ' ' + ibrgis + String.fromCodePoint(0x00B0) + '');

        document.getElementById(elids[iio]).style.display='inline-block';

        document.getElementById(elids[iio]).style.transform = ('rotate(' + Math.round(ibrgis) + 'deg)');

        }

      }

      }

    }

    }

    }
“; ?>
… via …
Previous relevant PHP Exif Quiz Question and Answer Tutorial is shown below.
PHP Exif Quiz Question and Answer Tutorial
Regarding yesterday’s PHP Exif Quiz Geographicals Tutorial‘s Scenery Geolocation Quiz web application there were the image numbers which amounted to “unsuitable for Exif” purposes, which we negated, for us to consider, where to do nothing we deemed less ideal than to …
  var qs=["What is the tallest mountain on the South Island (and all of New Zealand)?",

  "What is the largest lake located on the South Island?",

  "In what year were the North Island and South Island officially named?",

  "Which famous historic church sits on the edge of Lake Tekapo?",

  "Which body of water separates the South Island from Stewart Island?",

  "What famous steamship cruises across Lake Wakatipu in Queenstown?",

  "Which limestone rock formations are a major tourist stop on the West Coast?",

  "What words could describe the character of the kea bird?",

  "What weight of wool in kilograms was Shrek as he exited the cave near Bendigo Station in 2004?",

  "What varietal of wine is grown in Central Otago?",

  "Is Cromwell's Big Fruit larger than Robertson's Big Potato?",

  "Is Lake Wanaka deeper than Sydney Harbour?",

  "Is Clutha River deeper than Sydney Harbour?",

  "What is the Māori name for New Zealand greenstone?",

  "In which river of the 1860s Otago gold rush was most gold found?",

  "Does New Zealand have a longer coastline than China?",

  "What sport do the All Whites play?",

  "What year were the All Blacks rugby team last beaten at Eden Park, here in October, 2026?",

  "If 73.6 million people, as of October 2026, live between latitude 45°N and 46°N how many million to nearest whole number live between latitude 45°S and 90°S?"];
  function quizimgid(divo) {

   var thisq=Math.floor(Math.random() * qs.length), wdsleft=0, ii=0, jj=0;

   if (divo.innerHTML.indexOf('-') == 0) {

   var ansis=prompt(qs[thisq], '');

   if (ansis == null) { ansis=''; }

   var wdsare=as[thisq].split(',')[0].split('(')[0].trim().replace(' / ',' ').replace(' at ',' ').toLowerCase().split(' ');

   wdsleft=wdsare.length;

   if (ansis.trim() != '') {

   var qansare=ansis.toLowerCase().split(' ');

   for (ii=0; ii<eval('' + qansare.length); ii++) {

     for (jj=0; jj<eval('' + wdsare.length); jj++) {

        if (wdsare[jj] == qansare[ii]) { wdsleft--;  }

     }

   }

   }

   if (wdsleft > 0) {

     forans=" <font size=1>(for answer " + as[thisq] + ")</font>";

   } else {

     forans=" <font size=6>(Congratulations!!)</font>";

   }

   document.getElementById('myh1').title='' + wdsleft;

   } else {

   divo.style.backgroundImage='url(//www.rjmprogramming.com.au/NZ/IMG_' + divo.innerHTML + '.jpeG)';

   divo.style.backgroundSize='contain';

   divo.style.backgroundRepeat='no-repeat';

   if (woo) {

     if (!woo.closed) {

       woo.close();

       woo=null;

     }

   }

   woo=window.open('//www.rjmprogramming.com.au/PHP/read_exif_off_image_rotate.php?image=http://www.rjmprogramming.com.au/NZ/IMG_' + divo.innerHTML + '.jpeG', '_blank', 'top=100,left=' + eval(-800 + screen.width) + ',width=800,height=800');

   }

  }
… as our way to add some variety to the quiz via a changed grid_fitting_in.html also shown below.
Previous relevant PHP Exif Quiz Geographicals Tutorial is shown below.
PHP Exif Quiz Geographicals Tutorial
Yesterday’s PHP Exif Quiz Tutorial‘s Scenery Geolocation Quiz, as far as follow up “Geographicals Based Interfacings” went, offered …
… off which, it being “inhouse”, a click/tap offers other “Geographicals” (ie. latitude, longitude) based interfacing options … via …
Previous relevant PHP Exif Quiz Tutorial is shown below.
PHP Exif Quiz Tutorial
You guessed it? After yesterday’s …
… we’d be coming up with a …
Yay!!!!!!!!!!!!!!!!
Click here to see what we mean …
Did you know?
Regarding testing PHP web applications, especially up at our public RJM Programming website (more so because newer versions of AlmaLinux Apache/PHP/MySql configurations will drop some of the PHP modules you have previously (re-)installed, and you have to keep, at least for us, “stumbling onto” the issue), you can occasionally encounter …
HTTP Error Code 500 … Internal Error
… issues, as we did at one stage deploying the Scenery Geolocation Quiz above.
To both research the problem, and fix it we access the public RJM Programming AlmaLinux Apache/PHP/MySql website’s WHM cPanel environment’s web server command line accessing Terminal option, going …
Previous relevant PHP Exif Retention off iPhone Images Tutorial is shown below.
PHP Exif Retention off iPhone Images Tutorial
We have a new project on the go. We want to retain Exif information, that is contained within our iPhone’s *.HEIC formatted photographs, all the way through to some format and form of RJM Programming public website set of image media files.
And so, as well as referencing previous work such as that of PHP Exif Image Information Revisit Tutorial and Command Line ImageMagick HEIC to JPEG Image Creation Tutorial, we asked of Google retaining exif information of iPhone images all the way to uploading via filezilla to a web server, finding pertinent and useful the advice …
To retain EXIF data from an iPhone all the way to a web server via FileZilla, you must bypass mobile browser compression and ensure lossless transfer protocols.
AirDrop or Cable Transfer: Transfer the file from the Files app or Photos library to a Mac or PC using AirDrop or a direct USB cable.
And so, that is today’s first step on the new project, where if we cannot retain Exif the project is not worth continuing with.
Keep your hair on! It worked using our ImageMagick conversions to *.jpeG (from iPhone AirDropped *.HEIC) here on this MacBook Air and FileZilla (sftp) uploading those to our new folder on the RJM Programming web server for images like …
… as one example.
Previous relevant PHP Exif Image Information Revisit Tutorial is shown below.
PHP Exif Image Information Revisit Tutorial
Another “revisit” today to the PHP Exif Information web application displayer of PHP Exif Image Zip Mystery Game Hints Tutorial. Now supposing we put this scenario to you …
Now we ask you, in PHP, do you need to know the dimensions of that image to satisfy the requirements above? Well, we first thought (surely it must be) so, but going through the motions of doing today’s work, we realized that, though you can (for the PHP global $image variable with the image URL) …
list($width, $height, $type, $attr) = getimagesize($image);
… in PHP to determine those image dimensions, with the way our web application works, we didn’t need to, as you can “link” PHP with the CSS calc function to bypass any Javascript (eg. DOM) client script approach, abstracting the need to know hard and fast dimensions in PHP (and consequently not running into any window resizing or zooming issues (as a matter of fact, zooming up can make the Exif text information resize up quite nicely thank you very much and don’t mind if I do but we digress and so and usefully))
if ($image != "") {

  list($width, $height, $type, $attr) = getimagesize($image);

  // $iwidth=$width;

  // $iheight=$height;

  // $csswh=" width:" . $iwidth . "px; height:" . $iheight . "px; ";

  $csswh=" width: calc(100% - 10px); height: calc(100% - 220px); text-align: right; margin-right: 20px;  } form { position: absolute; left:50px; top: calc(100% - 45px); width:100%; height:40px; ";

}
… used later on to build up the HTML for the webpage, that also looks much better because the image and Exif wording are more likely to be separated from each other now …
$htmlis="<html><head>" . $javascript . "<style>" . $bcsscolour . " div { font-size:9px; overflow: visible; float:right; " . $csswh . " } </style><meta name='viewport' content='width=device-width, initial-scale=1, minimum-scale=0.25, maximum-scale=8, user-scalable=yes'><title>Exif for " . $image . "</title></head><body style='background-color:" . $bcolour . ";'><h1 id='myh1'>Exif <select onchange=\"if (this.value.length == 2) { top.alinktop=''; top.document.getElementById('dexif').innerHTML=''; top.location.href=top.document.URL.split('index.')[0]+'index-ssmhalf.html'; } else { var zipurl=prompt('Enter image zipfile URL for Mystery Trip game (good for 2 players)','mysterytrip.zip'); if (zipurl != null) { if (zipurl.toLowerCase().indexOf('.zip') != -1) { location.href=document.URL.split('#')[0].split('?')[0] + '?image=' + encodeURIComponent(zipurl); } } } \"><option value=''>for</option><option value=' '>zipfile</option>" . $anotheroption . "</select> " . $image . "</h1><h3>RJM Programming - August, 2016 <a id='ageolocation style='visibility:hidden;' href='#mygeolocation'>Geolocation Context for Photograph" . $various . "</a></h3><h4>Thanks to <a target=_blank title=Useful href=//www.v-nessa.net/2010/08/02/using-php-to-extract-image-exif-data>http://www.v-nessa.net/2010/08/02/using-php-to-extract-image-exif-data</a></h4><div onclick=\"window.open('" . $image . "','_blank','top=5,left=5');\" style='background-color:yellow; background: url(" . str_replace("/Applications/MAMP/htdocs/","http://localhost:8888/",$image) . ") no-repeat; background-position: 5px; background-size: contain; '><br>" . " Image type of " . $image . " is: " . $types[$imagetype];
The changed PHP read_exif_off_image_rotate.php includes these aesthetic and usability improvements you can test for yourself at this live run link.
Previous relevant PHP Exif Image Zip Mystery Game Hints Tutorial is shown below.
PHP Exif Image Zip Mystery Game Hints Tutorial
Just like with the recent PHP Wikipedia Geo Map Google Chart Tutorial we find a use for the talents of Google Chart …
… as we improve the functionality of our “Mystery Trip in Images Game” we started with yesterday’s PHP Exif Image Zip Mystery Game Primer Tutorial.
They are used respectively for …
And so today we can take you to a real zip file of JPEG images of a Mystery Trip, taken on an iPhone that you can try with a second player at this live run link.
The photos were taken deliberately to be obtuse, so as not to give the game away with their visual content. How are we able to give you hints in a programmatical sense? Well, on a JPEG coming out of an iPhone there is geodata (metadata latitude and longitude) stored that we access via Exif image attribute (PHP) methods.
The changed PHP read_exif_off_image_rotate.php includes these “best for two player” game interactive improvements, as well as allowing the user be able to reach this Mystery Game from old URL (simpler) arrangements, from older incarnations (you can read below).
Previous relevant PHP Exif Image Zip Mystery Game Primer Tutorial is shown below.
PHP Exif Image Zip Mystery Game Primer Tutorial
There’s a fair bit to the design of a new game we’re developing that uses the image metadata ideas from PHP Exif Image Information Rotation Tutorial in its workings.
Our early days work starts down the road by collecting zipfile and other pertinent Exif data item ideas off …
As you can see to simplify things we are introducing PHP zipfile coding to group together a set of photographs into the one file concept.
It will be tomorrow that you see a more complete and rounded game solution, and by then we can come up with a name for it too!
Feel free to try the changed read_exif_off_image_rotate.php live run to try out this game in an early incarnation.
Previous relevant PHP Exif Image Information Rotation Tutorial is shown below.
PHP Exif Image Information Rotation Tutorial
The “Stop Press” of PHP Exif Image Information Primer Tutorial as shown below, introduced us to some PHP able to glean quite a bit of really useful Exif information stored with an image file, perhaps straight off a digital camera or mobile phone or mobile tablet. We use the great advice of http://www.v-nessa.net/2010/08/02/using-php-to-extract-image-exif-data to cycle through this information.
This information was of interest regarding …
Sometimes you’ll see Gimp using exif functionality when it becomes aware of the possibility your image could be rotated to advantage
… as we saw Gimp doing this in relation to a photograph image coming off my Android Mobile Phone that we used, in its “rotated-by-Gimp” form, in our recent Mindfulness Follow Up Tutorial. But how about if we want to detect what Gimp detects, to fix this camera orientation issue ourselves? Well, in amongst the Exif information, we found …
IFD0.Orientation: 6 … and then surfing the web we found …… which gave us the means to apply a rotation the way Gimp does. How did we decide to apply this rotation? There are lots of ways, and we decided on this occasion to use CSS and apply a background image, with a transformation, to an HTML div element, also showing all that Exif information. We do this with new PHP you could call read_exif_off_image_rotate.php that has this corresponding new live run link. To get there, from where we’ve last been, take a skeg here.
So, coming back to our “clouds” photo we saw an Exif IFD0.Orientation value of 6 and consulted this useful link to find that we should rotate the image by 90 degrees. We do this with the HTML and inline CSS that goes, for the encasing HTML div element …
<div style='background-color:yellow; background: url(clouds.jpg); opacity:0.6;  norepeat; -webkit-transform: rotate(90deg); -moz-transform: rotate(90deg); -ms-transform: rotate(90deg); -o-transform: rotate(90deg); transform: rotate(90deg); '>

</div>
… in regard to using the original camera image …
Now you may have heard of geographical knowledge stored within photographs, and perhaps you’ll see the live run‘s (turn your head or computer) …
GPS.GPSVersion
… that if fleshed out, with other data elements underneath, would put that image into the category of those where geographical information resides. You may want to start reading more about (the huge topic of) “Geotagging” from this useful Wikipedia webpage … thanks.
Previous relevant PHP Exif Image Information Primer Tutorial is shown below.
PHP Exif Image Information Primer Tutorial
Our (Mac OS X laptop) local MAMP web server is an Apache/PHP/MySql web server. In this environment you can find out a lot with some PHP code as per …
<?php phpinfo(); ?>
… and if, in doing this, you find a reference to the “exif” Exchangeable Image Information functionality existing, you are a lucky candidate to introduce some image “interrogation” (but not this) logic to your PHP code.
We followed a lot of the advice of the very useful link (thanks) to create some PHP called …
… where we may (or maybe not) be waking you up (before we go go ‘Cause I’m not plannin’ on going solo yo (to be honest, like)) … it’s a slow news day … to the fact that images can show on a web page but may not be all you would understand them to be … shock, horror!
Yes, an image that is a GIF in all but name will often display fine even if it’s been given a name like MyNameIs.Jpeg man person.
If this outrage makes you …
… then we’re here to tell you that you need to take a Bex and have a lie down.
In any case, there is a solution to this in PHP if the exif functionality is available to you, and this matter is of concern, and you can see us showing you how to test for that with the code above and this live run. Sometimes you’ll see Gimp using exif functionality when it becomes aware of the possibility your image could be rotated to advantage … we’ve had this happen and thanked Gimp with more than the usual toast and herbal tea offerings you’d be used to giving … we take it?!
Stop Press
As of 8/8/2016 (well, what do you know? … understood everywhere!?) we’re revisiting Exif and PHP to learn more and our tutorial picture now reflects the early days of the revisit and the new resultant PHP we wrote, that you could call read_exif_off_image.php, inspired, largely from http://www.v-nessa.net/2010/08/02/using-php-to-extract-image-exif-data (thanks), and has this live run link, the output of which is pointed to by the red arrow in the tutorial picture.
If this was interesting you may be interested in this too.
If this was interesting you may be interested in this too.
If this was interesting you may be interested in this too.
If this was interesting you may be interested in this too.
If this was interesting you may be interested in this too.
If this was interesting you may be interested in this too.
If this was interesting you may be interested in this too.
If this was interesting you may be interested in this too.
If this was interesting you may be interested in this too.
If this was interesting you may be interested in this too.



The idea of mapping a video's key scenes, mood, pacing, and audio before production resonates with me — it's a lot like working out an anagrampuzzle, where the same pieces only make sense once you rearrange them into the right order. Do you usually sketch the mind map before or after the script is locked?

This is a helpful introduction to mind mapping, especially the explanation of how an unfamiliar .mm file can lead to discovering a practical visual-thinking tool. Mind maps are also useful for planning creative projects: I often map out a video’s key scenes, mood, pacing, and audio needs before production. Once that structure is clear, tools such as Flow Music can create AI background music for videos from a prompt, making it easier to match the soundtrack to each part of the visual plan. Thanks for sharing this accessible primer.

Thanks. Since then, a Shower Songs project at https://www.rjmprogramming.com.au/HTMLCSS/shower_songs.html is an improvement regarding "Radio Play" on mobile platforms.

This is a thoughtful example of using a single-row layout and scroll behavior to reveal media progressively. I especially liked the way the tutorial ties the gallery to real interaction details rather than treating the UI as a static mockup. For readers experimenting with the next stage of visual prototyping, LTX 2.3 Free collects prompt examples and workflow guidance for planning AI video scenes; the same attention to camera movement and timing is useful when turning a storyboard into motion.

I like the single-row radio-play approach for keeping the controls compact while still making each selection clear. When I’m checking a calculation alongside a tutorial, I use StepStat to see the intermediate steps; how do you handle the layout when the playlist gets much longer?