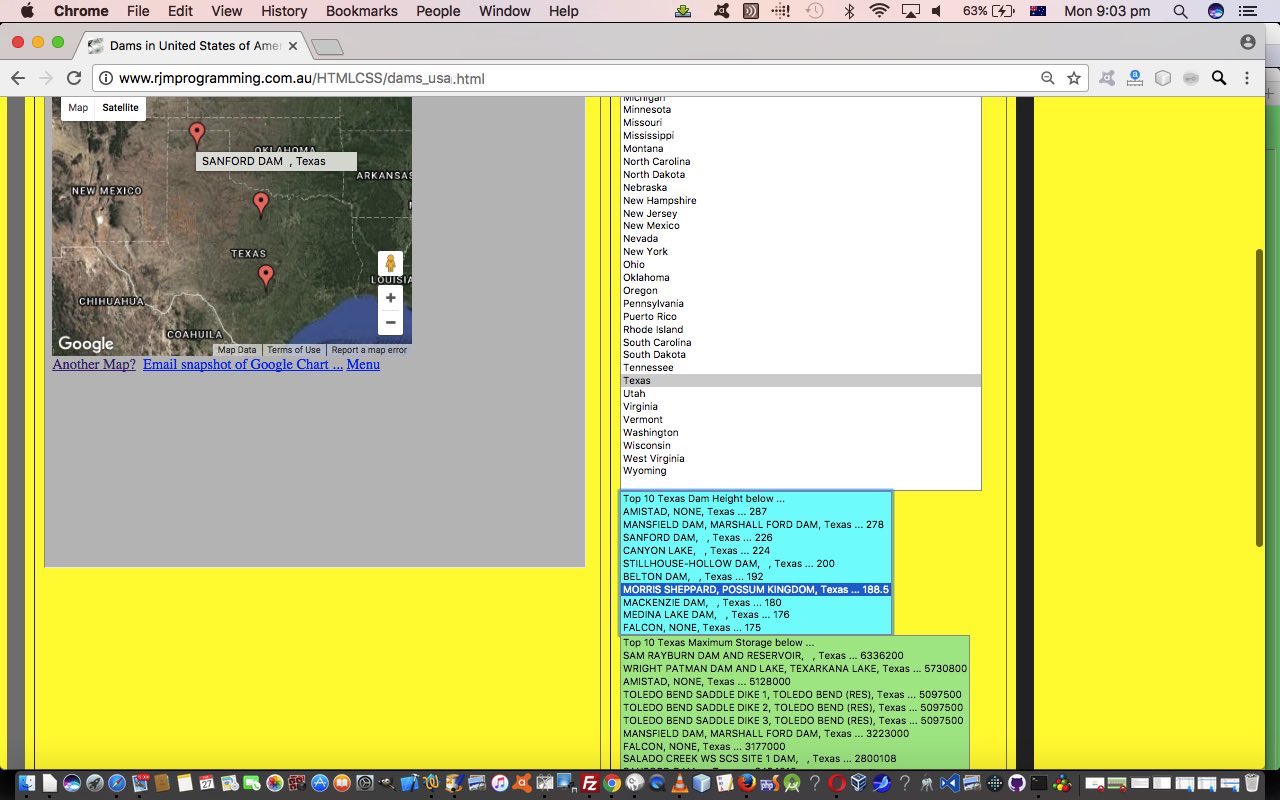
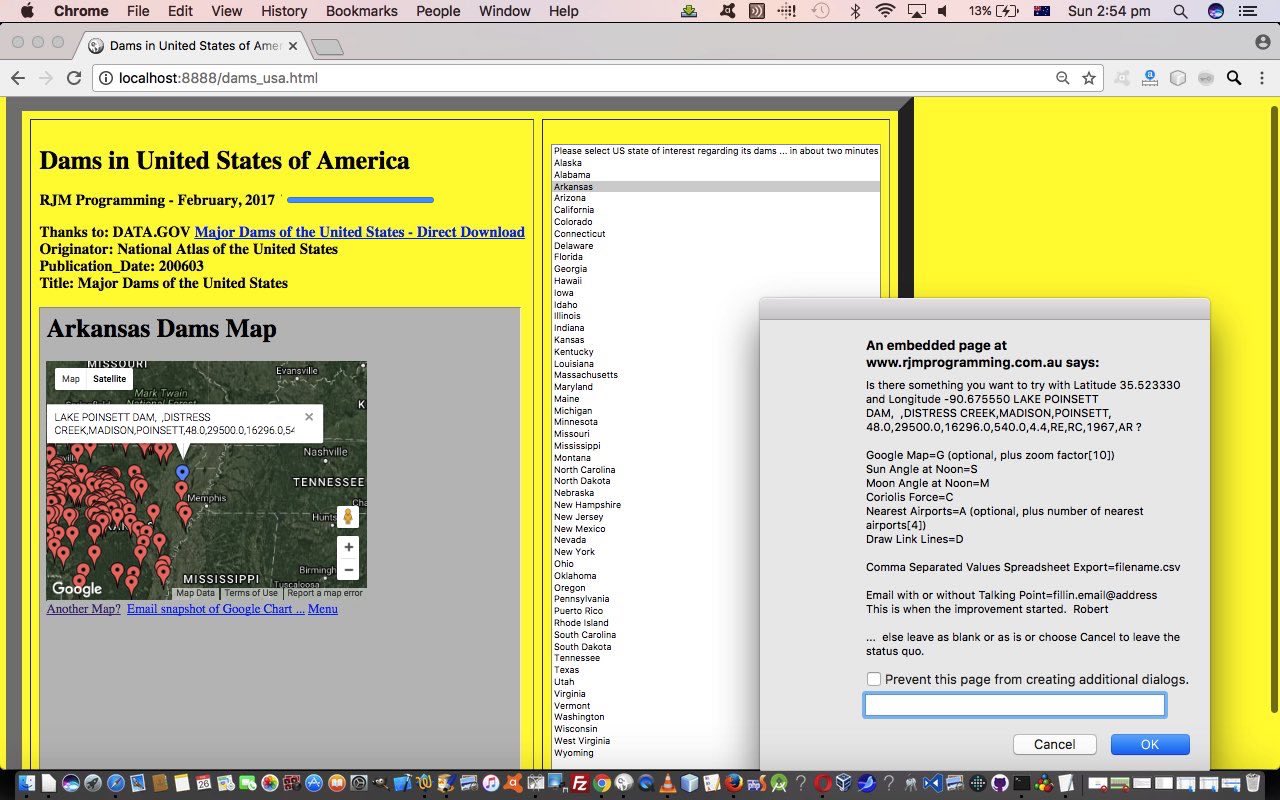
We started out on a new geospatial web application with Dams in the United States Primer Tutorial yesterday, in which we set up the initial handling of the free public data source into Google Charts Map Charts. Along the way, we define a huge array, which can now be viewed in different ways (and that “view” sorted) to present various “lists” or different views plucked from that same data source. This also serves as a tool for optional decluttering of the Map Chart views.
Think a lot of us are attracted to lists involving numbers, so we latch onto the National Atlas of the United States Dam data fields (via DATA.GOV Major Dams of the United States – Direct Download link) …
- Dam Height
- Maximum Storage
- Normal Storage
- Surface Area
- Drainage Area
… to show the user “Top 10” lists that relate to (a view of) all of the United States of America dam data, or on a state selection basis. These are shown in HTML select element dropdown elements that when clicked just show Map Charts with that Dam displaying, or others of its ilk also displayed. And so this can open up display mechanisms that are both …
- not restricted to the one state … and that are …
- less cluttered
So onward and upward with HTML and Javascript dams_usa.html code that changed in HTML and Javascript this way and that can be seen in action at this HTML and Javascript live run link.
Previous relevant Dams in the United States Primer Tutorial is shown below.
We’re starting out on a new geospatial web application today. We’re going to call it “Dams in the United States of America” because we are using a public data source for this information giving …
- Names of Dam
- Location Place Information for Dam … State, County
- Geospatial Latitude and Longitude
- Owner of Dam Information
- Height of Dam, Surface Area etcetera
- Year Dam Was Built
- Type of Dam
… and that public data source webpage we found was at this DATA.GOV Major Dams of the United States – Direct Download link. It, in turn attributes the data to …
      Originator: National Atlas of the United States

      Publication_Date: 200603

      Title: Major Dams of the United States
… so thanks, everybody. It is great to find these public data sources.
What happened on a MacBook Pro laptop downloaded this tar file was that on double click it it extracted various files, the most interesting one being …
dams00x020.dbf
… which Opens With LibreOffice into a Spreadsheet that we File -> Export(ed) as HTML that forms the “child” contents of our HTML and Javascript “parent”‘s iframe element today. Just as with Learning Programming Short Quiz Tutorial‘s (gleeful) use of the Javascript DOM document.body.innerText (rather than our usual Client Pre-emptive Javascript Iframe document.body.innerHTML usage, and thanks to this useful link regarding cross-browser issues here) saves us heaps of parsing (out the <‘s and >’s) HTML difficulties, and we end up with a simple parsing statement that goes …
dam_data_arr=aconto.body.innerText.split(String.fromCharCode(10));
… that ends up giving you a huge, and we mean huge … we leave two minutes for loading purposes … array to analyze for Dam reporting purposes hot damn!
As you might surmise by Geospatial Latitude and Longitude above, we’ll be hard pressed not to be tempted by reporting this Dam data via our Google Charts Map Chart interfacing web application (with its inhouse “select” event (onclick) additional functionalities), that we POST to via an HTML form element with a target property pointing at (another) HTML iframe element’s name property.
There’s a fair bit more to go into with this project, but we’ll take a breather there for now to let you know that you can try this for yourself with this live run link that has this, purely clientside (because of our Client Pre-emptive Javascript Iframe design) HTML and Javascript dams_usa.html code for your perusal.
If this was interesting you may be interested in this too.
If this was interesting you may be interested in this too.


