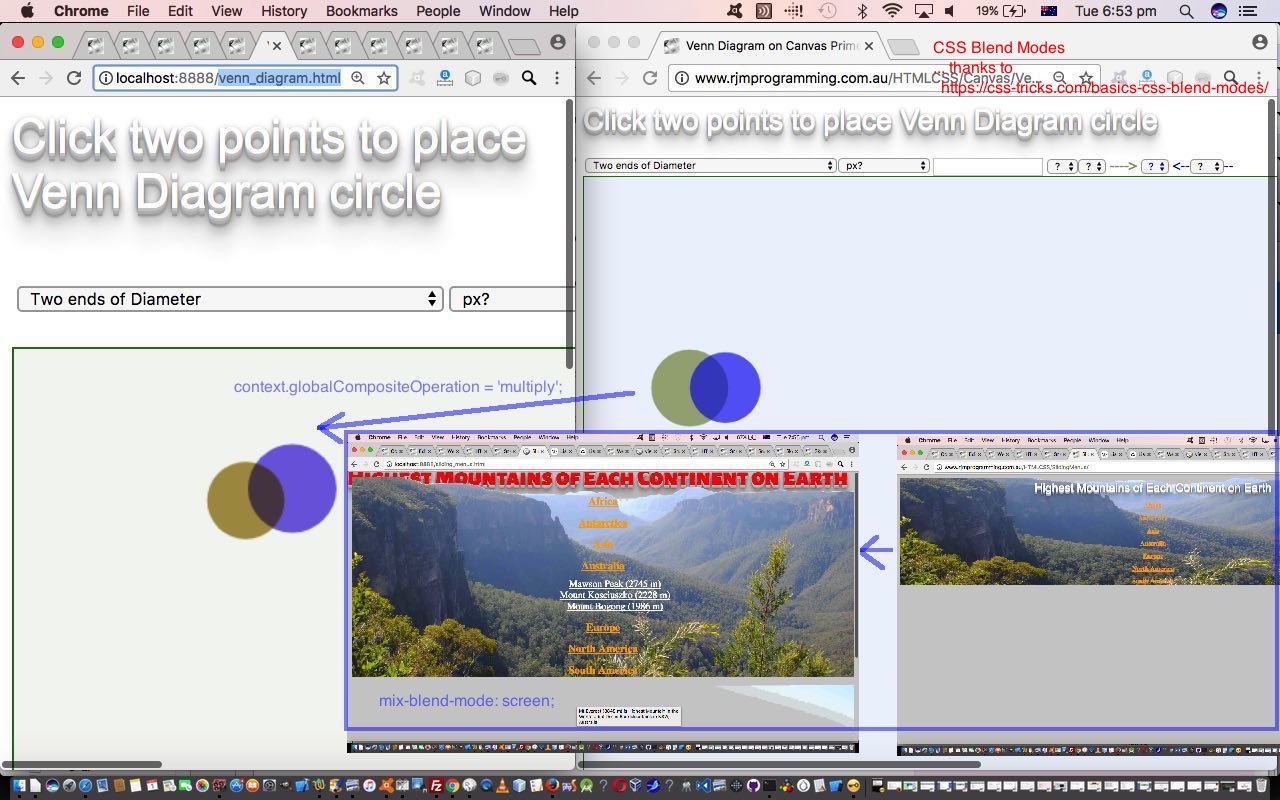
We read a great website, thanks, the other day, talking about CSS (multiple background, and other) “blending”, basically concerning behaviours that happen when two colours “overlap” in a webpage. This webpage talked about this in terms of your predictable HTML element types, and also with the canvas element introduced with HTML5, and for which we couldn’t be more keen, if we tried … and we’ve been told how trying we are … boom, boom!
In this context, regarding canvas elements, we’d never used …
var canvas = document.getElementById('canvas');

var ctx = canvas.getContext('2d');

ctx.globalCompositeOperation = 'multiply';
Wow! Nala said. Bow! I replied. … Down, girl! Besides, shouldn’t you be curtsying?!
And in that webpage, guess what caught my eye (sorry, Nala sees in black and white) was the Venn Diagram, and so, thought we’d try this technique on our own Venn Diagram application, that uses a canvas element, last talked about at HTML/Javascript/PHP Canvas Venn Diagram Import Tutorial as shown below. It’s a subtle change that you can see play out with venn_diagram.html (changed this way), but we’re pleased that this functionality is “out there”, and hope ideas spring eternal from your cranium regarding ideas here. You can see this subtlety in play at the top and left parts of today’s tutorial picture.
So what’s with the mountains web application at the bottom right? Well, do you remember HTML/CSS/Javascript Sliding Menus Primer Tutorial? It had an h1 heading. Well, we replace that h1 (by blanking its innerHTML property using Javascript DOM) and put in another, mainly adding new CSS as per
@import url(https://fonts.googleapis.com/css?family=Alegreya+Sans+SC:900);


body {

   background-color: #cdcdcd;

   color: red;

   text-align:center;

   height: 600px;


   padding: 20;

}


header {

  padding: 120px 50px 170px;

  background-size: cover;

}

header h1 {

  position: absolute;

  top:10px;

  left:0px;

  z-index: -6;

  font-family: 'Alegreya Sans SC', sans-serif;

  font-size: 40px;

  color: red;

  opacity: 1.0;

  mix-blend-mode: screen;

  padding: 0;

  margin: 0;

  width:100%;

  text-align:center;

  line-height: 0.5;

}
… into sliding_menus.html (changed this way), with the “star” line of (CSS) code “mix-blend-mode: screen;“.
Another important CSS thing to note here, to help “import” a Google font, thanks, is the use of CSS “import” (that the Mac iWeb template based RJM Programming landing page also makes use of) rules … okay?!
Previous relevant HTML/Javascript/PHP Canvas Venn Diagram Import Tutorial is shown below.
It’s been a year and a half since the last HTML/Javascript Canvas Venn Diagram Email Tutorial as shown below concerning our web application that can create online Venn Diagrams. On that last occasion we set up a system of sharing email communication regarding these Venn Diagrams, and the screenshot of that Venn Diagram took the form of an email body containing a link to an RJM Programming web server png image file, effectively Exporting the Venn Diagram. With what we know now email possibilities involve …
- email with or without attachment using PHP mail function via server-side logic … or …
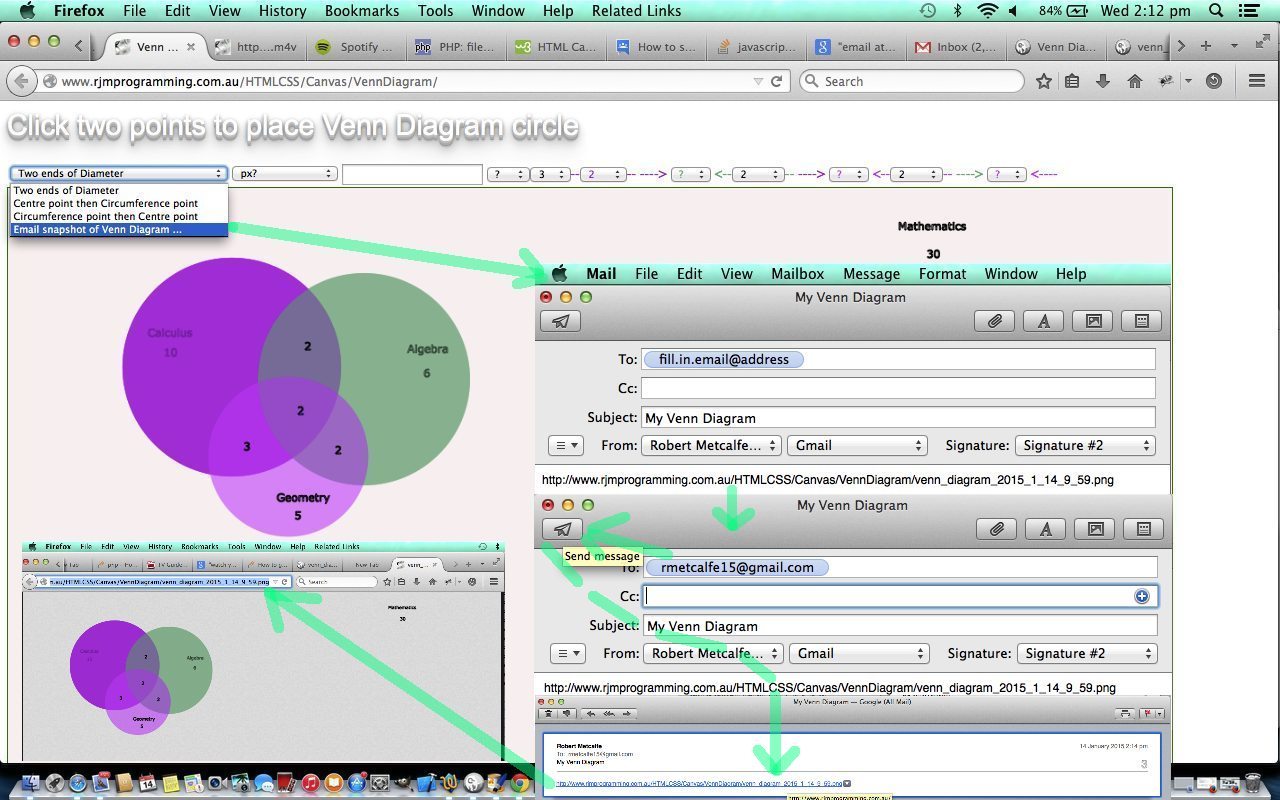
- email via mailto: tags linking to an RJM Programming web server image file as a snapshot of the HTML5 canvas element’s contents … or …
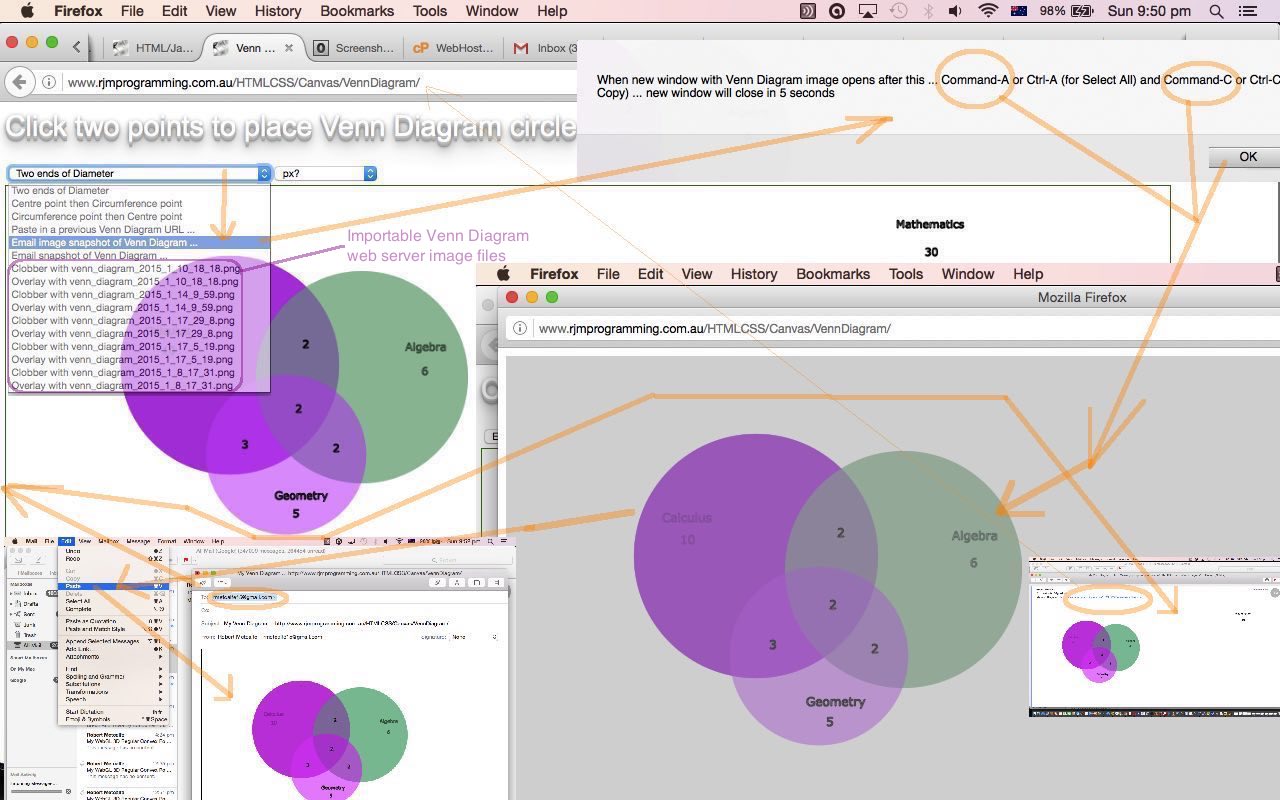
- email via mailto: tags with a body content reflecting the HTML5 canvas element’s contents as a clipboard image pasted into it, via the canvas element’s toDataURL() method, teamed up with a window.open popup window of the toDataURL image data, which can be selected and copied, optionally, by the user themselves, should they wish this to make their email more self explanatory
… and so with our Venn Diagram email functionality we offer those last two possibilities, the second of which is new functionality.
We also add on, today, an Importing functionality, making use of the web server image file from the first, and original, of those two emailing possibilities above. The HTML5 canvas element’s drawImage() method is used to copy that web server image data onto the canvas.
In order to collect this Importable web server image file list into an HTML select (dropdown) element we make use of PHP (in an HTML iframe element) and the glob() method to collect a list of files in a directory, according to a file specification. We do that during the web page’s onload event, and look back at a parent.document select element.
Link to some downloadable HTML programming code … rename to venn_diagram.html (and how it changed … venn_diagram.html) and its live run
Link to some new downloadable PHP programming code … rename to venn_diagram.php (and how it changed … venn_diagram.php)
Previous relevant HTML/Javascript Canvas Venn Diagram Email Tutorial is shown below.
Was reminded about the previous HTML/Javascript Canvas Venn Diagram Tutorial as shown below because of a pleasant comment from a user making use of its functionality … thanks and yayyyyyyy team!
Looking over it again, though, some functionality to allow a snapshot image of the canvas element be allowed to be accessible via an email link to this saved image on the rjmprogramming.com.au domain, would be useful methinks … forsooth?!
Yet again we need PHP, because we are writing a file on to our web server, so we’ll just have to disappoint those without PHP … sorrrrrryyyy.
At the client side, with Javascript, you’ll find the HTML5 Javascript’s canvas method toDataURL() useful. How?
- onload arrange a good filename to be supplied via a Javascript DOM save to a form‘s hidden input HTML field
- the user asks for an Email Snapshot to be emailed and the webpage uses Javascript DOM to save to its form’s hidden input HTML field the result of the canvas’s call to toDataURL()
- programmatically post the form (by programmatically clicking the form’s submit button) with a target pointing to id of an iframe with a URL of our venn_diagram.php
- have venn_diagram.php (of that iframe) create a png image from the data URL and the file name posted across using PHP’s base64_decode and file_put_contents() methods (great to use with data URL data) … thanks to this link for great ideas
- back at venn_diagram.html use Javascript DOM to update an HTML a tag’s mailto: (href property) link with the name of the png image file created in previous step being the email’s body, which, on arrival at the recipient, becomes a link to the snapshot image on the web, viewable with their default web browser
- programmatically click the HTML a tag to open your local client mail program with a primed email
- change the email address appropriately, and anything else you’d like to change
- click the Send button
- … sun goes down … sun comes up … (email) recipient wakes from a dream about pins, boulders and lemon curry (you had to be there) … reads email … is a little shocked … but … clicks link of email …
- recipient sees the Venn Diagram (snapshot) in their default web browser
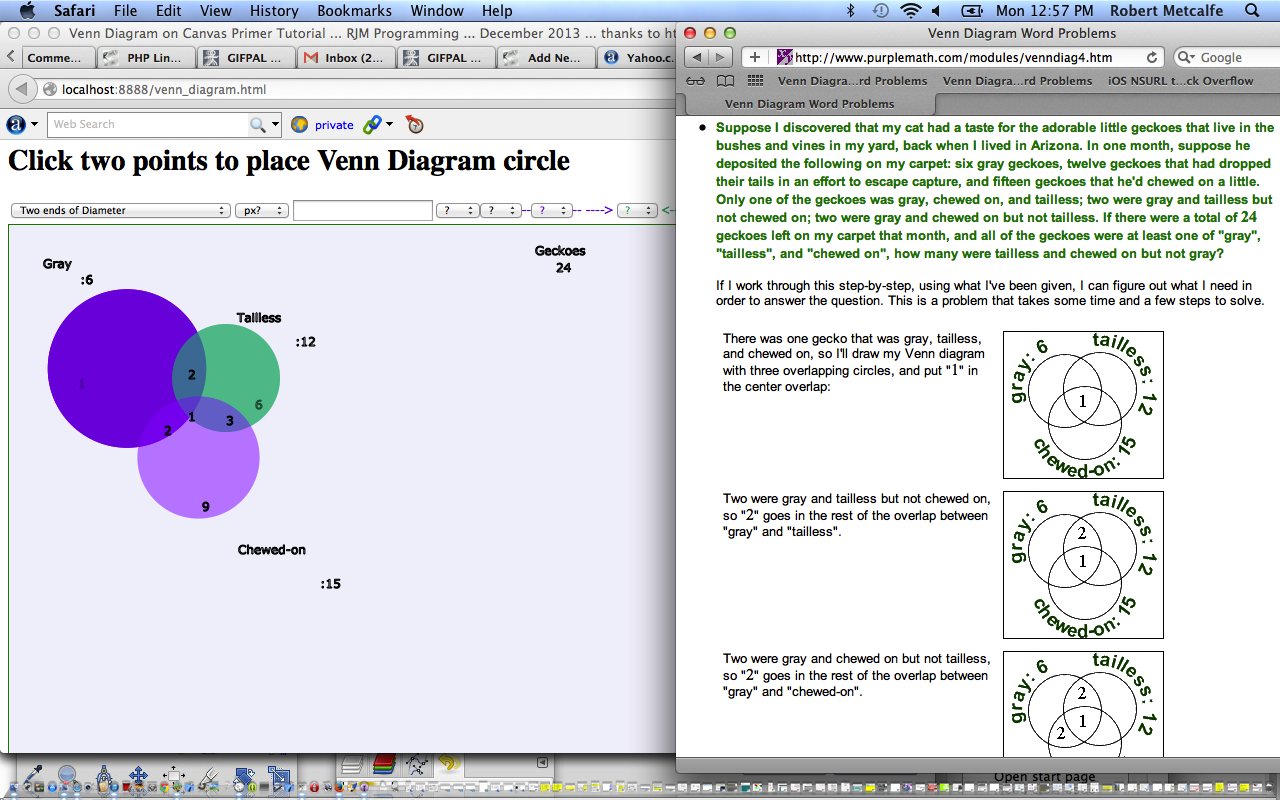
Here is a live run showing some client-side basics in HTML and Javascript that can be used to create your own Venn Diagrams. Were Venn Diagrams something you learnt at school, to do with “set theory”? It can be an interesting area of mathematics, and statistics, perhaps. In today’s tutorial we do an example involving Geckoes … yes, Geckoes … not echoes … but, Geckoes … the inspiration for which came from this great link (thanks). You can read about it from Wikipedia here.
This HTML/Javascript solution uses an HTML canvas element, which you can first read about, at this blog, here.
You may want to read more at HTML Canvas Reference as a generic reference, or here, at the tutorial javascript – How do I add a simple onClick event handler to a canvas element? – Stack Overflow.
Here is a very useful link that helped with an algorithm to determine if two circles intercept … thanks.
Link to some downloadable HTML programming code … rename to venn_diagram.html (and how it changed … venn_diagram.html)
Link to some new downloadable PHP programming code … rename to venn_diagram.php
Previous relevant HTML/Javascript Canvas Venn Diagram Tutorial is shown below.
Here is a live run showing some client-side basics in HTML and Javascript that can be used to create your own Venn Diagrams. Were Venn Diagrams something you learnt at school, to do with “set theory”? It can be an interesting area of mathematics, and statistics, perhaps. In today’s tutorial we do an example involving Geckoes … yes, Geckoes … not echoes … but, Geckoes … the inspiration for which came from this great link (thanks). You can read about it from Wikipedia here.
This HTML/Javascript solution uses an HTML canvas element, which you can first read about, at this blog, here.
You may want to read more at HTML Canvas Reference as a generic reference, or here, at the tutorial javascript – How do I add a simple onClick event handler to a canvas element? – Stack Overflow.
Here is a very useful link that helped with an algorithm to determine if two circles intercept … thanks.
Link to some downloadable HTML programming code … rename to venn_diagram.html
If this was interesting you may be interested in this too.
If this was interesting you may be interested in this too.
If this was interesting you may be interested in this too.
If this was interesting you may be interested in this too.


