Sometimes you come across an error that is a bit of a dead end regarding access because the error comes from within the “bowels” of some API, perhaps. So it was with us recently, on our current (web application) project “Dams in the United States”, and interfacing to the Google Charts Map Chart but getting the “data” error …
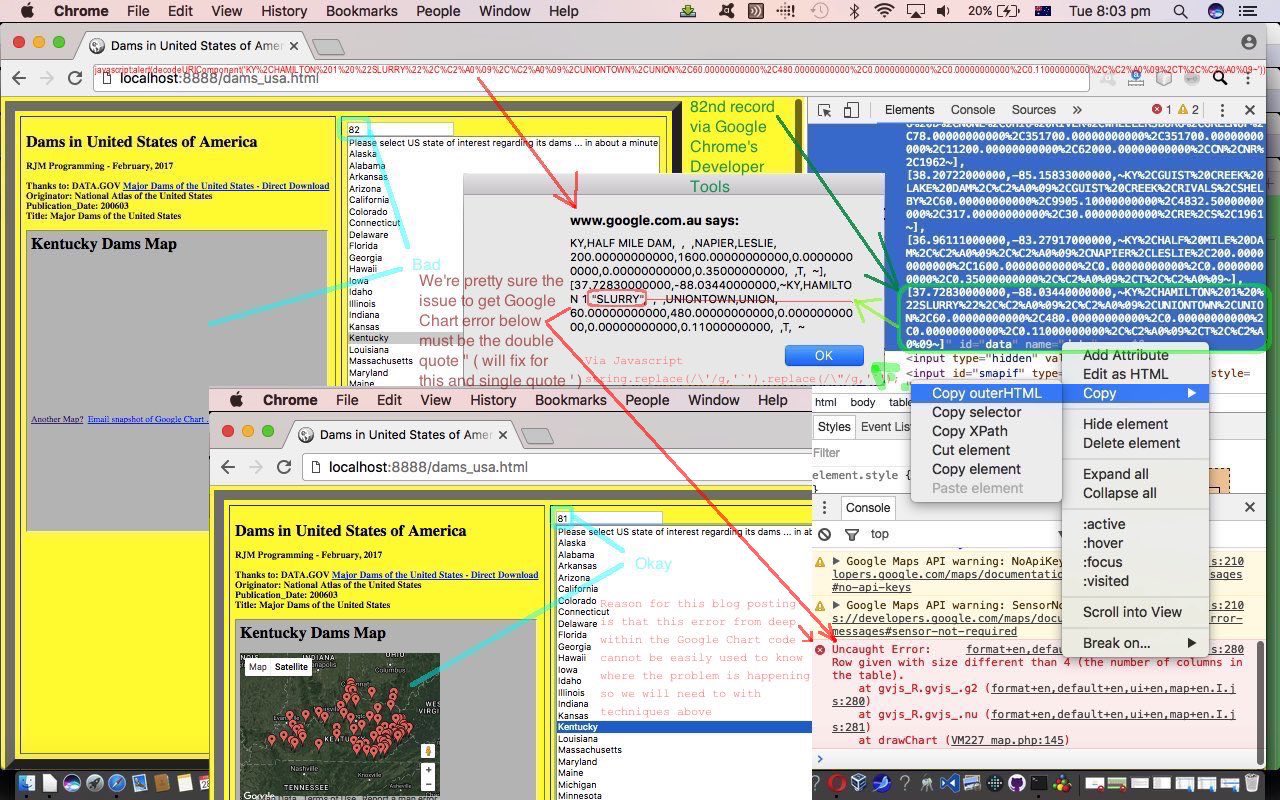
Uncaught Error:

Row given with size different than 4 (the number of columns in the table).
Now there is nothing in that message to show where this error was triggered in the (quite large) number of data records posted to the Google Chart Map Chart. The other thing about the error is that it is “sporadic”, an important thing to know about an error. “Sporadic” errors often relate to “data”, because of the flexibility of the potential Dam name data. Up to finding this error we had been seeing success, but for a while we were stumped about imagining what could have caused it, especially given that the data coming into the Google Chart Map Chart is encodeURIComponent([data]) data (ie blank is %20 etcetera).
But taking a break from our non-lateral period of thinking … fresh air can help … dank air for moister solutions … we latched onto an idea to get our web application to be able to output however many records (of a result set) via (optionally, and only visibly during this troubleshooting period) using an HTML input type=number element to allow the user to make this happen with positive entries. We did this for the troublesome Kentucky Dam data set, so that …
- showing all Kentucky dams caused Google Chart error above … and by creeping up on it we found that …
- showing 81 Kentucky dams didn’t cause the Google Chart error … but that …
- showing 82 Kentucky dams did show the Google Chart error
… and so we opened Google Chrome’s Developer Tools via …
Open Google Chrome then Open Webpage of interest then "Three Dots" button -> More Tools -> Developer Tools
… to drill down into the innards of the HTML form element whose data will be posted to the offending Google Chart Map Chart in the HTML iframe element, and further drilled into the HTML input element named “data” to glean via the Developer Tools Copy -> Copy outerHTML menu the 82nd array member. From that we could construct a Bookmarklet as per …
javascript:alert(decodeURIComponent('~KY%2CHAMILTON%201%20%22SLURRY%22%2C%C2%A0%09%2C%C2%A0%09%2CUNIONTOWN%2CUNION%2C60.00000000000%2C480.00000000000%2C0.00000000000%2C0.00000000000%2C0.11000000000%2C%C2%A0%09%2CT%2C%C2%A0%09~'))
… resulting in …
~KY,HAMILTON 1 "SLURRY", , ,UNIONTOWN,UNION,60.00000000000,480.00000000000,0.00000000000,0.00000000000,0.11000000000, ,T,
… and which “got the reasoning juices going” that the double quote (“) could well be causing delimitation errors that could cause a Google Chart Map Chart data error. We also thought another suspect here would be the single quote (‘) character. Where needed, the generic Javascript RegEx replace syntax …
string.replace(/\'/g,'`').replace(/\"/g,'`');
… could fix the problem. And this turned out to be true, at least for Kentucky Dam data, and all the rest since, that we’ve seen.
Today’s tutorial picture shows many of the issues of the discussion above in context, for your perusal.
These changes from some time back show what was involved, but please don’t take these code files as anything like the latest versions. But we thought we’d bring all this up while in a maintenance frame of mind with memory management (which you can read about with yesterday’s Dams in the United States Memory Tutorial as shown below) and debugging issues being prominent recently.
Previous relevant Dams in the United States Memory Tutorial is shown below.
If you develop web applications on a laptop, and am categorizing the MacBook Pro (Mac OS X) in that category, you can get away with sloppier memory considerations. Combine that with a lot of public sourced data in the first place and “woh” might be the go. And so it has shaped up to be until today‘s crackdown regarding the big ticket memory hungry items below being open too long, or being too big (ie. memory hungry) within themselves …
- HTML iframe element itself whose src property is set to that HTML that resulted from the LibreOffice spreadsheet Export As HTML exercise … was open at document.body onload event, and from then on
- a global array called dam_data_arr that stores the HTML iframe element (equivalent of) property innerText (Javascript) split into lines as mentioned way below … was open at the HTML iframe’s onload event (well, sort of), and from then on
- a global array called dam_name_etc that extracts dam information from those lines (or records) … open at the HTML iframe’s onload event (well, sort of), and from then on, and needs to be, though the redesign says that it should not be sorted, resulting in a tiny extra temporary array needed to store state names, for a bit
- top 10 list global arrays dam_drain_area, dam_surface_area, dam_normal_storage, dam_maximum_storage, dam_nid_height … open at the HTML iframe’s onload event (well, sort of), and from then on, and they need to be, but they don’t have to be nearly as verbose (or long winded) as they used to be
… and it is by moving to an iPad or iPhone or Android device with your testing, just with their “native” web browser, you get to appreciate the “Frankenstein” of a web application, you may have created. The symptoms of memory issues, on Safari, on iPad, can be that (words to the affect) …
Problem with webpage. Will reload.
… which is not a too unfriendly Apple approach to such issues … thanks … but is only going to solve your issues if it is to do with another webpage badly contributing to the memory loss that you can close in the meantime. But what if the problem is genuinely with the page you were on (and wrote … ugh!)? Well, as of the morning of 28th February 2017 Sydney, Australia time, this was a problem with our “Dams in the United States” web application we last visited with Dams in the United States Lists Tutorial as shown below. So we spent the morning working on issues with our laziness, and improved the situation via …
- HTML iframe element itself whose src property is set to that HTML that resulted from the LibreOffice spreadsheet Export As HTML exercise … was open at document.body onload event, and from then on … but now effectively cleared from memory as soon as dam_data_arr (below) is created via (Javascript) split
- a global array called dam_data_arr that stores the HTML iframe element (equivalent of) property innerText (Javascript) split into lines as mentioned way below … was open at the HTML iframe’s onload event (well, sort of), and from then on … but now is cleared from memory as soon as the other global arrays (below) have been created via a looping through of all its records, that is where those other global arrays are created (all within the HTML iframe’s onload logic)
- a global array called dam_name_etc that extracts dam information from those lines (or records) … open at the HTML iframe’s onload event (well, sort of), and from then on, and needs to be, though the redesign says that it should not be sorted, resulting in a tiny extra temporary array needed to store state names, for a bit
- top 10 list global arrays dam_drain_area, dam_surface_area, dam_normal_storage, dam_maximum_storage, dam_nid_height … open at the HTML iframe’s onload event (well, sort of), and from then on, and they need to be, but they don’t have to be nearly as verbose (or long winded) as they used to be … because now all the columns of the records from three and on are replaced with a single (integer) indexer of relevant dam_name_etc record (that is now not sorted)
… so that by the afternoon of 28th February 2017 Sydney, Australia things were much better for “hanging hats”.
Of course those early pioneers of PC development knew all about memory restrictions, and were skilled at working around this, but by the same token, at least in those really early days they were not dealing with graphics very often. Yet, it is perhaps good to model the programming on a minimalist set of resources. You could first unit test on the smallest mobile phone perhaps, and there are ways with IDEs to work the coding to a designated mobile device, real or simulated, and maybe if you suspect you are pushing the limits, develop under these stringent conditions, straight away, or at the earliest juncture possible.
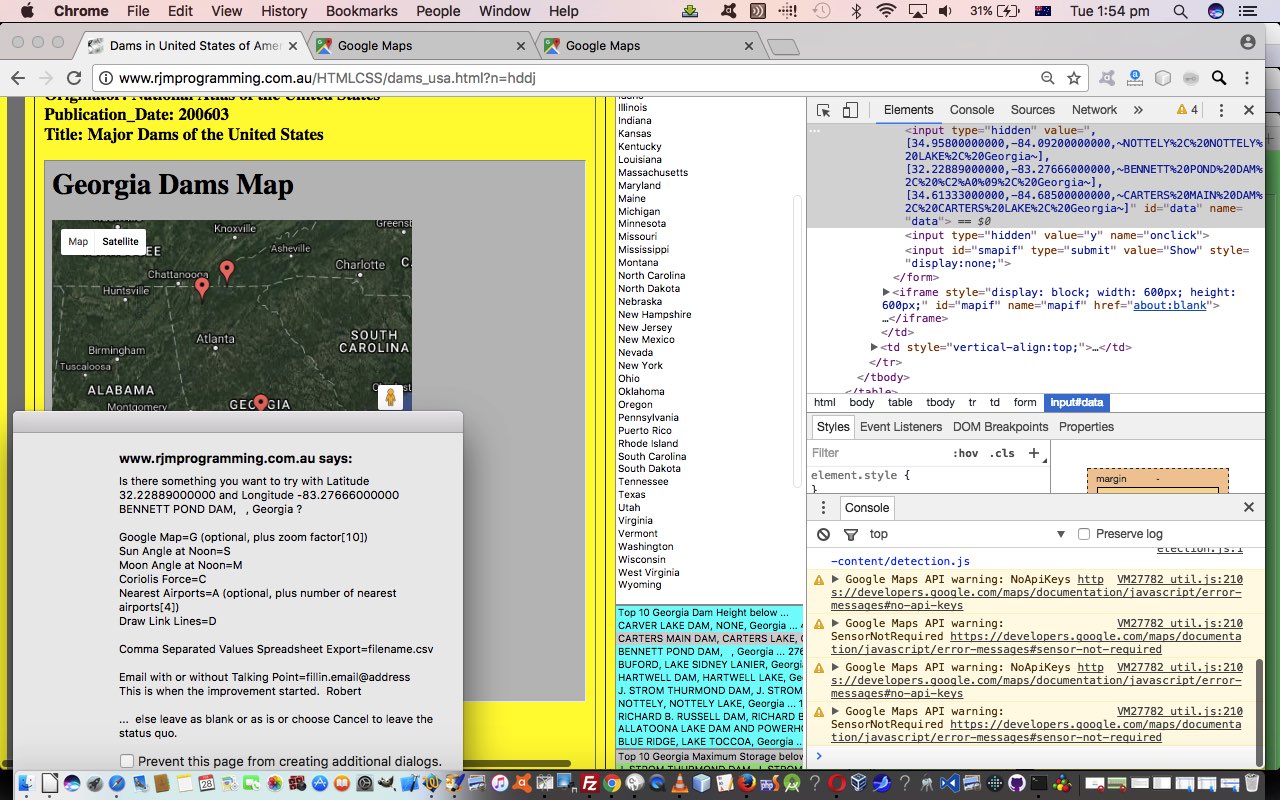
A tool to aid with your laptop web application debugging, other than our beloved Javascript alert box method, is a web inspector, which we’ve talked about in terms of Firefox’s great FireBug product, or Safari’s “out of the box” web inspector, and in today’s tutorial picture, you can see in play …
Open Google Chrome then Open Webpage of interest then "Three Dots" button -> More Tools -> Developer Tools
… gets you to Google Chrome’s excellent “out of the box” product, that with memory issues, is as much as anything, an exercise in “never seeing red” errors (or behaviour caused by a lack of available memory). Now we realize the issues today are happening with mobile device work, yes, but you have to …
- still have it work for laptops, anyway … and …
- the web inspector of the laptop is going to point you, via red errors perhaps, both if you are creeping successfully, and/or the memory problem place in the code, directly … along with alert box work, speaking personally
So sideways and optimistic we go, having built a more solid platform for future enhancements, and put the lists in a third column (hopefully more obviously visible), with today’s HTML and Javascript dams_usa.html code that changed in HTML and Javascript this way, to remedy some mobile device (at least) memory issues, and that can be seen in action at this HTML and Javascript live run link.
Previous relevant Dams in the United States Lists Tutorial is shown below.
We started out on a new geospatial web application with Dams in the United States Primer Tutorial yesterday, in which we set up the initial handling of the free public data source into Google Charts Map Charts. Along the way, we define a huge array, which can now be viewed in different ways (and that “view” sorted) to present various “lists” or different views plucked from that same data source. This also serves as a tool for optional decluttering of the Map Chart views.
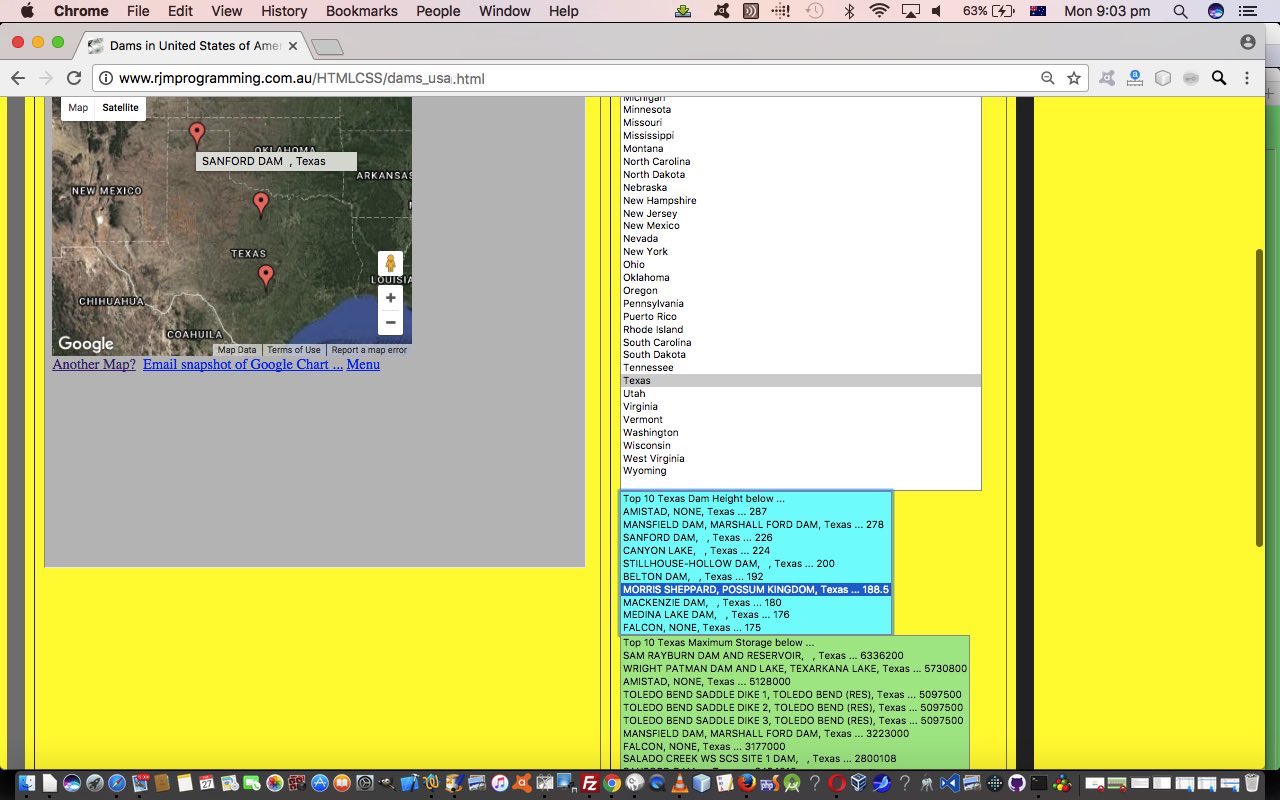
Think a lot of us are attracted to lists involving numbers, so we latch onto the National Atlas of the United States Dam data fields (via DATA.GOV Major Dams of the United States – Direct Download link) …
- Dam Height
- Maximum Storage
- Normal Storage
- Surface Area
- Drainage Area
… to show the user “Top 10” lists that relate to (a view of) all of the United States of America dam data, or on a state selection basis. These are shown in HTML select element dropdown elements that when clicked just show Map Charts with that Dam displaying, or others of its ilk also displayed. And so this can open up display mechanisms that are both …
- not restricted to the one state … and that are …
- less cluttered
So onward and upward with HTML and Javascript dams_usa.html code that changed in HTML and Javascript this way and that can be seen in action at this HTML and Javascript live run link.
Previous relevant Dams in the United States Primer Tutorial is shown below.
We’re starting out on a new geospatial web application today. We’re going to call it “Dams in the United States of America” because we are using a public data source for this information giving …
- Names of Dam
- Location Place Information for Dam … State, County
- Geospatial Latitude and Longitude
- Owner of Dam Information
- Height of Dam, Surface Area etcetera
- Year Dam Was Built
- Type of Dam
… and that public data source webpage we found was at this DATA.GOV Major Dams of the United States – Direct Download link. It, in turn attributes the data to …
      Originator: National Atlas of the United States

      Publication_Date: 200603

      Title: Major Dams of the United States
… so thanks, everybody. It is great to find these public data sources.
What happened on a MacBook Pro laptop downloaded this tar file was that on double click it it extracted various files, the most interesting one being …
dams00x020.dbf
… which Opens With LibreOffice into a Spreadsheet that we File -> Export(ed) as HTML that forms the “child” contents of our HTML and Javascript “parent”‘s iframe element today. Just as with Learning Programming Short Quiz Tutorial‘s (gleeful) use of the Javascript DOM document.body.innerText (rather than our usual Client Pre-emptive Javascript Iframe document.body.innerHTML usage, and thanks to this useful link regarding cross-browser issues here) saves us heaps of parsing (out the <‘s and >’s) HTML difficulties, and we end up with a simple parsing statement that goes …
dam_data_arr=aconto.body.innerText.split(String.fromCharCode(10));
… that ends up giving you a huge, and we mean huge … we leave two minutes for loading purposes … array to analyze for Dam reporting purposes hot damn!
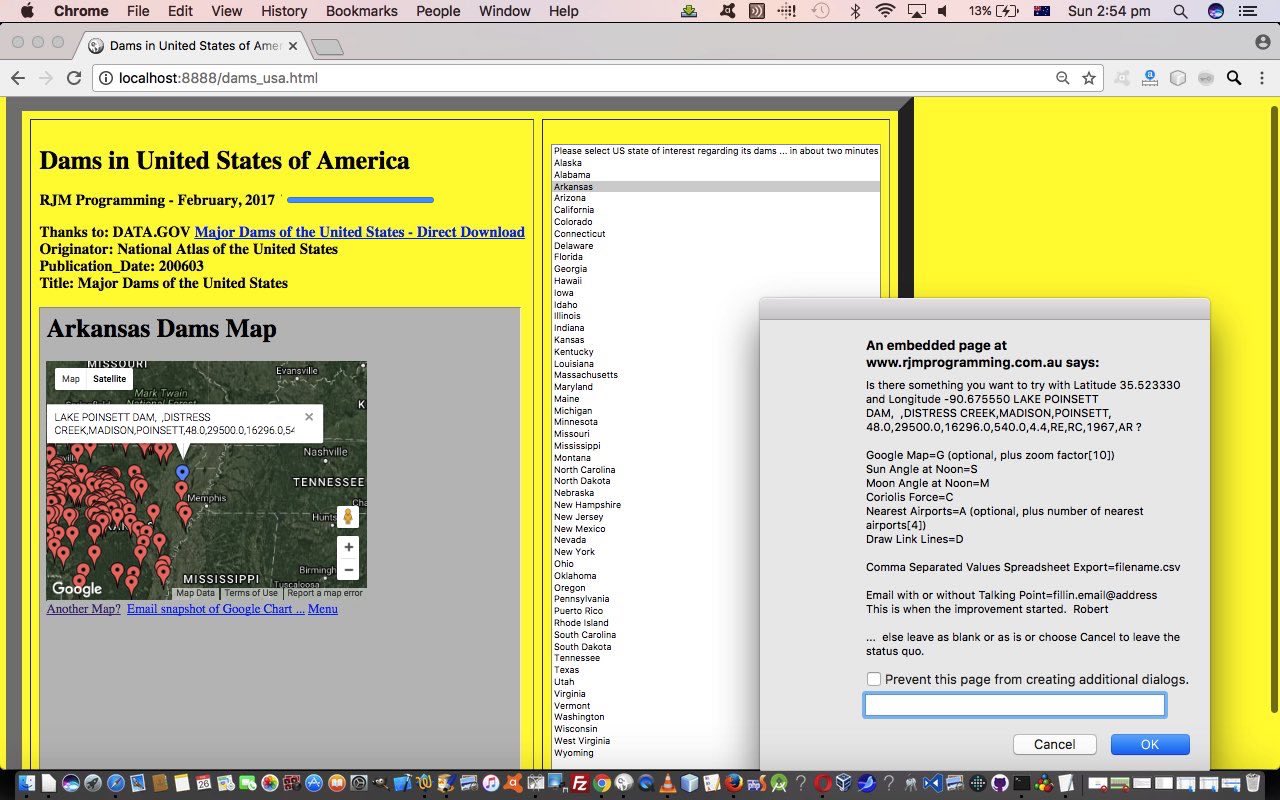
As you might surmise by Geospatial Latitude and Longitude above, we’ll be hard pressed not to be tempted by reporting this Dam data via our Google Charts Map Chart interfacing web application (with its inhouse “select” event (onclick) additional functionalities), that we POST to via an HTML form element with a target property pointing at (another) HTML iframe element’s name property.
There’s a fair bit more to go into with this project, but we’ll take a breather there for now to let you know that you can try this for yourself with this live run link that has this, purely clientside (because of our Client Pre-emptive Javascript Iframe design) HTML and Javascript dams_usa.html code for your perusal.
If this was interesting you may be interested in this too.
If this was interesting you may be interested in this too.
If this was interesting you may be interested in this too.
If this was interesting you may be interested in this too.


