Just like with the W3schools How To series inspired HTML and Javascript and CSS Survey Levelling Tutorial we have another W3schools inspired web application idea called “Sticky Header”.
To quote W3schools regarding the design aspects to the fixed_top.html “proof of concept” web application …
On Scroll Sticky Header
The header will stick to the top when you reach its scroll position.
Scroll back up to remove the sticky effect.
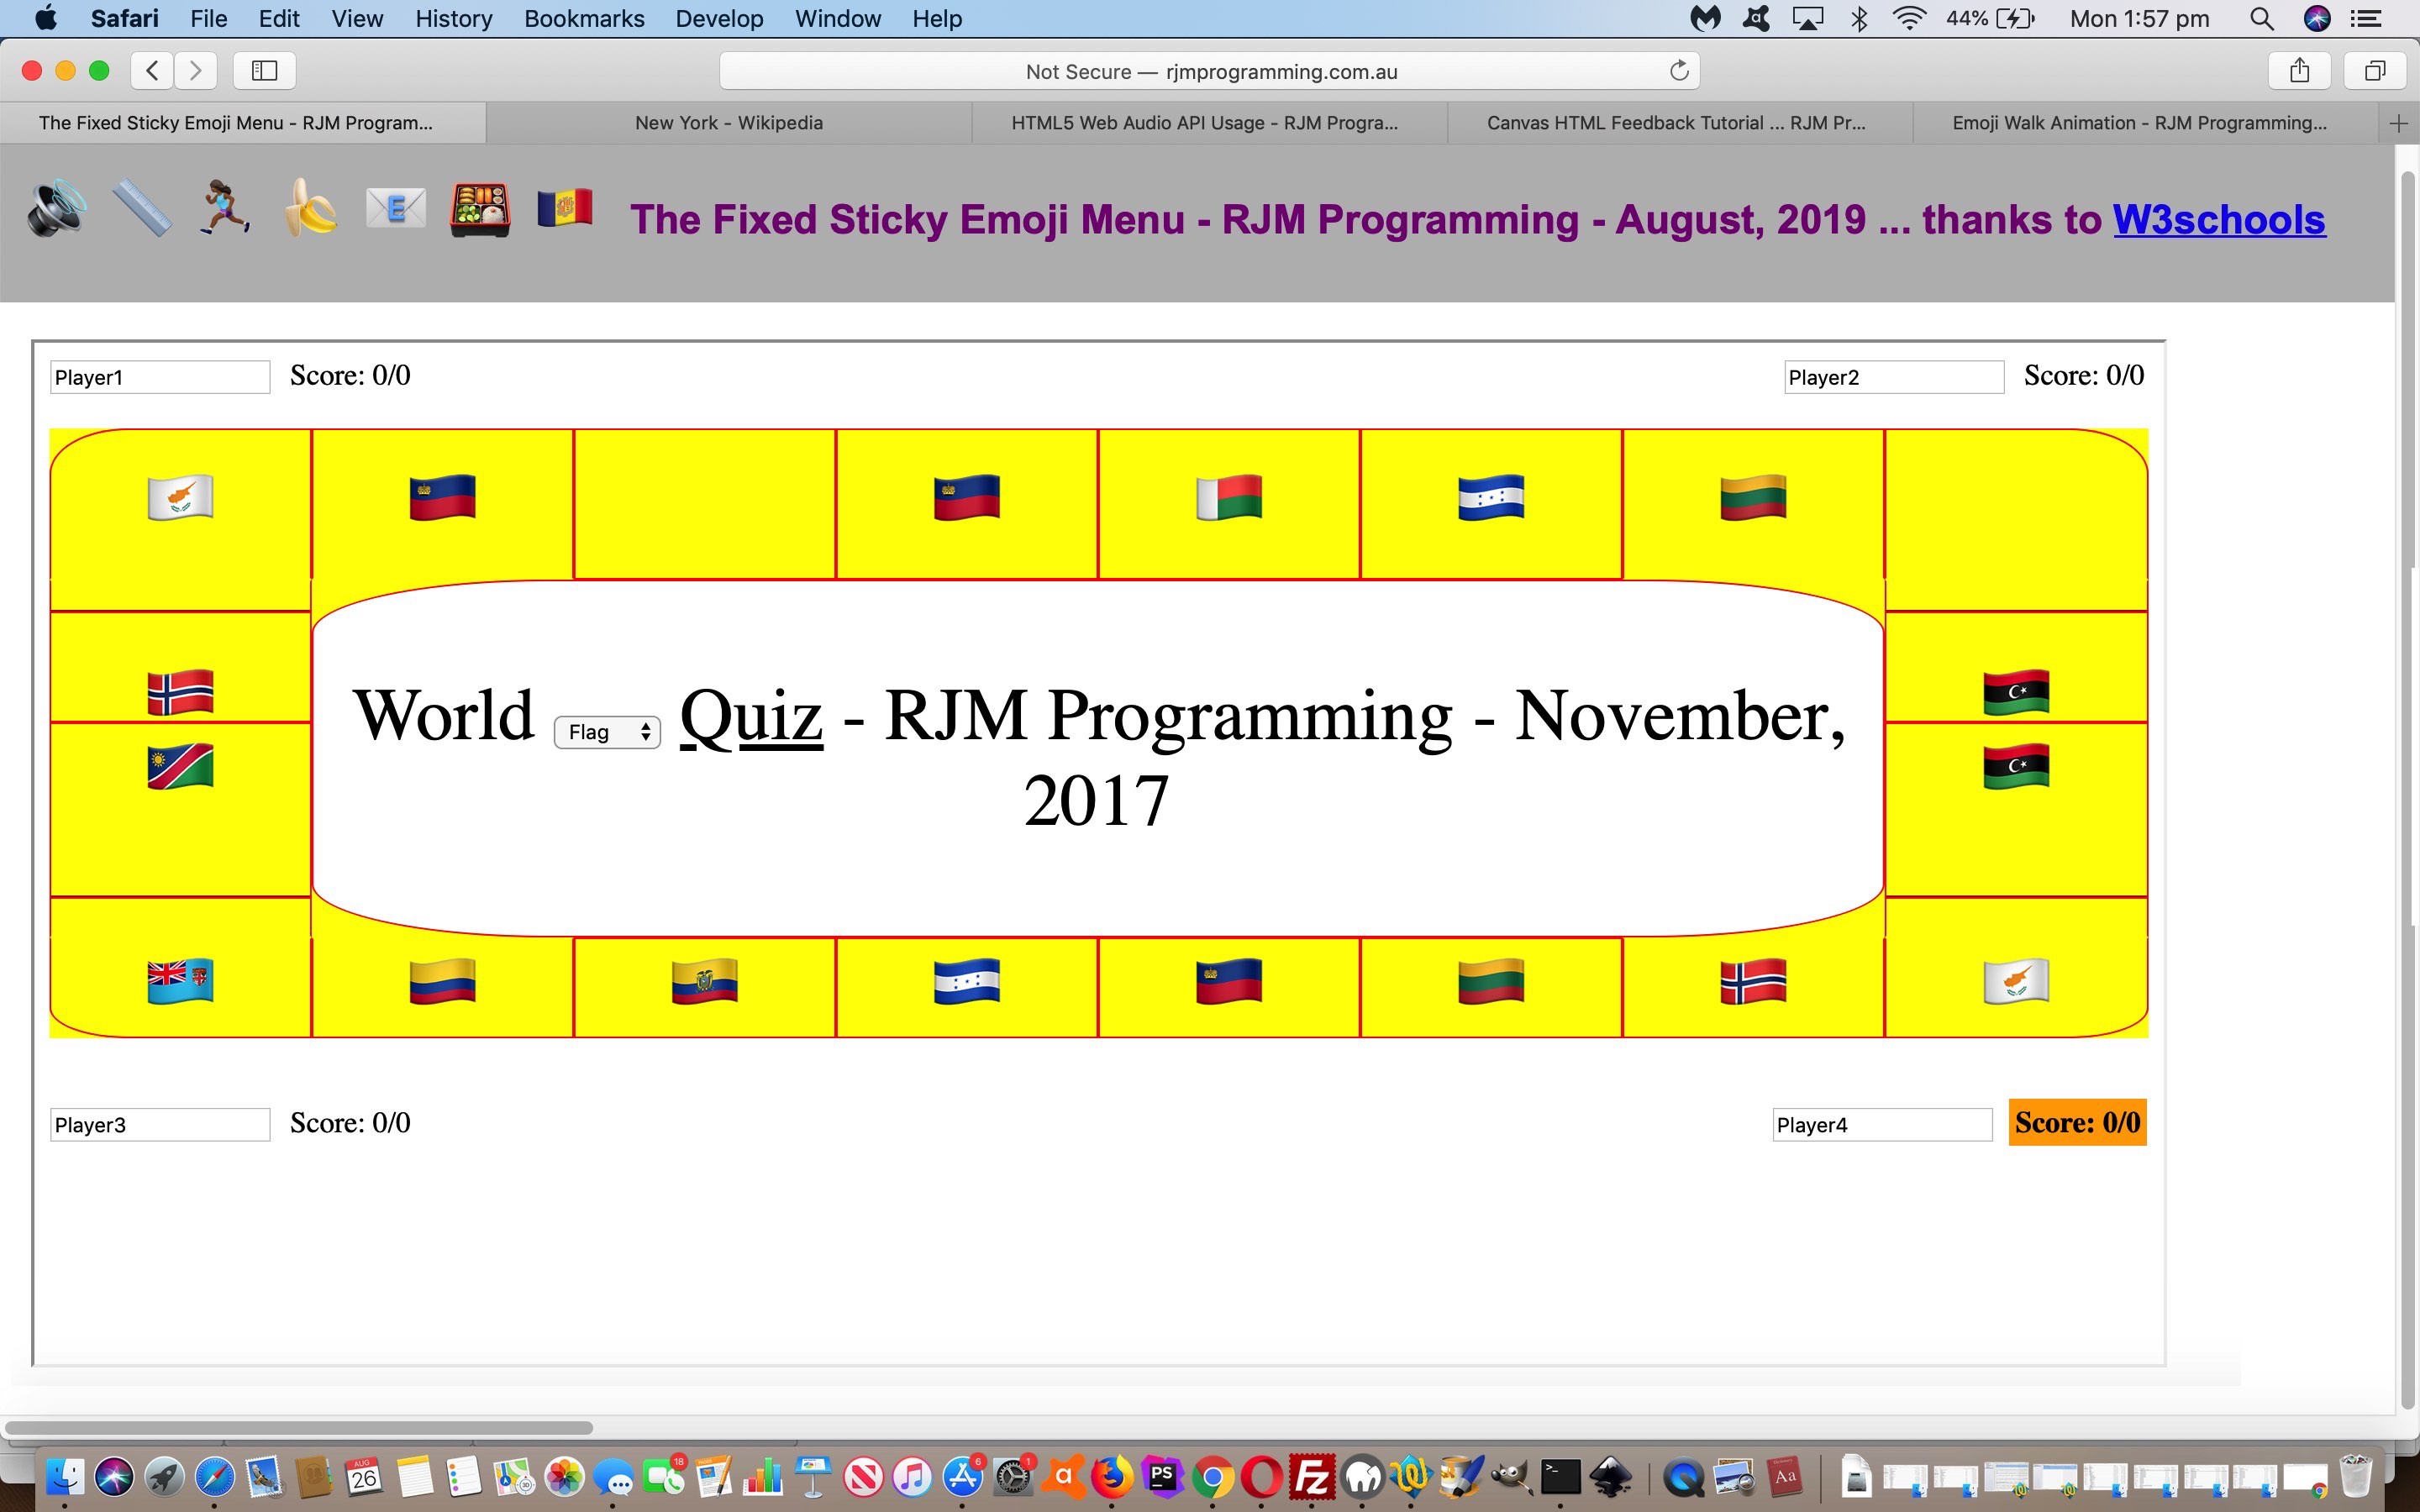
Which takes us to what we wanted to try as an inhouse addition to functionality. We like emojis, as “text meets button design”. Hence, we also like the “text” emoji being like an “a” link “button”, for two biggish reasons …
- emoji buttons save space
- emoji buttons can look like images that can attract user attention, and be like an Internationizational improvement to your web application, given some careful consideration
… that lead us to want to have the “Sticky Header” contain an “emoji menu” of “emoji buttons”, the “onclick” events of which show content below the “Sticky Header” in a one row table that pushes the latest content to the left of that row (so that our hashtagging logic will still see the emojis along with the latest selected content), yet allow an intrepid user venture right to “uncontrolled lands of functionality” should they wish. We’re sticking left … chortle, chortle.
Previous relevant HTML and Javascript and CSS Survey Levelling Tutorial is shown below.
With the “terrestrial” side to Land Surveying (ie. that of the small distances kind), two “get out there and do it” skills spring to mind, those being …
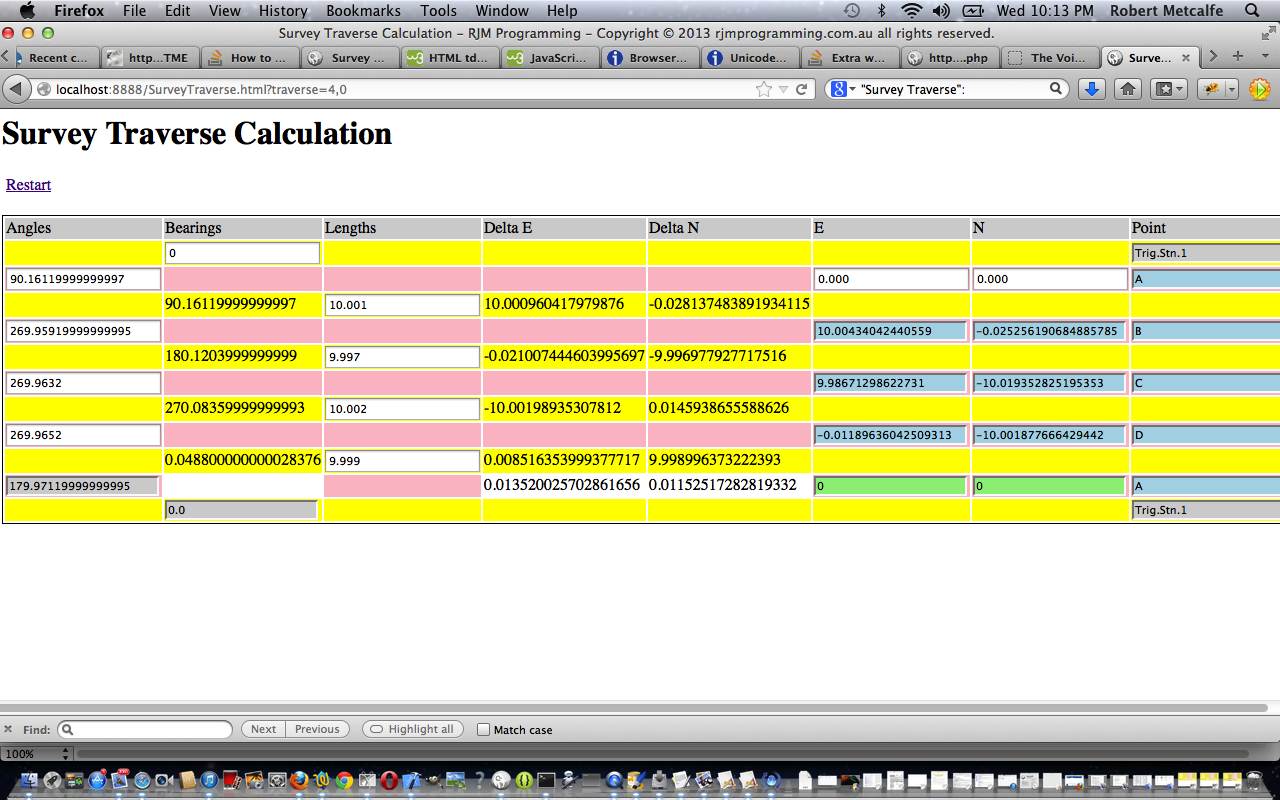
- performing a traverse via the use of a theodolite (or “total station”) (as the web application works the mathematics of, off the field book, with the previous HTML and Javascript and CSS Survey Traverse Tutorial) working out the (“X”,”Y”) of 2D “life” … and today, we add to that with …
- performing a levelling run via the use of a level (or “total station”) …
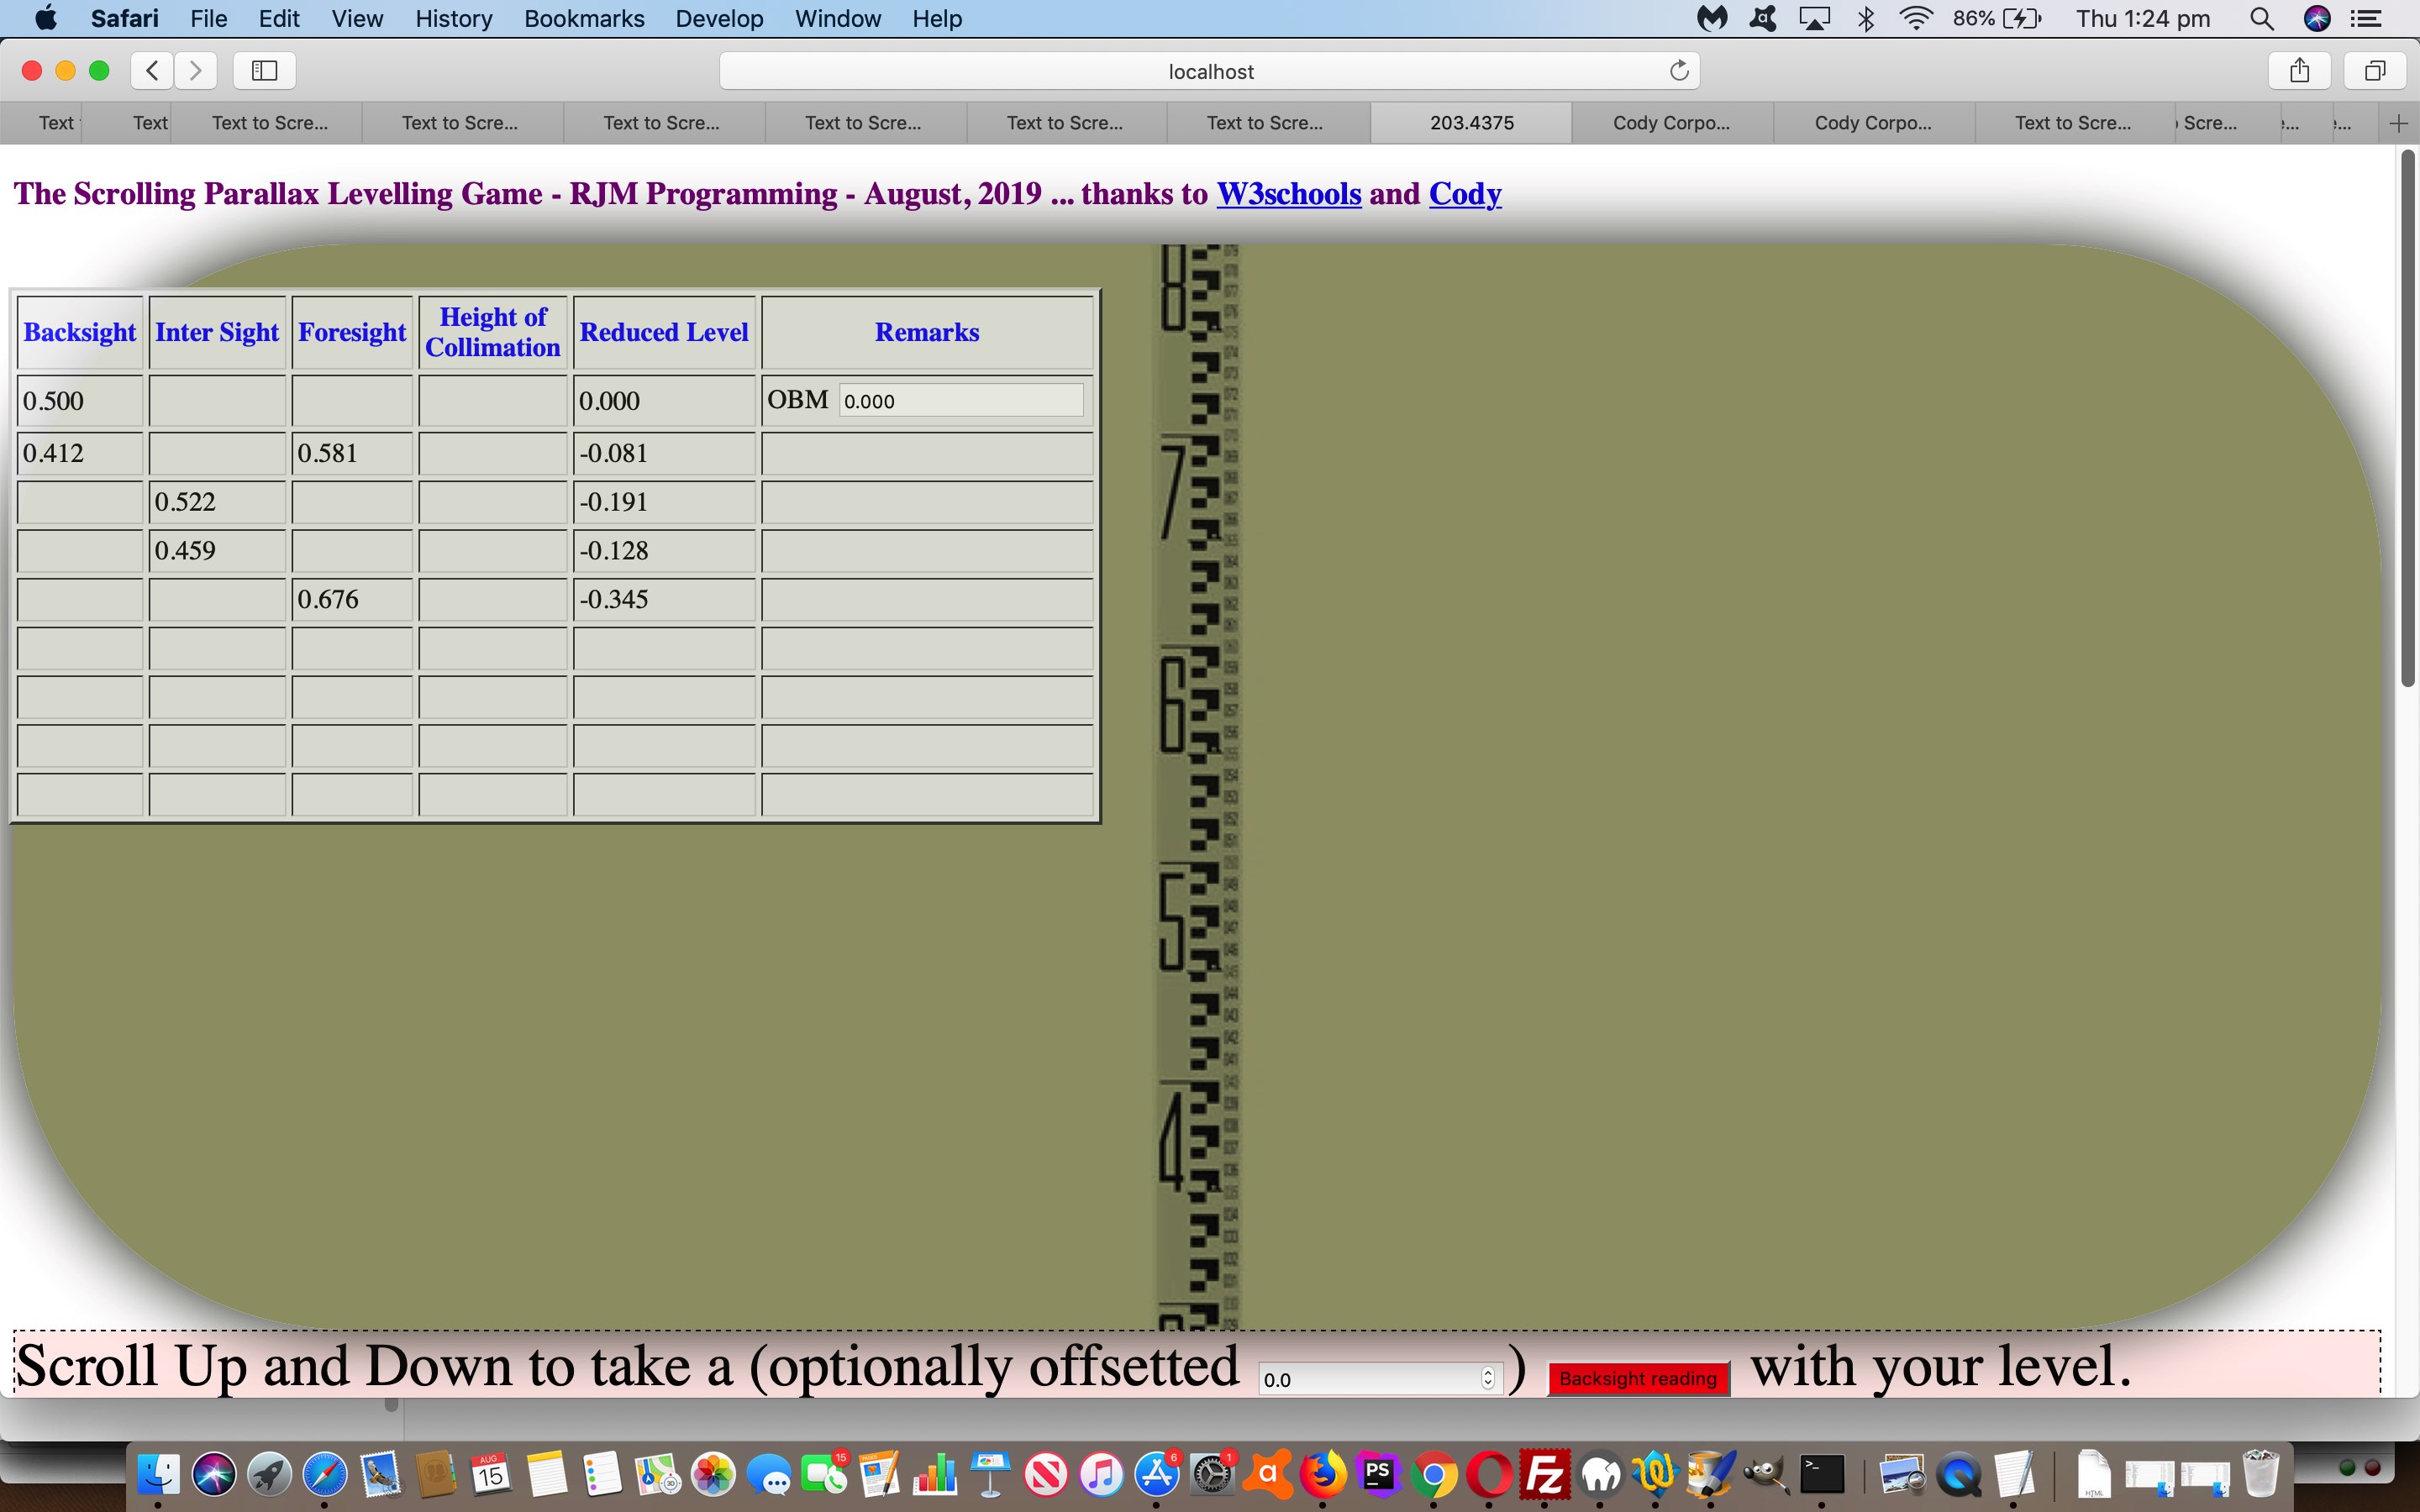
… and with today’s web application we simulate, to some degree, minus “how to level a level”, looking through the “level” viewer towards a “surveying staff” (held level and straight) on a point of something you want to know the elevation (or (3D “life”) “Z”) of in terrestrial terms, relative to known elevations you will probably want to start pointing at (the “surveying staff” being on) with your first (often a known “datum”) …
- Backsight … then …
- (however many Inter Sights followed by a) Foresight (and then back to Backsight, as necessary)
… series of measurements (or “reading”) to derive “reduced levels” for each point the “surveying staff” visits. This, in most practice, involves alternately leapfrogging (each other, at different times) …
- Land Surveyor recording and levelling the “level” … and a …
- Chainperson levelling and straightening the “surveying staff”
… the “surveying staff” we simulate in our web application (somewhat) thanks to Cody.
That’s the “what” of the web application, but what about the “how” (let alone the who)? Here, we thank the great W3schools parallax ideas.
The “central CSS smart” of these parallax ideas is the idea of …
<style>

  /* Create the parallax scrolling effect */

  background-attachment: fixed;

  background-position: center;

  background-repeat: no-repeat;

  background-size: contain;

</style>
So take a look at parallax_example.html‘s live run link to see what we mean.
Previous relevant HTML and Javascript and CSS Survey Traverse Tutorial is shown below.
Here is a tutorial showing some client-side basics in HTML and Javascript and CSS all in the one HTML file, to simplify concepts. The tutorial subject matter is a webpage to perform Survey Traverse calculations. A Survey Traverse is:
Traverse is a method in the field of surveying to establish control networks.[1] It is also used in geodesy. Traverse networks involve placing survey stations along a line or path of travel, and then using the previously surveyed points as a base for observing the next point. Traverse networks have many advantages, including:
Less reconnaissance and organization needed;
While in other systems, which may require the survey to be performed along a rigid polygon shape, the traverse can change to any shape and thus can accommodate a great deal of different terrains;
Only a few observations need to be taken at each station, whereas in other survey networks a great deal of angular and linear observations need to be made and considered;
Traverse networks are free of the strength of figure considerations that happen in triangular systems;
Scale error does not add up as the traverse is performed. Azimuth swing errors can also be reduced by increasing the distance between stations.The traverse is more accurate than triangulateration[2] (a combined function of the triangulation and trilateration practice).[3]
Let’s see some simple HTML in action in a tutorial …
Link to HTML “spiritual home” … at W3Schools has many tutorials.
Link to Survey Traverse live run … here.
Link to Survey Traverse live run (additional Google Line Chart functionality) here.
Link to Survey Traverse information … from Wikipedia from which quote above comes.
Link to some downloadable HTML code … rename to SurveyTraverse.html which packages up a lot of Javascript and a little bit of CSS … or JaCvasScriptS … not sure whether this would ever catch on.
Link to some downloadable PHP programming code (additional Google Line Chart functionality) … rename to SurveyTraverse.php
If this was interesting you may be interested in this too.
If this was interesting you may be interested in this too.
If this was interesting you may be interested in this too.


