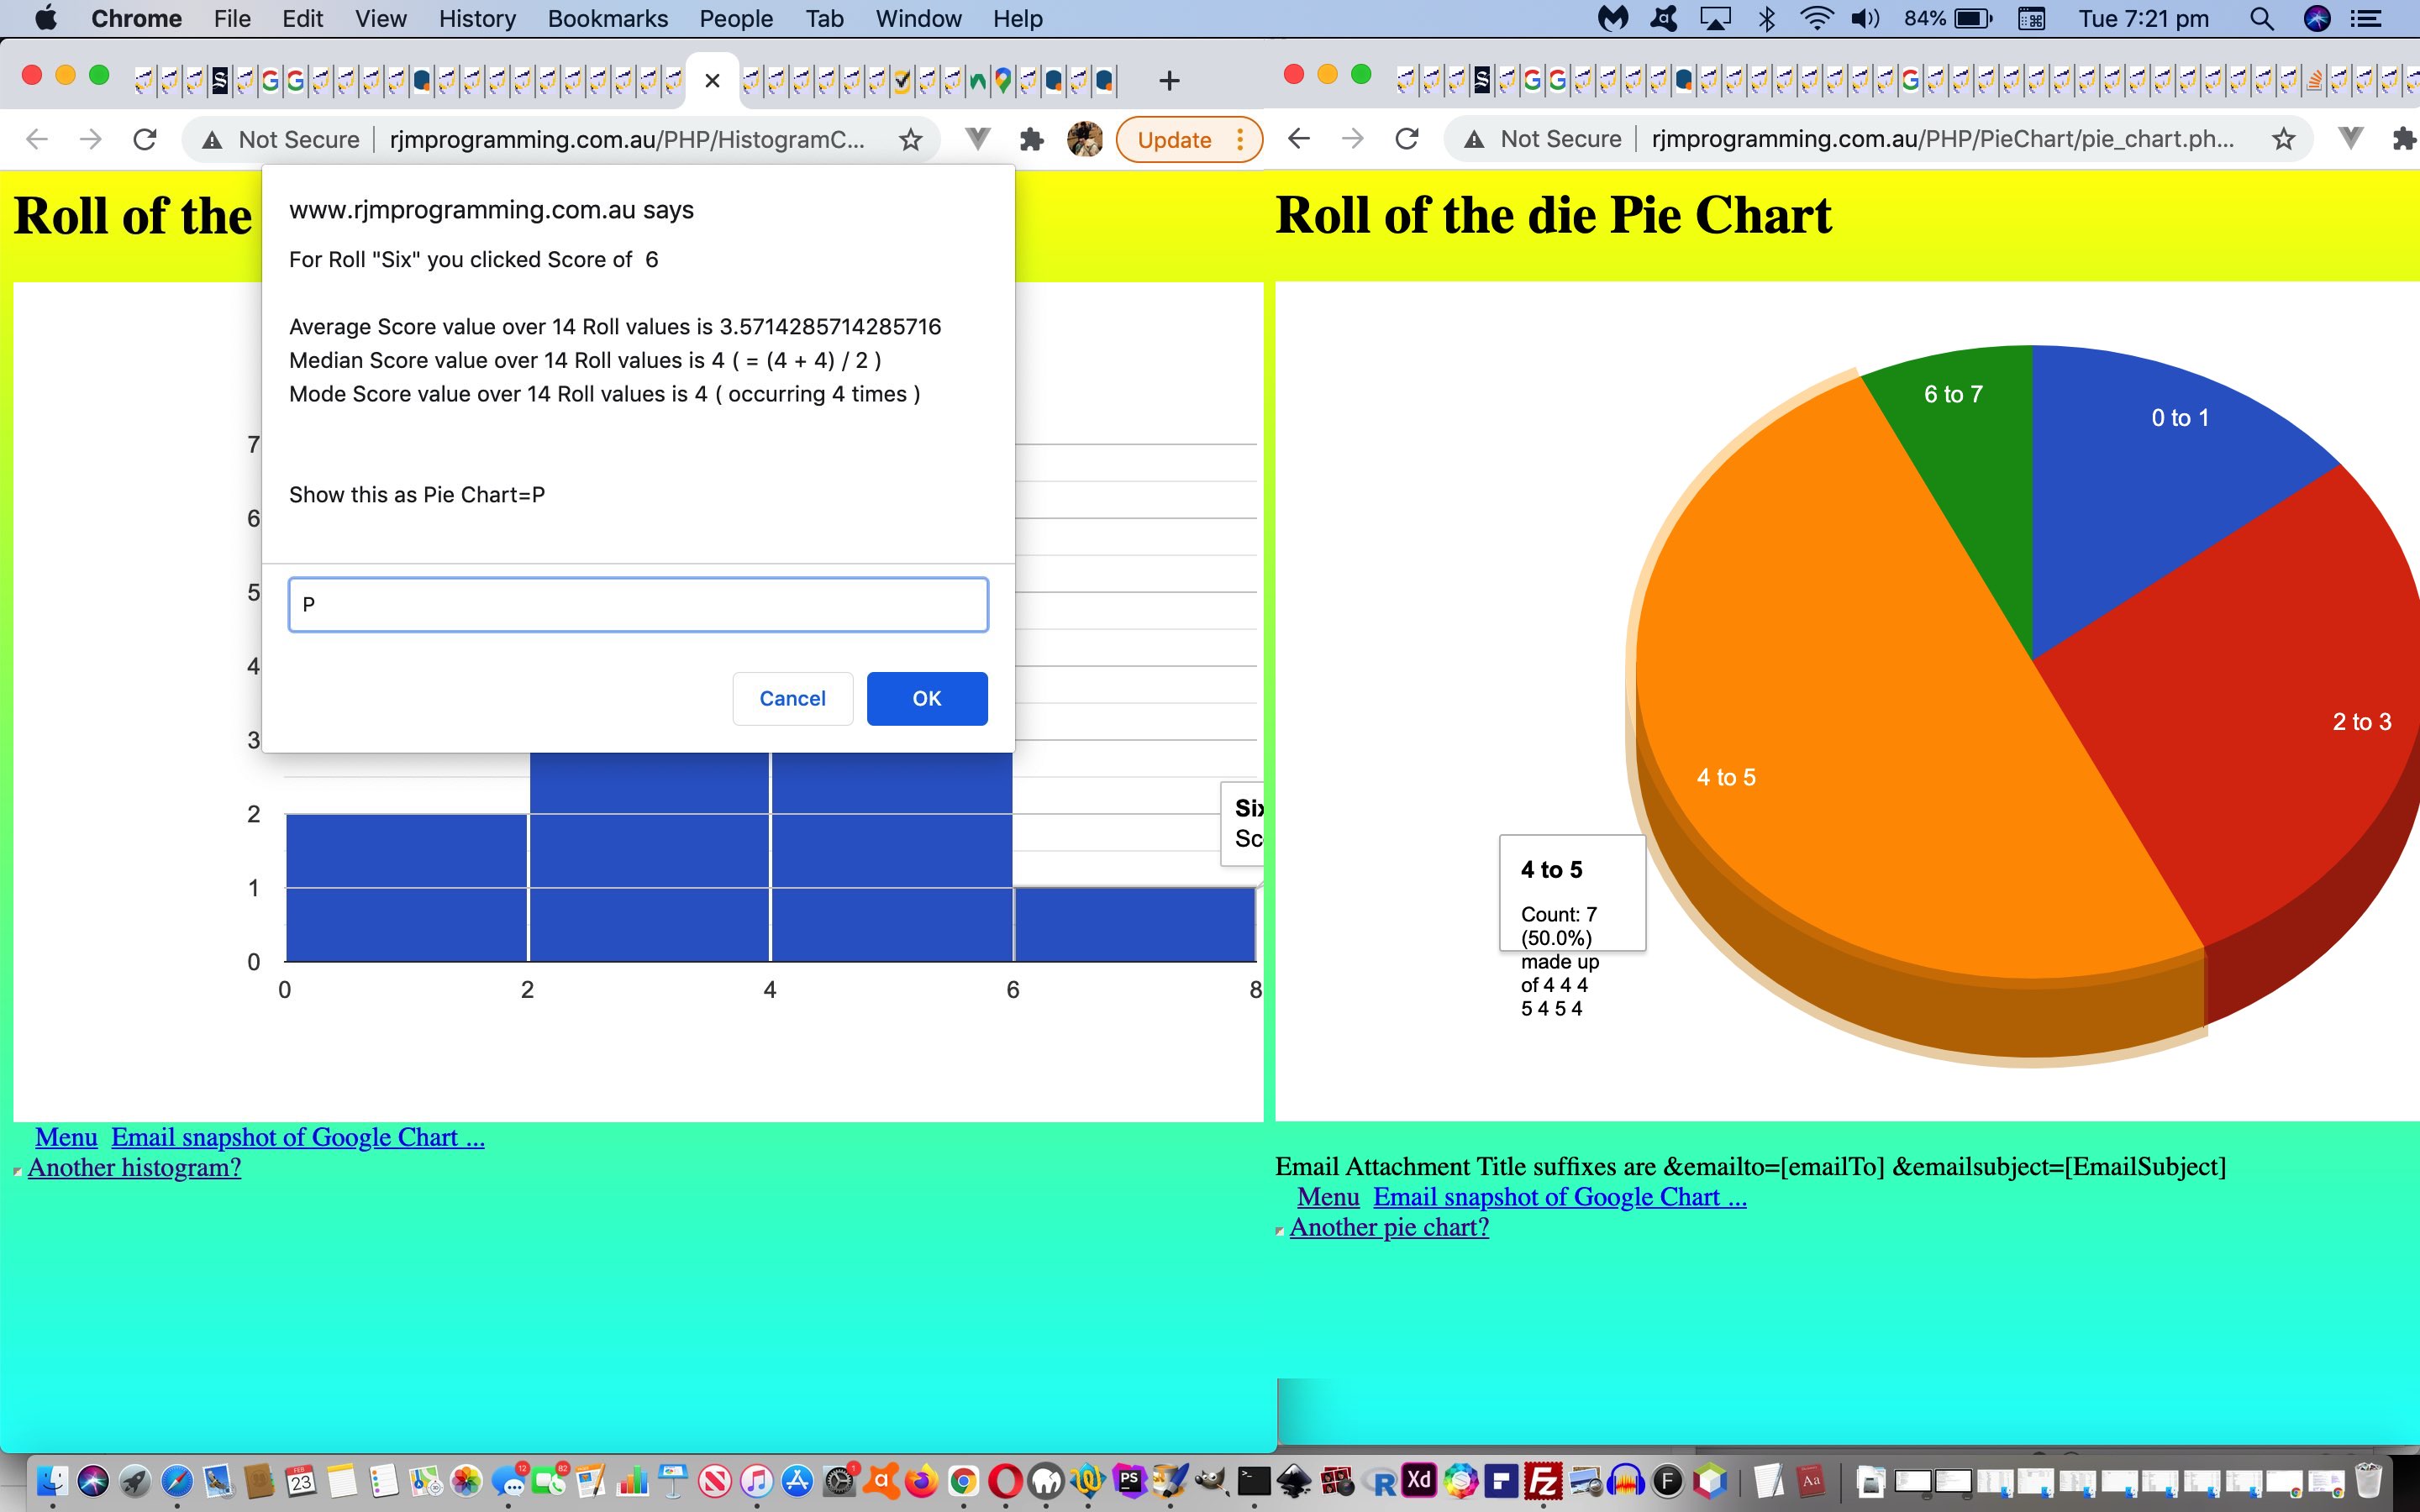
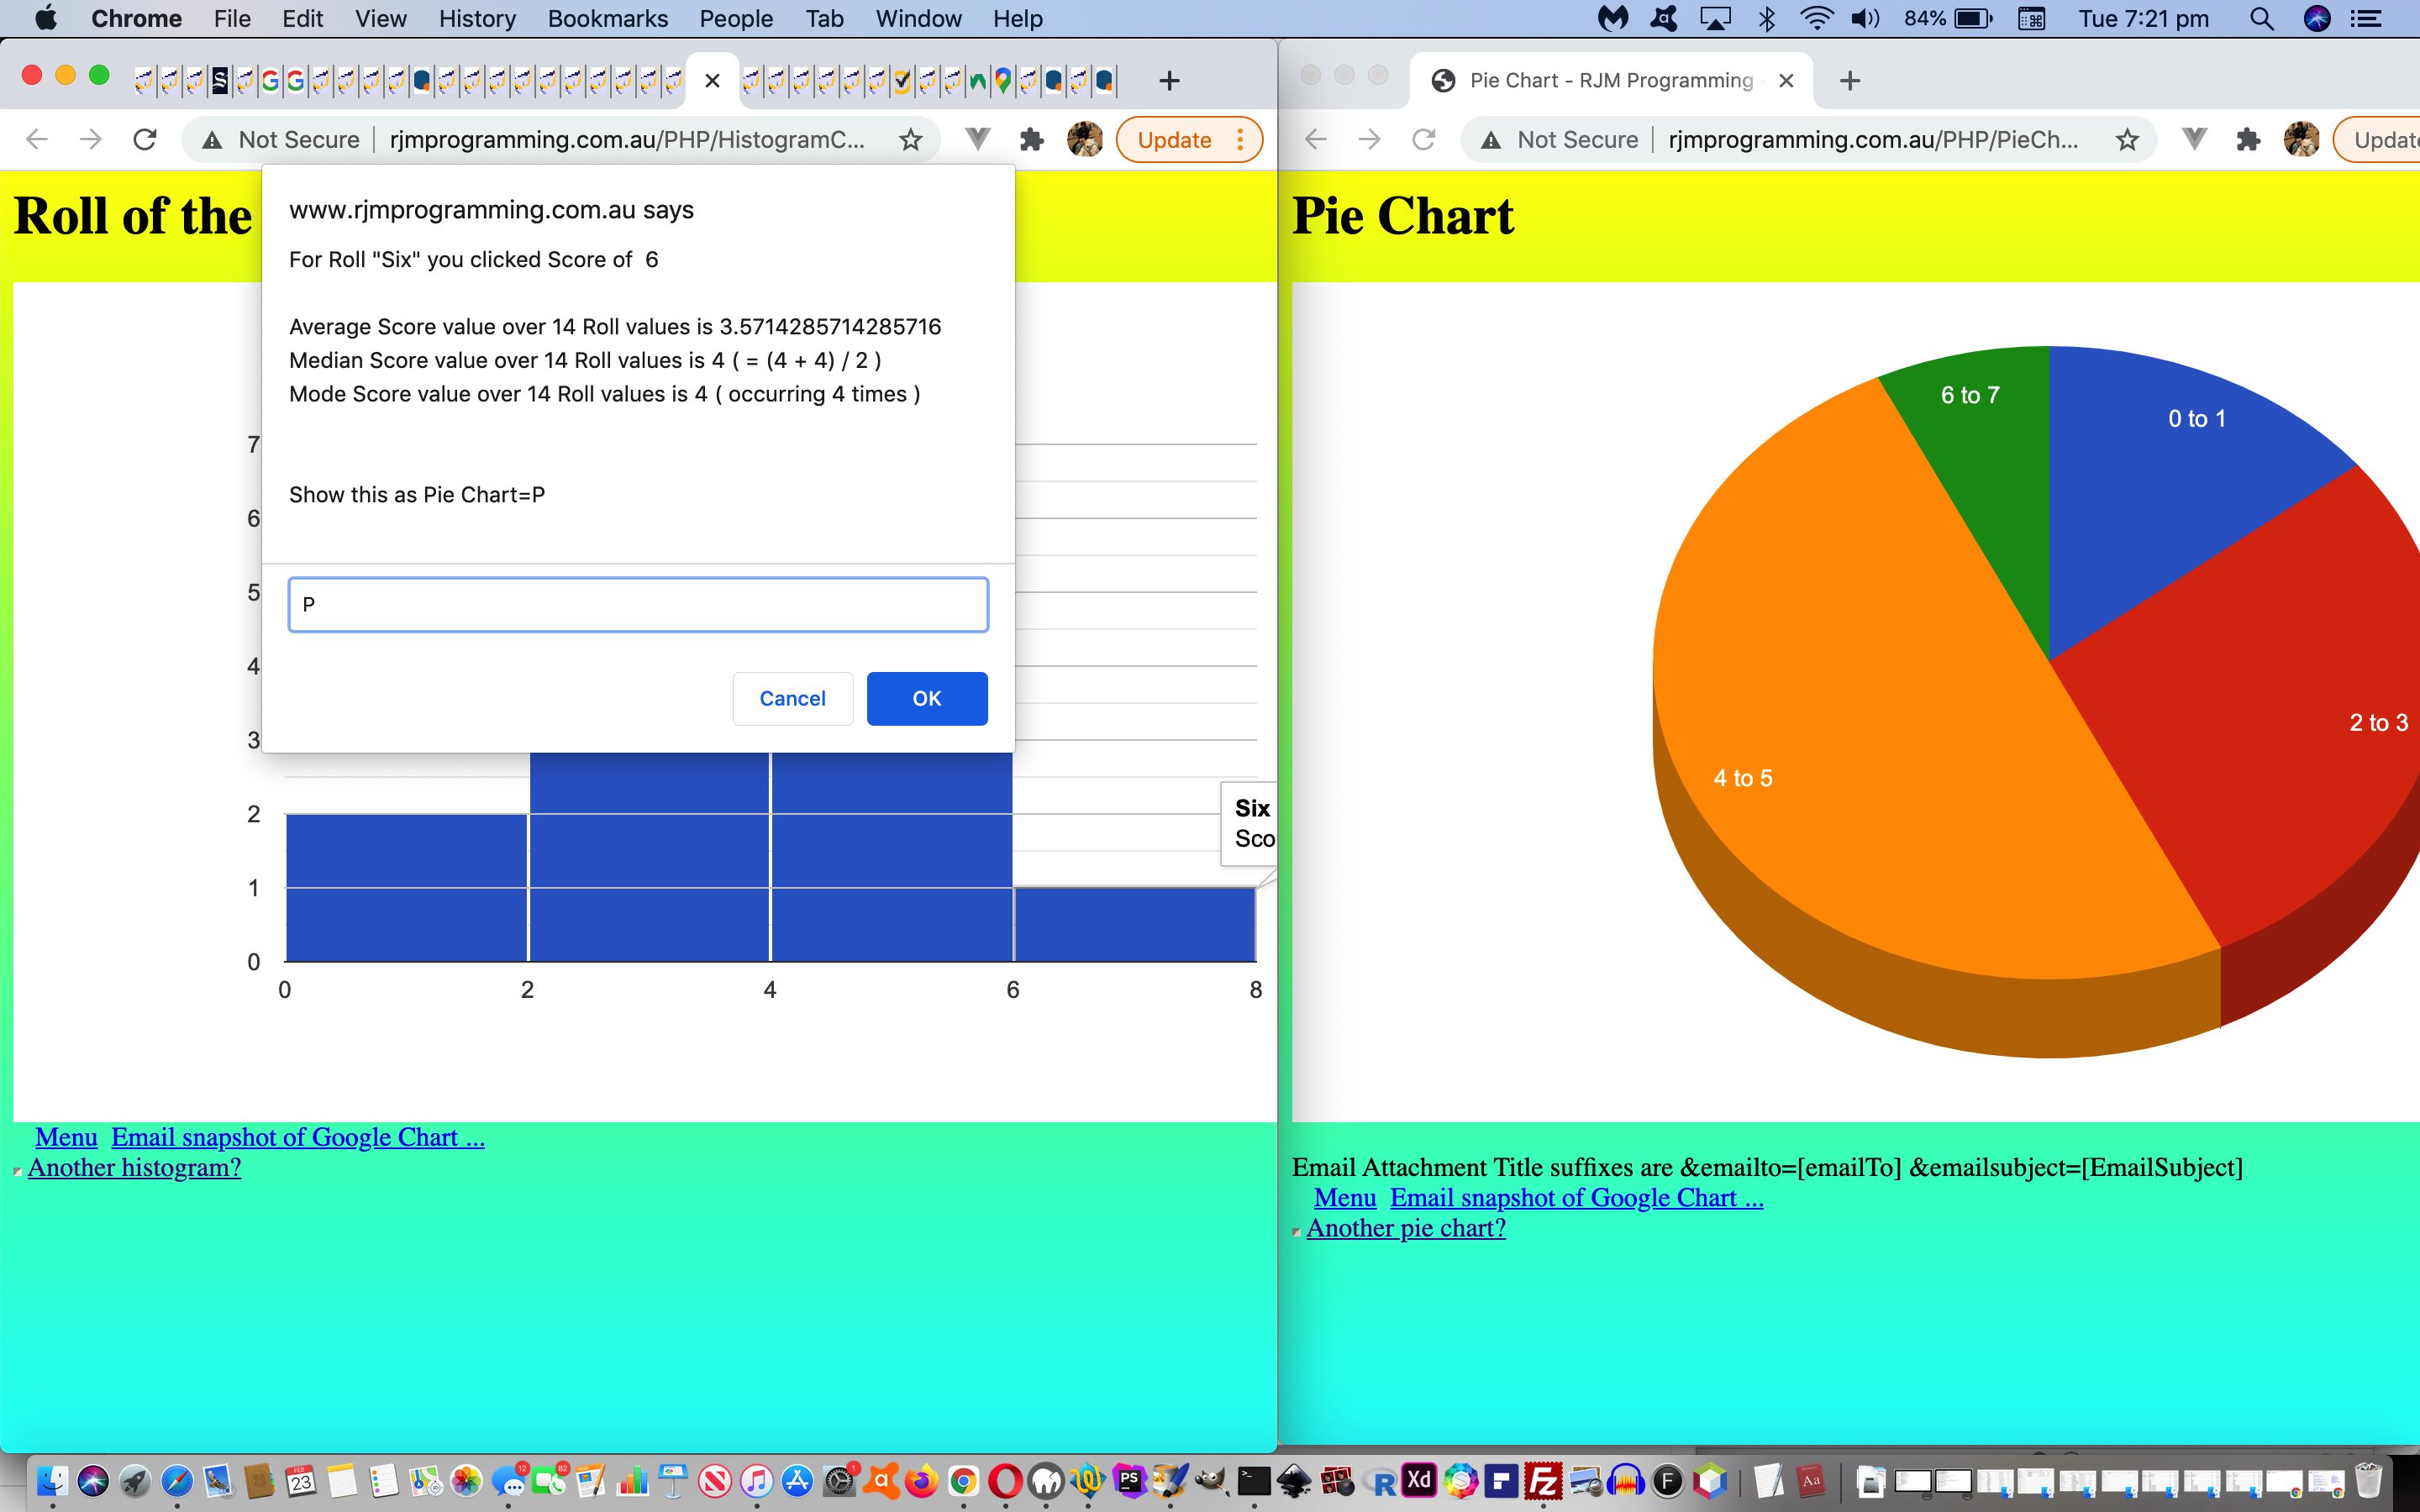
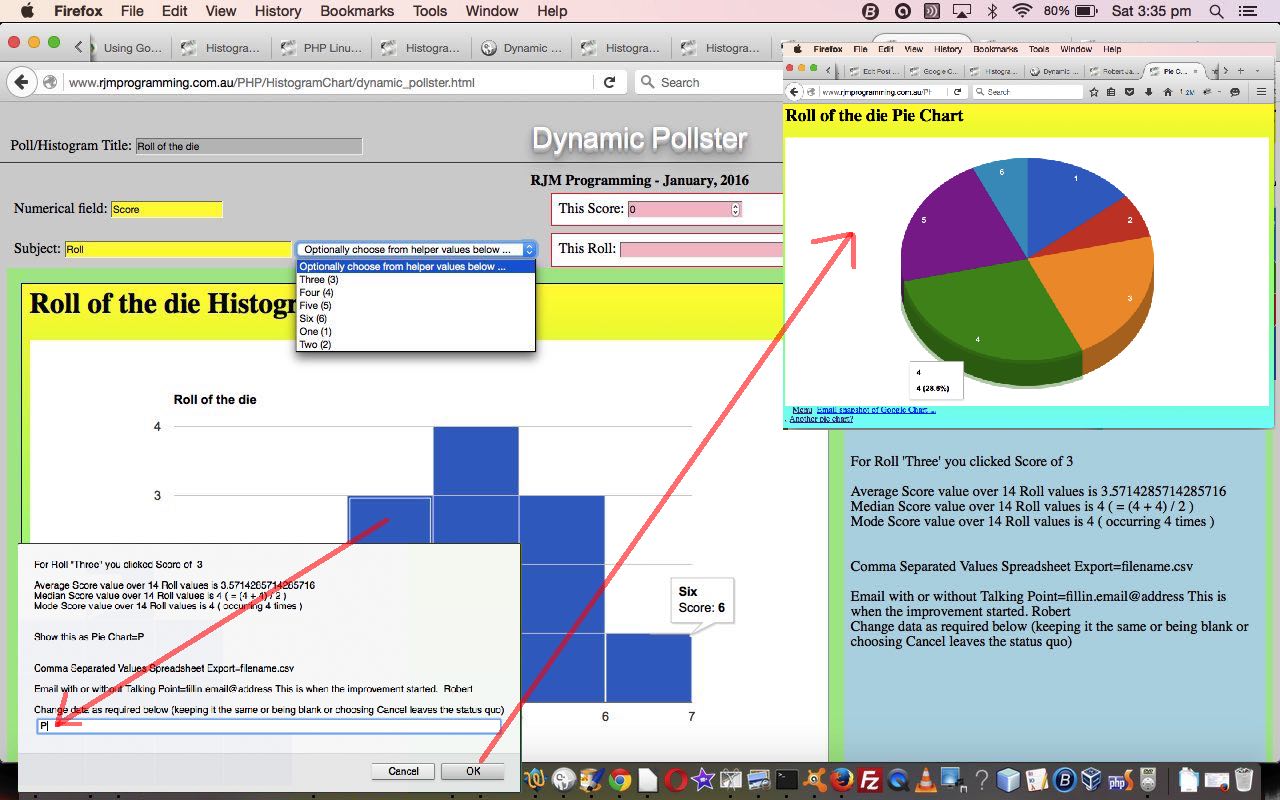
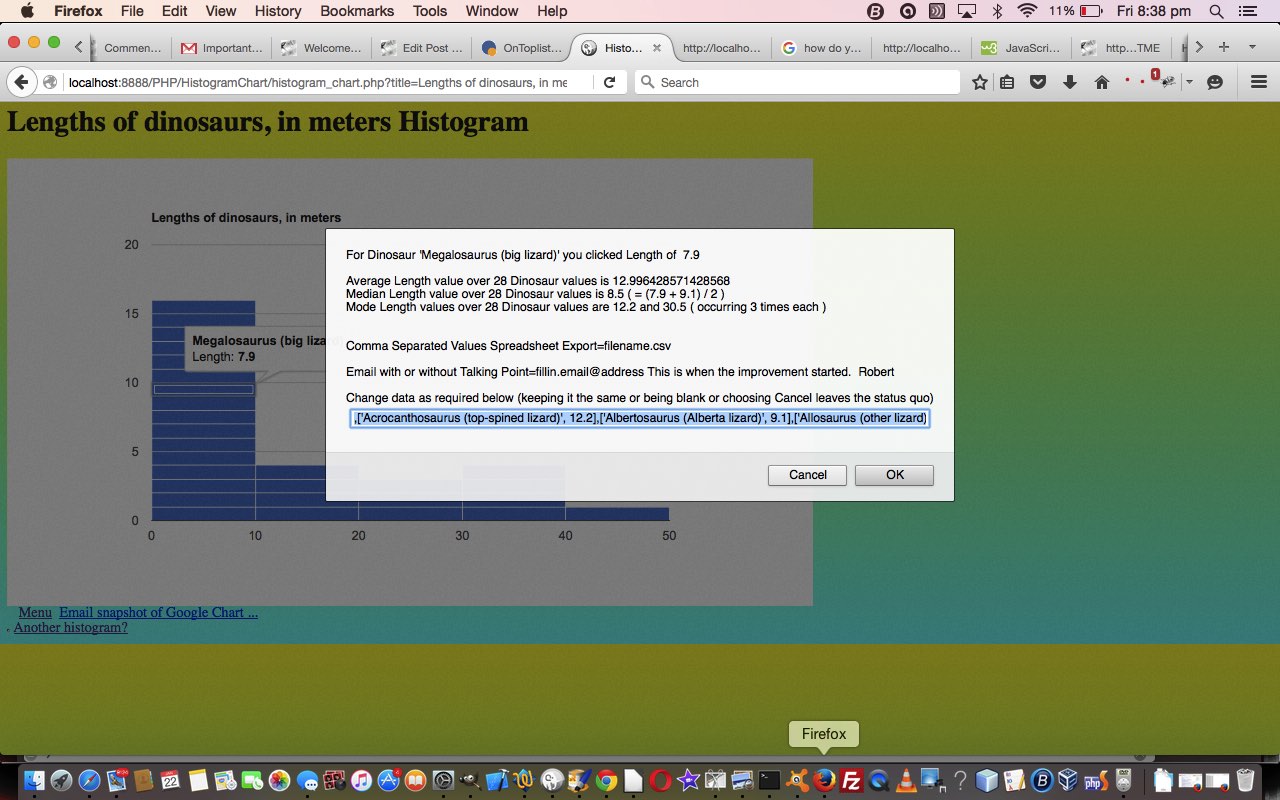
The interface between Google Charts Histogram Chart interfaces to Pie Chart lost “data intelligence” that we want to pass on to the Pie Chart today.
The mechanism by which we pass this list of Histogram data points (that go to make up the data source behind the svg graphics in the Histogram Chart) is via a Pie Chart’s tooltip capabilities …
Tooltips are the little boxes that pop up when you hover over something. (Hovercards are more general, and can appear anywhere on the screen; tooltips are always attached to something, like a dot on a scatter chart, or a bar on a bar chart.)
By doing the changes below for tooltips (in the changed histogram_chart.php), further to Google Chart Histogram Chart Pie Chart Interface Tutorial, in the interfaced to Pie Charts …
   function analyzesvg(svgsisvgsinnerHTML) {

      // ... jump to end of function below ...

              var dbits=lh.split('&data=');

              var urlgo=dbits[0].replace('/HistogramChart', '/PieChart').replace('histogram_chart.php', 'pie_chart.php').replace('&task=','&country=').replace('&desc=','&popularity=') + '&desc=' + teledata;

              if (urlgo.indexOf('title=&country=&onclick=y&popularity=&desc=&') != -1) {

                urlgo=urlgo.replace('&popularity=&', '&popularity=' + '" . ('' . $_POST['desc']) . "&').replace('&country=&', '&country=' + '" . ('' . $_POST['task']) . "&').replace('title=&', 'title=' + '" . ('' . $_POST['title']) . "&');

              }

              if (oblurb != null) {

              ohref=maybeothers(urlgo,ans.substring(0,1).toLowerCase());

              window.open(ohref,'_blank','top=20,left=20,width=800,height=660');

              } else {

              ohref=maybeothers(urlgo,ans.substring(0,1).toLowerCase());

              location.href=ohref;

              }

             } else if (pardata == '') {

              location.href=document.URL + '?title=" . urlencode(str_replace(",","`",$GETtitle)) . '&task=' . urlencode($GETtask) . '&onclick=y&desc=' . urlencode($GETdesc) . "&data=' + ourencodeURIComponent(ans);

             } else {

              location.href=document.URL.replace(pardata, ourencodeURIComponent(ans));

             }

            }

   }


   function infillit(urltgo) {

     var pbitsare=decodeURIComponent(paramdata).split('~,'), iminis=0, imaxis=0, cntsare=[];

     var ustg=urltgo.split('[%27');

     var totnum=eval(-1 + eval('' + pbitsare.length));

     var iut=0, jut=0;

     utgo=urltgo;

     if (tts.length > 0) {

     if (tts[0] == '') {


     for (jut=1; jut<ustg.length; jut++) {

        iminis=eval('' + ustg[jut].split('%20')[0]);

        imaxis=-1;

        if (ustg[jut].indexOf('%20to%20') != -1) { imaxis=eval('' + ustg[jut].split('%20to%20')[1].split(',')[0]); }

        cntsare.push(eval('' + ustg[jut].split(',')[1].split(']')[0]));


      if (jut == 1) {

        tts[0]=',' + String.fromCharCode(34) + 'Count: ' + cntsare[eval(-1 + jut)] + ' (' + eval(eval(eval('' + cntsare[eval(-1 + jut)]) * 100) / totnum).toFixed(1) + '%) ' + String.fromCharCode(34);

      } else {

        tts.push(',' + String.fromCharCode(34) + 'Count: ' + cntsare[eval(-1 + jut)] + ' (' + eval(eval(eval('' + cntsare[eval(-1 + jut)]) * 100) / totnum).toFixed(1) + '%) ' + String.fromCharCode(34));

      }


     }


     for (iut=1; iut<pbitsare.length; iut++) {

      for (jut=1; jut<ustg.length; jut++) {

        iminis=eval('' + ustg[jut].split('%20')[0]);

        imaxis=-1;

        if (ustg[jut].indexOf('%20to%20') != -1) { imaxis=eval('' + ustg[jut].split('%20to%20')[1].split(',')[0]); }

        if (eval('' + pbitsare[iut].split(']')[0].replace('+','')) >= eval('' + iminis) && (('' + imaxis) == '-1' || eval('' + pbitsare[iut].split(']')[0].replace('+','')) <= eval('' + imaxis))) {

        if (tts[eval(-1 + jut)].indexOf(' made ') == -1) {

          tts[eval(-1 + jut)]=tts[eval(-1 + jut)].replace(' ' + String.fromCharCode(34),  ' made up of ' + pbitsare[iut].split(']')[0].replace('+','') + ' ' + pbitsare[iut].split(']')[0].replace('+','') + ' ' + String.fromCharCode(34));

        } else {

          tts[eval(-1 + jut)]=tts[eval(-1 + jut)].replace(' ' + String.fromCharCode(34), ' ' + pbitsare[iut].split(']')[0].replace('+','') + ' ' + String.fromCharCode(34));

        }

        }

      }

     }


     for (jut=1; jut<ustg.length; jut++) {

       if (eval('' + tts.length) >= jut) {

         utgo=utgo.replace(ustg[jut], ustg[jut].replace(',', ',' + String.fromCharCode(34) + encodeURIComponent(tts[eval(-1 + jut)].substring(2,eval(-3 + tts[eval(-1 + jut)].length))) + String.fromCharCode(34) + ','));

       }

     }

     utgo=utgo.replace(/\]\,\[/g, ']%20,%20[').replace(/\,\[/g, ',%20[').replace(/\[\%27/g,'[~').replace(/\%27\,/g,'~,');

     tts=[''];


     }

     }


     return utgo;

   }


   function maybeothers(urltogo, ansistogo) {

     if (ansistogo.substring(0,1).toLowerCase() == 'p') {

       return infillit(urltogo.replace(/\'/g,'%27').replace(/\ /g,'%20'));

     } else if (ansistogo.substring(0,1).toLowerCase() == 'c') {

     } else if (ansistogo.substring(0,1).toLowerCase() == 'l') {

     } else if (ansistogo.substring(0,1).toLowerCase() == 'b') {

     } else if (ansistogo.substring(0,1).toLowerCase() == 'a') {

     }

     return urltogo.replace(/\'/g,'%27').replace(/\ /g,'%20');

   }
… we make it so that to look at Pie Chart you could reconstruct the Histogram behind the scenes, as you can try in yesterday’s posting.
Previous relevant Google Chart Histogram Chart Pie Chart Interface Tutorial is shown below.
When we presented Google Chart Histogram Chart Select Event Synergy Tutorial it represented a Google Charts …
Histogram Chart interfaces to Pie Chart
… tool. Recently, we revisited the interface (from Histogram …
… Chart) aspects to these arrangements, via that menu which appears when you click a rectangle of the Histogram, and found that it ended in a blank Pie Chart (ie. no chart shows) you can simulate via …
Click to see the Pie Chart you have when you are not having a Pie Chart
Believe it or not, to go from the look of above to the better look (and result) of below …
Click to see the Pie Chart as a result of the fixed interface to the Histogram Chart
… it involved, ostensibly, a one character change in the code? Huh?! And it is that “Huh?!” reaction we want to talk about mostly today. How did we arrive at this histogram_chart.php very small change?
To start with, we need to explain that the graphics of the Histogram Chart are formed via svg (Scalable Vector Graphics), and we need to “data scrape” these graphics in order to reform a new Pie Chart URL, especially its “data” argument.
And so, the next step to debugging our issue, remembering that characteristic to the code, above, was top search through it for “svg” and so got to …
              var huhsvg=null;

              if (pardata == '') {

              lh=document.URL + '?title=" . urlencode(str_replace(",","`",$GETtitle)) . '&task=' . urlencode($GETtask) . '&onclick=y&desc=' . urlencode($GETdesc) . "&data=' + ourencodeURIComponent(ans);

              } else {

              lh=document.URL.replace(pardata, ourencodeURIComponent(ans));

              }

              if (teledata == '') {

                huhsvg=document.getElementsByTagName('svg');

                if (1 == 1) { //huhsvg.length != 0) {

                  analyzesvg(document.body.innerHTML);  // mobile fix

                }

              }
… as the “honing in” Javascript function where the issue probably resides, helping with the “where to look” part to a solution.
Okay, there is something else interesting above with the problematic Pie Chart URL’s “data” argument (array of structures) as per …
&data=%20,[%270%20to%201%27,0]%20,[%272%20to%203%27,0]%20,[%274%20to%205%27,0]%20,[%276%20to%207%27,0]%20,[%278%20and%20up%27,0]

 ... via decodeURIComponent becaomes ...

&data= ,['0 to 1',0] ,['2 to 3',0] ,['4 to 5',0] ,['6 to 7',0] ,['8 and up',0]
The string parts of the structure look feasible and apt for the resultant Pie Chart, but all those “0” (zero) counts don’t look apt, and are no doubt causing the Pie Chart graphics to not be there, as a hint for helping with the “what to look out for” part to a solution.
Sometimes a “what to look out for” is obvious in a small Javascript function. Alas not so with getting to that final change in …
   function analyzesvg(svgsisvgsinnerHTML) {

     // ,['Work',11]

     // var teledata='&data=,';

     var ismobile=false;

     var ix=0, xspo, spo, lastones, isvgs=0, its=0, jts=0, firsty=-1.0, ts, thisones, prevone='', xs, zs, ns, thist='', telex='', telez='', teleih='', tdsuff='', tdelim='', tsuffix=' ';

     var svgs=document.getElementsByTagName('svg');


     if (svgsisvgsinnerHTML != '') {

       if (navigator.userAgent.match(/Android|BlackBerry|iPhone|iPad|iPod|Opera Mini|IEMobile/i)) ismobile=false; //true;

     }


     for (isvgs=0; isvgs<svgs.length; isvgs++) {

     if (svgsisvgsinnerHTML == '') {

      svgsisvgsinnerHTML=svgs[isvgs].innerHTML;

     }

       if (svgsisvgsinnerHTML.indexOf('<text ') != -1) {

         teledata='&data=,';

         ts=svgsisvgsinnerHTML.split('text-anchor="middle"');


//0 ... <text fill="#444444" stroke-width="0" stroke="none" font-size="14" font-family="Arial" y="425.9" x="161.5"

//1 ... >0</text></g><g><text fill="#444444" stroke-width="0" stroke="none" font-size="14" font-family="Arial" y="425.9" x="277.1"

//2 ... >10</text></g><g><text fill="#444444" stroke-width="0" stroke="none" font-size="14" font-family="Arial" y="425.9" x="392.70000000000005"

//3 ...

         lastones=ts[0].split('<');

         for (its=1; its<ts.length; its++) {

           xspo=ts[its].split('>')

           thisones=xspo[1].split('<');

           if (tdelim == '') {

             prevone=thisones[0];

             if (ismobile == true) alert('ts[' + its + ']=' + ts[its] + ' thisones[0]=' + thisones[0]);

           } else if (tsuffix == ' ' && Math.abs(Math.abs(eval(prevone) - eval(thisones[0])) - 1) < 0.001 && ("" + thisones[0] + "" + prevone).indexOf(".") == -1) {

             if (ismobile == true) alert('2 ts[' + its + ']=' + ts[its] + ' thisones[0]=' + thisones[0]);

             tsuffix='';

             teledata+=tsuffix + tdsuff;

           } else  if (tsuffix == ' ' && ("" + thisones[0] + "" + prevone).indexOf(".") == -1) {

             if (ismobile == true) alert('3 ts[' + its + ']=' + ts[its] + ' thisones[0]=' + thisones[0]);

             tsuffix='  to ' + eval(thisones[0] - 1);

             teleih+=tsuffix.replace(' ','');

             teledata+=tsuffix.replace(' ','') + tdsuff;

             tsuffix='  and up';

             if (eval(1 + its) < eval(ts.length)) {

               if (ismobile == true) alert(eval(1 + its) + ' < ' + ts.length);

               if (ismobile == true) alert(ts[eval(1 + eval(its))]);

               jts=eval(thisones[0]);

               //thisones=ts[eval(1 + eval(its))].replace('>','').split('<');

               spo=ts[eval(1 + eval(its))].split('>')

               thisones=spo[1].split('<');

               if (eval(thisones[0] - 1) == eval(jts)) {

               tsuffix='';

               } else {

               tsuffix='  to ' + eval(thisones[0] - 1);

               }

               //thisones=ts[its].replace('>','').split('<');

               xspo=ts[its].split('>')

               thisones=xspo[1].split('<');

             }

           } else  if (tsuffix == ' ') {

             if (ismobile == true) alert('4 ts[' + its + ']=' + ts[its] + ' thisones[0]=' + thisones[0]);

             tsuffix='  and up';

             teledata+=tsuffix.replace(' ','') + tdsuff;

           } else if (Math.abs(Math.abs(eval(prevone) - eval(thisones[0])) - 1) < 0.001 && ("" + thisones[0] + "" + prevone).indexOf(".") == -1) {

             if (ismobile == true) alert('5 ts[' + its + ']=' + ts[its] + ' thisones[0]=' + thisones[0]);

             tsuffix='';

           } else if (("" + thisones[0] + "" + prevone).indexOf(".") == -1) {

             if (ismobile == true) alert('6 ts[' + its + ']=' + ts[its] + ' thisones[0]=' + thisones[0]);

             tsuffix='  and up';

             if (eval(1 + its) < eval(ts.length)) {

               //alert(eval(1 + its) + '< ' + ts.length);

               //alert(ts[eval(1 + eval(its))]);

               jts=eval(thisones[0]);

               //thisones=ts[eval(1 + eval(its))].replace('>','').split('<');

               spo=ts[eval(1 + eval(its))].split('>')

               thisones=spo[1].split('<');

               if (eval(thisones[0] - 1) == eval(jts)) {

               tsuffix='';

               } else {

               tsuffix='  to ' + eval(thisones[0] - 1);

               }

               //thisones=ts[its].replace('>','').split('<');

               xspo=ts[its].split('>')

               thisones=xspo[1].split('<');

             }

           } else {

             if (ismobile == true) alert('7 ts[' + its + ']=' + ts[its] + ' thisones[0]=' + thisones[0]);

             tsuffix='  and up';

           }

             if (ismobile == true) alert('a');

           telez+=tdelim + '0';

             if (ismobile == true) alert('aa');

           teleih+=tdelim + thisones[0] + tsuffix.replace(' ','');

             if (ismobile == true) alert('aaa');

           teledata+=tdelim + "['" + thisones[0] + tsuffix.replace(' ','') + tdsuff;

             if (ismobile == true) alert('aaaa');

           thist = '<' + lastones[-1 + lastones.length] + 'text-anchor="middle">' + thisones[0] + '</text>';

           if (thist.indexOf('<text text-anchor=') != -1) {

             //alert(ts[its]);

             xspo=ts[its].split('font-');

             thist = '<' + xspo[0] + ' text-anchor="middle">' + thisones[0] + '</text>';

           }

             if (ismobile == true) alert('aaaaa');

           thisones=thist.split(' x="');

             if (ismobile == true) alert(thist);

           lastones=thisones[1].split('"');

             if (ismobile == true) alert('a7');

           telex+=tdelim + lastones[0];

           if (ismobile == true) alert(teledata);

           lastones=ts[its].split('<g><');

           tdelim=',';

           tdsuff="',0]";

         }

         if (ismobile == true) alert(1);

         xs=telex.split(',');

         if (ismobile == true) alert(11);

         zs=teleih.split(',');

         if (ismobile == true) alert(111);

         ns=telez.split(',');

         if (ismobile == true) alert(1111);

         ts=svgsisvgsinnerHTML.split('<rect ');

         if (ismobile == true) alert(ts.length + ' ... ' + teledata + ' +++ ' + ts[1]);

         if (ismobile == true) alert(teledata);

         for (its=3; its<ts.length; its++) {

            if (ismobile == true) alert(ts[its]);

            thisones=(' ' + ts[its]).replace(' x= ',' x=').split(' x="');

            if ((' ' + ts[its]).replace(' x= ','x=').indexOf(' x="') != -1) {

            lastones=thisones[1].split('"');

            } else if ((' ' + ts[its]).replace(' x= ','x=').indexOf(' x=') != -1) {

            thisones=ts[its].replace(' x= ',' x=').split(' x=');

            lastones=thisones[1].substring(1).split(thisones[1].substring(0,1));

            } else {

            thisones=(' ' + ts[its]).replace(' x= ',' x=').split(' x="');

            lastones='-999"'.split('"');

            }

         //if (eval(its) < 5 && navigator.userAgent.match(/Android|BlackBerry|iPhone|iPad|iPod|Opera Mini|IEMobile/i)) alert(lastones[0] + ' vs ' + ts[its]);

           if (ts[its].indexOf('height="1"') == -1 && ts[its].indexOf('height="') != -1 && ts[its].indexOf('fill-opacity=') == -1) {

            for (jts=0; jts<xs.length; jts++) {

              //if (zs[jts].indexOf('3') != -1 && navigator.userAgent.match(/Android|BlackBerry|iPhone|iPad|iPod|Opera Mini|IEMobile/i)) alert(eval(lastones[0]) + ' - ' +  eval(xs[jts]));

              //if (jts == 0 && navigator.userAgent.match(/Android|BlackBerry|iPhone|iPad|iPod|Opera Mini|IEMobile/i)) alert(telex + ' ... ' + eval(lastones[0]) + ' - ' +  eval(xs[jts]));

              if (Math.abs(eval(lastones[0]) - eval(xs[jts])) < 1.8) {  // used to be 1.0 (22/2/2021)

                if (ismobile == true) alert("(" + teledata + ").replace('" + zs[jts] + ',' + ns[jts] + "','" + zs[jts] + ',' + eval(1 + ns[jts]) + "')=" + teledata.replace(zs[jts] + ',' + ns[jts], zs[jts] + ',' + eval(1 + ns[jts])));

                teledata=teledata.replace("'" + zs[jts] + "'," + ns[jts], "'" + zs[jts] + "'," + eval(1 + eval(ns[jts])));

                if (ismobile == true) alert(teledata);

                ns[jts]=eval(1 + eval(ns[jts]));

              }

            }

           }

         }

       }

     }

     // //localhost:8888/PHP/HistogramChart/histogram_chart.php?title=Lengths%20of%20dinosaurs,%20in%20meters&onclick=y&task=Dinosaur&desc=Length&data=,%20[~wrgw~,6]%20,%20[~ewgwsr~,6]%20,%20[~shbtdgjnrf~,4]%20,%20[~ewsgerxfhrft~,4]%20,%20[~esgrshtdhjn~,3]

     //alert(teledata);

     //return teledata;

   }
All those “ismobile” alert popup box calls in the code above were already there, sussing out the logic needed for Google Chart Histogram Chart Select Event Synergy Tutorial, no doubt, which indicates one way in which to approach the debugging of the issue, some ways to this, for us, being …
- alert or console.log (combined with a web browser’s web inspector) approach
- write information to document.title for example
- use debugging approaches that the web inspector offers the programmer
We did indeed use a web inspector to get somewhere. We opened the Histogram in a webpage and opened the web inspector and pointed at the graph, and moved up to highlight the topmost “svg” element parent, and chose the option to “Copy OuterHTML” into a buffer we saved to a local text file. It came as a single very long line, but we calmly put line breaks in at every …
- <g
- <text
- <rect
… go us to …
<svg width="900" height="500" aria-label="A chart." style="overflow: hidden;"><defs id="_ABSTRACT_RENDERER_ID_0"><clipPath id="_ABSTRACT_RENDERER_ID_1">

<rect x="161" y="96" width="579" height="309"></rect></clipPath><filter id="_ABSTRACT_RENDERER_ID_2"><feGaussianBlur in="SourceAlpha" stdDeviation="2"></feGaussianBlur><feOffset dx="1" dy="1"></feOffset><feComponentTransfer><feFuncA type="linear" slope="0.1"></feFuncA></feComponentTransfer><feMerge><feMergeNode></feMergeNode><feMergeNode in="SourceGraphic"></feMergeNode></feMerge></filter></defs>

<rect x="0" y="0" width="900" height="500" stroke="none" stroke-width="0" fill="#ffffff"></rect>

<g><text text-anchor="start" x="161" y="70.9" font-family="Arial" font-size="14" font-weight="bold" stroke="none" stroke-width="0" fill="#000000">Roll of the die</text>

<rect x="161" y="59" width="579" height="14" stroke="none" stroke-width="0" fill-opacity="0" fill="#ffffff"></rect></g>

<g><rect x="161" y="96" width="579" height="309" stroke="none" stroke-width="0" fill-opacity="0" fill="#ffffff"></rect>

<g clip-path="url(http://www.rjmprogramming.com.au/PHP/HistogramChart/histogram_chart.php#_ABSTRACT_RENDERER_ID_1)">

<g><rect x="161" y="404" width="579" height="1" stroke="none" stroke-width="0" fill="#cccccc"></rect>

<rect x="161" y="360" width="579" height="1" stroke="none" stroke-width="0" fill="#cccccc"></rect>

<rect x="161" y="316" width="579" height="1" stroke="none" stroke-width="0" fill="#cccccc"></rect>

<rect x="161" y="272" width="579" height="1" stroke="none" stroke-width="0" fill="#cccccc"></rect>

<rect x="161" y="228" width="579" height="1" stroke="none" stroke-width="0" fill="#cccccc"></rect>

<rect x="161" y="184" width="579" height="1" stroke="none" stroke-width="0" fill="#cccccc"></rect>

<rect x="161" y="140" width="579" height="1" stroke="none" stroke-width="0" fill="#cccccc"></rect>

<rect x="161" y="96" width="579" height="1" stroke="none" stroke-width="0" fill="#cccccc"></rect>

<rect x="161" y="382" width="579" height="1" stroke="none" stroke-width="0" fill="#ebebeb"></rect>

<rect x="161" y="338" width="579" height="1" stroke="none" stroke-width="0" fill="#ebebeb"></rect>

<rect x="161" y="294" width="579" height="1" stroke="none" stroke-width="0" fill="#ebebeb"></rect>

<rect x="161" y="250" width="579" height="1" stroke="none" stroke-width="0" fill="#ebebeb"></rect>

<rect x="161" y="206" width="579" height="1" stroke="none" stroke-width="0" fill="#ebebeb"></rect>

<rect x="161" y="162" width="579" height="1" stroke="none" stroke-width="0" fill="#ebebeb"></rect>

<rect x="161" y="118" width="579" height="1" stroke="none" stroke-width="0" fill="#ebebeb"></rect></g>

<g><rect x="162.5" y="361" width="143" height="43" stroke="none" stroke-width="0" fill="#3366cc"></rect>

<rect x="162.5" y="317" width="143" height="43" stroke="none" stroke-width="0" fill="#3366cc"></rect>

<rect x="307.5" y="361" width="142" height="43" stroke="none" stroke-width="0" fill="#3366cc"></rect>

<rect x="307.5" y="317" width="142" height="43" stroke="none" stroke-width="0" fill="#3366cc"></rect>

<rect x="307.5" y="273" width="142" height="43" stroke="none" stroke-width="0" fill="#3366cc"></rect>

<g><rect x="307.5" y="229" width="142" height="43" stroke="none" stroke-width="0" fill="#3366cc"></rect>

<rect x="310" y="231.5" width="137" height="38" stroke="#ffffff" stroke-width="1" fill-opacity="0" fill="#ffffff"></rect></g>

<rect x="451.5" y="361" width="143" height="43" stroke="none" stroke-width="0" fill="#3366cc"></rect>

<rect x="451.5" y="317" width="143" height="43" stroke="none" stroke-width="0" fill="#3366cc"></rect>

<rect x="451.5" y="273" width="143" height="43" stroke="none" stroke-width="0" fill="#3366cc"></rect>

<rect x="451.5" y="229" width="143" height="43" stroke="none" stroke-width="0" fill="#3366cc"></rect>

<rect x="451.5" y="185" width="143" height="43" stroke="none" stroke-width="0" fill="#3366cc"></rect>

<rect x="451.5" y="141" width="143" height="43" stroke="none" stroke-width="0" fill="#3366cc"></rect>

<rect x="451.5" y="97" width="143" height="43" stroke="none" stroke-width="0" fill="#3366cc"></rect>

<rect x="596.5" y="361" width="142" height="43" stroke="none" stroke-width="0" fill="#3366cc"></rect></g>

<g><rect x="161" y="404" width="579" height="1" stroke="none" stroke-width="0" fill="#333333"></rect></g></g>

<g></g>

<g>

<g><text text-anchor="middle" x="161.5" y="425.9" font-family="Arial" font-size="14" stroke="none" stroke-width="0" fill="#444444">0</text></g>

<g><text text-anchor="middle" x="306" y="425.9" font-family="Arial" font-size="14" stroke="none" stroke-width="0" fill="#444444">2</text></g>

<g><text text-anchor="middle" x="450.5" y="425.9" font-family="Arial" font-size="14" stroke="none" stroke-width="0" fill="#444444">4</text></g>

<g><text text-anchor="middle" x="595" y="425.9" font-family="Arial" font-size="14" stroke="none" stroke-width="0" fill="#444444">6</text></g>

<g><text text-anchor="middle" x="739.5" y="425.9" font-family="Arial" font-size="14" stroke="none" stroke-width="0" fill="#444444">8</text></g>

<g><text text-anchor="end" x="147" y="409.4" font-family="Arial" font-size="14" stroke="none" stroke-width="0" fill="#444444">0</text></g>

<g><text text-anchor="end" x="147" y="365.4" font-family="Arial" font-size="14" stroke="none" stroke-width="0" fill="#444444">1</text></g>

<g><text text-anchor="end" x="147" y="321.4" font-family="Arial" font-size="14" stroke="none" stroke-width="0" fill="#444444">2</text></g>

<g><text text-anchor="end" x="147" y="277.4" font-family="Arial" font-size="14" stroke="none" stroke-width="0" fill="#444444">3</text></g>

<g><text text-anchor="end" x="147" y="233.4" font-family="Arial" font-size="14" stroke="none" stroke-width="0" fill="#444444">4</text></g>

<g><text text-anchor="end" x="147" y="189.4" font-family="Arial" font-size="14" stroke="none" stroke-width="0" fill="#444444">5</text></g>

<g><text text-anchor="end" x="147" y="145.4" font-family="Arial" font-size="14" stroke="none" stroke-width="0" fill="#444444">6</text></g>

<g><text text-anchor="end" x="147" y="101.4" font-family="Arial" font-size="14" stroke="none" stroke-width="0" fill="#444444">7</text></g></g></g>

<g></g>

</svg>
… and the …
<g><text text-anchor="middle" x="161.5" y="425.9" font-family="Arial" font-size="14" stroke="none" stroke-width="0" fill="#444444">0</text></g>

<g><text text-anchor="middle" x="306" y="425.9" font-family="Arial" font-size="14" stroke="none" stroke-width="0" fill="#444444">2</text></g>

<g><text text-anchor="middle" x="450.5" y="425.9" font-family="Arial" font-size="14" stroke="none" stroke-width="0" fill="#444444">4</text></g>

<g><text text-anchor="middle" x="595" y="425.9" font-family="Arial" font-size="14" stroke="none" stroke-width="0" fill="#444444">6</text></g>

<g><text text-anchor="middle" x="739.5" y="425.9" font-family="Arial" font-size="14" stroke="none" stroke-width="0" fill="#444444">8</text></g>
… tweaked our interest as of relevance to the codeline …
ts=svgsisvgsinnerHTML.split('text-anchor="middle"');
Yes, the five here match five parts to the Pie Chart “data” argument number of array structures. The string parts take aspects to their content from these svg text element innerHTML properties. We were happy with these, but the counts, no. We might expect an “eval” or a “Math.abs” bit of code be involved in working out those counts, perhaps? Yes, the codeline …
              if (Math.abs(eval(lastones[0]) - eval(xs[jts])) < 1.8) {  // used to be 1.0 (22/2/2021)

...

              }
… has all that, and compares those “x” attribute values, which, since those early days when “1.0” covered the differences, now needs “1.8” to be useful, and start to make for proper and realistic count values to happen. Yayyyyyyyyy!
In every coding enterprise, every character counts?!
Previous relevant Google Chart Histogram Chart Select Event Synergy Tutorial is shown below.
With Google Chart Select event scenarios it is good to look for synergies between the charts, and we’ve found one regarding the Histogram Chart and how it could have a useful “business logic” relationship, or “synergy” with the Pie Chart.
Along the way to harnessing this “synergy”, the (doh!) human view of it involving just counting up Histogram squares, the (poor old) program has to “reread” the “genius” of Google developers, and effectively recreating their great Histogram value “range” decisions, via Javascript DOM examination of SVG elements (effectively, feeling like, screen scraping), involving the examination of the Google API’s resultant HTML div element for the innerHTML property of its major SVG element, and look for …
- SVG text elements to glean Pie Chart region labels … and then a pass to look for …
- SVG rect elements and compare x parameters to find region matches for counting purposes, the final counts of which are passed into the URL to bring up the “synergy” Pie Chart, of interest
Software wise our HTML “Dynamic Pollster” code (itself) is unaffected by this new functionality but the amended Google Chart Histogram Chart (Select event) (in PHP) integration involved …
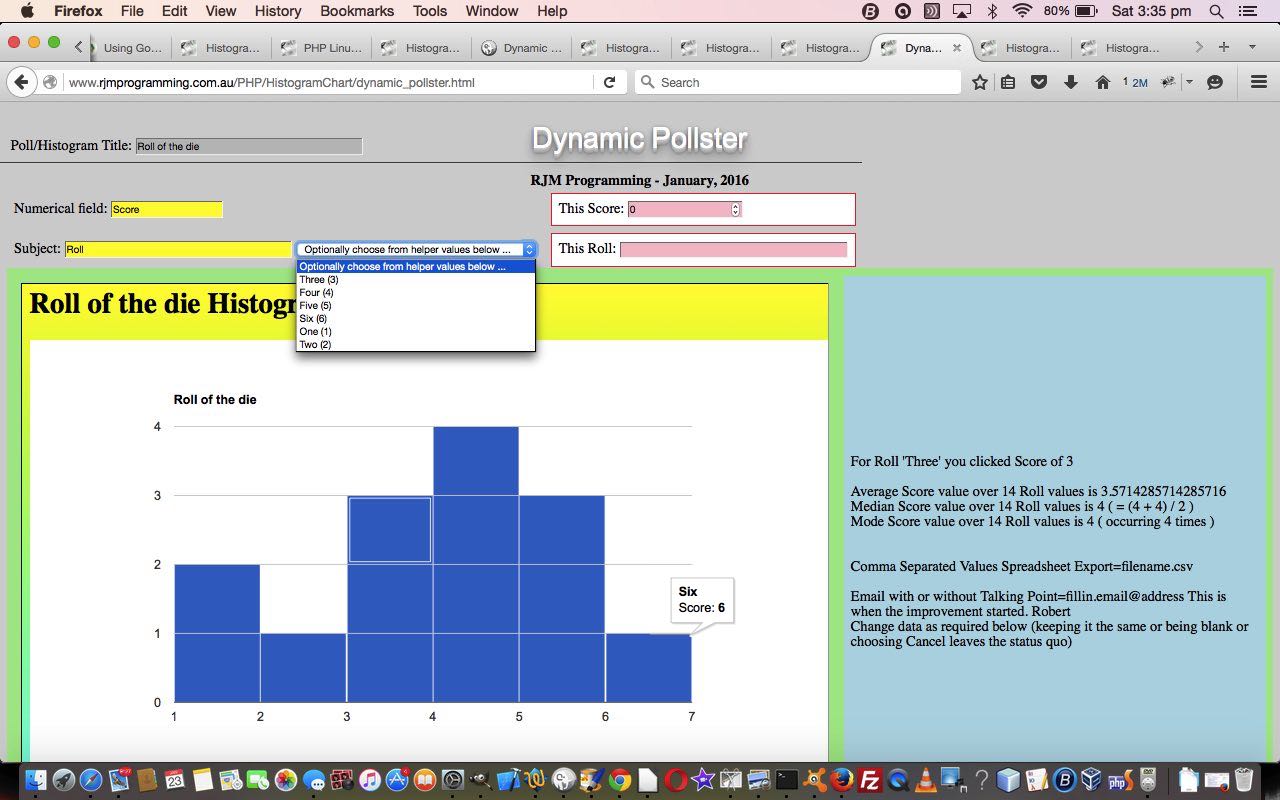
- histogram_chart.php changes (to improve the select event (mobile touch) functionality for Pie Chart synergy purposes … look out for function analyzesvg() Javascript function) and a Dynamic Poll button scenario to its HTML iframe is simulated by (ready for you to try an option “P” to see the “synergy” Pie Chart) … live run link, or the live run button related to today’s tutorial picture’s HTML iframe contents is
- dynamic_pollster.html (and a live run link) … unchanged from Google Chart Moving Histogram Chart Select Event Poll Tutorial as shown below (from yesterday)
Link to Google Chart Tools “spiritual home” … via Google.
Link to Google Chart Histogram Charts information … via Google.
Link to Google Chart Pie Charts information … via Google.
Link to our previous PHP/Javascript/HTML Google Chart Histogram Tutorial.
This extra ‘select’ event functionality of the Google Chart Histogram Chart web application (in the HTML iframe), available via the suffix “&onclick=y” applied to the Google Chart Histogram Chart title, flows on directly to the iPad iOS App we created and talked about, last, with Xcode Swift iOS Application End Game Primer Tutorial.
Previous relevant Google Chart Moving Histogram Chart Select Event Poll Tutorial is shown below.
Yesterday it was the the turn of Google Chart Histogram Charts to get them working for their Select event, which is like a mobile touch event and non-mobile click event on the Google Chart of interest (which we started on with Google Chart Histogram Chart Select Event Primer Tutorial as shown below), and today we test out that functionality with a real world idea which we like to think of as involving a “Moving Histogram”, and which we call “Dynamic Pollster”. This “Moving Histogram”, to us, and maybe to others, involves our web application making use of the Google Chart Histogram Chart, in an HTML iframe element, is like a polling station or experiment reading recorder, that asks the user to enter raw “finding” data, and dynamically piece together a “Moving Histogram” for that data, updated after every raw “finding” data set is entered. So the resultant iframe’s Histogram “moves” and is dynamic, similar to how the algorithm for “Moving Average” “moves” and is dynamic. By the way, we use a “Moving Average” algorithm when piecing together the “Select” event derivable …
- Average (or mean) value ( via “Moving Average” where
MovingAverage = ((PreviousMovingAverage x (-1 + NumberDataPoints)) + ThisValue) / (NumberDataPoints)) - Median (or middle) value
- Mode (or most numerously occurring) value
… and so we come to some of the practicalities of data sets that could get big … use an HTML form with method=POST to allow for the larger data sets.
Software wise our HTML “Dynamic Pollster” code and amended Google Chart Histogram Chart (Select event) (in PHP) integration involved …
- dynamic_pollster.html (and a live run link) … and the HTML iframe contents are worked by …
- histogram_chart.php changes (to improve the select event (mobile touch) functionality regarding POSTed data and emails and csv file creation) and live run link, or the live run button related to today’s tutorial picture’s HTML iframe contents is
- csv.php changes (regarding csv file creation changes)
Link to Google Chart Tools “spiritual home” … via Google.
Link to Google Chart Histogram Charts information … via Google.
Link to our previous PHP/Javascript/HTML Google Chart Histogram Tutorial.
This extra ‘select’ event functionality of the Google Chart Histogram Chart web application (in the HTML iframe), available via the suffix “&onclick=y” applied to the Google Chart Histogram Chart title, flows on directly to the iPad iOS App we created and talked about, last, with Xcode Swift iOS Application End Game Primer Tutorial.
Previous relevant Google Chart Histogram Chart Select Event Primer Tutorial is shown below.
Today it’s the turn of Google Chart Histogram Charts to get them working for their Select event, which is like a mobile touch event and non-mobile click event on the Google Chart of interest.
We believe in packing this Select event with business logic, and we think, for a Histogram Chart scenario it would be good to calculate the …
- Average (or mean) value
- Median (or middle) value
- Mode (or most numerously occurring) value
… for the Histogram data set. We do Dinosaur lengths today with the tutorial picture, but am sure you could well imagine a Real Estate Histogram of auction house or unit sale prices in a certain area (where the industry here in Australia is often interested in Median values).
Software wise our new Google Chart Histogram Chart (Select event) integration involved …
- histogram_chart.php changes (to cater for select event (mobile touch) functionality) and live run link
Link to Google Chart Tools “spiritual home” … via Google.
Link to Google Chart Histogram Charts information … via Google.
Link to our previous PHP/Javascript/HTML Google Chart Histogram Tutorial.
This extra ‘select’ event functionality, available via the suffix “&onclick=y” applied to the Google Chart Histogram Chart title, flows on directly to the iPad iOS App we created and talked about, last, with Xcode Swift iOS Application End Game Primer Tutorial.
So please try creating your own emailable Google Chart live run for …
A curiosity that came up while calculating the Median value of an even number of numbers got explained here … thanks.
If this was interesting you may be interested in this too.
If this was interesting you may be interested in this too.
If this was interesting you may be interested in this too.
If this was interesting you may be interested in this too.
If this was interesting you may be interested in this too.

