Do you remember our fears, expressed at Region Picker Popup Menu Tutorial, as we were discussing (what used to be) the brilliant Google Chart Image Chart functionality …
… and we feel we might have “put the mockers” on ourselves, because, as you may have read, Geo Chart Image Chart is due for deprecation soon. In fact, the regime at the moment is fewer and fewer hours up, and we’ll have to turn our attention to alternatives. But what out there can do those regional views where the map effectively hugs the bounds of the data … brilliant, and we think hard to do with your normal Google Charts suite of software? As well as the image element result, even though we need to try out the “ready event” normal Google Charts “print” way to achieve this. So much more useful than involving Javascript. And more fun to work with too, it being a conduit to HTML canvas usage.
… regarding it’s imminent demise (and don’t you just hate the word “deprecation”)?
Well, it happened. Where does that leave our integrations regarding Google Chart Image Chart Map Chart we developed with this inhouse PHP interfacing web application? Well, lots is still showing, “hoping for redemption”, and the GeoJson button functionality is still intact. That is, barring “friendly fire”?!
Yes, we’re not sure when, but maybe at the time of the recent Google Chart Image Chart Map Chart Mainstream Primer Tutorial we may have introduced a bug, and today we’re here to try to remedy that situation. That situation goes …
- navigate to image_chart.php
- fill in a comma separated list of ISO 2 character country codes into that first textbox …
- click GeoJson button
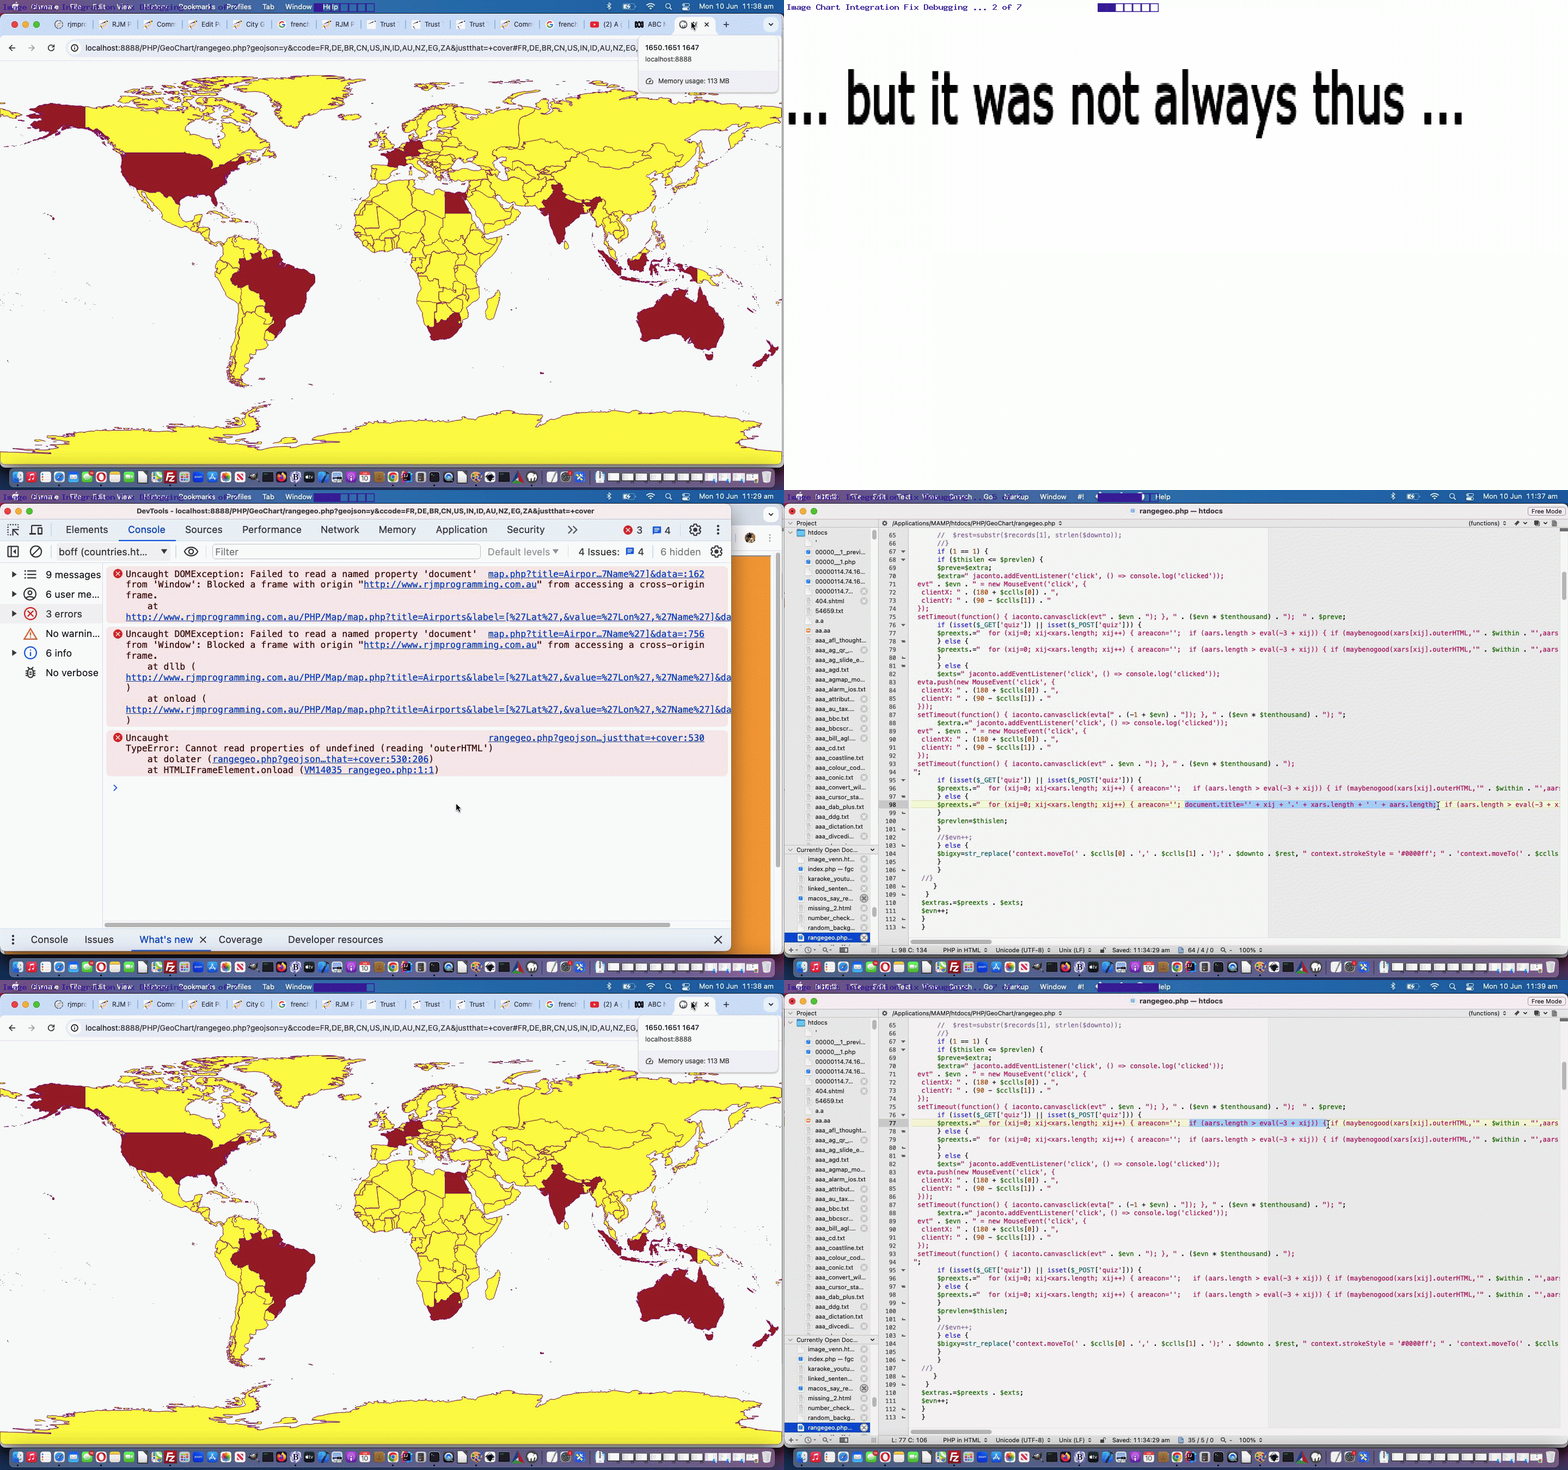
… and it would keep a “cloudy woooorrrrlllllddd map”, alas. We debugged it, using Google Chrome’s web inspector, again. The error message, and here the lesson is to believe the “red squiggle underlining parts” …
for (xij=0; xij<xars.length; xij++) { areacon=''; if (maybenogood(xars[xij].outerHTML,'FR,DE,BR,CN,US,IN,ID,AU,NZ,EG,ZA',aars[Math.max(0,eval(-3 + xij))].outerHTML).indexOf( ... blahde blah ...
… in the context of the presented error …
TypeError: Cannot read properties of undefined (reading ‘outerHTML’)
… prompted us to come up with the amended codeline …
for (xij=0; xij<xars.length; xij++) { areacon=''; if (aars.length > eval(-3 + xij)) { if (maybenogood(xars[xij].outerHTML,'FR,DE,BR,CN,US,IN,ID,AU,NZ,EG,ZA',aars[Math.max(0,eval(-3 + xij))].outerHTML).indexOf( ... blahde blah ... } ...
… made things right again in the changed rangegeo.php PHP helping code for web application GeoJson button logic.
Previous relevant Google Chart Image Chart Map Chart Mainstream Primer Tutorial is shown below.
Ever since we discovered the existence of Google Chart Image Chart Map Charts, the first foray ending with the recent Google Chart Image Chart Map Chart GeoJson Onclick Tutorial, we’ve been keen to hive off functionality …
- from the overused Google Chart Map Chart (no Image Chart) …
- to both …
- Google Chart Geo Chart and
- Google Chart Image Chart Map Chart
… given what we’ve learnt regarding each of the above‘s talents, the new member of the interest group bringing regional maps into the picture better for us.
Over many years of integrating the first as the first port of call, though, has us thinking carefully of non “bull at a gate” approaches, and today, we’re only visiting the first idea of our “three point plan” (so far) …
- Help itself … map.php … phase 1
- Redirect to Image Chart Map Chart … map.php and/or geo_chart.php … just after first prompt … phase 2
- Caller form method=POST map.php action interventions at onsubmit event … non map.php … phase 3
… asking our favourite integrator to take a hit for the good of the team. Currently map.php is stuck in the bedroom, but we fully expect they’ll be out in just a jiffy to show you a “three part” (so far) PHP code intervention sequence here …
.
.
.
.
.
.
.
.
.
.
.
.
.
.
.
.
.
.
.
.
.
.
.
.
.
.
.
. … welcome back “mappy” …
  var isusdams='<?php echo (isset($_POST['iso']) ? trim(str_replace('+',' ',urldecode($_POST['iso']))) : (isset($_GET['iso']) ? trim(str_replace('+',' ',urldecode($_GET['iso']))) : '')); ?>';

  if (window.top || isusdams.trim() != '') {

        if (isusdams.trim() != '') {

          if (isusdams.indexOf(';') == -1) { isusdams+=';'; }

        } else if (top.document.URL.indexOf('/dams_usa.htm') != -1) {

          isusdams='US;';

        } else if (top.document.URL.indexOf('/australian_') != -1) {

          isusdams='AU;';

        } else if (document.URL.indexOf('iso=') != -1) {

          isusdams=document.URL.split('iso=')[1].split('&')[0].split('#')[0] + ';';

        } else if (parent.document.URL.indexOf('/tz_places.php?iso=') != -1) {

          isusdams=parent.document.URL.split('/tz_places.php?iso=')[1].split('&')[0].split('#')[0] + ';';

        } else if (top.document.URL.indexOf('/tz_places.php?iso=') != -1) {

          isusdams=top.document.URL.split('/tz_places.php?iso=')[1].split('&')[0].split('#')[0] + ';';

        }

  } else if (document.URL.indexOf('iso=') != -1) {

          isusdams=document.URL.split('iso=')[1].split('&')[0].split('#')[0] + ';';

  }

  if (isusdams != '') {  // amapidgeo

        if (document.getElementById('amapidgeo')) {

          document.getElementById('amapidgeo').click();

        } else {

          setTimeout(latergeoclick, 5000);

        }

  }

}


function latergeoclick() {

        if (document.getElementById('amapidgeo')) {

          document.getElementById('amapidgeo').click();

        }

}
… and …
<?php echo ”
   function gogeo(usug) {

     if (documentURL.indexOf('data=') != -1) {

      if ((documentURL + '~').indexOf('&data=~') != -1 && ('' + pardata).replace('undefined','') != '') {

        documentURL=documentURL + pardata;

      }

      var isusdams='" . (isset($_POST['iso']) ? trim(str_replace('+',' ',urldecode($_POST['iso']))) : (isset($_GET['iso']) ? trim(str_replace('+',' ',urldecode($_GET['iso']))) : '')) . "';

      if (window.top || isusdams.trim() != '') {

        if (isusdams.trim() != '') {

          if (isusdams.indexOf(';') == -1) { isusdams+=';'; }

        } else if (top.document.URL.indexOf('/dams_usa.htm') != -1) {

          isusdams='US;';

        } else if (top.document.URL.indexOf('/australian_') != -1) {

          isusdams='AU;';

        } else if (document.URL.indexOf('iso=') != -1) {

          isusdams=document.URL.split('iso=')[1].split('&')[0].split('#')[0] + ';';

        } else if (parent.document.URL.indexOf('/tz_places.php?iso=') != -1) {

          isusdams=parent.document.URL.split('/tz_places.php?iso=')[1].split('&')[0].split('#')[0] + ';';

        } else if (top.document.URL.indexOf('/tz_places.php?iso=') != -1) {

          isusdams=top.document.URL.split('/tz_places.php?iso=')[1].split('&')[0].split('#')[0] + ';';

        }

      } else if (document.URL.indexOf('iso=') != -1) {

          isusdams=document.URL.split('iso=')[1].split('&')[0].split('#')[0] + ';';

      }

      if (isusdams != '') {

      locationhref=toolong((documentURL + '%20,%20[-90.0|0.0|~%20~,999999999]').replace('/Map', '/GeoChart').replace('map.php', 'geo_chart.php').replace('?','?width=556&height=347&country=Places&popularity=&aregeographicals=y&').replace('title=','title=' + isusdams).replace(/\=\,/g,'=').replace(/\,\~/g,'|~').replace(/0\,/g,'0|').replace(/1\,/g,'1|').replace(/2\,/g,'2|').replace(/3\,/g,'3|').replace(/4\,/g,'4|').replace(/5\,/g,'5|').replace(/6\,/g,'6|').replace(/7\,/g,'7|').replace(/8\,/g,'8|').replace(/9\,/g,'9|').replace('%27|%20','%27,%20').replace('%27|','%27,').replace(/\~\]/g,'~,1]'));

      } else {

      locationhref=toolong((documentURL + '%20,%20[-90.0|0.0|~%20~,999999999]').replace('/Map', '/GeoChart').replace('map.php', 'geo_chart.php').replace('?','?width=556&height=347&country=Places&popularity=&aregeographicals=y&').replace(/\=\,/g,'=').replace(/\,\~/g,'|~').replace(/0\,/g,'0|').replace(/1\,/g,'1|').replace(/2\,/g,'2|').replace(/3\,/g,'3|').replace(/4\,/g,'4|').replace(/5\,/g,'5|').replace(/6\,/g,'6|').replace(/7\,/g,'7|').replace(/8\,/g,'8|').replace(/9\,/g,'9|').replace('%27|%20','%27,%20').replace('%27|','%27,').replace(/\~\]/g,'~,1]'));

      }

      //locationhref=toolong((documentURL + ',[-90.0,0.0,~%20~,999999999]').replace('/Map', '/GeoChart').replace('map.php', 'geo_chart.php').replace('?','?width=556&height=347&country=Places&popularity=&aregeographicals=' + agy + '&').replace(/\=\,/g,'=').replace(/\,\~/g,'|~').replace(/0\,/g,'0|').replace(/1\,/g,'1|').replace(/2\,/g,'2|').replace(/3\,/g,'3|').replace(/4\,/g,'4|').replace(/5\,/g,'5|').replace(/6\,/g,'6|').replace(/7\,/g,'7|').replace(/8\,/g,'8|').replace(/9\,/g,'9|').replace('%27|%20','%27,%20').replace('%27|','%27,').replace(/\~\]/g,'~,1]'));

      //locationhref=toolong((documentURL + '').replace('/Map', '/GeoChart').replace('map.php', 'geo_chart.php').replace('?','?width=556&height=347&country=Places&popularity=&aregeographicals=' + agy + '&').replace(/\=\,/g,'=').replace(/\,\~/g,'|~').replace(/0\,/g,'0|').replace(/1\,/g,'1|').replace(/2\,/g,'2|').replace(/3\,/g,'3|').replace(/4\,/g,'4|').replace(/5\,/g,'5|').replace(/6\,/g,'6|').replace(/7\,/g,'7|').replace(/8\,/g,'8|').replace(/9\,/g,'9|').replace('%27|%20','%27,%20').replace('%27|','%27,').replace(/\~\]/g,'~,1]'));

     } else {

      locationhref=usug;

     }

     if (locationhref != '#') { location.href=locationhref; } locationhref='';

   }
“; ?>
… and within the map.php interactivity logic …
<?php
echo ' var title = ourprompt("Enter Map Title (background image URL or image data URI ; separated (followed by ;) before title are options, and suffix by &iso=XX for XX as country code of interest and suffix by &lines=y for overlay clickable link lines and/or suffix by &onclick=y for all onclick functionalities such as &brgplace=[1] for Bearing Distance table and perhaps &brgmode=trip for that table in trip order). Email Attachment Title suffixes are &emailto=[emailTo] &emailsubject=[EmailSubject] ... ' . $promptsuffix . '", "' . str_replace("+"," ",urldecode($GETtitle)). '"); ' . "\n";
?>
… in the changed map.php.php PHP code for our inhouse Google Chart Map Chart interfacer, starting off with “hive offs” to the Geo Chart in this “first of three” (so far) operation we’ve codenamed …
.
.
.
.
.
.
.
.
.
.
.
.
.
.
.
.
.
.
.
.
.
.
.
.
.
.
. … over to you “mappy” …
“first of three” (so far) operation
Previous relevant Google Chart Image Chart Map Chart GeoJson Onclick Tutorial is shown below.
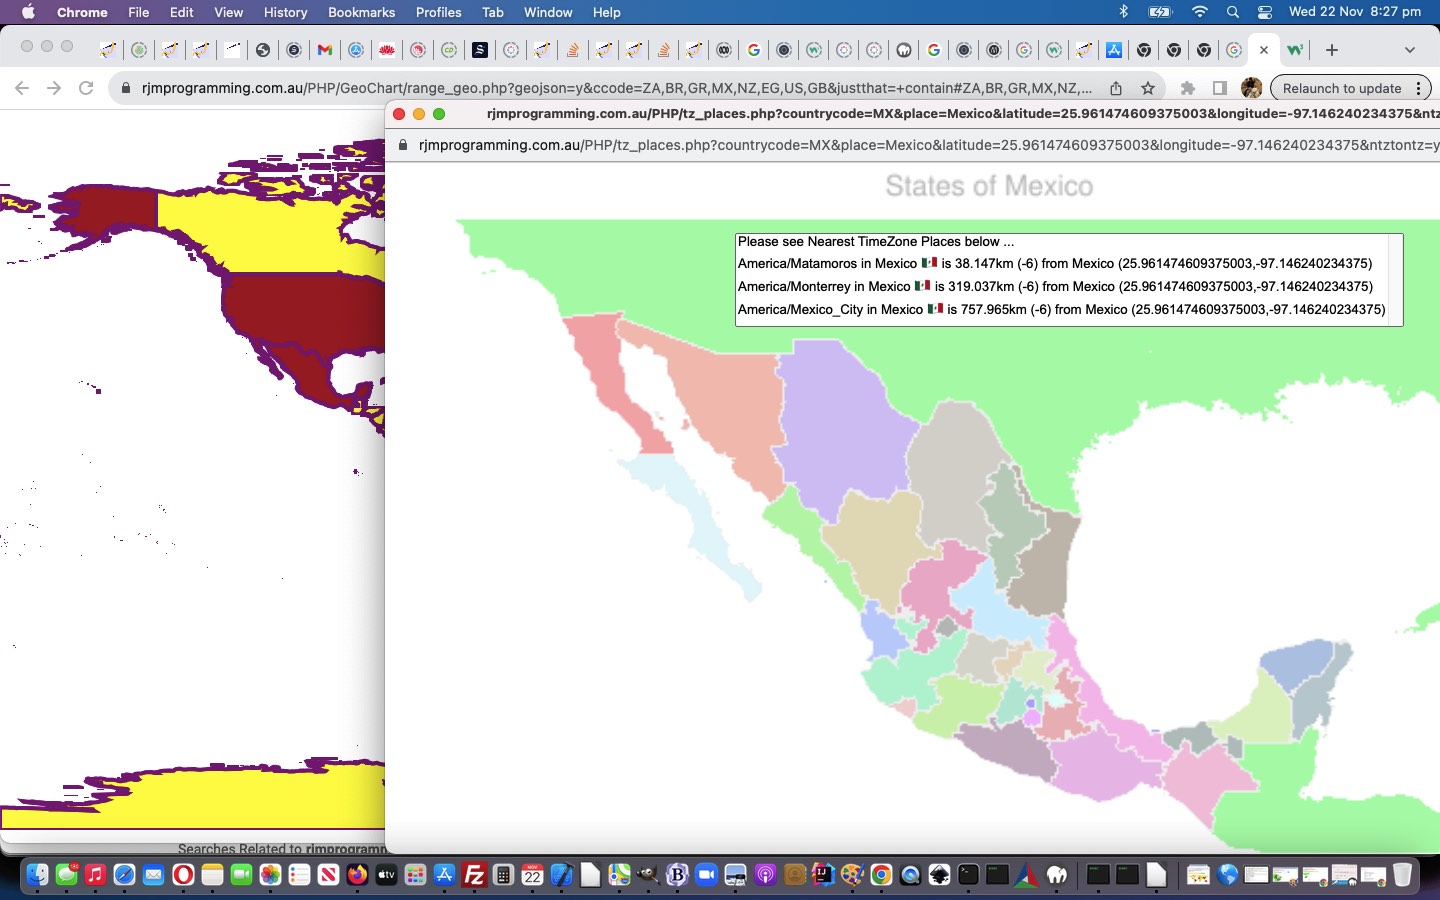
Still on the “reconstituting” trajectory yesterday’s Google Chart Image Chart Map Chart GeoJson Iframe Tutorial had, continuing on with regarding our interfacing to the Google Charts Image Chart Map Chart hosting of GeoJson functionality, today, we “reconstitute” some “onclick” event logics for those brown map infills that occur. Why? Well, we figure user experience wise, people often assume a deliberately colour coded situation like this means that they might glean further information by clicking on that “minority color” at the very least, especially when we are talking “maps”, here.
If you’re happy, and you know it, feel free to honk!
Okay then, what do we do with these new HTML div element “onclick” event logics. Well, so far, we’re showing a list of three nearby timezones, but the main thing is to establish the “infrastructure” to get to this event logic, and often, what you do once there, is less work. Not always, but quite often, we find.
  function checkdsa(ath) {

   return '';

  }


  function orflag(thiscc) {

      var ccchar='', ccsuff='';

      var lri='ABCDEFGHIJKLMNOPQRSTUVWXYZ';

      var dri=['127462','127463','127464','127465','127466','127467','127468','127469','127470','127471','127472','127473','127474','127475','127476','127477','127478','127479','127480','127481','127482','127483','127484','127485','127486','127487'];

      for (var iccsuff=0; iccsuff<thiscc.length; iccsuff++) {

        ccchar=thiscc.substring(iccsuff, eval(1 + eval('' + iccsuff))).toUpperCase();

        ccsuff+=String.fromCodePoint(eval('' + dri[eval('' + lri.indexOf(ccchar))])); //'&#' + dri[eval('' + lri.indexOf(ccchar))] + ';';

      }

      return ccsuff;

  }


  function ouralert(athis, ctyname, isothree, isotwo, inclist) {

   if (isotwo == 'CH') { isotwo='CN'; }

   if (goes == 0) { goes=1; answered=true; }

   if (('' + isotwo).length == 2) { jtwo=isotwo; }

   if (inclist.indexOf(',') != -1) {

   lastflag='';

   lasttwo='';

   if (isotwo.trim() != '') {

   lasttwo=isotwo;

   lastflag=' ' + orflag(isotwo);

   }

   checkdsa(athis);

   var cls=inclist.replace('Longitude,Latitude coordinates are ','').split(',');

   longlastl=ctyname + ': ' + inclist;

   //document.getElementById('ntz').value='';

   if (cwo) {

     if (!cwo.closed) { cwo.close(); }

   }

   cwo=window.open('/PHP/tz_places.php?countrycode=' + encodeURIComponent(isotwo) + '&place=' + encodeURIComponent(ctyname) + '&latitude=' + encodeURIComponent(cls[1]) + '&longitude=' + encodeURIComponent(cls[0]) + '&ntztontz=y','_blank','top=100,left=100,width=1200,height=250');

   cwo.onload=function(){

      cwo.document.title='' + ctyname;

   };

   //setTimeout(lookforntz, 1000);

   }

  }
Hived off what the GeoJson World Countries web application already did was …
- used to, in its HTML area elements, set up the “onclick” call to that version of function ouralert … so we transferred that across to …
- brown coloured reconstituted HTML div elements
… and tweaked code in the changed rangegeo.php PHP helping code for web application GeoJson button logic.
Stop Press
Today’s work met with a previously established PHP code file, again, and so we’ve taken the opportunity, being as we tweaked above, adding new arguments, to change this tz_places.php by adding some more country specific smarts to the resultant display for the scenario where rangegeo.php is calling it.
It’s not full functionality, but also, today, we open the way to some Google Translate translation interfacing with our tweaked image_chart.php PHP web application for you to try.
If this was interesting you may be interested in this too.
If this was interesting you may be interested in this too.
If this was interesting you may be interested in this too.


