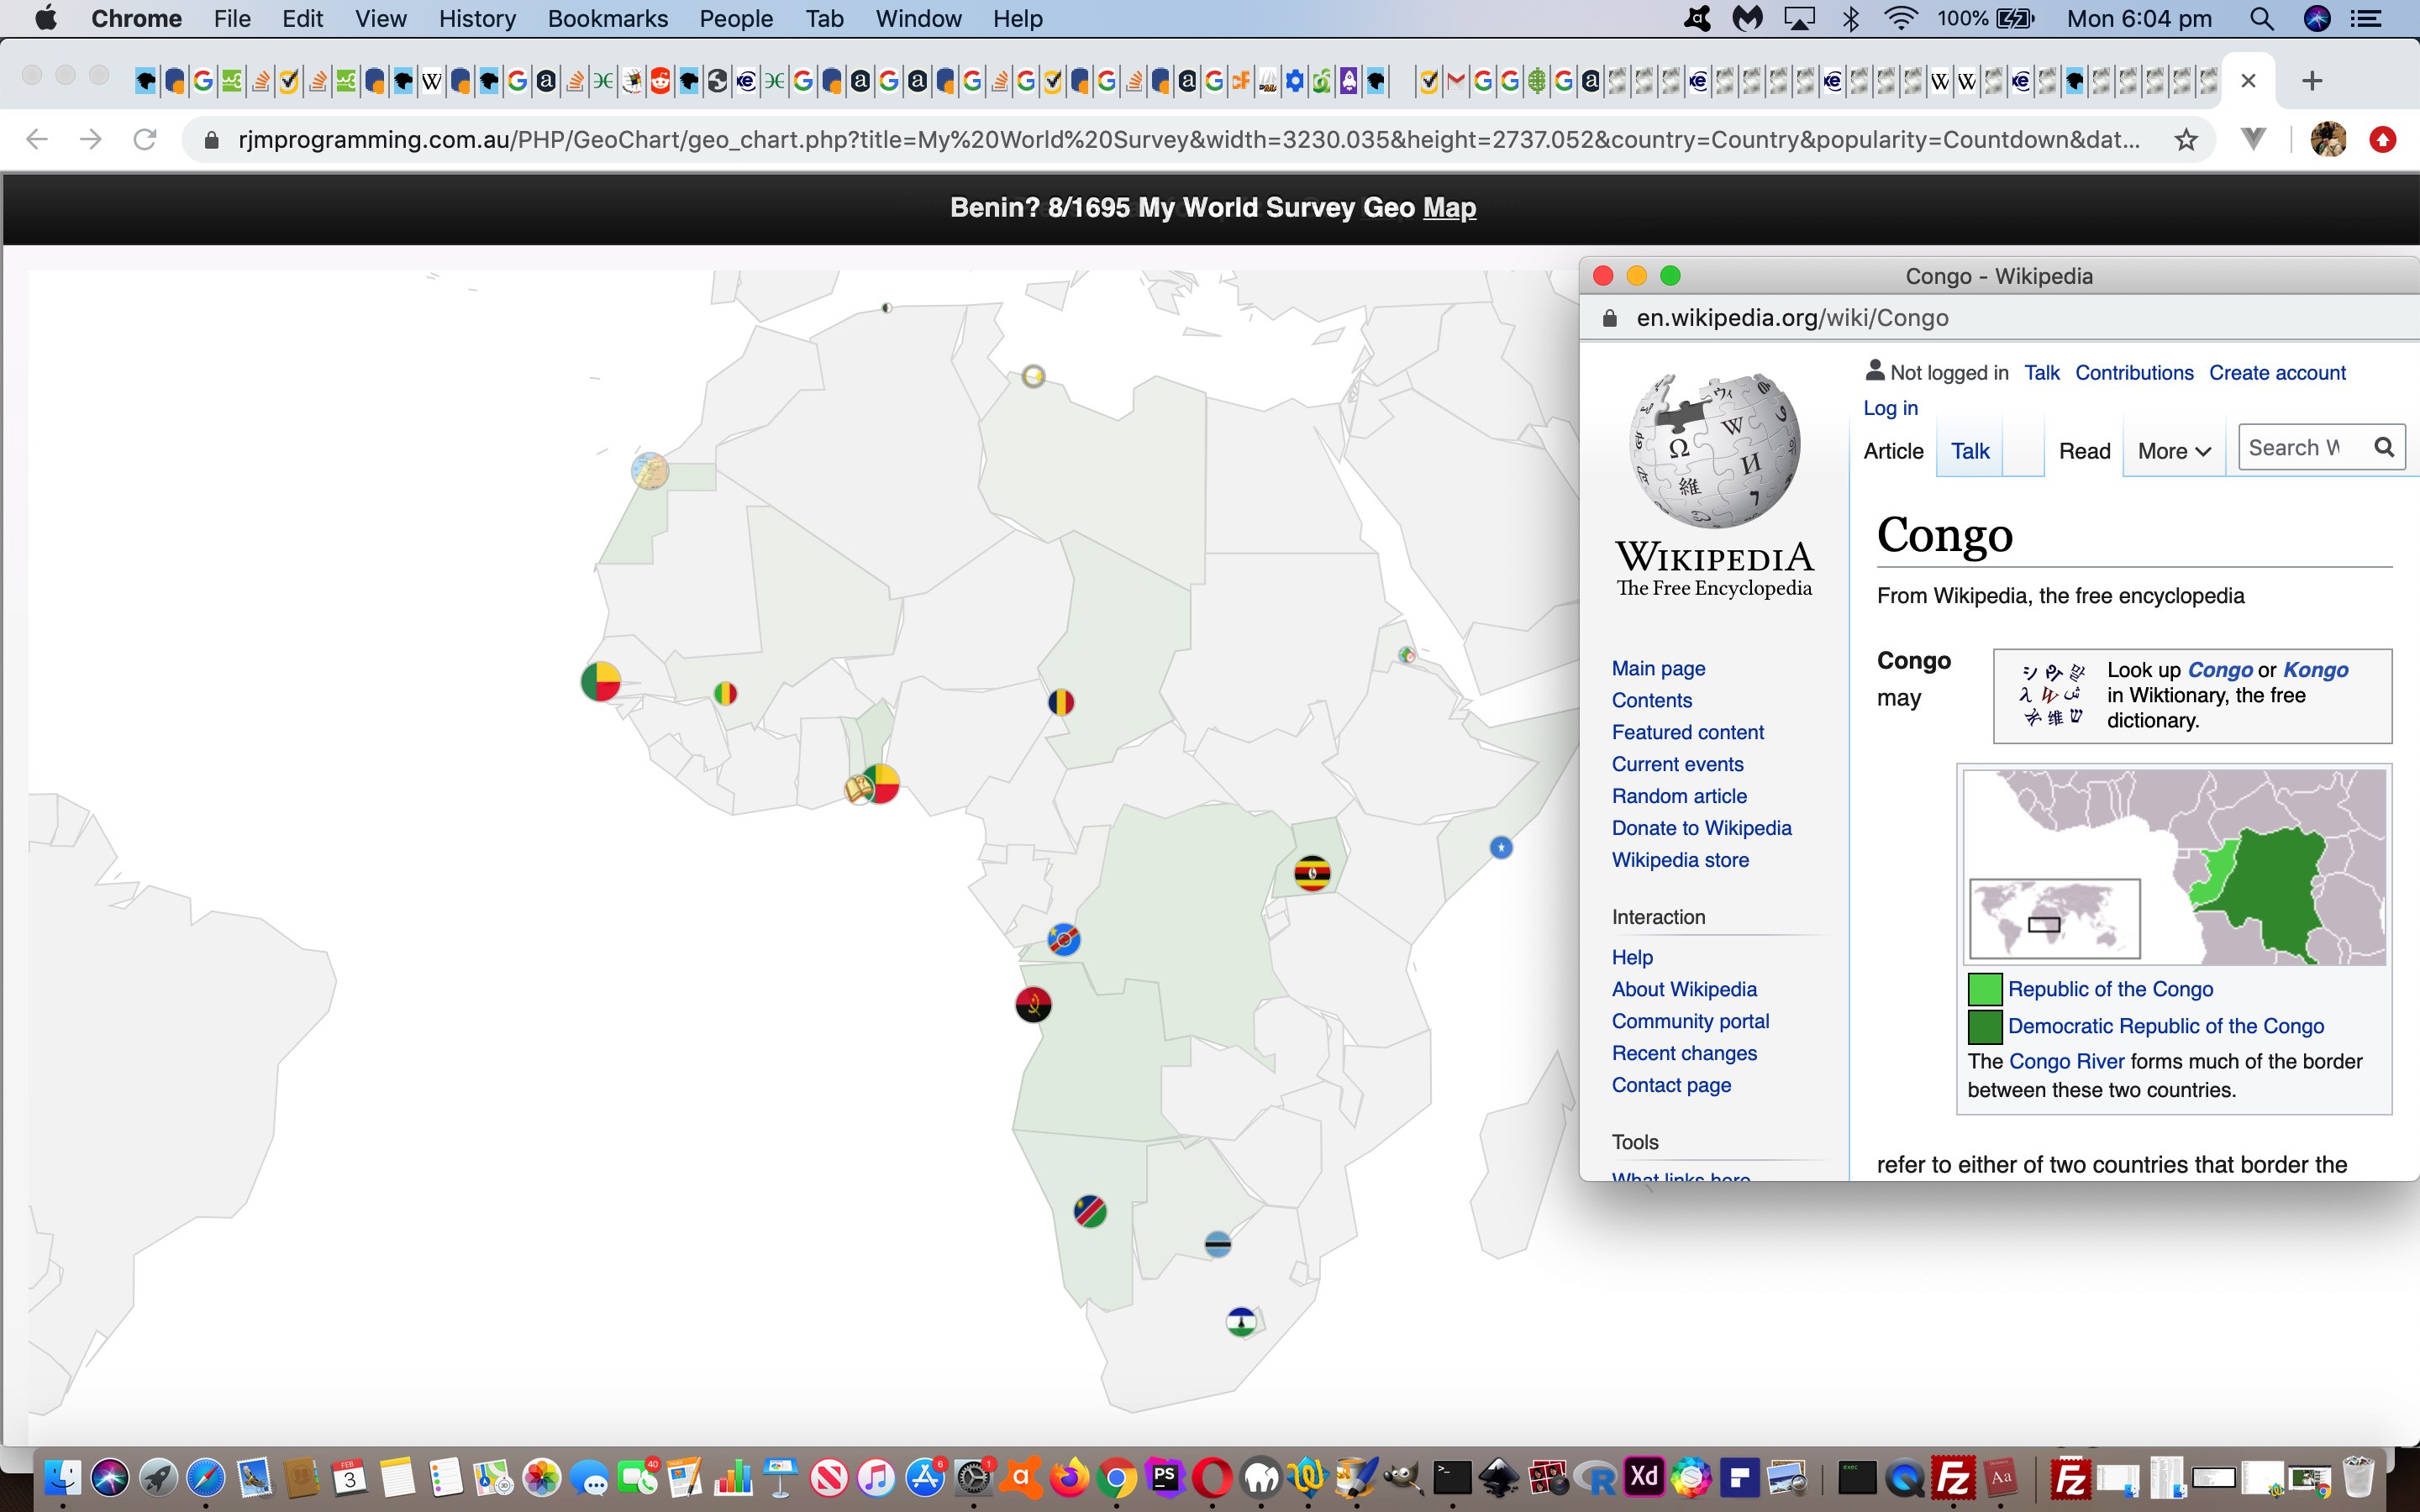
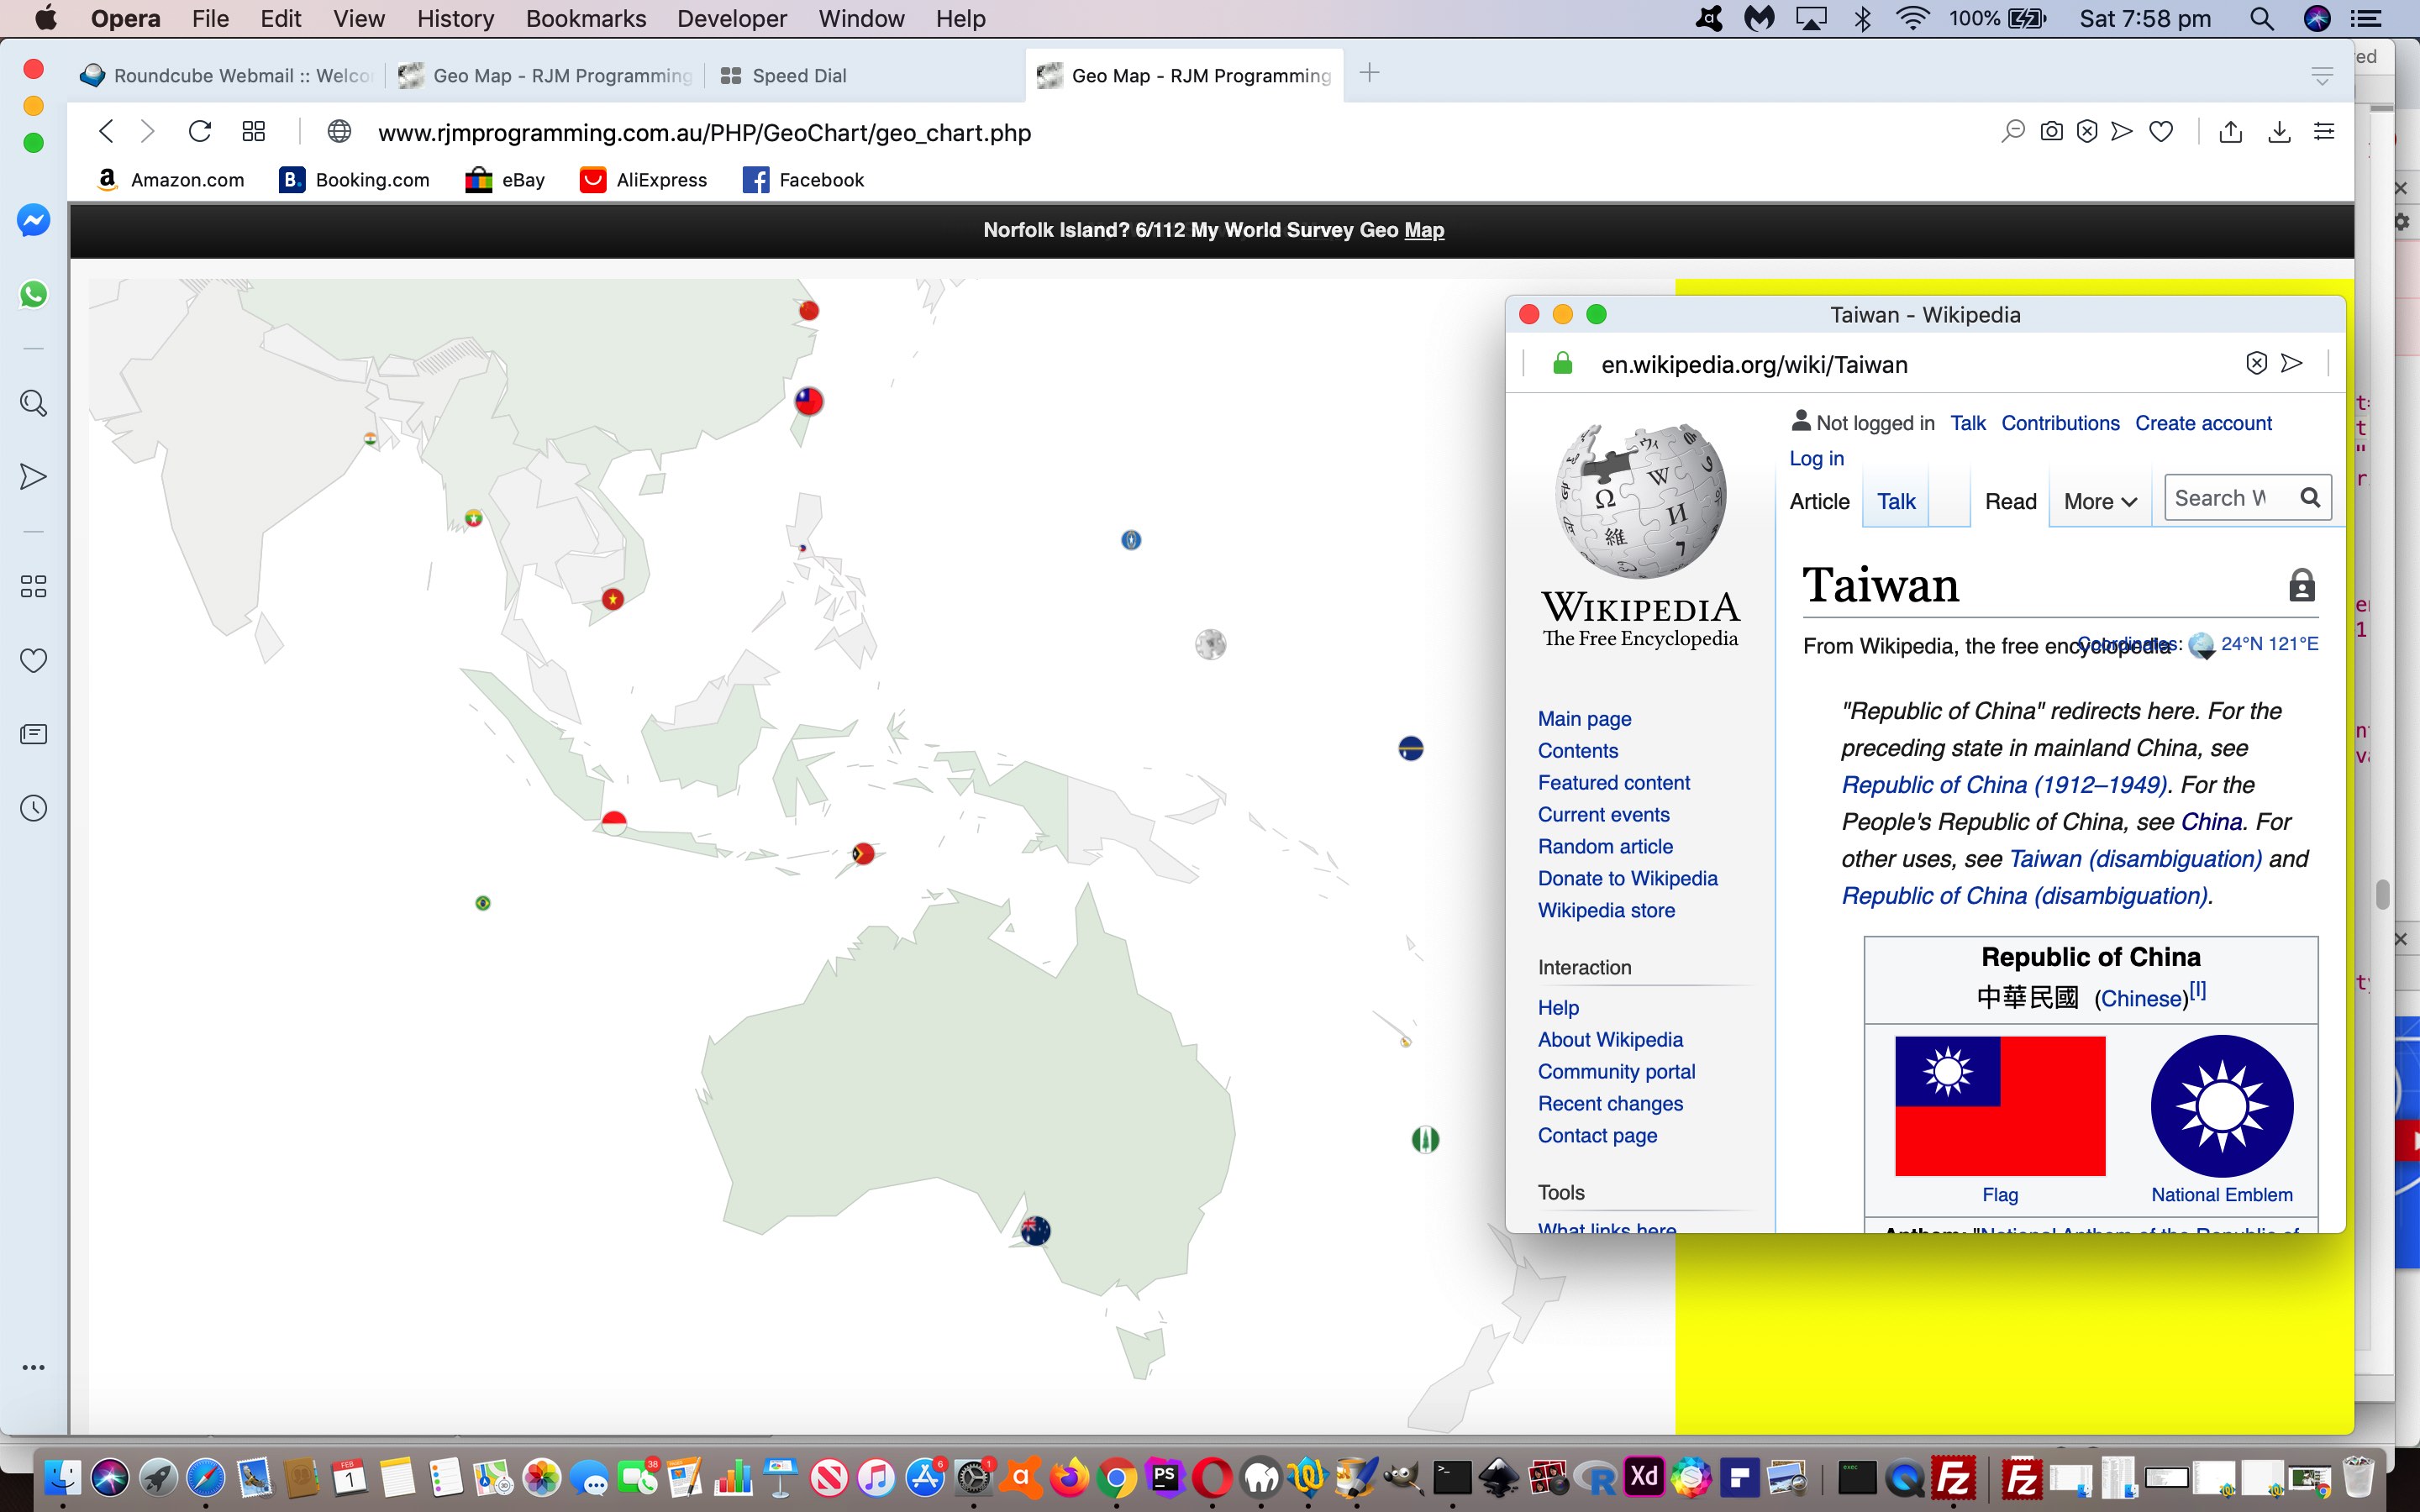
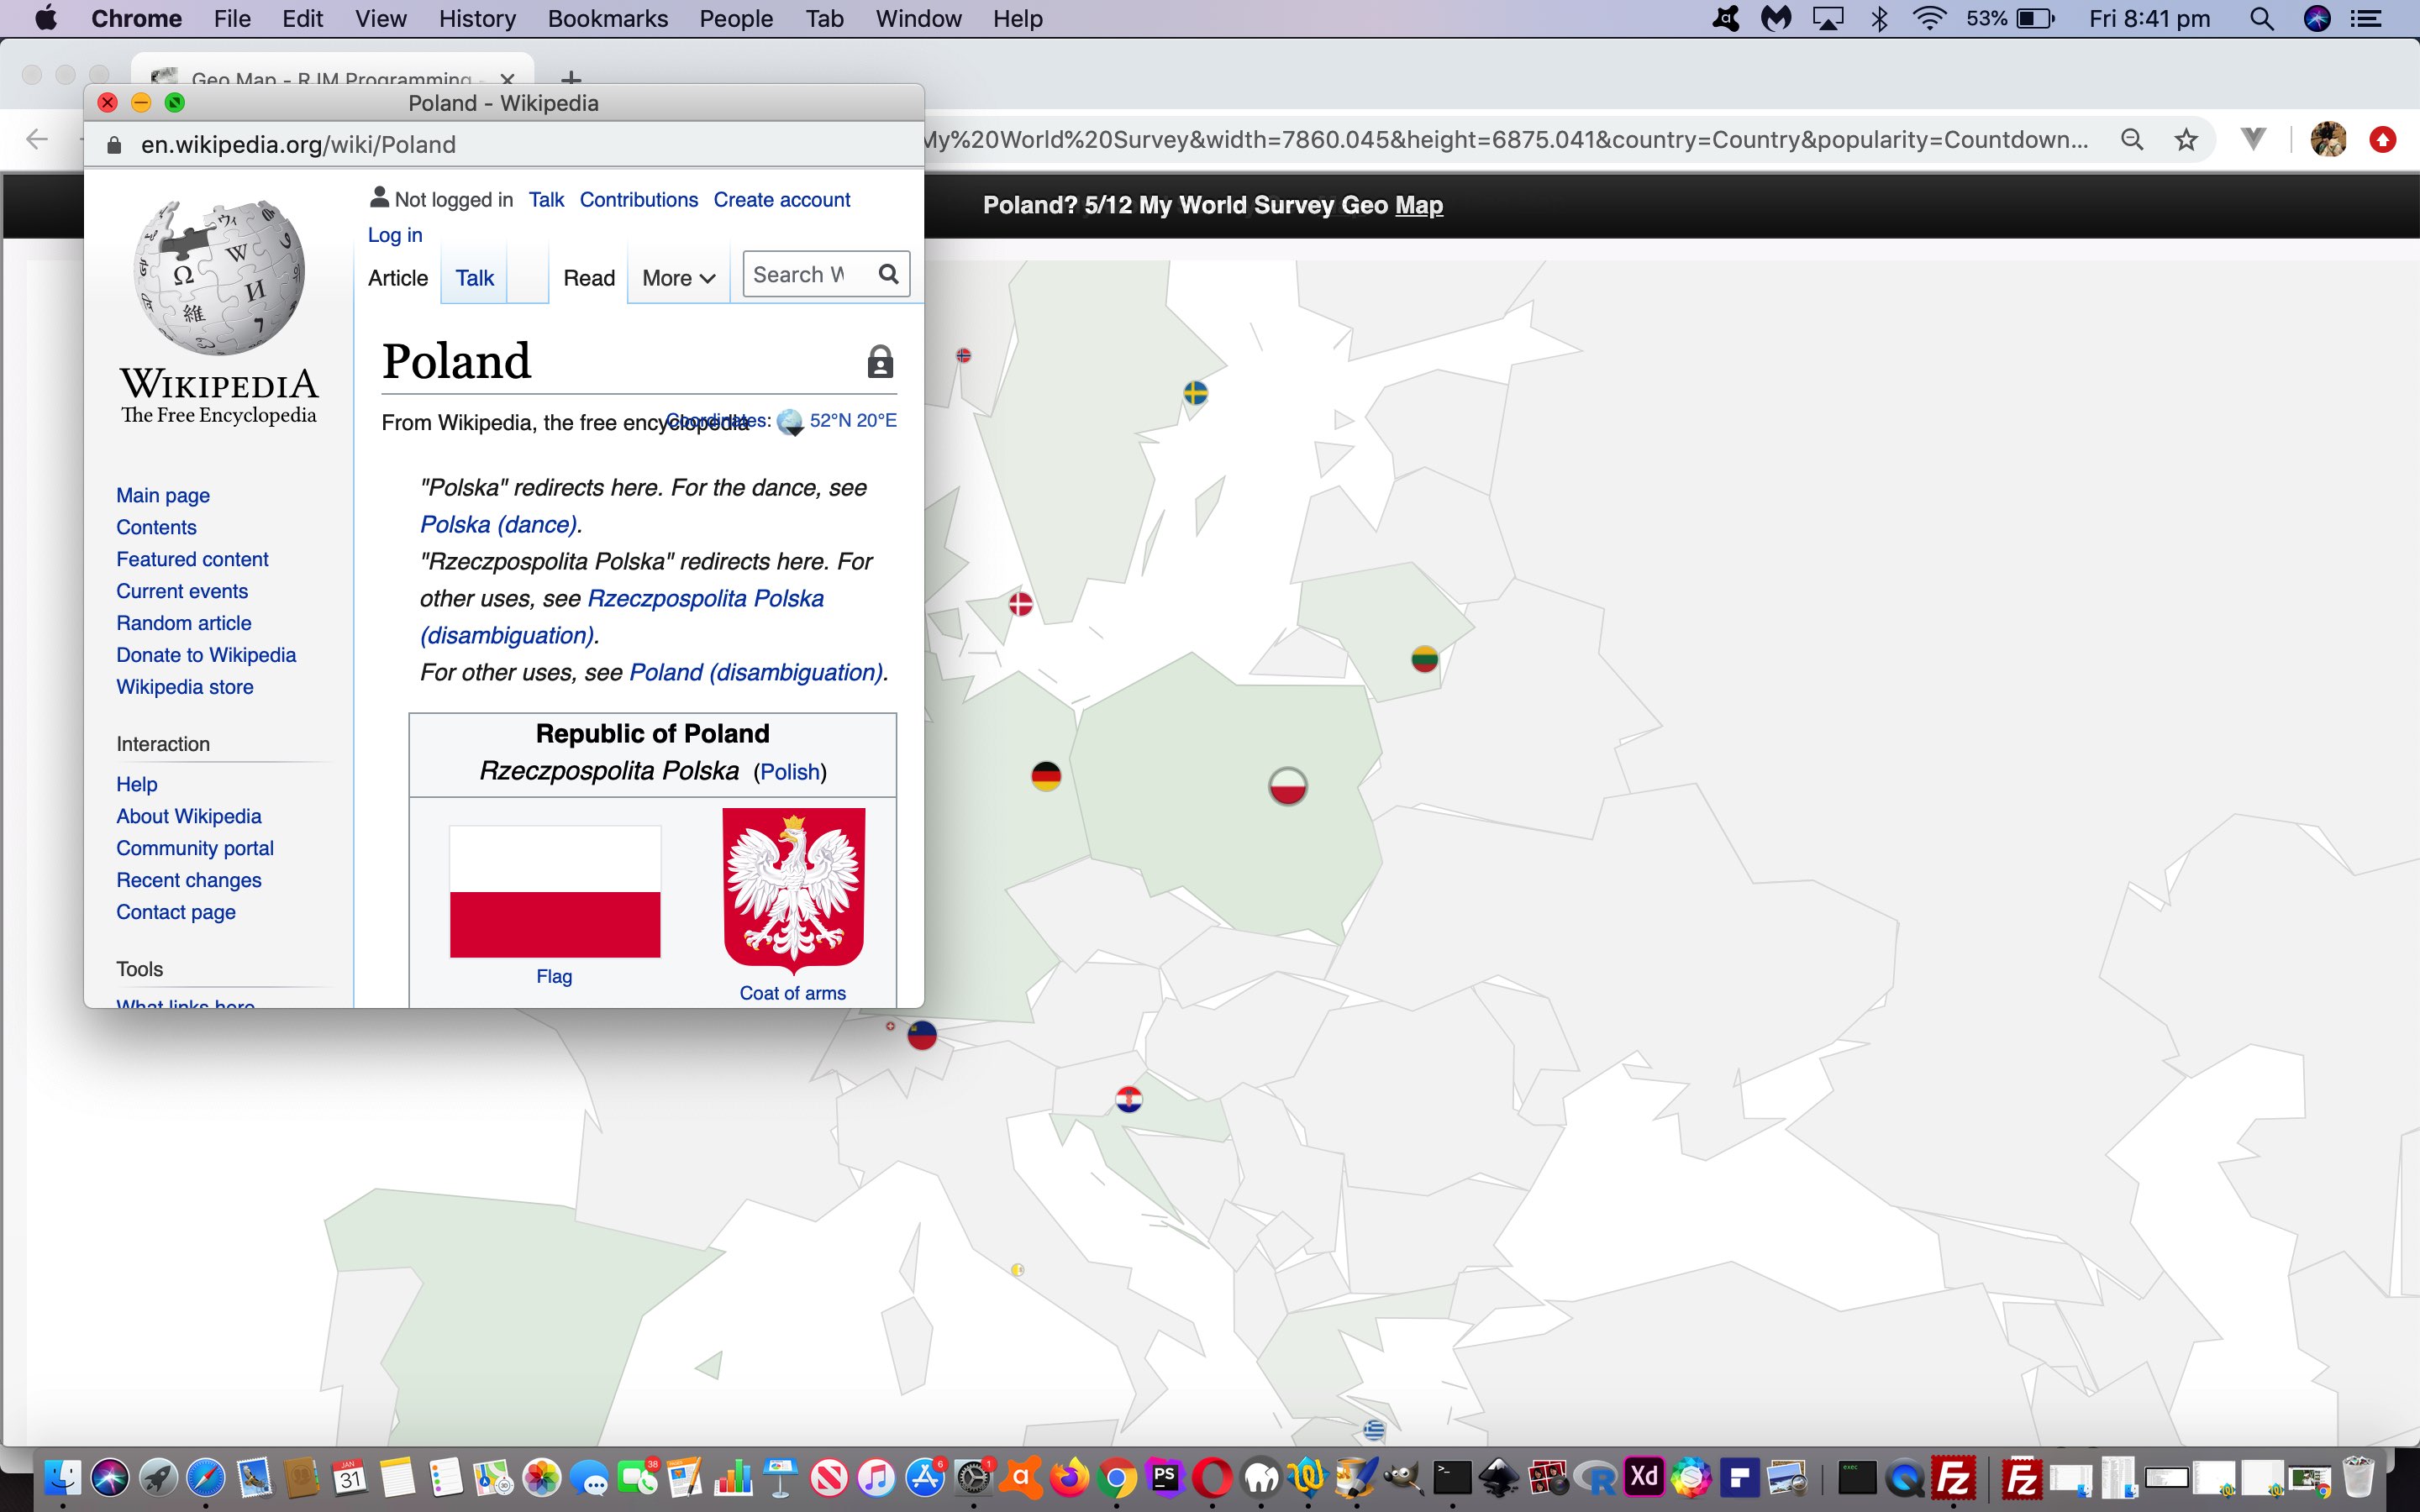
There is an expression so apt for today’s situation. But we hate it, so … no … we’ll say instead …
Our fault mainly, not Google’s fault only
… regarding yesterday’s …
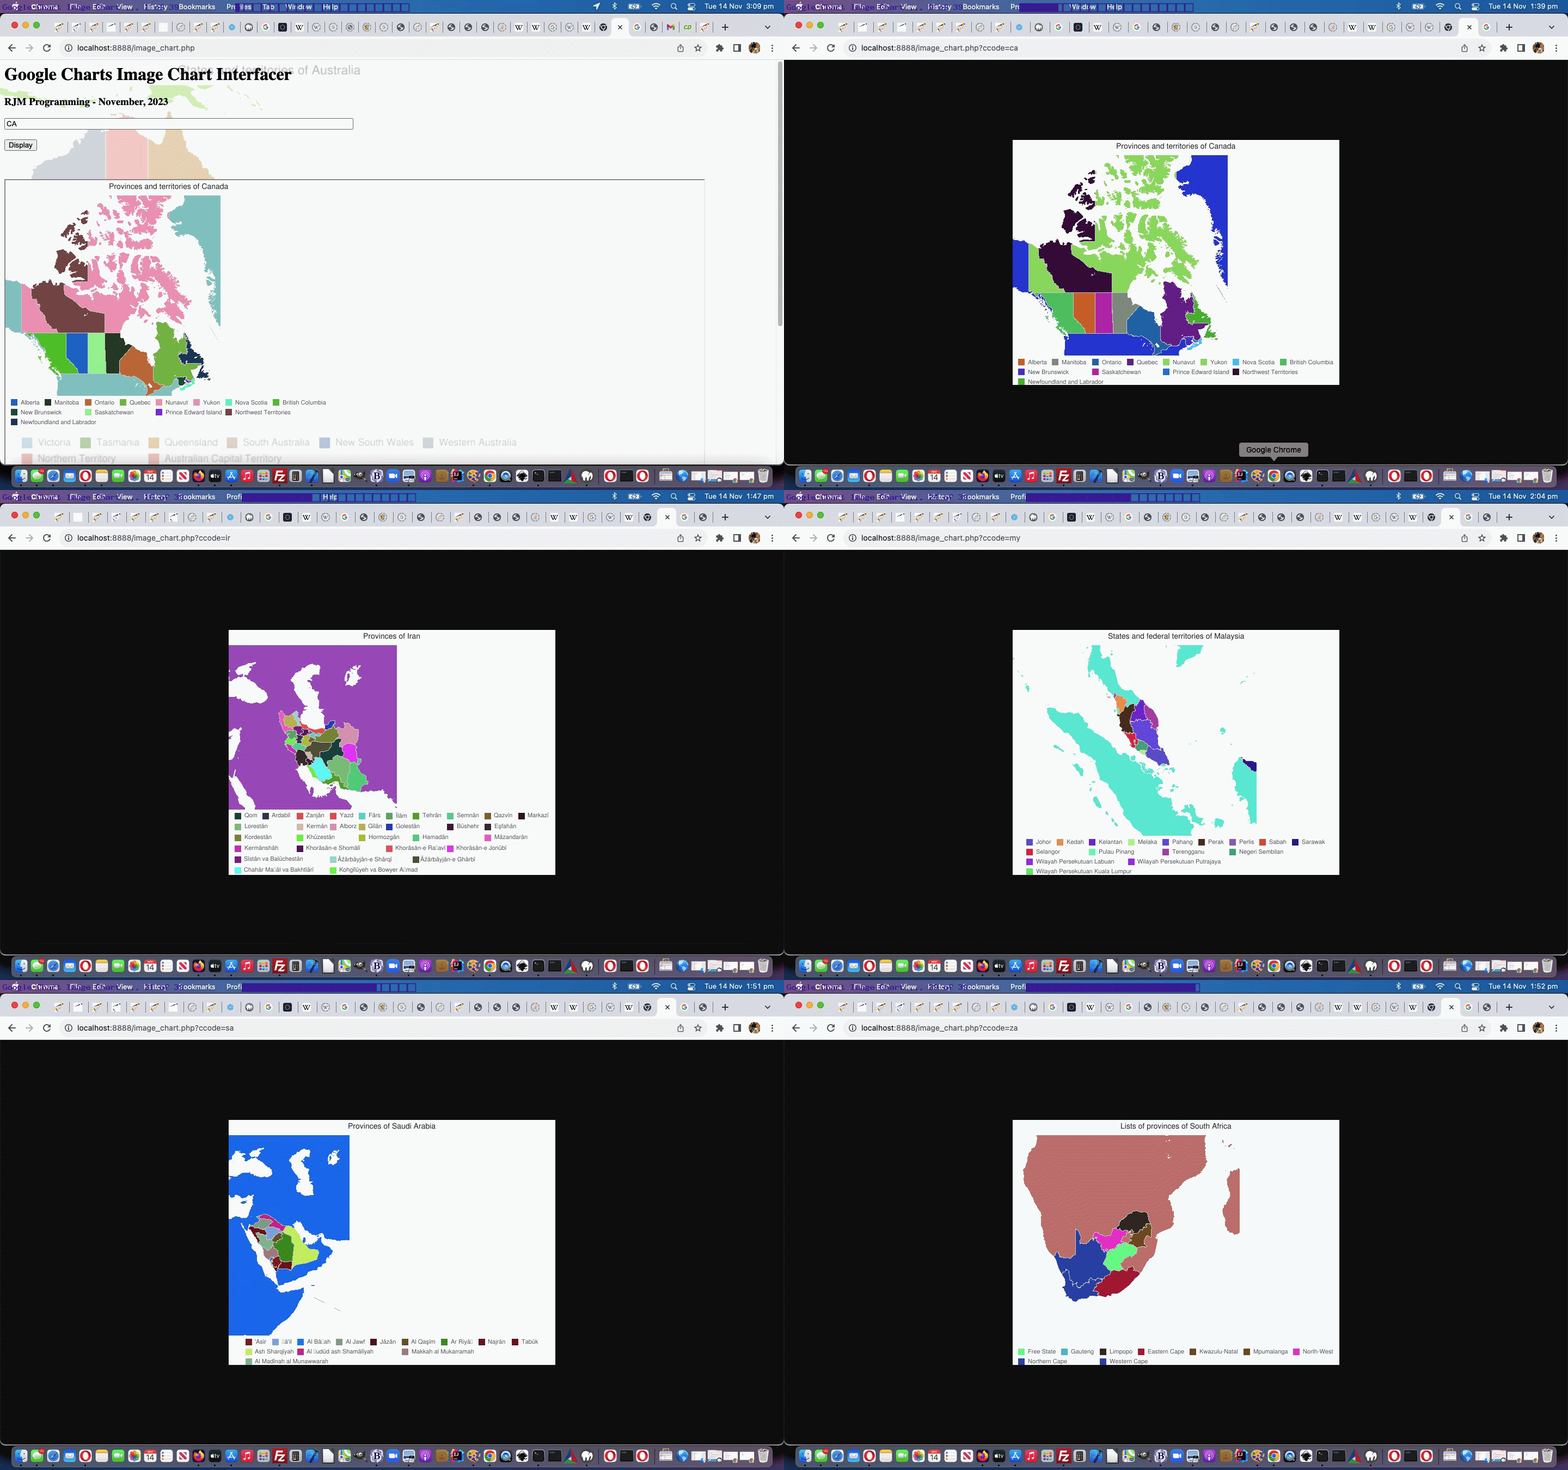
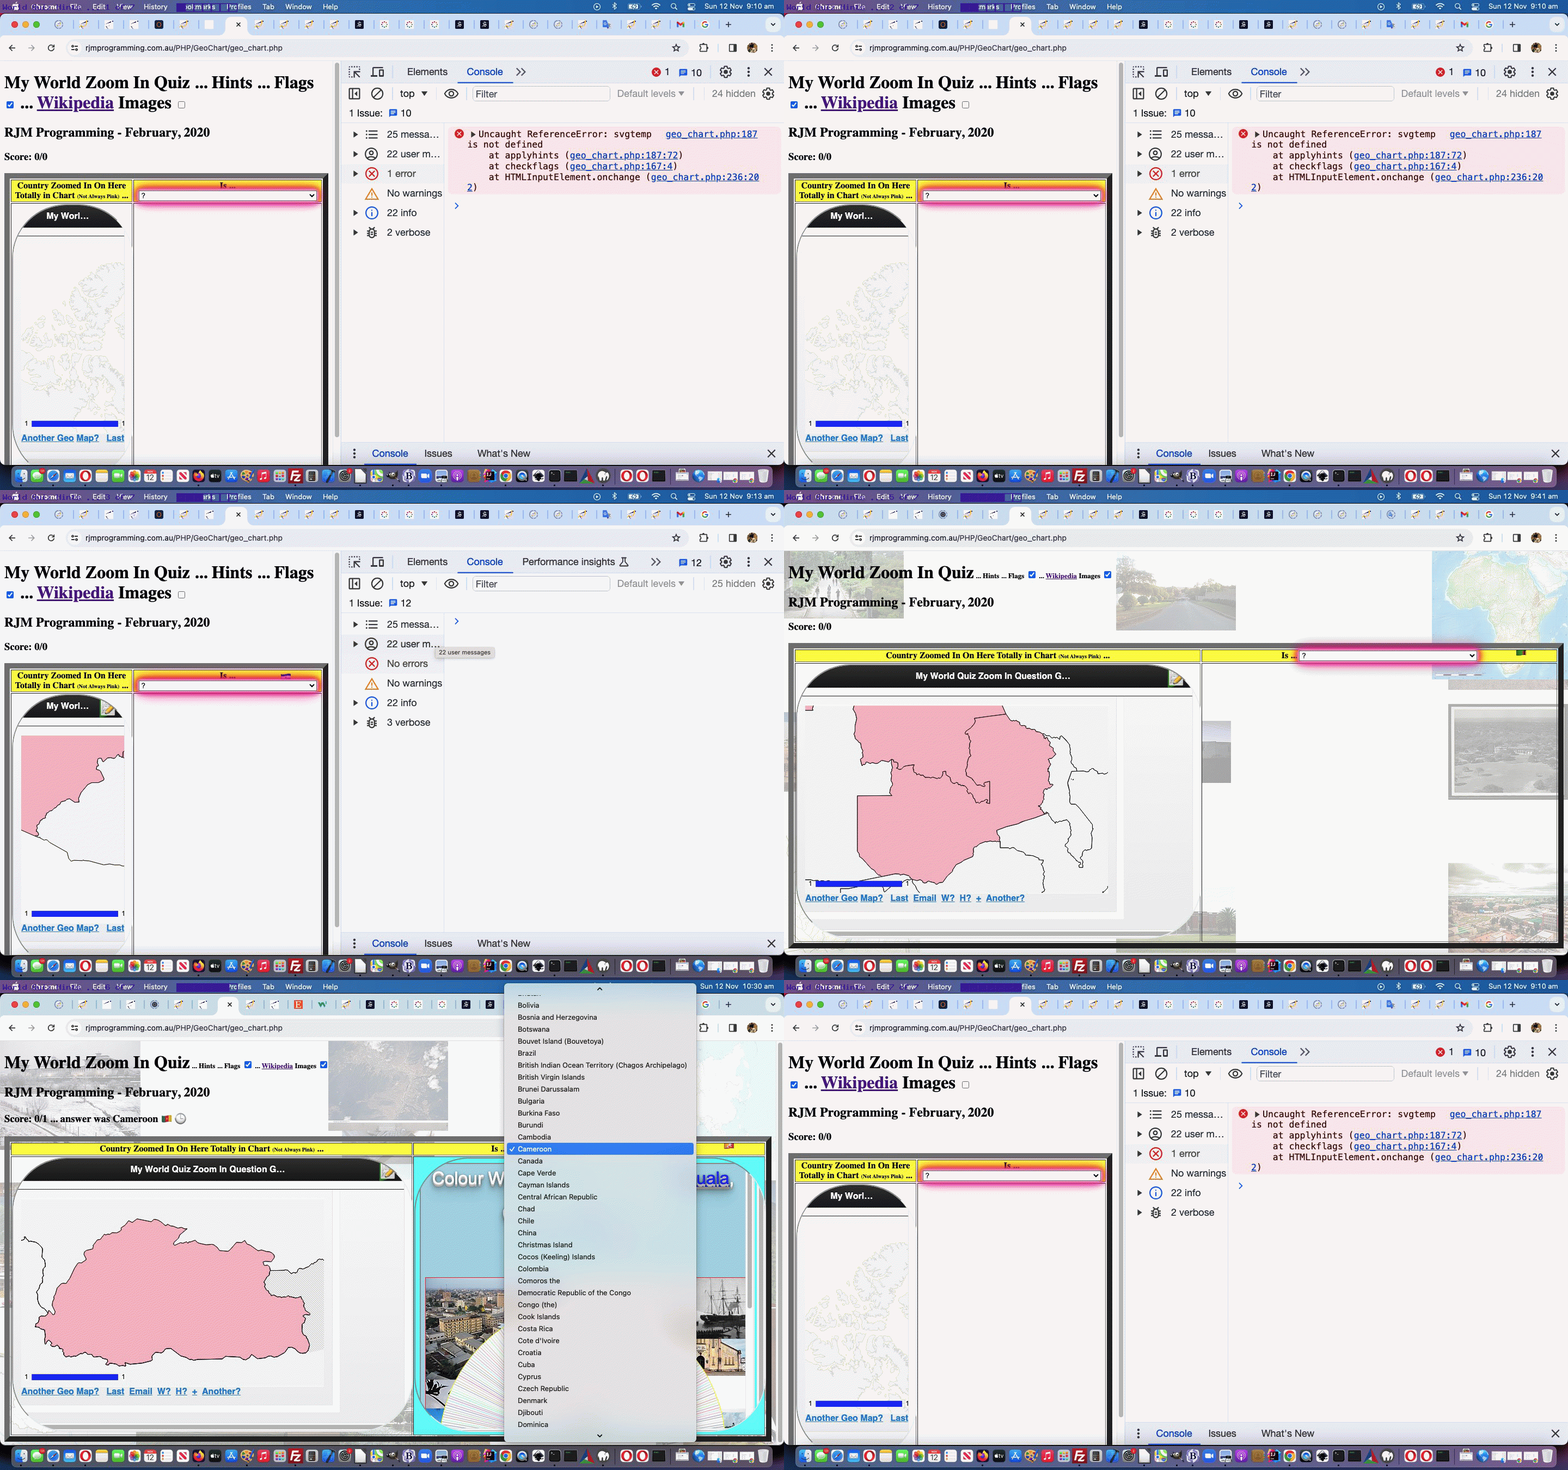
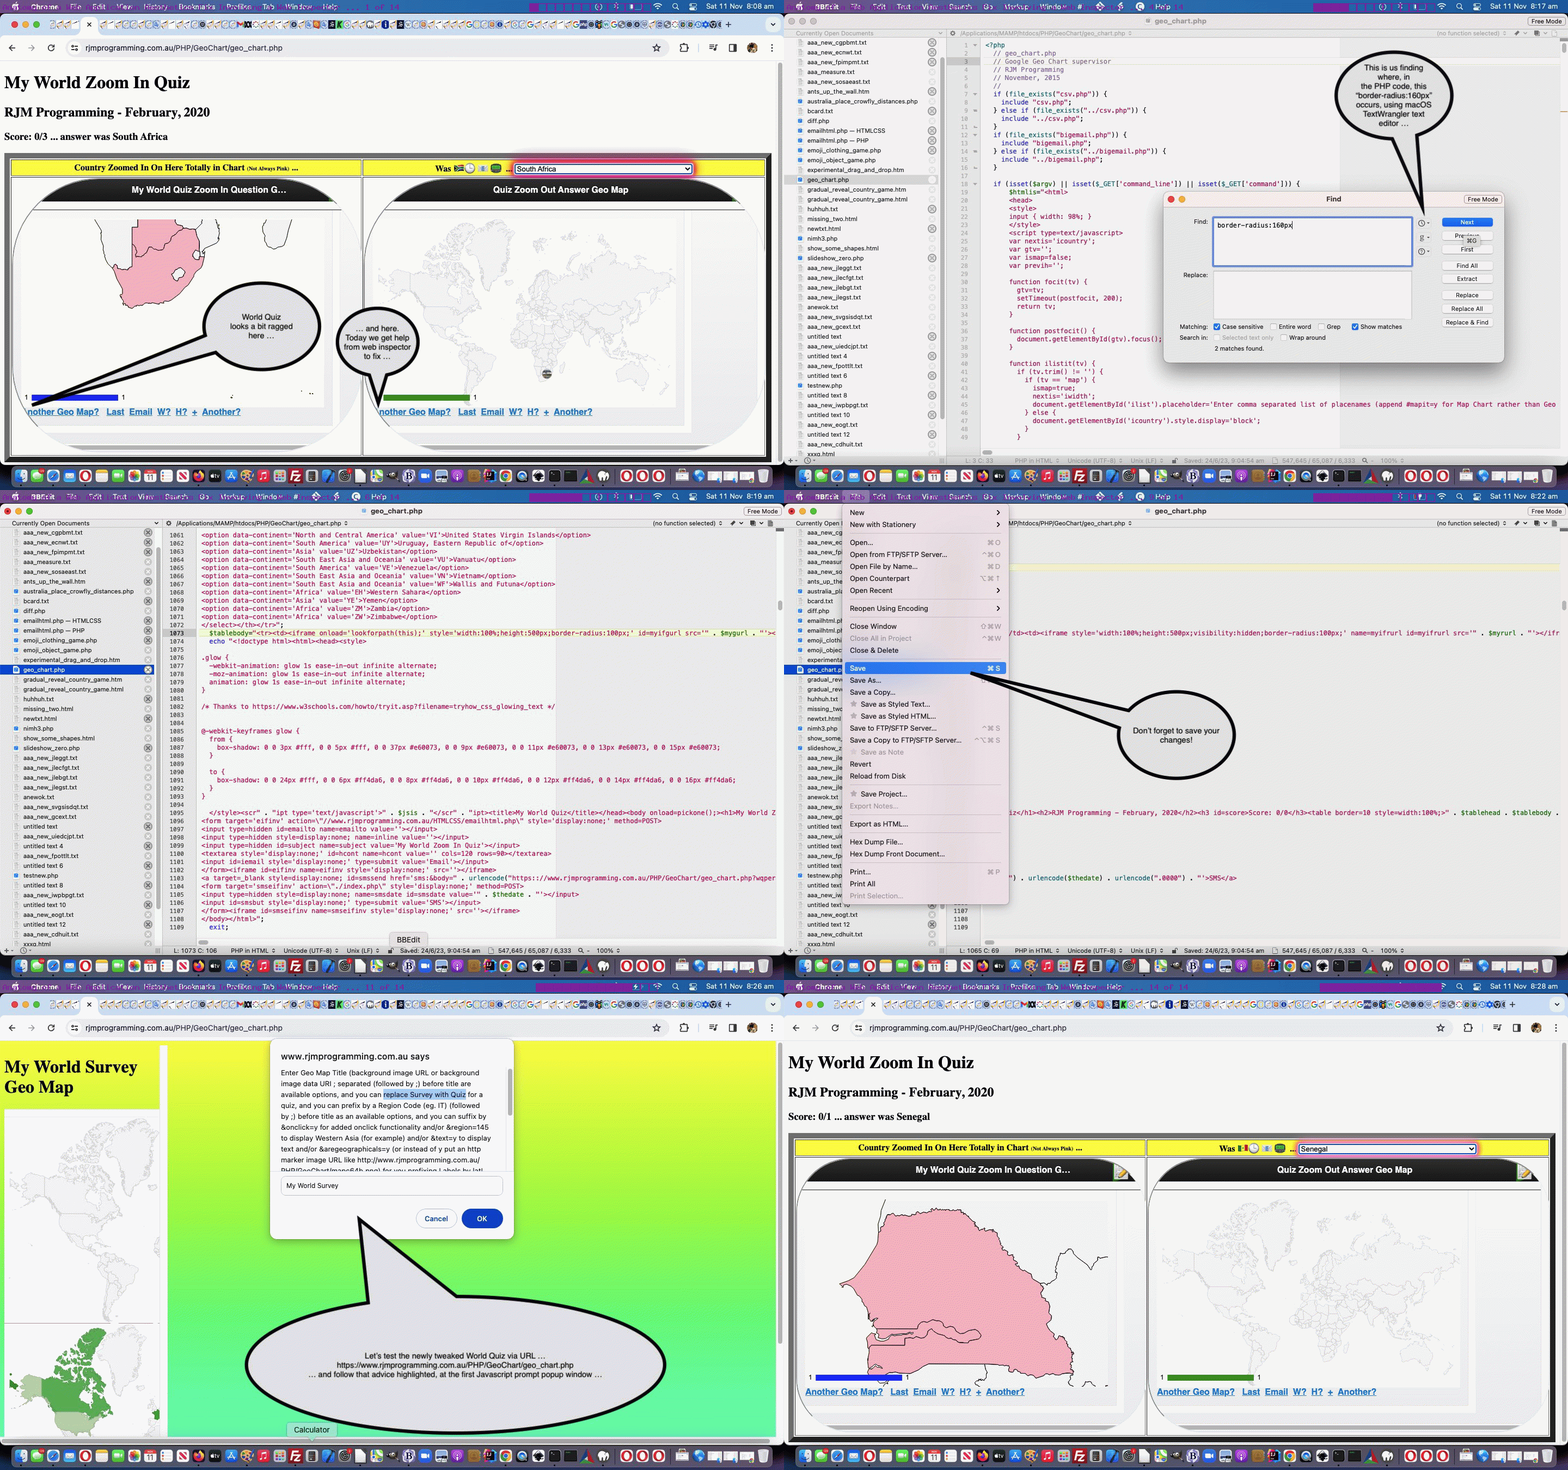
However, this last one both needs more “wading through data” and “consideration” because it seems to be at Google Charts that not even the national boundary is shown when this regional data is not recognized.
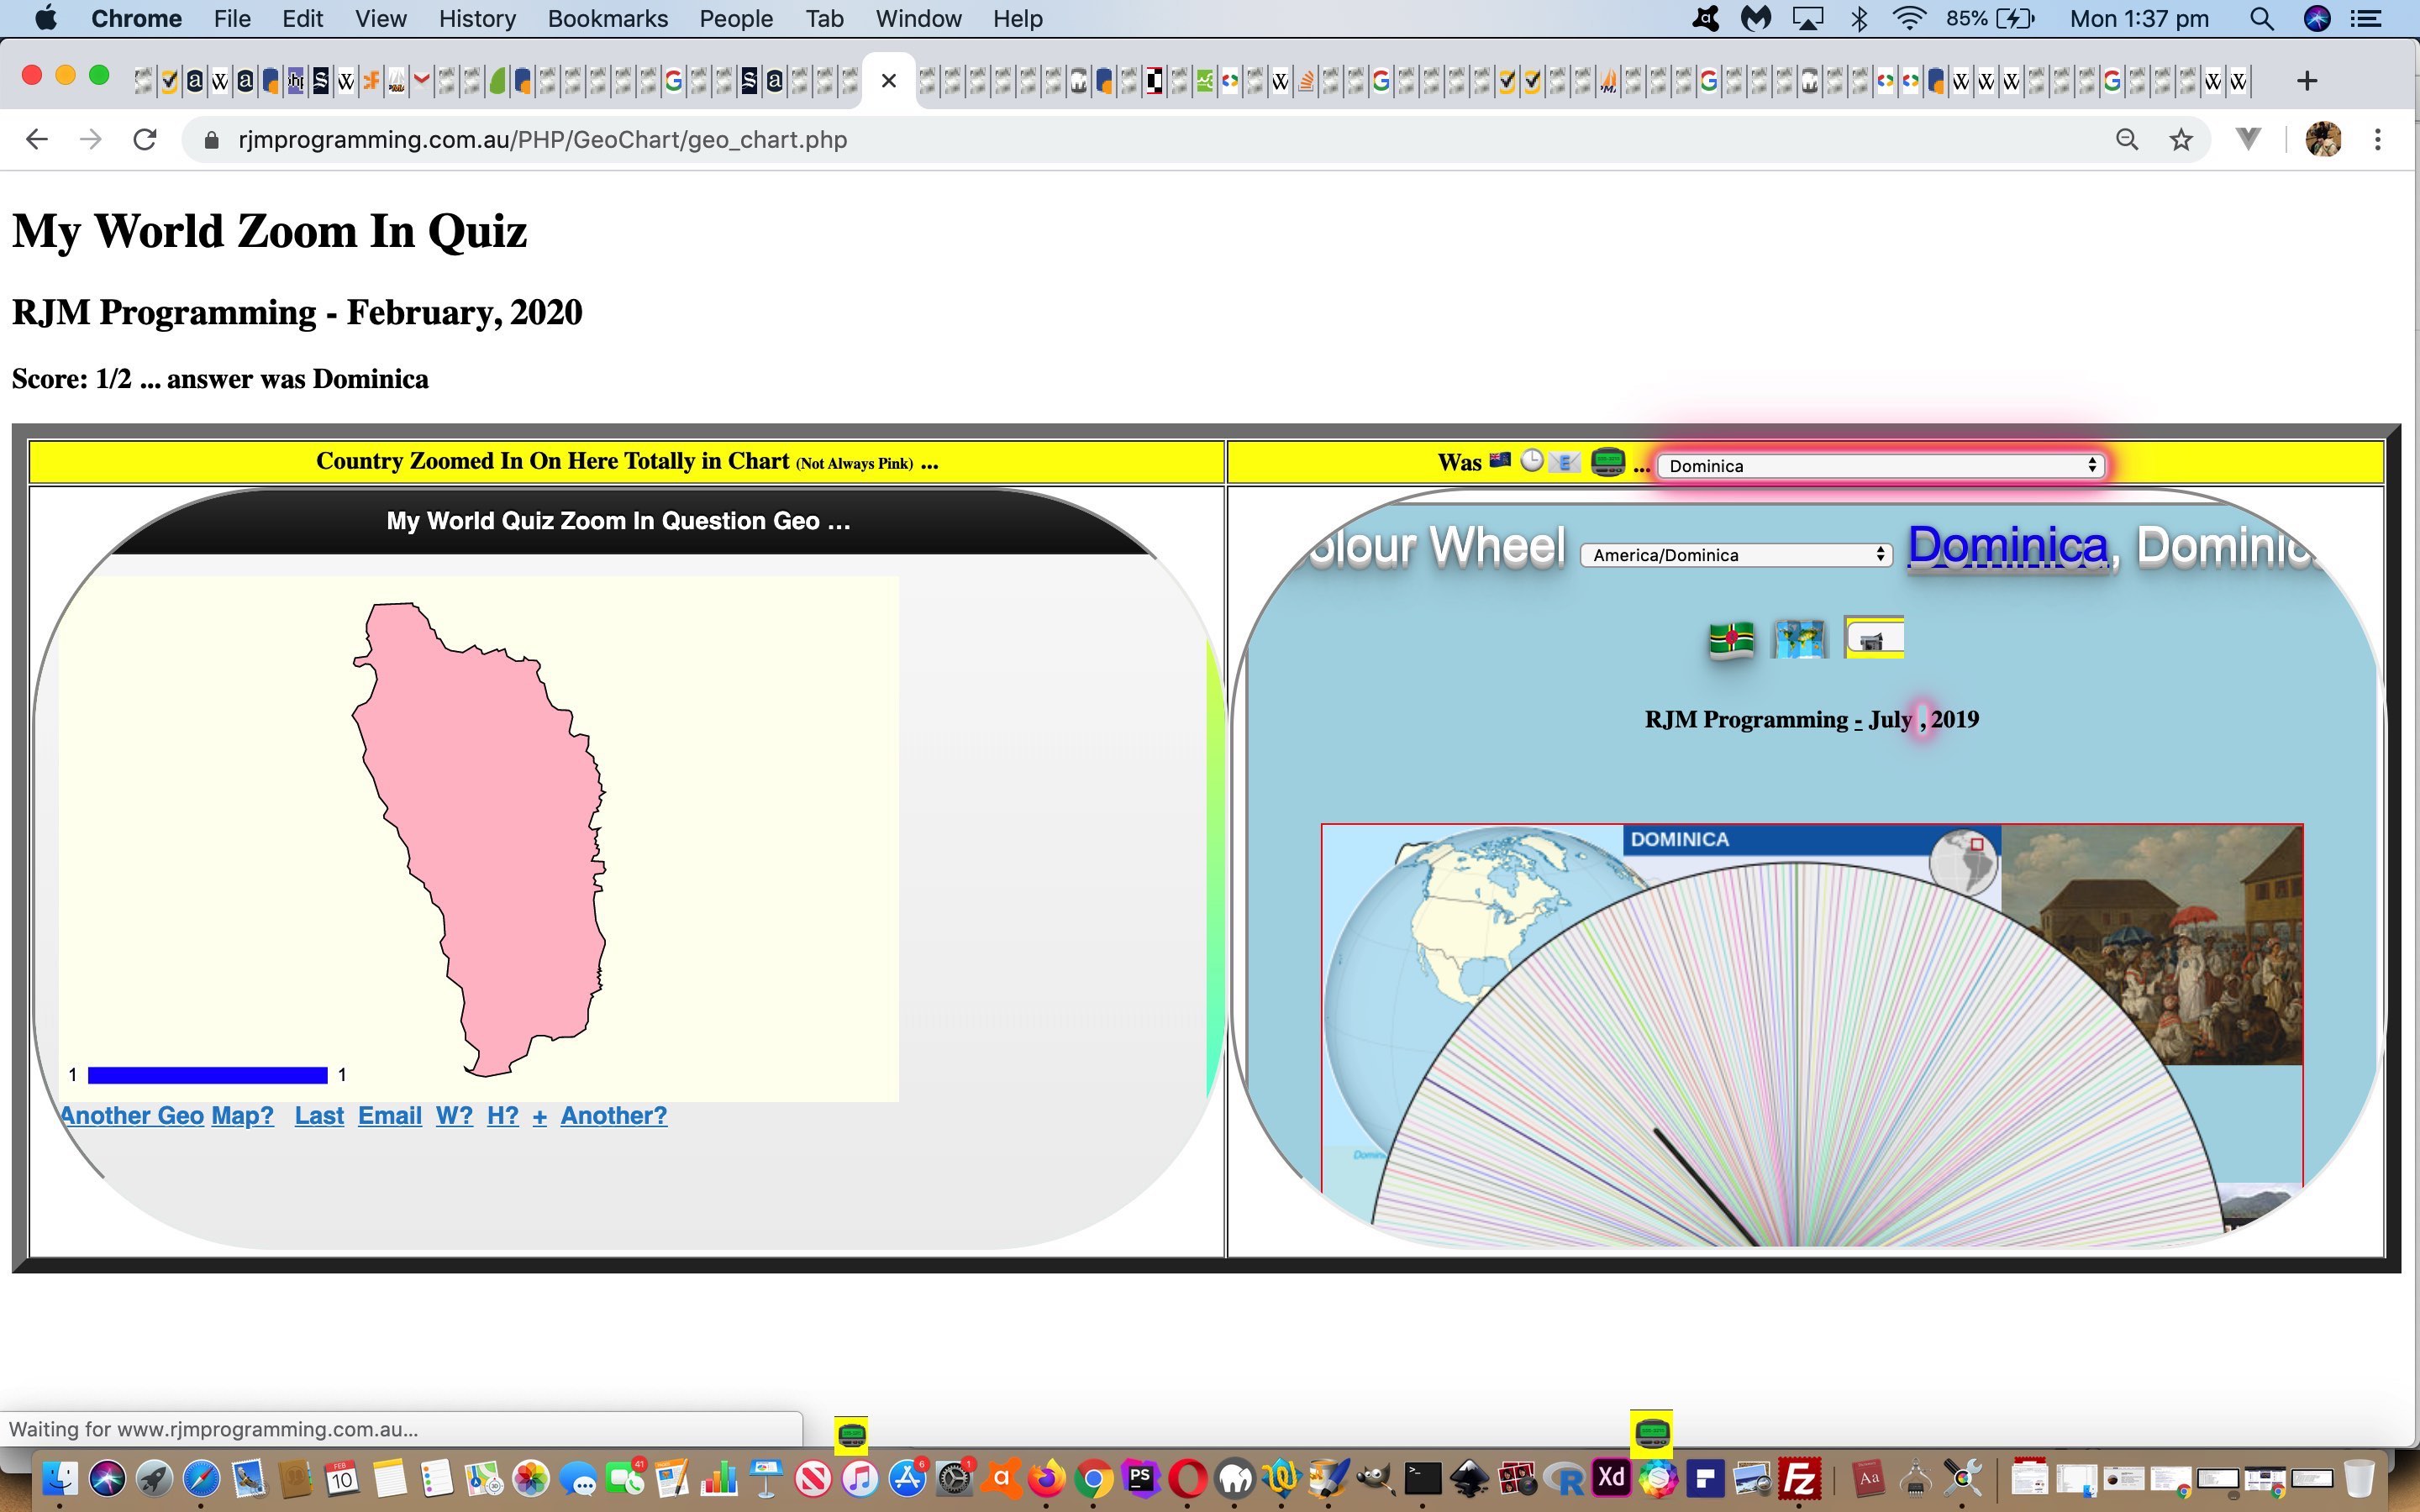
We discovered today, that fallback colours directed towards an overall country code at the end of the URL regional colour entry list, is the way around some of the issue, that some meaning now we can get a country boundary showing, but still, for some countries, Google Charts, with its Image Chart Map Chart, will not show regional boundaries as you might see defined at Wikipedia for some ISO 3166-2 regional codes they have recorded.
So, what’s that got to do with quizzes? Well, the quiz got us interested in these colour mappings, and discovering how those mappings worked led us to this discovery. We hope colour blind people don’t suffer because our Country Regional Quiz functionality could easily be called …
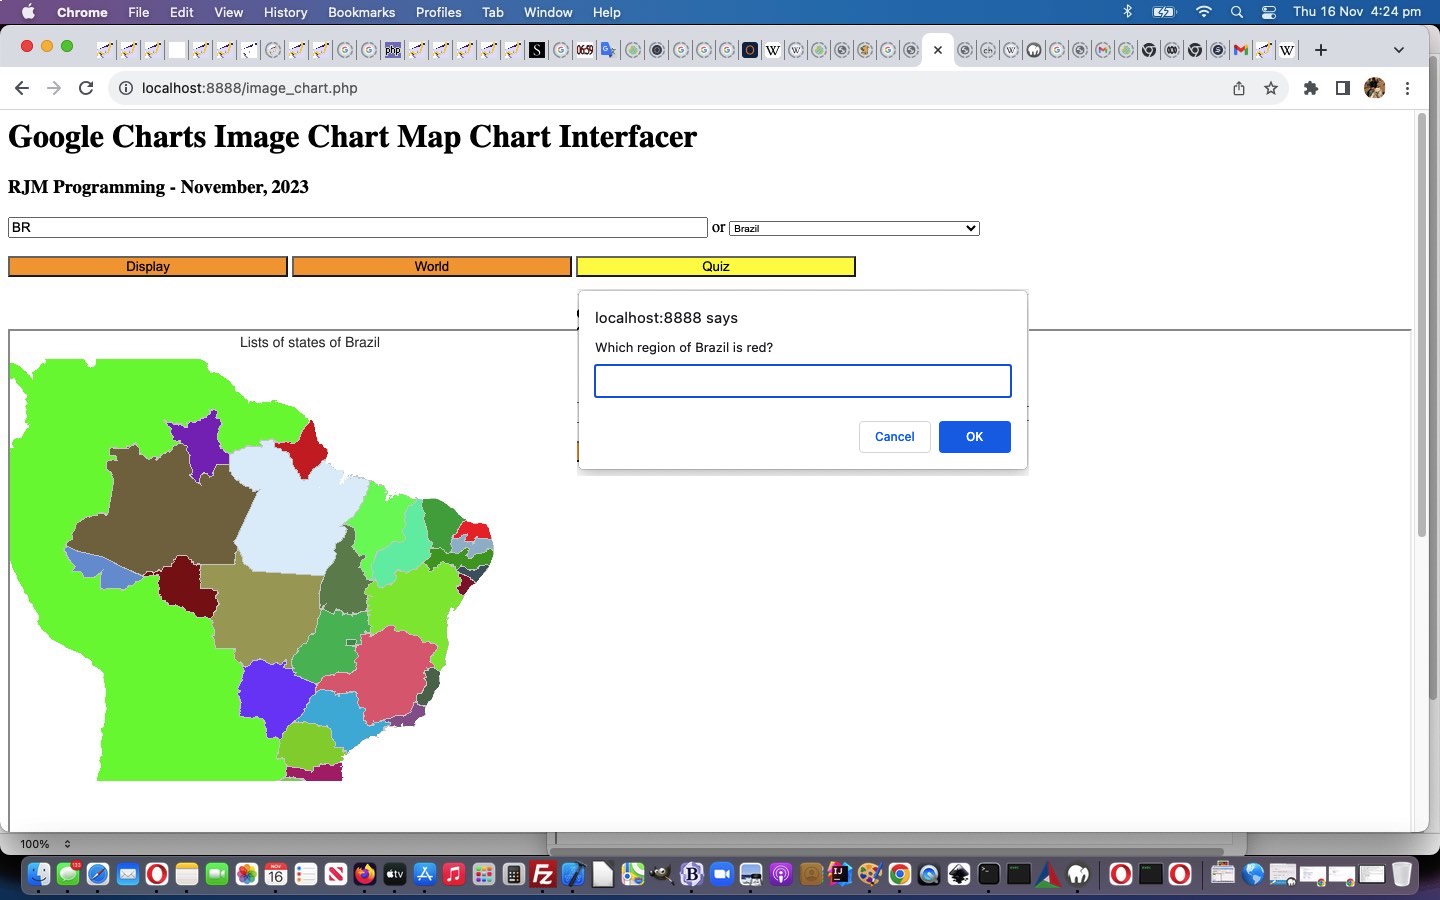
Name the Red Region Quiz
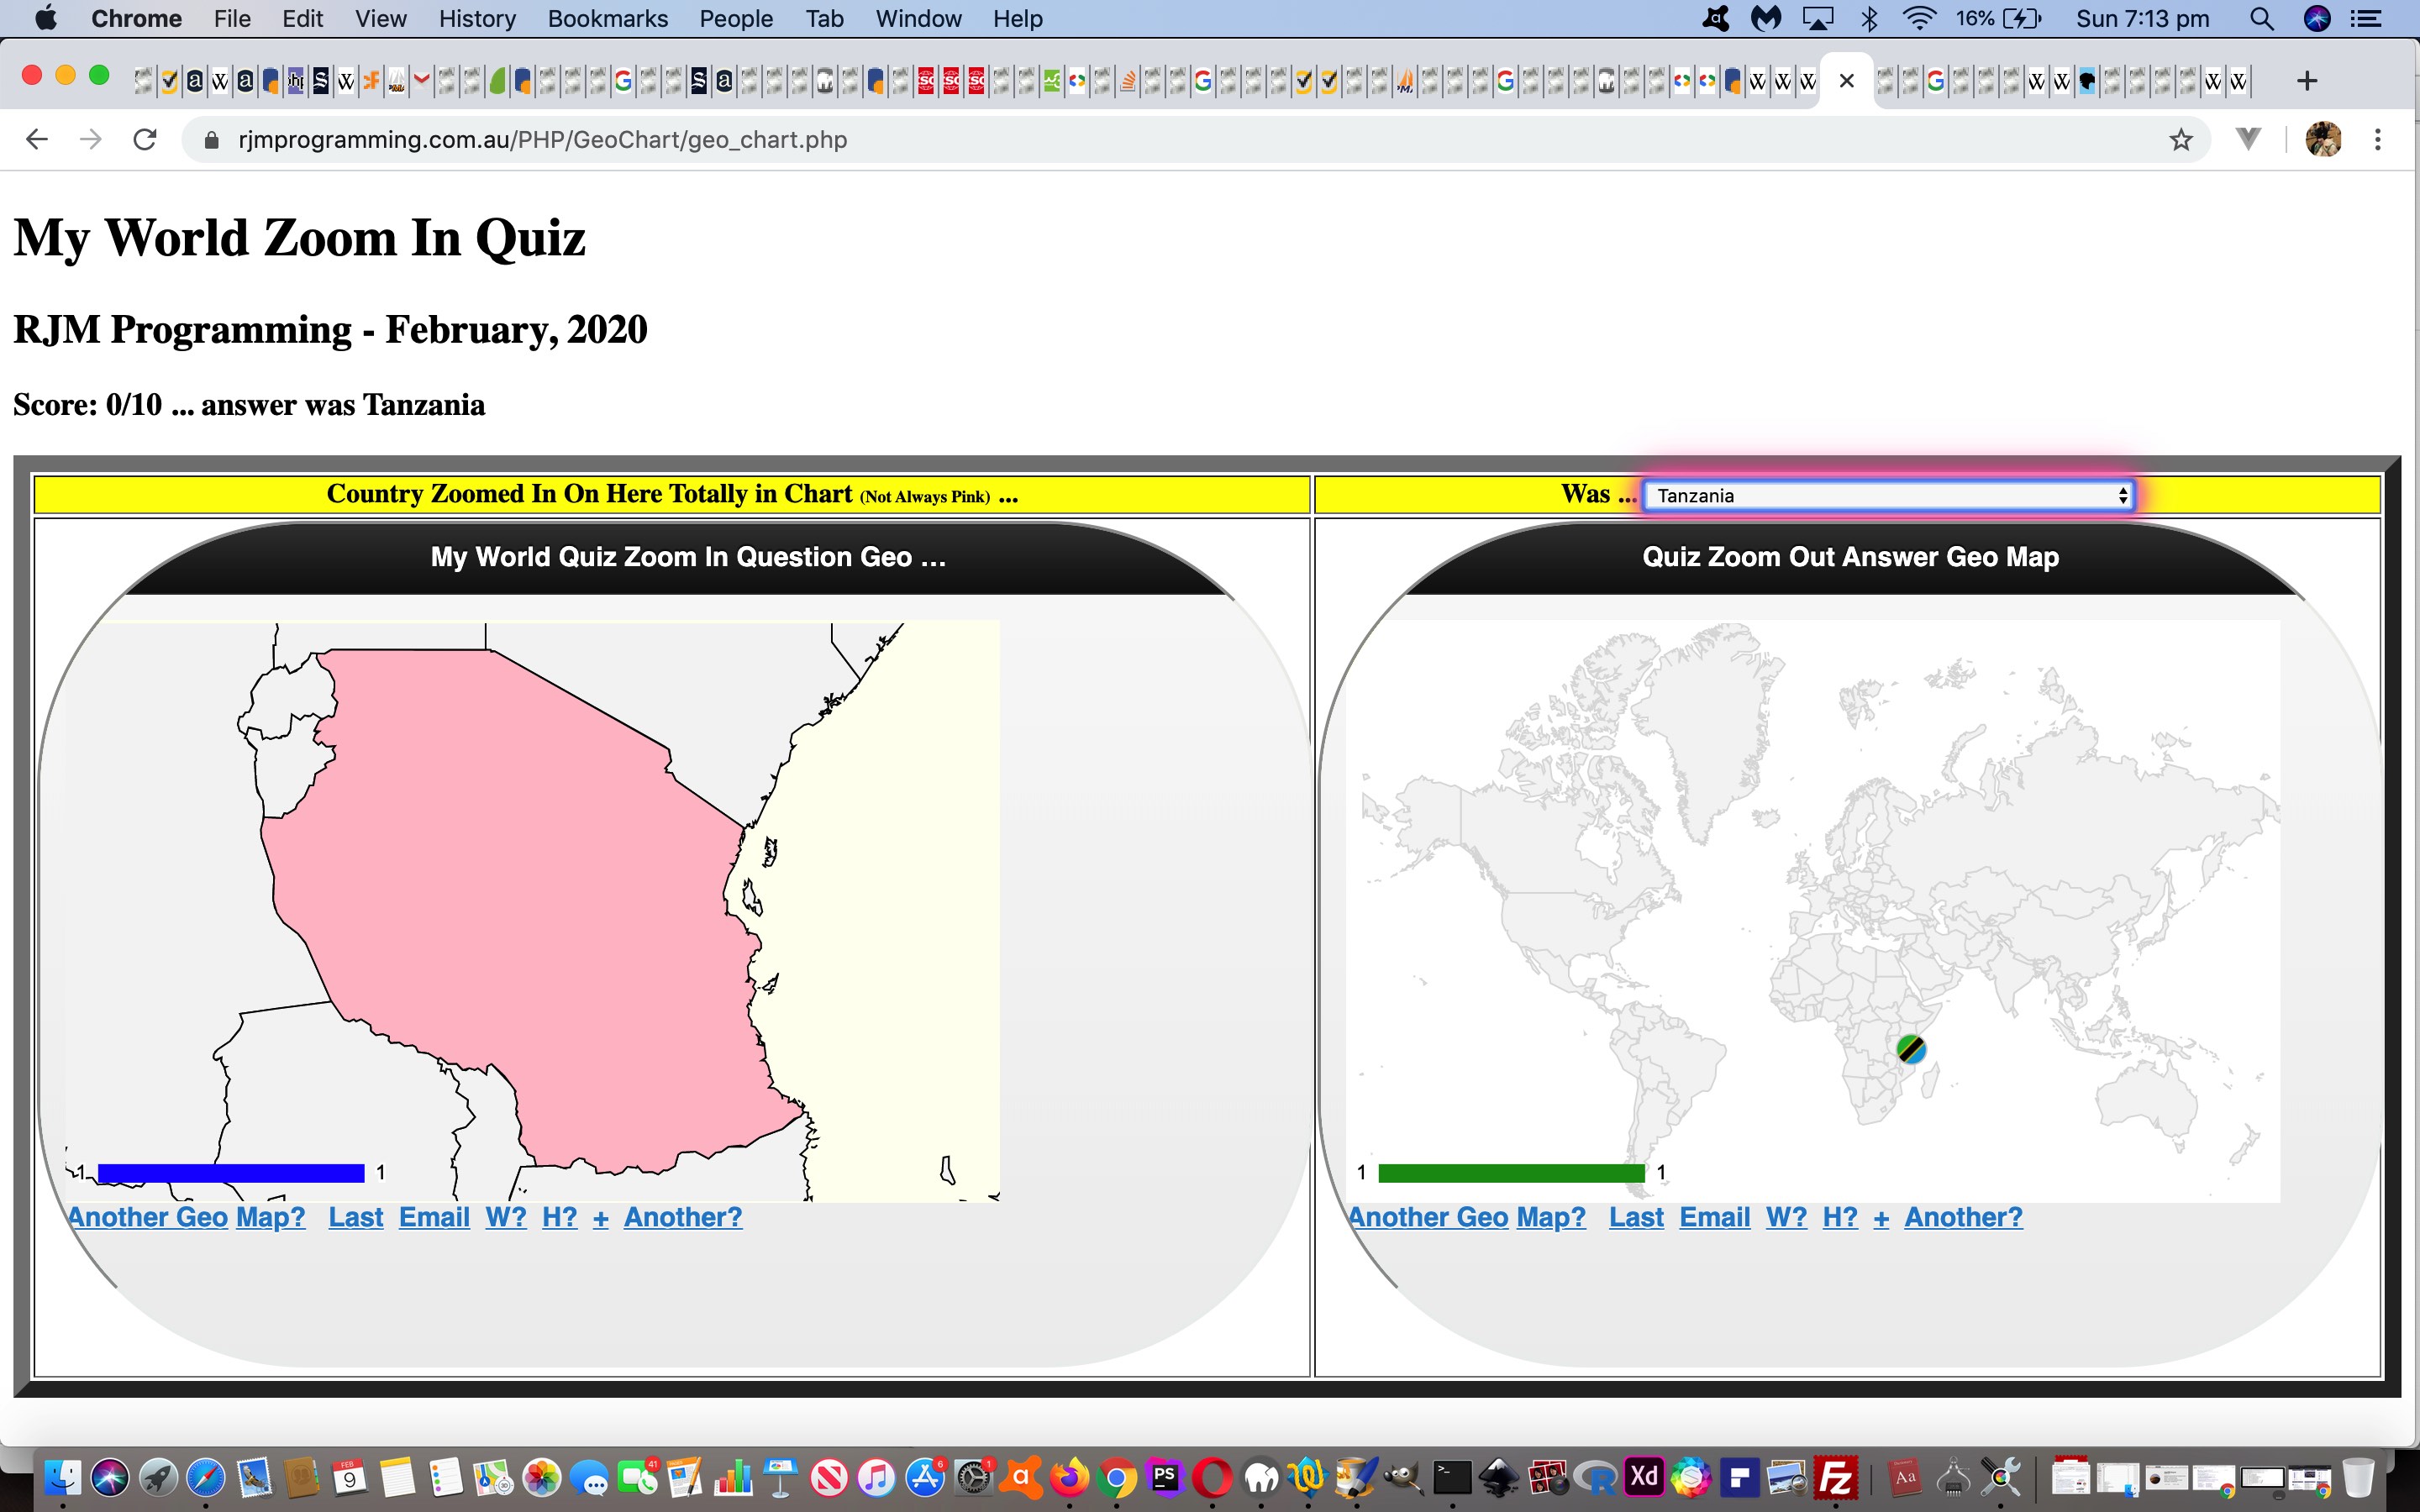
Yes, if the user chooses the new “Quiz” input submit button modus operandi we arrange …
- to leave out any legends
- randomly pick a region which is coloured red … and now blue represents unaccounted for country parts not assigned a region and green represents the rest of the world and the oceans are as they ever were … and …
- after a while we ask the user for their guess as to what this red region’s name is
Good ol’ “colour coding”! What did we do when the world was not colourful? Oops … [expression we hate, again, fits here] … my mistake. We wouldn’t have been around. But we digress.
Simple premise, building on yesterday’s Google Chart Image Chart Map Chart Context Tutorial, but surprisingly involved in our changed third draft image_chart.php PHP web application for you to try, below, perhaps …
Previous relevant Google Chart Image Chart Map Chart Context Tutorial is shown below.
Onto yesterday’s Google Chart Image Chart Map Chart Primer Tutorial start with Google Charts Image Chart Map Chart interfacing, today we’ve come at it from two subcategories relating to fallback positions and “context” …
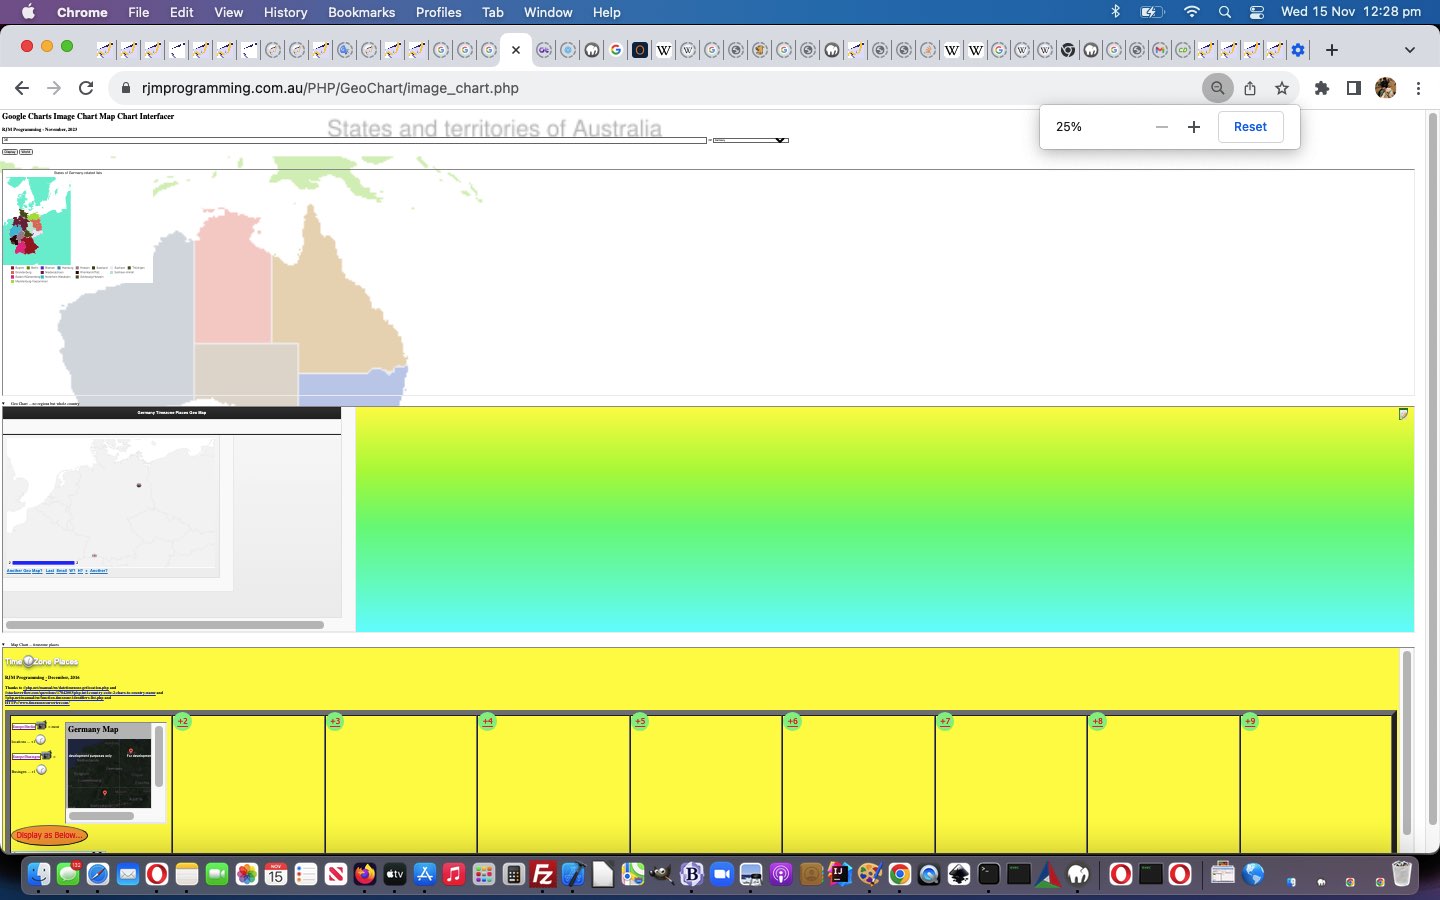
- add Geo Chart and Map Chart optionally viewed details/summary iframes showing country TimeZone position data
- add a mechanism that if we can determine a country’s ideal range of latitude,longitude “box” view, as we found GADM could help us with, thanks, we can flag that …
$ourtzlist=" ...<option value=\"Asia/Shanghai\" title=\"17,82,55,133\" data-geo=\"31.23333,121.46666,CST,CN,+8\">Asia/Shanghai</option><option value=\"Asia/Singapore\" data-geo=\"1.28333,103.85,+08,SG,+8\">Asia/Singapore</option> ...";
… in the data
However, this last one both needs more “wading through data” and “consideration” because it seems to be at Google Charts that not even the national boundary is shown when this regional data is not recognized.
The first one, though, is useful in our changed second draft image_chart.php PHP web application for you to try, below, perhaps …
Previous relevant Google Chart Image Chart Map Chart Primer Tutorial is shown below.
We hope today’s work does not confuse terms, because we’re exploring a new area of Google Charts functionality today they refer to as …
- Google Charts Image Charts … and you’ll see there lots of suboptions we’ll explain a bit more about later, and all this is separate functionality to …
- Google Charts Map Chart … and …
- Google Charts Geo Chart
… and, as of today, we interface to all three categories of Google Charts above, with three separate PHP web applications.
So, what’s the potential confusion? Well, we start out today interfacing to an Image Chart suboption called “Map Chart”, but not the one above, because its look is more in keeping with what the “Geo Chart” above achieves. We’ve written a web application, here, to show regional places within a country (via its 2 letter code) if this has been catered for by Google Charts, and for the most part, that is the case.
And so, on the same theme as yesterday’s Google Chart Geo Chart Zoom In Quiz Translate Tutorial, and thanks to Wikipedia for regional code lookups, we would welcome you to try out our “proof of concept” first draft image_chart.php PHP web application for you to try, below, perhaps …
Previous relevant Google Chart Geo Chart Zoom In Quiz Translate Tutorial is shown below.
You could say the way we navigate to our recent …
World Quiz
… from our …
Geo Chart Interfacer
… in the web application as of yesterday’s Google Chart Geo Chart Zoom In Quiz Hints Tutorial was a bit cryptic, or convoluted, the way at a first prompt window we’d change an entry from the default My World Survey to My World Quiz or even to click that button that we’d arranged in this blog posting thread. Nevertheless, we were a bit loathe to change the arrangements, until we ran into problems involving today’s work of …
Adding a Google Translate layer on top of the World Quiz
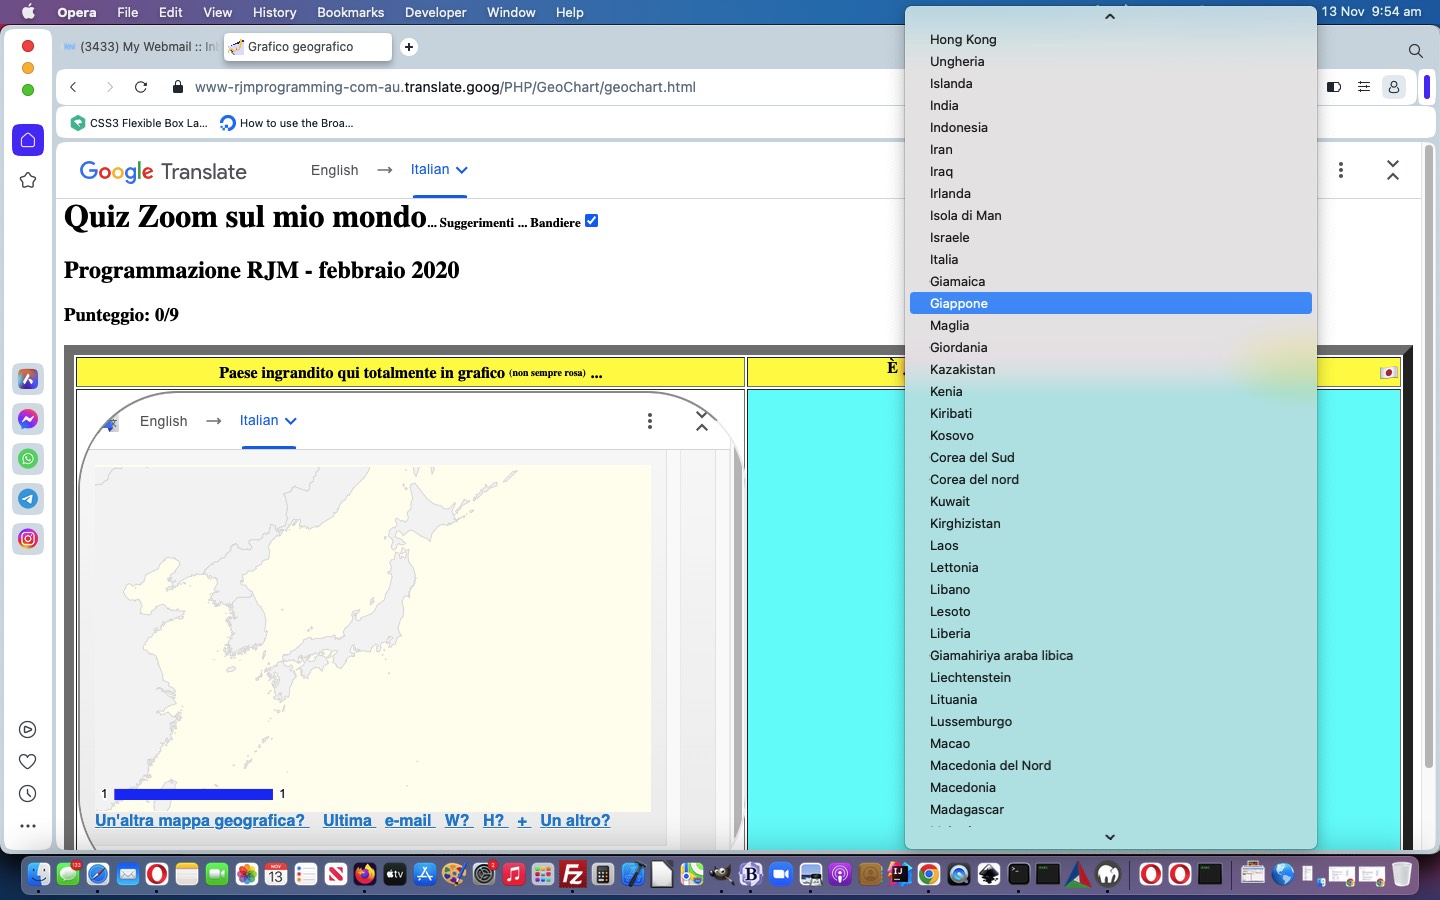
… to facilitate some Internationalization (ie. language translation from English to non-English) into the mix. Yes, our PHP caused problems interfacing to Google Translate. So, what was our approach? We took a snapshot (ie. web browser View -> Page Source) at a point after the convolutions above, and worked off that to introduce a new code file member. Welcome …
… via our proof of concept geochart.html clientside only web application version (or the old access approach in all these changes to geo_chart.php PHP web application still works). Any downside doing this? A little, in that within a Google Translate “bubble” we could not work the Wikipedia images hint part of the logic. Also, you may run into problems with SVG image backgrounds using an svg+xml protocol, or we may just have been having a bad day?! So sad.
Previous relevant Google Chart Geo Chart Zoom In Quiz Hints Tutorial is shown below.
Yesterday’s Google Chart Geo Chart Zoom In Quiz Aesthetics Tutorial showed us …
- using a web inspector to dynamically change CSS styling in place preparatory to making a permanent change … well, today, we’re here to reiterate …
- using a web inspector can help with a myriad of Javascript logic errors or debugging, as well
… and we do that today adding hints to all these changes to geo_chart.php Geo Chart interfacer at this live run World Quiz web application link or click a button down below.
Do the hints look familiar? Take a read of Javascript Lazy Evaluation Country Game Hints Tutorial and it all might come back to you!
Previous relevant Google Chart Geo Chart Zoom In Quiz Aesthetics Tutorial is shown below.
We recently revisited the PHP web application we call …
Google Chart Geo Chart Zoom In Quiz
… last talked about at Google Chart Geo Chart Zoom In Quiz Sharing Tutorial, and noticed a bit of ugliness regarding its CSS styling, specifically related to the “too large” border-radius values we’d applied to the twin iframes cutting off wording in their bottom left corner.
This issue is an …
- aesthetics, only …
- CSS styling
… one … queue the Web Inspector! How come? Well, web inspectors, such as Google Chrome web browser’s one, allow you to …
- in place … on our macOS MAMP local Apache/PHP/MySql web server system …
- dynamically tweak …
- CSS styling … especially good with inline CSS style syntax, that we happen to be very fond of too … so as to be able to …
- make the changes for you to optionally re-tweak … ephemerally
… on a test system (ours being a macOS MAMP local Apache/PHP/MySql web server one) ahead of uploading and committing to a permanent change up at the live and public RJM Programming web server domain.
Take a look at how we went about what went into the aesthetically tweaked geo_chart.php Geo Chart interfacer at this live run link, where we remind you again, a substitution of “Survey” by “Quiz” at the first title prompt can show the “My World Zoom In Quiz” in a new window or click a button down below.
Previous relevant Google Chart Geo Chart Zoom In Quiz Sharing Tutorial is shown below.
Adding functionality to yesterday’s Google Chart Geo Chart Zoom In Quiz Tutorial we see an opportunity to …
- add an element of “when” functionality onto the “where” strengths of the Google Chart Geo Chart recent work, via PHP TimeZones and interfacing to the work of the recent Looks Nice Nearby Speech to Text Game Video Tutorial … as well as …
- means by which to share or collaborate with the “My World Zoom In Quiz” … via …
- email 📧 (via inline HTML PHP mail) … or …
- SMS 📟 (via “a” tag href=sms: link)
… and that last SMS methodology brought into focus our wish not to allow, yet, a URL approach to get directly to this new “My World Zoom In Quiz” (although we may change this strategy into the future). So, how to apply security over the use of a URL such as …
https://www.rjmprogramming.com.au/PHP/GeoChart/geo_chart.php?wqperspective=Monday+10+Feb+2020+17:57:15.7182
… not linked, above, because there is no point. We have already clicked it in an SMS we got sent, and that nullifies its use from then on? Huh?! Yes, we use the PHP itself, as we are fond of doing, storing (a form of) that “Monday+10+Feb+2020+17:57:15.7182” away as a comment in amongst the PHP code and, hence, “file_get_contents” checkable by its or some other PHP code for its existence (as well as the “file_put_contents” based clean up removal of said comment after the SMSee’s (body) link is ever clicked), as the security check for whether we navigate to the “My World Zoom In Quiz” (bringing up that last correct answer) via an SMS body URL link, clicked by an SMSee. And that collaborator can do the same thing back to the original sender for the next wrong answer’s similar 📟 emoji button press instigation of this sharing and collaboration Javascript logic …
    function smswho() {

      if (smsorig == '') { smsorig=document.getElementById('smssend').href.split('0000')[0]; }

      if (smsdateorig == '') { smsdateorig=document.getElementById('smsdate').value; }

      var smsto=prompt('SMS to?', document.getElementById('smssend').href.split('sms:')[1].split('?')[0]);

      if (smsto == null) { smsto = ''; }

      if (smsto.trim() != '') {

      document.getElementById('smsdate').value=smsdateorig + '.' + gsv.substring(0,1).charCodeAt(0) + gsv.substring(1).substring(0,1).charCodeAt(0);

      document.getElementById('smsbut').click();

      document.getElementById('smssend').href=(smsorig + '' + gsv.substring(0,1).charCodeAt(0) + gsv.substring(1).substring(0,1).charCodeAt(0)).replace('sms:?','sms:' + smsto + '?');

      document.getElementById('smssend').click();

      }

    }


    function emailwho() {

      var emto=prompt('Email to?', document.getElementById('emailto').value);

      if (emto == null) { emto = ''; }

      if (emto.indexOf('@') != -1) {

      document.getElementById('emailto').value=emto;

      document.getElementById('hcont').value='<html><body><form action=' + document.URL + ' method=POST><input type=hidden value=' + gsv + ' name=wqperspective></input><input type=submit value=\"My World Zoom In Quiz\" style=\"background-color:yellow;\"></input></form></body></html>';

      document.getElementById('iemail').click();

      }

    }
… in the context of all these changes to geo_chart.php Geo Chart interfacer at this live run link, where we remind you again, a substitution of “Survey” by “Quiz” at the first title prompt can show the “My World Zoom In Quiz” in a new window.
Previous relevant Google Chart Geo Chart Zoom In Quiz Tutorial is shown below.
Today we’re combining …
- yesterday’s Google Chart Geo Chart Small Region Tutorial regional Google Chart Geo Chart “smarts” … with the recent …
- Google Chart Geo Chart markers mode of helping out show a small region (too small for the resolution) of a world view Geo Chart map
… to create another form of quiz (we think of as “My World Zoom In Quiz”) the user can navigate to via the way they answer that first title prompt (substituting “Survey” with “Quiz”). You might prefer to think of it as the “Geographical Perspective Quiz” with a degree of difficulty, often, because to see a “Zoomed In” display of a country or region can be disorienting and challenging to recognize. And so, for incorrect dropdown answers, we provide a “zoomed out” world view of where that “zoomed in” view sits (like an inset).
In order to show you this below please click
Again, a bit of a different tack to yesterday with the reworked geo_chart.php Geo Chart interfacer at this live run link, where a substitution of “Survey” by “Quiz” at the first title prompt can show the “My World Zoom In Quiz” (like above) in a new window.
Previous relevant Google Chart Geo Chart Small Region Tutorial is shown below.
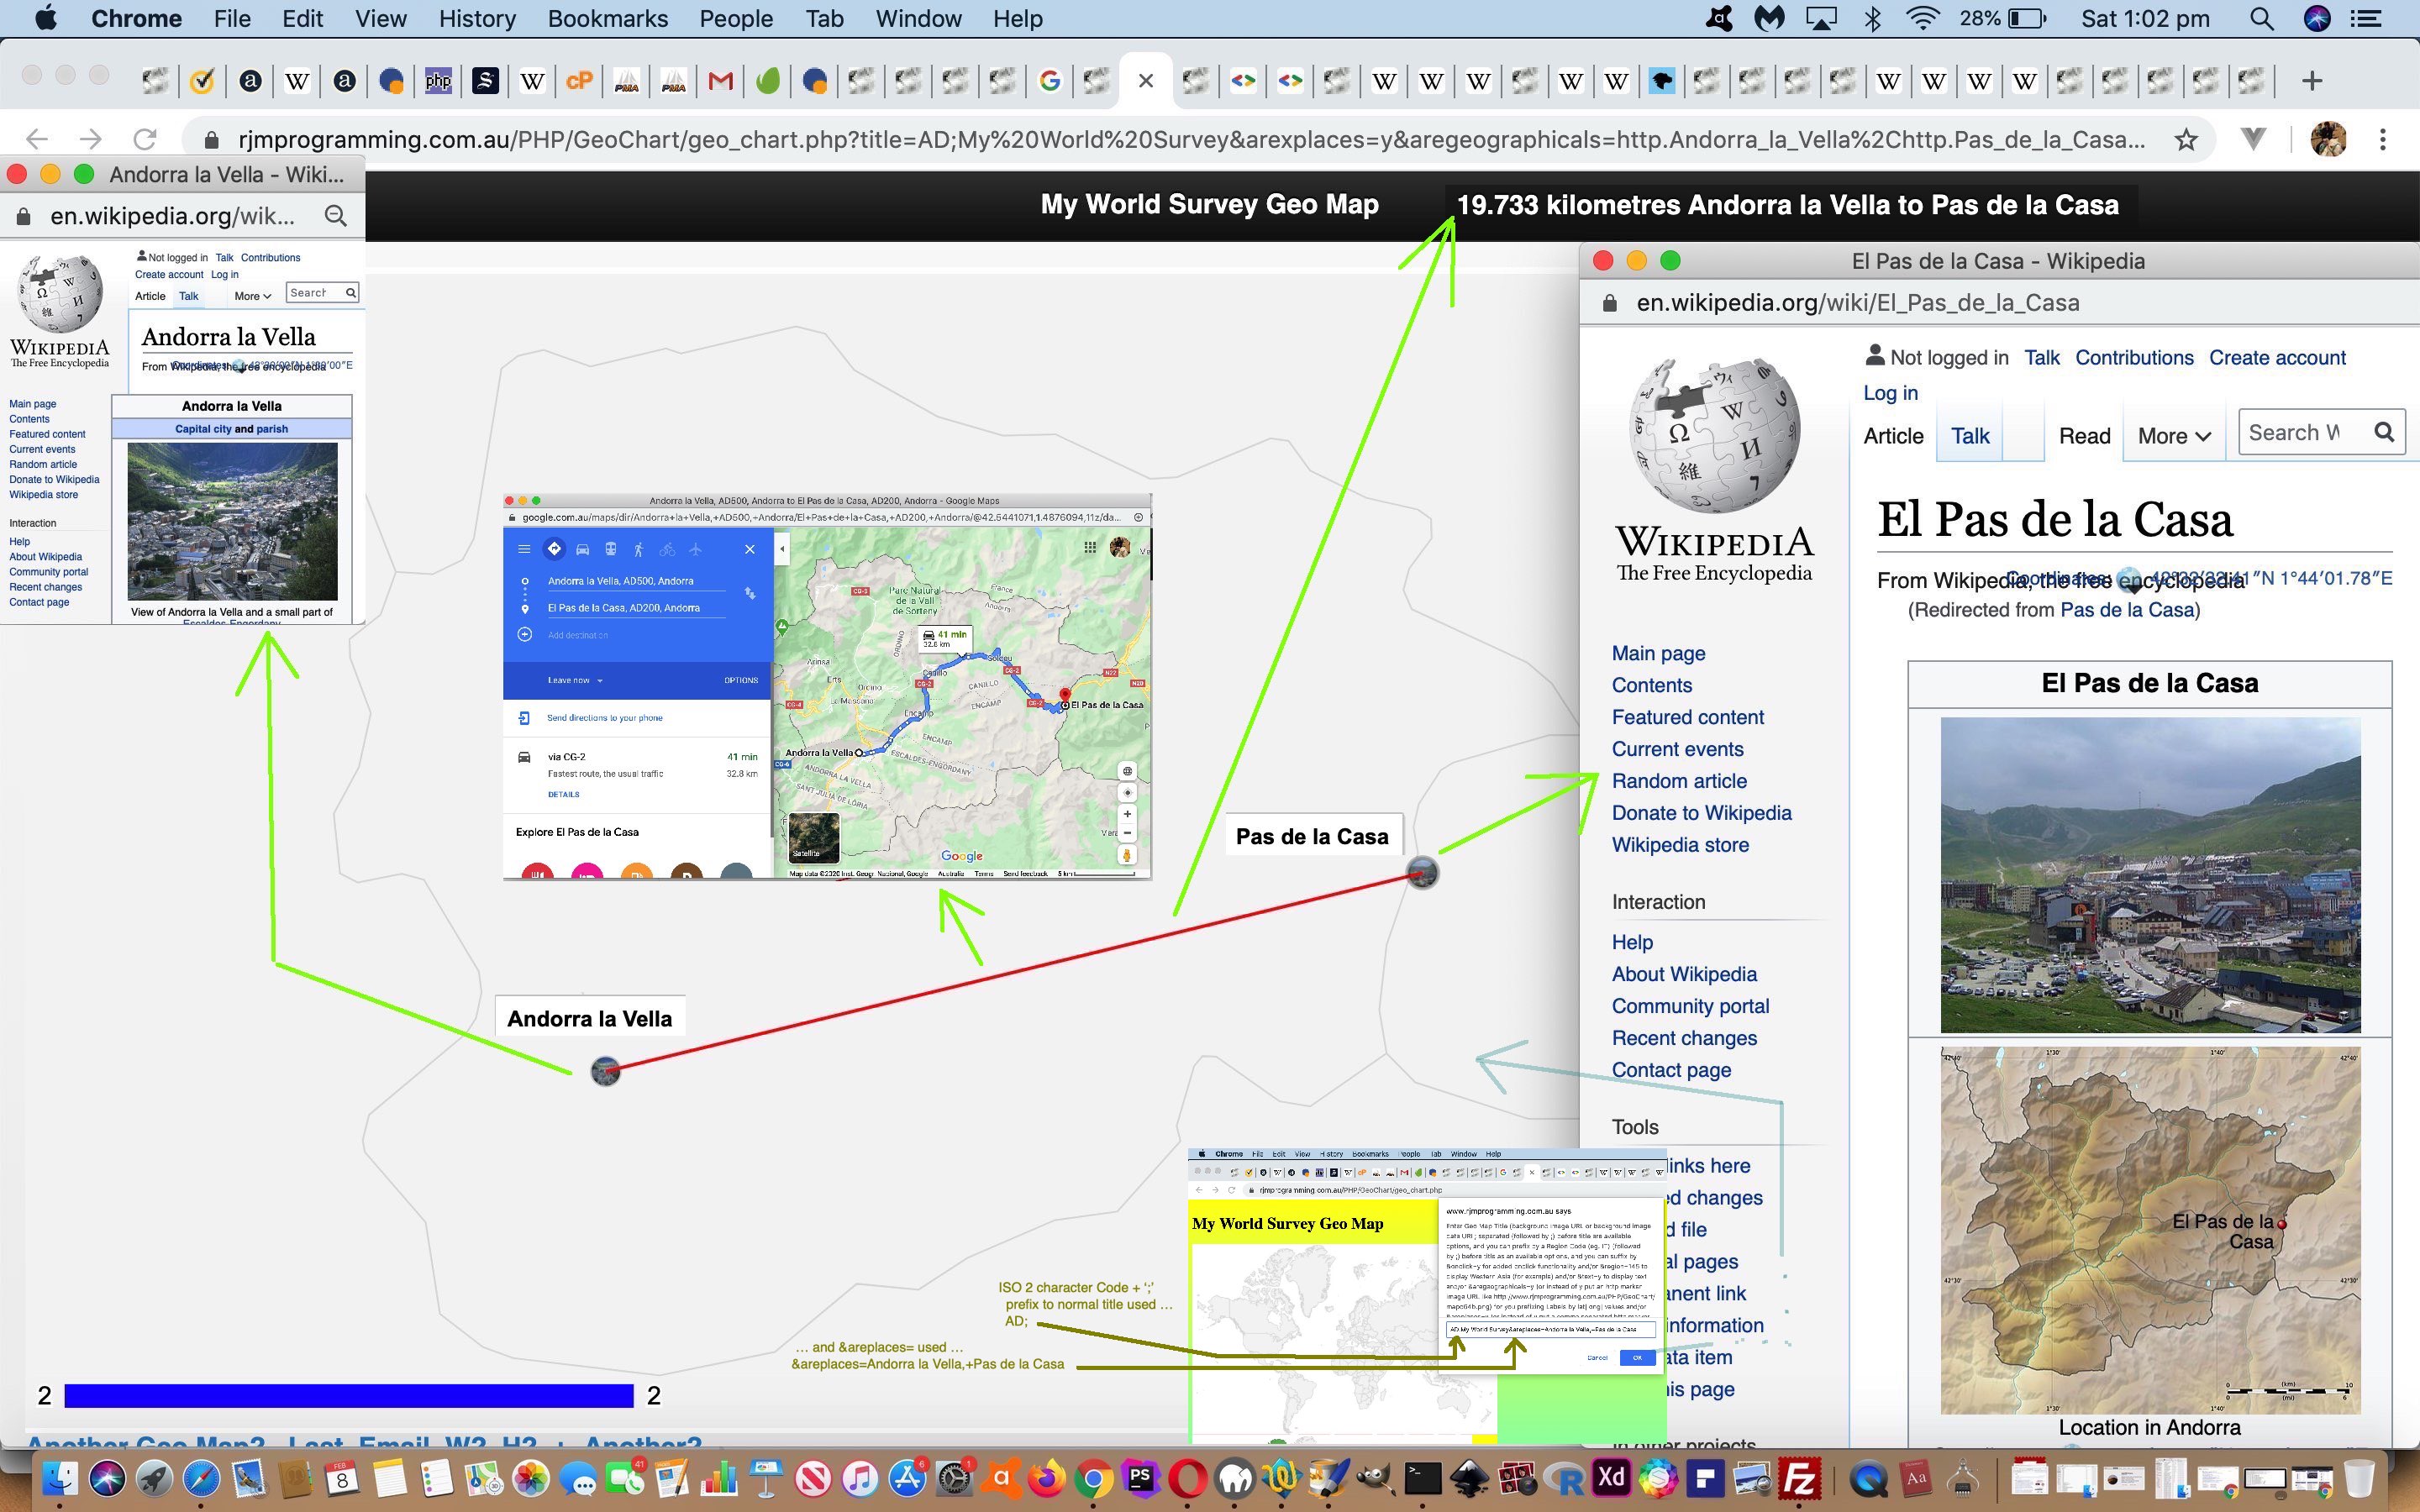
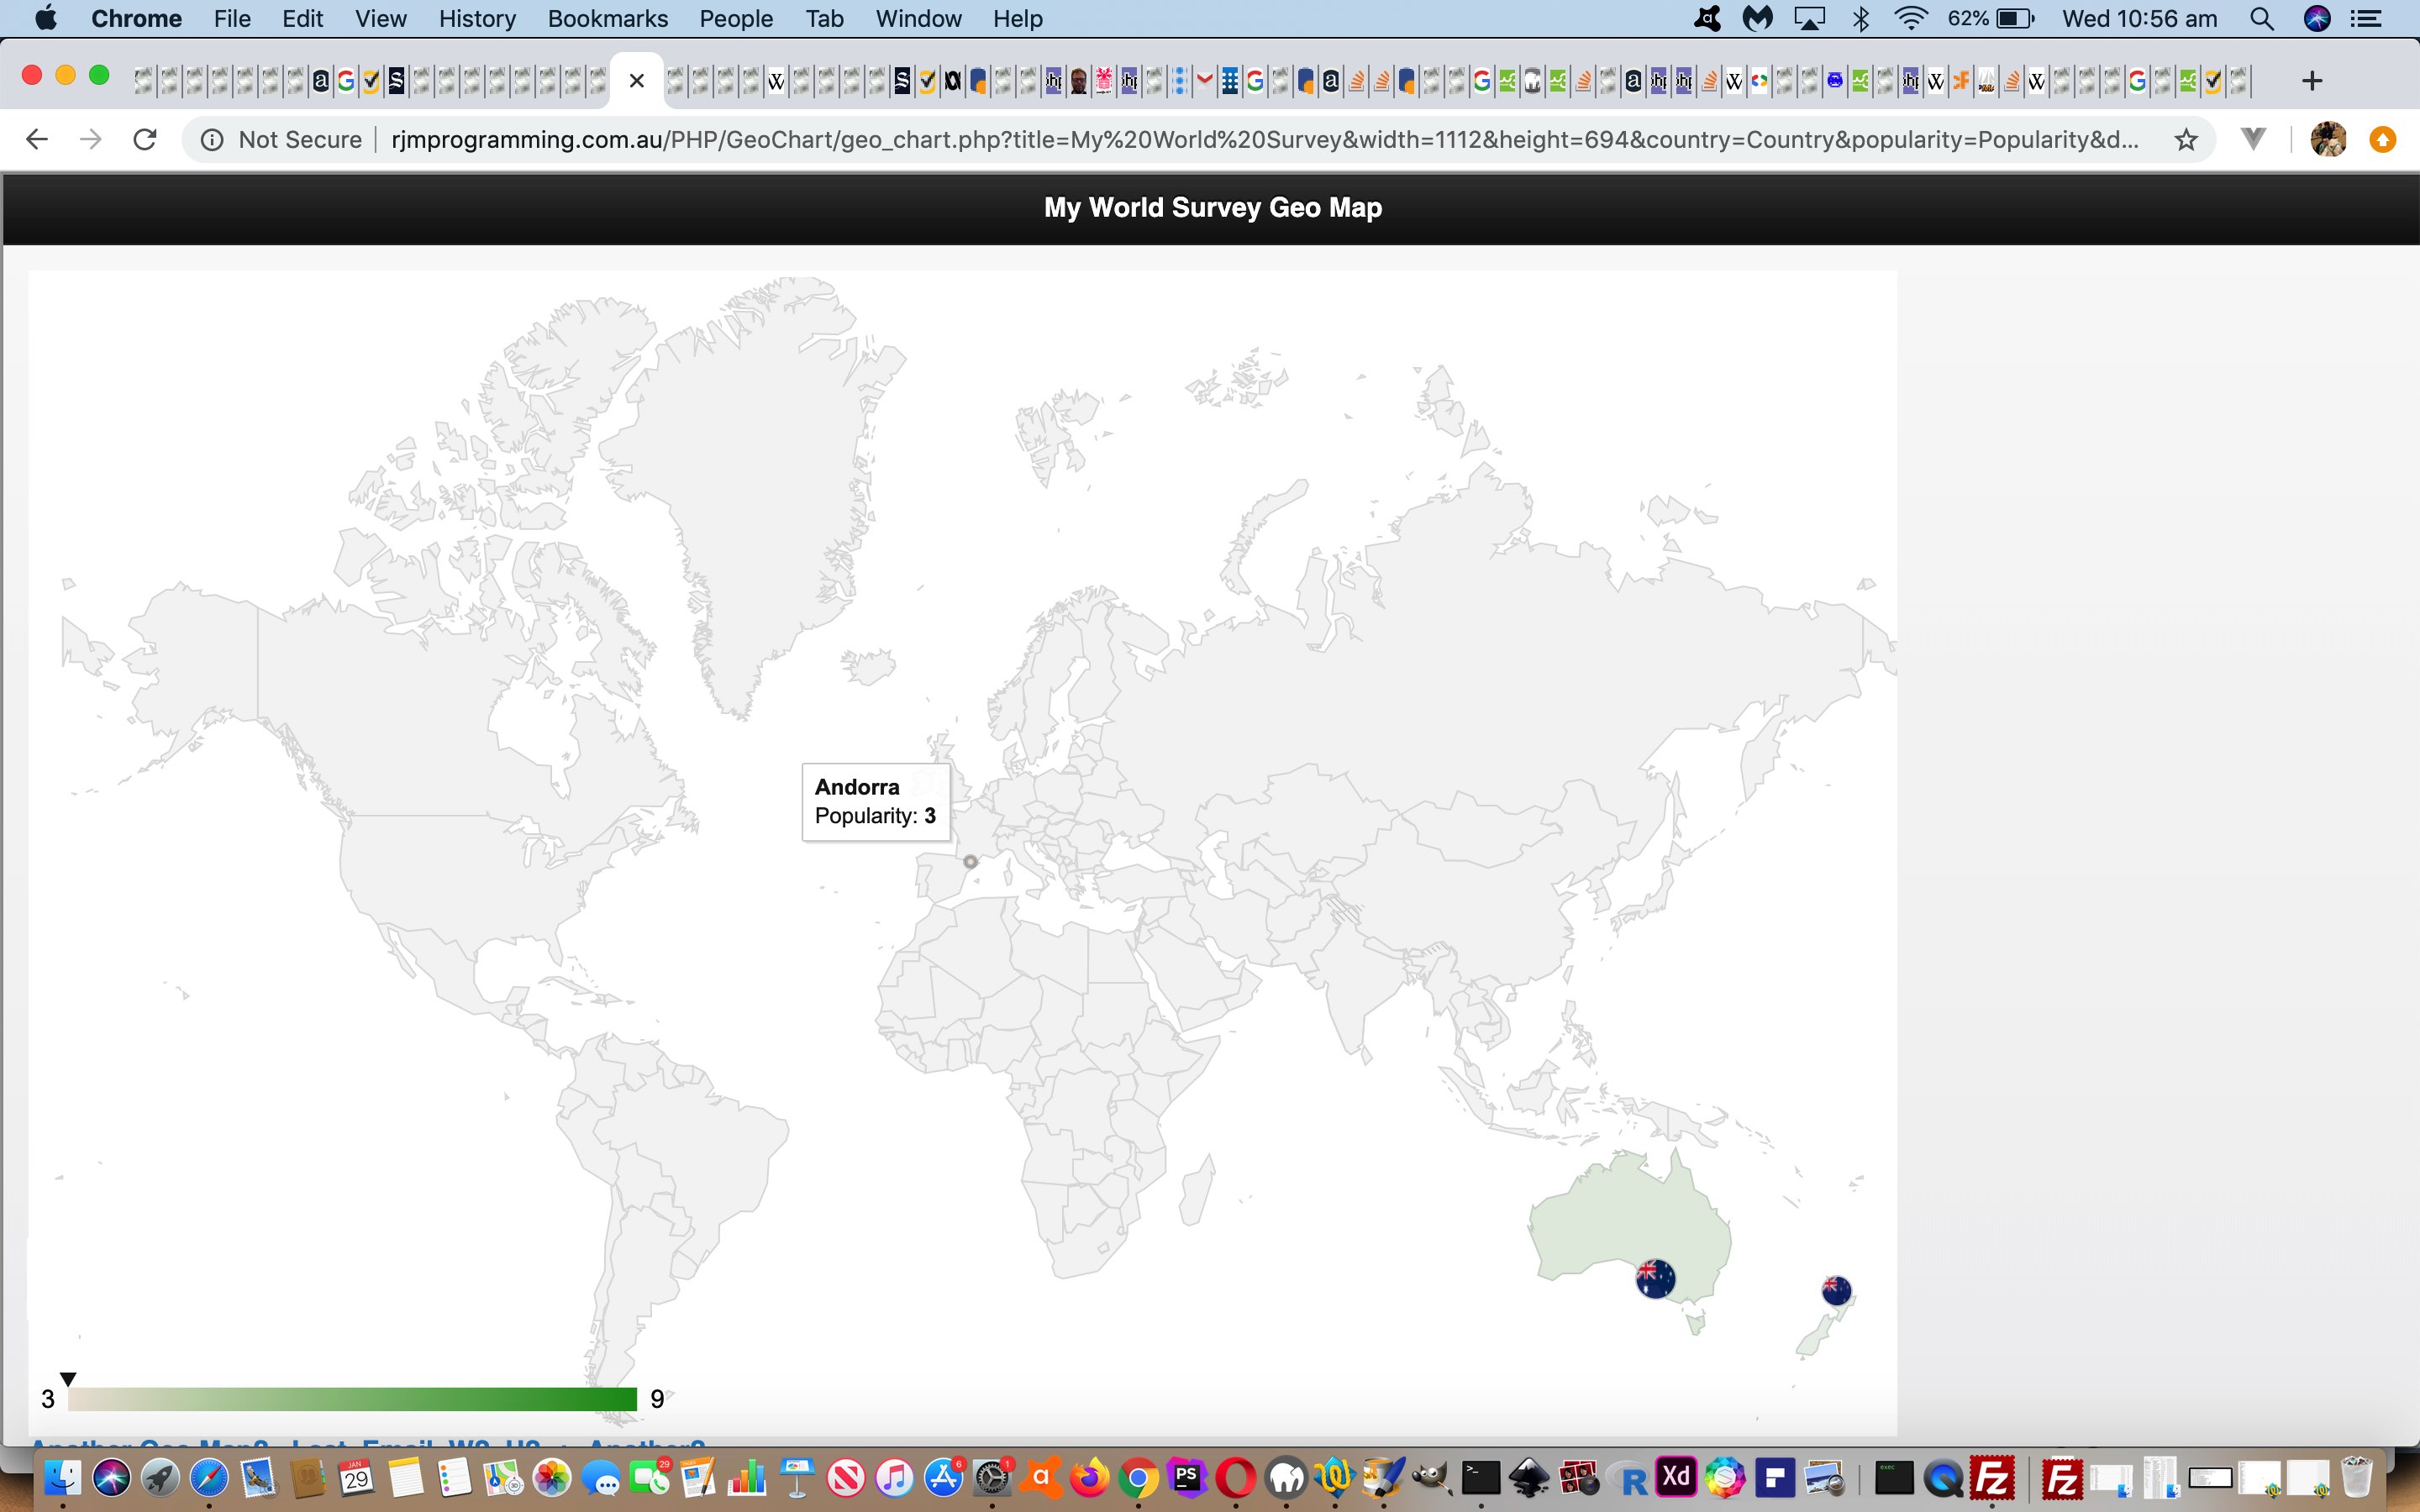
Meanwhile, resuming our dreams of Andorra, there must be hundreds of readers there a bit sick of us going on and on and on and on and on about our Google Chart Geo Chart interfacing Quizzes and the use of complex “width” (and “height”) prompt user interactions. After all, we came onto this topic more to do with “small countries”. Well, let’s go back to that and let’s say …
- as well as the “markers” mode (geographicals) latitude and longitude (helped out by PHP TimeZone places) way of signifying the position of a small country on a world or continent map … always, there behind the scenes, set up ages ago, was the interfacing we had set up to …
- connect with the Google Chart “smarts” regarding “region” mapping to be able to hone in on a “region” (which can mean a whole country too) of interest
… and that means, today, we revisit our imaginary jaunts in Andorra setting out from the big smoke of …
Andorra la Vella
… to the border tranquillity of …
Pas de la Casa
… in the scenario of today’s tutorial picture … honing in on the user interaction before the width one (yayyyyyy!) with that title prompt. At this prompt we make use of two extensions to default behaviour with our PHP web application, those being …
- prefix of “region code” + “;” ( in the case of Andorra an ISO 2 Character Country Code “AD” + “;” =
porkAD; ) - suffix of “heads up” placename list (making it so you will probably not need to fish around for any latitude and longitude geographicals yourself) via &areplaces=[comma (and + if you want lines joining) separated placename list] … eg. &areplaces=Andorra la Vella,+Pas de la Casa
… to end up with a user title data item user interaction entry of …
AD;My World Survey&areplaces=Andorra la Vella,+Pas de la Casa
… as the lead in to “not much thinking” (and as long as you are not Pinocchio, “follow your nose” ease) required for the other non-quiz-based prompts (ie. no need for width or height mantissae …
… in this scenario).
Quite a bit of a different tack to yesterday’s Google Chart Geo Chart Quiz Tooltip Flag Tutorial that you can see how we needed to tweak geo_chart.php Geo Chart interfacer at this live run link, showing the versatility and usefulness of Google Chart Geo Charts.
Previous relevant Google Chart Geo Chart Quiz Tooltip Flag Tutorial is shown below.
Yesterday’s Google Chart Geo Chart Quiz on Mobile Tutorial‘s Google Chart Geo Chart interfacing uses …
- onmouseover event tooltip functionality for non-mobile platforms … and, better something than nothing, we guess …
- first onclick event tooltip functionality for mobile platforms
… a blessing, in our view, that an onmouseover (ie. on hover) piece of functionality thinking survives into the mobile platform wooooooooorrrrrlllddd in some way shape or form. We generally find tooltips an optimistic and useful webpage functionality tool.
And with this in mind, it was worth our mind’s attention to ask … “what about if the Geo Chart Quiz functionality can, optionally, help out the user a bit without giving the game away?” … in the sense that ISO 2 character country codes can be baffling, yet help to make the quiz a challenge, on occasions, though enough of a turn off for some users, we’re sure. But to place an Emoji Flag could be a feature some quizzers will like and appreciate.
Rather than add to the navigational data we’d rather “add” an Emoji Flag on being “flagged” (tee hee) to do so, that “flagging” being to add argument “&flag=y” into the mix, at the width value prompt, which is the same prompt whereby a user decides to create a quiz in the first place. And because Emojis represent text data (albeit multibyte ones) we won’t even need to change data structures, just data content involving the one string structure member of …
['Latitude','Longitude','Country','Countdown']
… which we’ve been sending as that country’s ISO 2 character code (to leave some challenge to the quizzer, where the user has been seeing that ISO code only “on hover” up to today) … but if the user has “flagged” &flag=y this code below swings into play appending text data onto that ISO Code text data (of PHP variable (and argument) “$instuff” below) via String.fromCodePoint() function, as per …
<?php
$lri=["A","B","C","D","E","F","G","H","I","J","K","L","M","N","O","P","Q","R","S","T","U","V","W","X","Y","Z"];

$dri=["127462","127463","127464","127465","127466","127467","127468","127469","127470","127471","127472","127473","127474","127475","127476","127477","127478","127479","127480","127481","127482","127483","127484","127485","127486","127487"];


function maybequizflag($instuff) {

  global $GETdata, $iso_country_codes, $flagentity, $lri, $dri;

  if (isset($_GET['quiz']) || isset($_POST['quiz'])) {

  if (isset($_GET['flag']) || isset($_POST['flag'])) {

    if (strpos($instuff, "['Lat','Long',") !== false) {

      return $instuff; //str_replace("'Country',", "'Country','Flag',", $instuff);

    } else {

      $outstuff=$instuff;

      $cbits=explode("'", $instuff);

      $outstuff=$cbits[0];

      $uretv=" ' + '";

      for ($iol=1; $iol<sizeof($cbits); $iol++) {

        if (($iol % 2) == 1) {

         if (strlen($cbits[$iol]) == 2) {

      for ($jjm=0; $jjm<strlen($cbits[$iol]); $jjm++) {

      for ($jm=0; $jm<sizeof($lri); $jm++) {

       if (strtoupper(substr($cbits[$iol],$jjm,1)) == $lri[$jm]) {

         $uretv=str_replace(" + '", " + String.fromCodePoint(" . $dri[$jm] . ") + '", $uretv); //uvaltosfcp($dri[$jm]);

       }

      }

      }

           $outstuff.="'" . $cbits[$iol] . $uretv;

           $uretv="' + '";

         } else {

           $uretv=" ' + '";

           for ($im=1; $im<sizeof($iso_country_codes); $im+=2) {

            if ($uretv == " ' + '" && strpos(strtolower($iso_country_codes[$im]), strtolower(str_replace("%20"," ",str_replace("%E2%80%99","",str_replace("%2C",",",$cbits[$iol]))))) !== false) {

      for ($jjm=0; $jjm<strlen($iso_country_codes[-1 + $im]); $jjm++) {

      for ($jm=0; $jm<sizeof($lri); $jm++) {

       if (strtoupper(substr($iso_country_codes[-1 + $im],$jjm,1)) == $lri[$jm]) {

         $uretv=str_replace(" + '", " + String.fromCodePoint(" . $dri[$jm] . ") + '", $uretv); //uvaltosfcp($dri[$jm]);

       }

      }

      }

            }

           }

           $outstuff.="'" . $cbits[$iol] . $uretv;

           $uretv="' + '";

         }

        } else {

         $outstuff.="'" . $cbits[$iol];

        }

      }

      return $outstuff; //str_replace("',9", "','x',9", str_replace("',8", "','x',8", str_replace("',7", "','x',7", str_replace("',6", "','x',6", str_replace("',5", "','x',5", str_replace("',4", "','x',4", str_replace("',3", "','x',3", str_replace("',2", "','x',2", str_replace("',1", "','x',1", str_replace("',0", "','x',0", $instuff))))))))));

    }

  }

  }

  return $instuff;

}
?>
Again, you can try the changed geo_chart.php Geo Chart interfacer at this live run link.
Previous relevant Google Chart Geo Chart Quiz on Mobile Tutorial is shown below.
We wanted to improve on the recent Google Chart Geo Chart More Quizzes Tutorial‘s “World Quiz” functionality approach of displaying window.open popups for mobile platforms. The reason for the concern on mobile platforms, and not such a concern on non-mobile platforms (though there is a concern about popup window web browser disabling settings), because the chance to “overlay” a popup window (via the use of a third argument to window.open calls) is ignored on mobile platforms, instead opening a new browser tab (at best). This can be disconcerting, akin to telling a room of students doing an important examination, to look out the window at an interesting magpie (warbling about Collingwood’s last triumph, no doubt).
Well, after extensive research, and first trying to position “anything new” down the bottom of the webpage we …
- rejected idea of whole display of a relevant Wikipedia page content at the bottom (of a mobile user’s Geo Chart “quiz” webpage) … associated with a …
- rejected “a” hashtag link down the bottom (but above proposed content above) to navigate back up to the quiz … to, instead …
- start thinking that it is up to the mobile user to act themselves to ever navigate away from the quiz webpage, so, instead, initially condense the Wikipedia content down to an image that is …
- if HTTPS:// protocol being used, use the Google Page Insights screenshotting “smarts” you can see being used at PDF Slideshow and Form Creation Data URI Contents Tutorial
- if HTTP:// protocol being used, use the (thumbnail version of) the first image of the relevant Wikipedia webpage
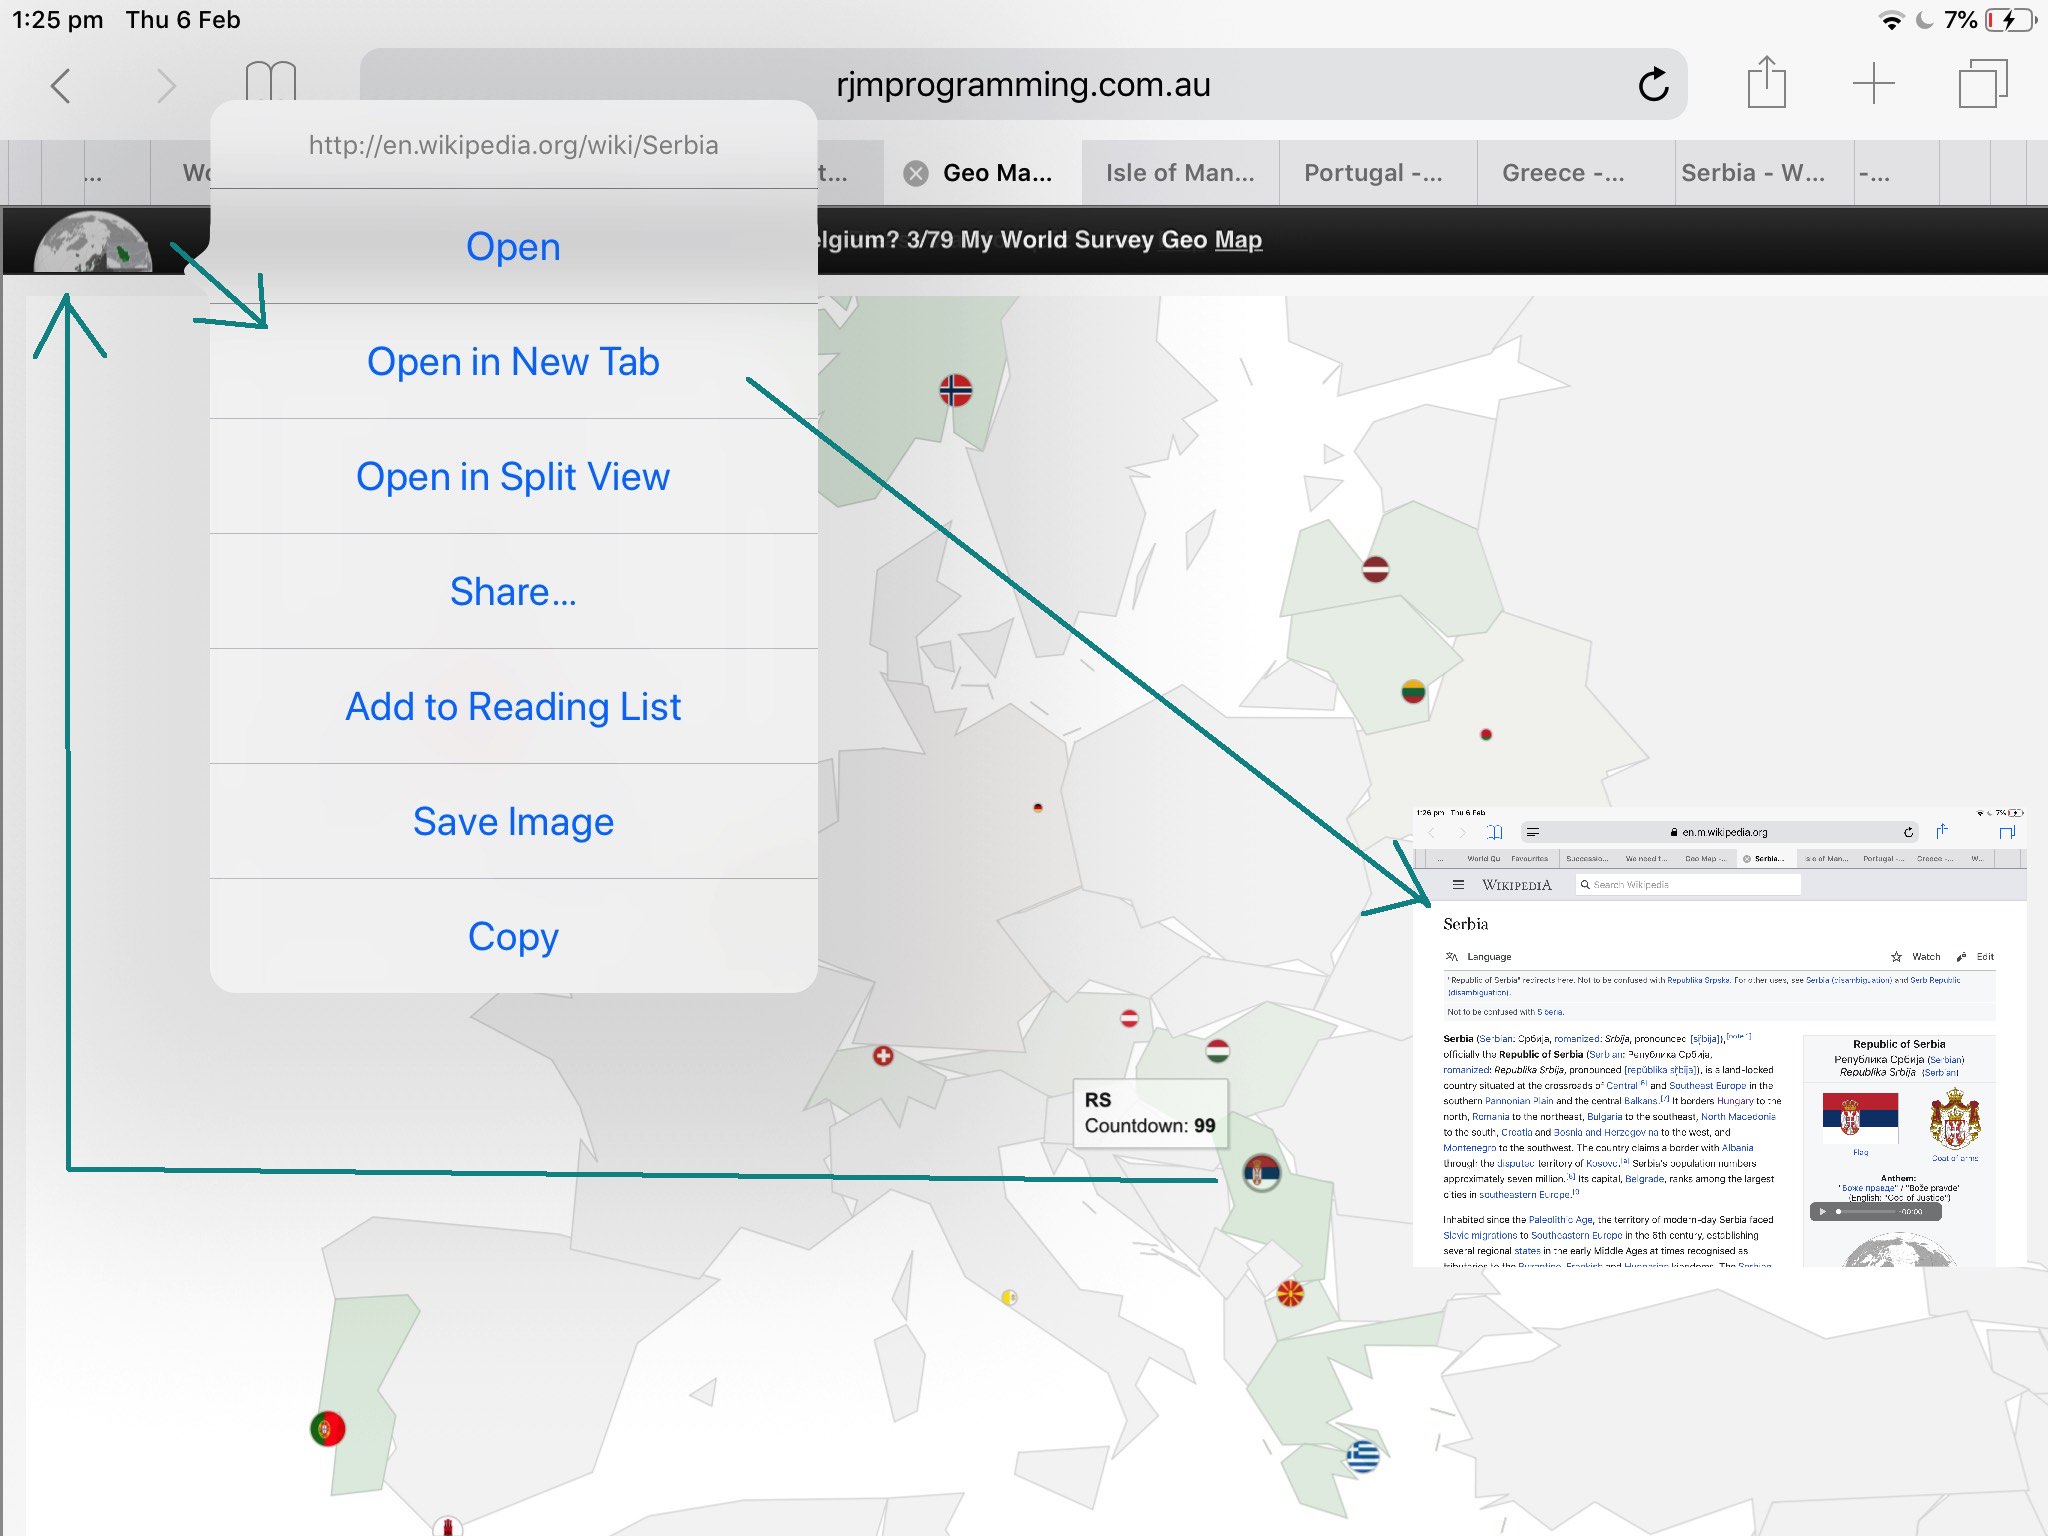
… encased by an “a” tag that the click of navigates the user to the relevant Wikipedia content in a new tab (at best), all positioned at the left hand side of the Geo Chart webpage’s H1 or H2 tag heading as a
70px width42px height thumbnail
The conduit here are Ajax Javascript techniques as per …
  var myxhr = false;

  var oursrc = '';

  var woourl='';


  function ajit(wourl) {

  woourl=wourl;

  var xurl = '';

  if (document.URL.toLowerCase().indexOf('https') == 0) {

  xurl='https://www.googleapis.com/pagespeedonline/v1/runPagespeed?url=' + encodeURIComponent(wourl) + '&screenshot=true';

  } else {

  xurl=document.URL.split('/GeoChart')[0] + '/fgc/?tdinto=&inurl=' + encodeURIComponent(wourl);

  }

      if (window.XMLHttpRequest) {

        myxhr = new window.XMLHttpRequest;

    }

    else {

  try {

    myxhr = new ActiveXObject('Msxml2.XMLHTTP');

  } catch (othermicrosoft) {

    try {

      myxhr = new ActiveXObject('Microsoft.XMLHTTP');

    } catch (failed) {

      myxhr = false;

    }

  }

  }

  if (myxhr) {

    myxhr.onreadystatechange = backin;

    myxhr.open('GET', xurl, true);

    myxhr.send(null);

  }

  }


  function backin() {

  if (myxhr.readyState == 4) {

    if (myxhr.status == 200) {

      if (myxhr.responseText) {

        var dbits = myxhr.responseText.split('\"data\":');

        if (dbits.length > 1) {

         oursrc='data:image/jpeg;base64,' + dbits[1].split('\"')[1].split('\"')[0].replace(/\_/g,'/').replace(/\-/g,'+');

         ism='nm';

         if (navigator.userAgent.match(/Android|BlackBerry|iPhone|iPad|iPod|Opera Mini|IEMobile/i)) {

           ism='';

           document.getElementById(ism + 'dwoalttwo').style.position='absolute';

           document.getElementById(ism + 'dwoalttwo').style.left='20px';

           document.getElementById(ism + 'dwoalttwo').style.top='0px';

           document.getElementById(ism + 'dwoalttwo').style.opacity='0.95';

           document.getElementById(ism + 'dwoalttwo').style.zIndex='51';

         } else {

           document.getElementById(ism + 'dwoalt').innerHTML='<br><a id=btta href=#myh title=Top>Back to top</a>';

         }

         document.getElementById(ism + 'dwoalttwo').innerHTML='<a target=_blank id=adw title=Wikipedia style=z-index:52; href=' + woourl + '><img title=Wikipedia style=width:80px;z-index:52; src=' + oursrc + '></img></a>';

         document.getElementById('myh').onclick=function() { document.getElementById('adw').click(); }

         if (ism != '') { location.href='#btta';  }

        } else if (myxhr.responseText.indexOf('<img') != -1) {

         dbits = myxhr.responseText.split('<img');

         dbits=dbits[1].split(' src=');

         ism='nm';

         if (navigator.userAgent.match(/Android|BlackBerry|iPhone|iPad|iPod|Opera Mini|IEMobile/i)) {

           ism='';

           document.getElementById(ism + 'dwoalttwo').style.position='absolute';

           document.getElementById(ism + 'dwoalttwo').style.left='20px';

           document.getElementById(ism + 'dwoalttwo').style.top='0px';

           document.getElementById(ism + 'dwoalttwo').style.opacity='0.95';

           document.getElementById(ism + 'dwoalttwo').style.zIndex='51';

         } else {

           document.getElementById(ism + 'dwoalt').innerHTML='<br><a id=btta href=#myh title=Top>Back to top</a>';

         }

         document.getElementById(ism + 'dwoalttwo').innerHTML='<a target=_blank id=adw title=Wikipedia style=z-index:52; href=' + woourl + '><img title=Wikipedia style=width:80px;z-index:52; src=' + dbits[1].split(' ')[0].split('>')[0] + '></img></a>';

         document.getElementById('myh').onclick=function() { document.getElementById('adw').click(); }

         if (ism != '') { location.href='#btta';  }

        }

      }

    }

  }

  }
… with the effect, for a mobile user, of not being interrupted from their quiz, unless this thumbnail (Wikipedia content) appears at the top left, that they can “long click” to open in a “New Tab” (or, perhaps, a “Split View”) as required, at least on the iPad we tried this with.
And so, you can try the changed geo_chart.php Geo Chart interfacer at this live run link, we hope representing an improvement for the Quizzing User Experience for our mobile user readers.
Previous relevant Google Chart Geo Chart More Quizzes Tutorial is shown below.
In allowing the World Quiz web applications of yesterday’s Google Chart Geo Chart World Quizzes Tutorial work accept more than about …
- the 10 places (per continent Geo Chart) fitting into a $_GET arguments URL (of about 850 characters, for rjmprogramming.com.au domain) … the first cab off the rank allowing for …
- a lot more than 10 can be accepted via $_POST in an HTML form method=POST action=./geo_chart.php
You may wonder why “first cab off the rank” here. Well, we’re not sure we won’t involve window.sessionStorage or window.localStorage in future plans. It being PHP we’re writing though, we will need a compelling reason to try this.
We allow you to ask the web application to try more places by (optionally) appending space characters onto the height values they enter.
You can try the changed (and note “function iftoobig()” in particular, here) geo_chart.php Geo Chart interfacer at this live run link, and try it with a few right space appended “heights” to try out this new functionality.
Previous relevant Google Chart Geo Chart World Quizzes Tutorial is shown below.
We’re heading towards “prove it for n” on top of the recent Google Chart Geo Chart Oceania Quiz Tutorial (“prove it for 2”) progress, making quizzes for …
- Europe
- South East Asia and Oceania
- Africa
- South America
- North and Central America
- Asia
… but feel we need more testing to bed it down, as far as reliability issues go, and we’ll keep you posted on that.
We found clutter issue with ISO 2 character Country Codes …
| ISO Code 1 | Country TZ Place 1 (Lat,Long) | Too Close To | Country TZ Place 2 (Lat,Long) | ISO Code 2 |
|---|---|---|---|---|
| VA | Vatican City (41.90222, 12.45305) |
(-0.02, +0.03) |
Rome, Italy (41.9, 12.48333) |
IT |
| BJ | Porto-Novo, Benin (6.48333, 2.61666) |
(-0.03, +0.78) |
Lagos, Nigeria (6.45, 3.4) |
NG |
… and so “fashioned” this into a numerical basis for a “declutter” algorithm …
function setsixteenquiz() {

  var sixteen=16;

  var allcontinents=['Europe','South East Asia and Oceania', 'Africa', 'South America', 'North and Central America', 'Asia'];

  var thiscontinent=isquiz;

  var cisq=-1;

  var exclusions=',';

  var sofarq=',-1,';

  var ourselceqih=selceqih.replace(/\ data\-alt\-/g, ' data-');

  if (thiscontinent == 'South East Asia and Oceania') {

   sixteen=10;

  } else if (thiscontinent == 'Africa') {

   sixteen=17;

  } else if (thiscontinent == 'South America') {

   sixteen=10;

  } else if (thiscontinent == 'North and Central America') {

   sixteen=10;

  }

  for (var isqis=0; isqis<allcontinents.length; isqis++) {

   if (allcontinents[isqis] != thiscontinent) {

    while (ourselceqih.indexOf(' data-continent=\"' + allcontinents[isqis] + '\"') != -1) {

    ourselceqih=ourselceqih.replace(' data-continent=\"' + allcontinents[isqis] + '\"','');

    }

   }

  }

  var sqws=ourselceqih.split(' data-continent=\"' + thiscontinent + '\" value=\"');

  document.body.title='Awaiting quiz clickable circle symbols to score ...';

  document.body.style.cursor=pcur;

  if (document.getElementById('chart')) {

  document.getElementById('chart').title='Awaiting quiz clickable circle symbols to score ... ';

  document.getElementById('chart').style.cursor=pcur;

  }

  var latsofar=[], longsofar=[], thislats=0.0, thislongs=0.0;

  var valid=true, ivalid=0, difflatlong=0.0;

  while (quizisos.length < sixteen) {

    cisq=-1;

    while (sofarq.indexOf(',' + cisq + ',') != -1 || exclusions.indexOf(',' + cisq + ',') != -1) {

      cisq=Math.floor(Math.random() * eval(-1 + sqws.length));

      cisq++;

       if (ourtzlist.indexOf(',' + sqws[cisq].split('\"')[0] + ',') != -1) {

      thislats=(eval(ourtzlist.split(',' + sqws[cisq].split('\"')[0] + ',')[0].split(' data-geo=\"')[eval(-1 + ourtzlist.split(',' + sqws[cisq].split('\"')[0] + ',')[0].split(' data-geo=\"').length)].split(',')[0]));

      thislongs=(eval(ourtzlist.split(',' + sqws[cisq].split('\"')[0] + ',')[0].split(' data-geo=\"')[eval(-1 + ourtzlist.split(',' + sqws[cisq].split('\"')[0] + ',')[0].split(' data-geo=\"').length)].split(',')[1]));

      }

      if (thiscontinent == 'South East Asia and Oceania') {

       if (ourtzlist.indexOf(',' + sqws[cisq].split('\"')[0] + ',') != -1) {

        if (eval(ourtzlist.split(',' + sqws[cisq].split('\"')[0] + ',')[0].split(' data-geo=\"')[eval(-1 + ourtzlist.split(',' + sqws[cisq].split('\"')[0] + ',')[0].split(' data-geo=\"').length)].split(',')[1]) < 73.0) { // || eval(ourtzlist.split(',' + ourselceqih[cisq].split('\"')[0] + ',')[0].split(' data-geo=\"')[eval(-1 + ourtzlist.split(',' + ourselceqih[cisq].split('\"')[0] + ',')[0].split(' data-geo=\"').length)].split(',')[1]) >= 169.0) {

          cisq=-1;

        }

       } else {

        cisq=-1;

       }

      }

    }

    sofarq+='' + cisq + ',';

    if (cisq != -1) {

    if (sqws[cisq].split('\"')[0] == 'IT') { exclusions+='VA,'; } else if (sqws[cisq].split('\"')[0] == 'VA') { exclusions+='IT,'; }

    if (sqws[cisq].split('\"')[0] == 'BJ') { exclusions+='NG,'; } else if (sqws[cisq].split('\"')[0] == 'NG') { exclusions+='BJ,'; }

    difflatlong=0.0;

    if (quizisos.length > 0) {

      for (ivalid=0; ivalid<quizisos.length; ivalid++) {

        difflatlong=Math.abs(eval('' + latsofar[ivalid]) - eval('' + thislats)) + Math.abs(eval('' + longsofar[ivalid]) - eval('' + thislongs));

      }

    }

    if (difflatlong >= 2.0 || quizisos.length == 0) {

      latsofar.push(thislats);

      longsofar.push(thislongs);

      quizisos.push(sqws[cisq].split('\"')[0]);

    }

    }

  }

  quizisos.push(\"\");

}
Here’s your chance to try the changed geo_chart.php Geo Chart interfacer at this live run link, and enter Africa, South America, North and Central America and Asia Quiz territory by following pointers at the “width” interactive entry (Javascript) prompt window.
Previous relevant Google Chart Geo Chart Oceania Quiz Tutorial is shown below.
Regular readers will know about our penchant for “mathematical induction” theory, in the way you …
- prove it for 1
- prove it for 2
- prove it for n
… and earlier this morning “too proud” moi thought we’d be at “n”, skipping “2” by now getting our Geo Chart interfacing new “Quiz” functionality to have covered user interactions for all the major continents of greater than 10 (of category) places, looking towards the “10 is a bit lame” thinking, to follow. Oh, well! But maybe that’s the point of the “2” in the “mathematical induction” proof “game”. A lot might be discovered, and so it was for us, trying to open the door to … come in …
South East Asia and Oceania ...
… spinner! In broad brush concepts, we discovered …
- we needed to start to worry about places with an ISO 2 code but no TimeZone …
- we needed to start to worry about places off to the left, right, and top limits of the Geo Chart limits we establish via those weird width and height values you enter … and on this am sure many will have tweaked that the value integer parts are like a “scalar” measure and the mantissae are a “left zero padded percentage offset into the entire Geo Chart on which to lob” measure
- we needed to rearrange the scoring system’s denominator as a “seconds timer” rather than a “number of goes”
- we needed to, at least at the start, mention name of Quiz
- we needed to start closing previous Wikipedia windows on opening a new one, as applicable
- we needed to start to worry about clutter (eg. Vatican City and Rome geographicals for two different countries)
- we needed to start to worry about “skewed representations” (going back to Europe Quiz) whereby the first mention of a country ISO 2 Code within the TimeZone list is a position of a colony or dominion
… whereas we optimistically imagined all we might need to worry about was just …
- converting (boolean binary decision) variable isquiz=false/true (Javascript code logic) into (string ternary and more decision) variable isquiz=”/’Europe’/’South East Asia and Oceania’ (with more to come … until “n” (for) nirvana) … and associated …
- adding data-continent=”South East Asia and Oceania” global data attributes into dropdown id=’selceq’ linking ISO 2 codes with Country names
- trying to add a bit of cursor=’progress’ flagging of web application “thinking time”
Never mind! And so, onto yesterday’s Google Chart Geo Chart Europe Quiz Tutorial progress there is not that much difference user interaction wise, just the offer of another weird “width” value choice (on which to blow your mind) but behind the scenes a “hard working mathematical induction middlemanperson” can now offer you the chance to try the changed geo_chart.php Geo Chart interfacer at this live run link, and enter South East Asia and Oceania Quiz territory by following pointers at the “width” interactive entry (Javascript) prompt window.
Previous relevant Google Chart Geo Chart Europe Quiz Tutorial is shown below.
Up to yesterday’s Google Chart Geo Chart Sorted Small Countries Tutorial, as with interfacings to other Google Charts, we had a two phase aspect to the web application structures …
- ask for user interaction via the keyboard
- display the resultant Google Chart taking notice of that user interaction
… but today’s extension of Geo Chart interfacing functionality opens the door to the new …
- display the resultant Google Chart taking notice of that user interaction and allowing click/touch continuing interaction in the form of a quiz … first cab off the rank … Europe Quiz
The work recently has helped because …
function gck(igck) {

  var ansis='';

  if (document.getElementById('attachedImage' + ('' + igck).replace('-1',''))) {

    var xxx=document.getElementById('attachedImage' + ('' + igck).replace('-1','')).getAttribute('title');

    if (xxx.indexOf('#') != -1) {

    if (isquiz) {

    maybe_bad=false;

    if (xxx.split('#')[1].indexOf('/') != -1) {

    ansis=xxx.split('#')[1].split('/')[eval(-1 + xxx.split('#')[1].split('/').length)].toLowerCase();

    } else {

    ansis=xxx.split('#')[1];

    }

    if (document.getElementById('sans').getAttribute('data-title').toLowerCase().replace(/\ /g,'_') == ansis.toLowerCase().replace(/\ /g,'_')) {

     score++;

     goes++;

    } else {

     goes++;

    }

    document.getElementById('sans').innerHTML='? ' + score + '/' + goes;

    }

    window.open(xxx.split('#')[1],'_blank', 'top=50,left=50,width=500,height=500');

    } else if (xxx == '') {

    if (isquiz) {

    maybe_bad=false;

    if (document.getElementById('attachedImage' + ('' + igck).replace('-1','')).title.indexOf('/') != -1) {

    ansis=document.getElementById('attachedImage' + ('' + igck).replace('-1','')).title.split('/')[eval(-1 + xxx.split('#')[1].split('/').length)].toLowerCase();

    } else {

    ansis=document.getElementById('attachedImage' + ('' + igck).replace('-1','')).title;

    }

    if (document.getElementById('sans').getAttribute('data-title').toLowerCase().replace(/\ /g,'_') == ansis.toLowerCase().replace(/\ /g,'_')) {

     score++;

     goes++;

    } else {

     goes++;

    }

    document.getElementById('sans').innerHTML='? ' + score + '/' + goes;

    }

    window.open(document.getElementById('attachedImage' + ('' + igck).replace('-1','')).title,'_blank', 'top=50,left=50,width=500,height=500');

    } else {

    if (isquiz) {

    maybe_bad=false;

    if (xxx.indexOf('/') != -1) {

    ansis=xxx.split('/')[eval(-1 + xxx.split('/').length)].toLowerCase();

    } else {

    ansis=xxx;

    }

    if (document.getElementById('sans').getAttribute('data-title').toLowerCase().replace(/\ /g,'_') == ansis.toLowerCase().replace(/\ /g,'_')) {

     score++;

     goes++;

    } else {

     goes++;

    }

    document.getElementById('sans').innerHTML='? ' + score + '/' + goes;

    }

    window.open(xxx,'_blank', 'top=50,left=50,width=500,height=500');

    }

  }

}
… is an onclick place we’ve set aside for our SVG intervention work. Keep it to no keyboard for this Europe Quiz, and we are happy (with this new idea, reminiscent of recent tweaking at Google Chart Annotated Timeline Whitespace Delimitation Tutorial).
So, again, you can try the changed geo_chart.php Geo Chart interfacer at this live run link, and enter Europe Quiz territory by following pointers at the “width” interactive entry (Javascript) prompt window.
Previous relevant Google Chart Geo Chart Sorted Small Countries Tutorial is shown below.
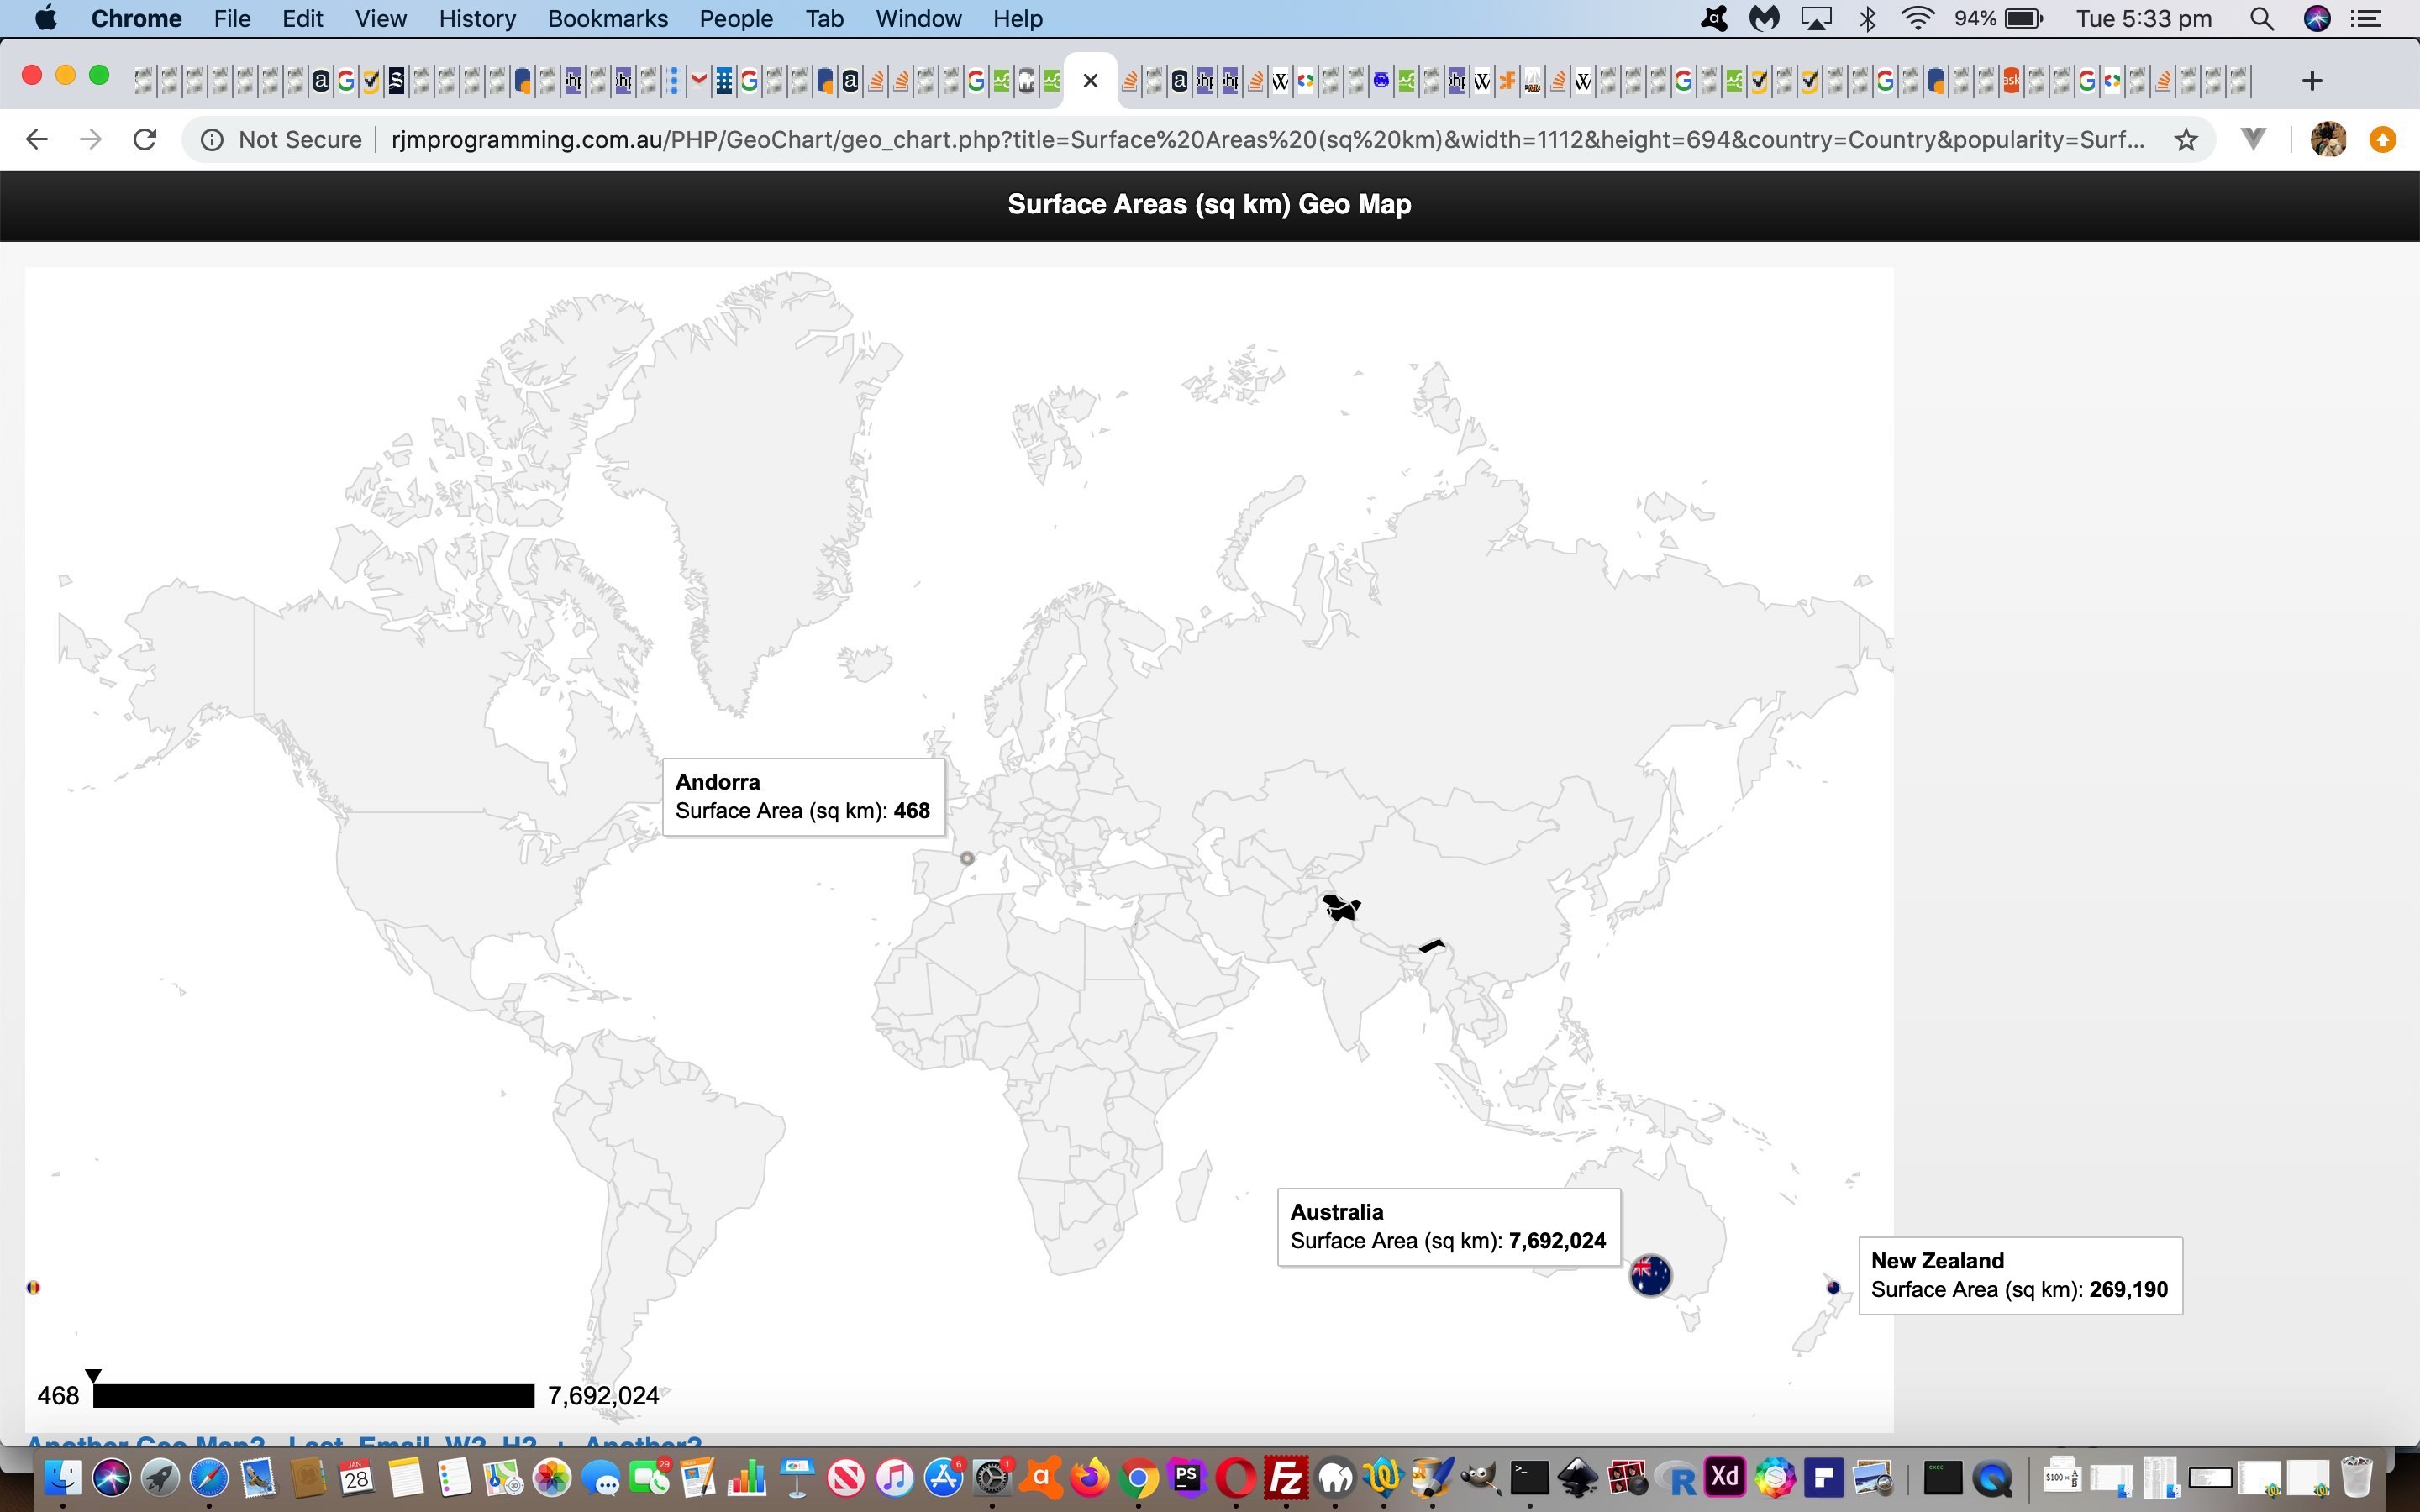
Yesterday’s Google Chart Geo Chart Small Countries Overlay Tutorial‘s workings potentially using the geographicals (or marker) mode of use actually involve intervention logic within what Google provide SVG-wise for the Geo Chart content.
And so, for some time, the order in which we entered …
| Country | Surface Area (sq km) |
|---|---|
| Australia | 7692024 |
| New Zealand | 269190 |
| Andorra | 468 |
… we entered, interactively by us, like, personally, like, in that order above, like. But for a day or two we were covering up a gap in the “wall of logic” plaster we had created for Google Chart select event logic (actually non-existant for the Geo Chart, but we code for onclick logic to navigate a user to a relevant Wikipedia page). The good news is we have fixed it now, not tying the user down to entering data in any particular order.
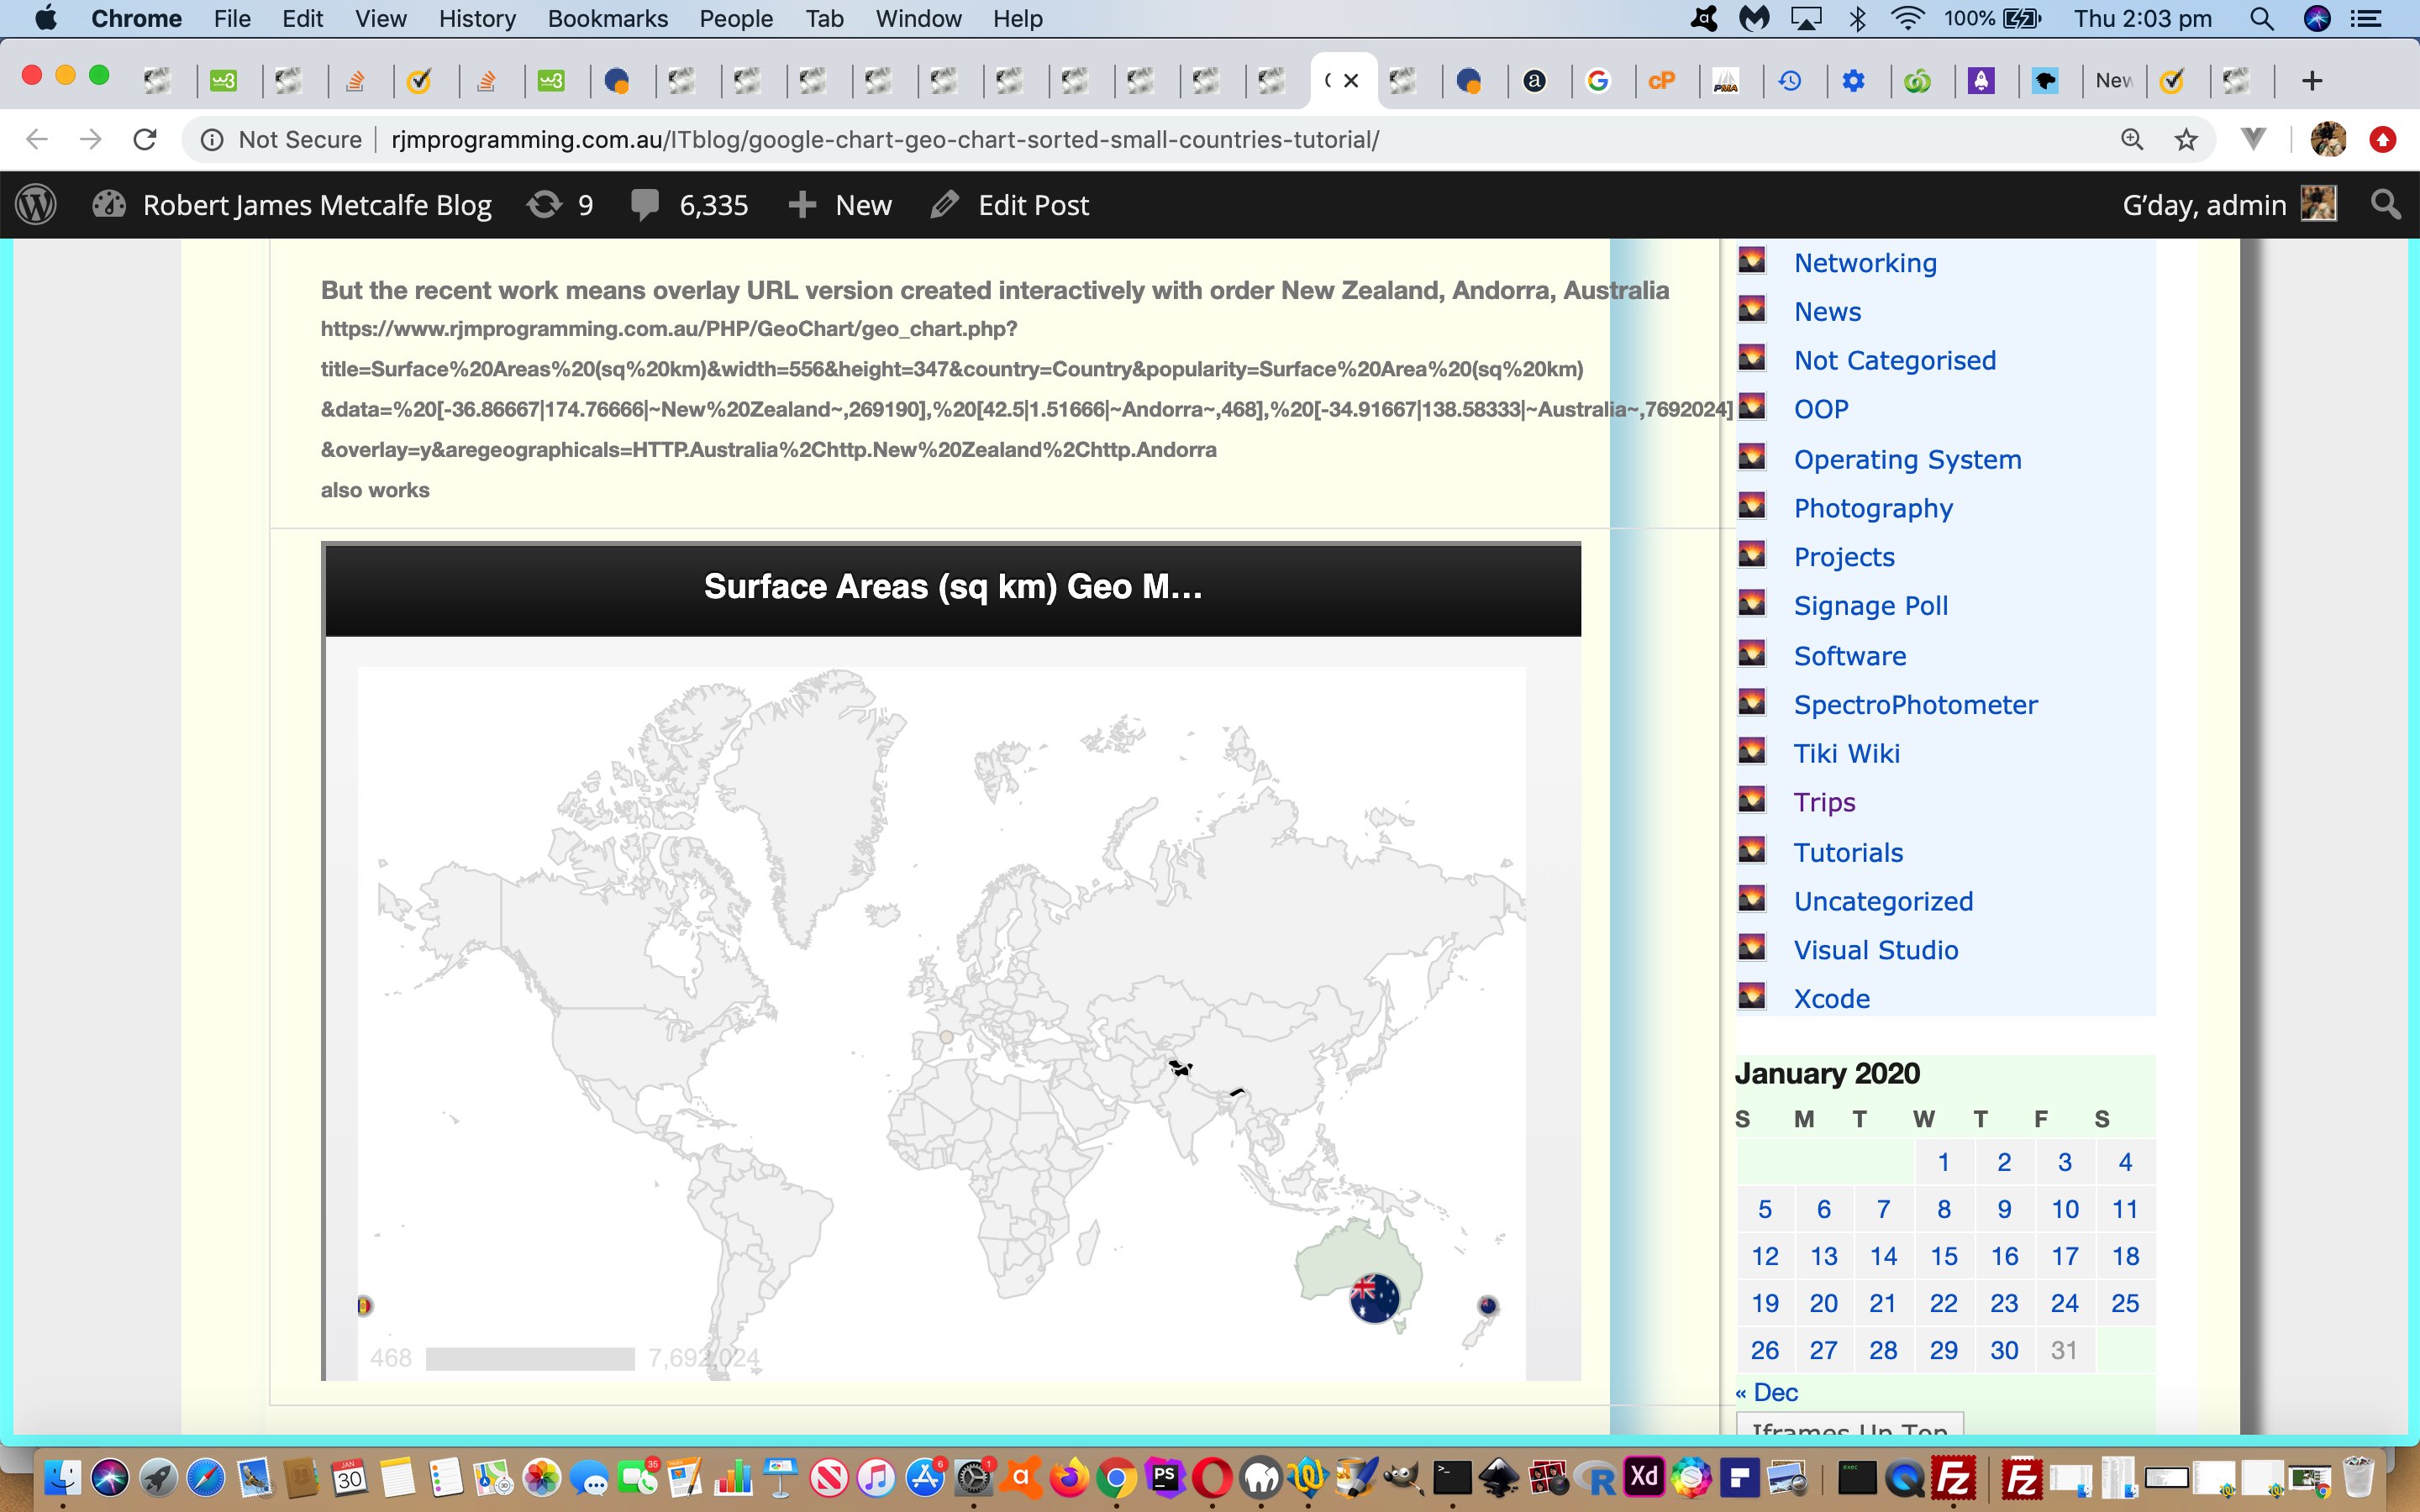
Fixed what, now? (I thought I heard you ask?!) Well, the alignment of &aregeographical= data to the symbology presented at the geographical positions on the Geo Map asks that the order we present corresponds to the relevant order of relevant Google SVG elements, and Google orders these from the largest numerical value down to the smallest, as you notice as far as Surface Area (sq km) suits an order of Australia, New Zealand, Andorra …
| First non-overlay URL version goes https://www.rjmprogramming.com.au/PHP/GeoChart/geo_chart.php?title=Surface%20Areas%20(sq%20km)&width=1112&height=694&country=Country&popularity=Surface%20Area%20(sq%20km)&data=%20[-34.91667|138.58333|~Australia~,7692024]%20,%20[-36.86667|174.76666|~New%20Zealand~,269190]%20,%20[42.5|1.51666|~Andorra~,468]%20&aregeographicals=http.Australia%2Chttp.New%20Zealand%2Chttp.Andorra |
|---|
| Second overlay URL version goes https://www.rjmprogramming.com.au/PHP/GeoChart/geo_chart.php?title=Surface%20Areas%20(sq%20km)&width=1112&height=694&country=Country&popularity=Surface%20Area%20(sq%20km)&data=%20[-34.91667|138.58333|~Australia~,7692024]%20,%20[-36.86667|174.76666|~New%20Zealand~,269190]%20,%20[42.5|1.51666|~Andorra~,468]%20&overlay=y&aregeographicals=http.Australia%2Chttp.New%20Zealand%2Chttp.Andorra |
| But the recent work means overlay URL version created interactively with order New Zealand, Andorra, Australia https://www.rjmprogramming.com.au/PHP/GeoChart/geo_chart.php?title=Surface%20Areas%20(sq%20km)&width=1112&height=694&country=Country&popularity=Surface%20Area%20(sq%20km)&data=%20[-36.86667|174.76666|~New%20Zealand~,269190]%20,%20[42.5|1.51666|~Andorra~,468]%20,%20[-34.91667|138.58333|~Australia~,7692024]%20&overlay=y&aregeographicals=http.Australia%2Chttp.New%20Zealand%2Chttp.Andorra also works |
… and the changes necessary to ensure this go …
 // var pushfrom=[], pushto=[], pushag=[], selceqih='', saih='', oneistoosmall=false, oneisnotapplicable=false;

 function assess_small(indatar) {

      var ipl=0, jpl=0, kpl=0, pushxx=[];

      var outsuffix='';

      var outdatar=indatar;

      if (pushfrom.length > 0 && !oneisnotapplicable && oneistoosmall) {

       for (jpl=0; jpl<pushfrom.length; jpl++) {   // for (var ipl=0; ipl<pushfrom.length; ipl++) {

         if (jpl == 0) {

           var huhdatas=indatar.split('~');

           for (var ihuhdatas=2; ihuhdatas<huhdatas.length; ihuhdatas+=2) {

             if (huhdatas[eval(-1 + eval('' + ihuhdatas))].split('~')[0].replace('%20',' ').indexOf(' ') != -1) {

             pushxx.push(('00000000000000000000000' + huhdatas[ihuhdatas].split(',')[1].split(']')[0]).slice(-22) + ' ... ' + huhdatas[eval(-1 + eval('' + ihuhdatas))].split('~')[0]);

             }

             pushxx.push(('00000000000000000000000' + huhdatas[ihuhdatas].split(',')[1].split(']')[0]).slice(-22) + ' ... ' + encodeURIComponent(huhdatas[eval(-1 + eval('' + ihuhdatas))].split('~')[0]));

           }

           pushxx.sort();

           pushxx.reverse();

         }

         ipl=jpl;

         for (kpl=0; kpl<pushfrom.length; kpl++) {

           if (ipl == jpl && pushxx[jpl].split(' ... ')[1] == pushfrom[kpl].split('~')[1].split('~')[0]) {

             ipl=kpl;

             pushxx[jpl]=pushxx[jpl].split(' ... ')[0] + ' ...  ';

           }

         }

         if (outdatar.indexOf(pushfrom[ipl]) != -1) {

         if (outsuffix == '') {

           outsuffix='&aregeographicals=' + pushag[ipl];

         } else {

           outsuffix+='%2C' + pushag[ipl];

         }

         while (outdatar.indexOf(pushfrom[ipl]) != -1) {

           outdatar=outdatar.replace(pushfrom[ipl], pushto[ipl]);

         }

         }

       }

      }


      return outdatar + outsuffix;

 }
Yet again, you can try the changed geo_chart.php Geo Chart interfacer at this live run link.
Previous relevant Google Chart Geo Chart Small Countries Overlay Tutorial is shown below.
With “overlay” techniques available in life it might be tempting to say “never say never” because you don’t have to compromise a weak solution for a less weak solution. Yesterday’s Google Chart Geo Chart Small Countries Tutorial‘s Google Chart Geo Chart‘s homegrown interfacer tactics for Small Countries is a case in point.
You may recall from yesterday how we dynamically reverted to “geographicals mode” display (Google call it “Markers” mode) when the shading for a Small Country would lead to “data loss”. But what if we …
- continue what we were doing yesterday “overlayed” …
… onto …
- what we changed from URL-wise with “function assess_small()” (with the one codeline change …
outsuffix='&overlay=y&aregeographicals=' + pushag[ipl];
) … in the form of two new HTML iframe code below …
<?php
if (isset($_GET['overlay']) || isset($_POST['overlay'])) {

  echo "<script> function overlayit() {

     var ourls=documentURL.split('&overlay=')[0].split('[');

     var ourl=ourls[0];

     for (var iouris=1; iouris<ourls.length; iouris++) {

      if (ourls[iouris].substring(0,1) == '~') {

        ourl+='[' + ourls[iouris];

      } else {

        ourl+='[' + ourls[iouris].replace(ourls[iouris].split('~')[0],'');

      }

     }

     document.body.style.zIndex='-12';

     document.getElementById('doverlay').innerHTML='<iframe style=\"position:absolute;top:0px;left:0px;width:100%;height:100vh;z-index:2;opacity:0.95;\" src=\"' + ourl + '\"></iframe>';

     document.getElementById('doverlaytwo').innerHTML='<iframe style=\"position:absolute;top:0px;left:0px;width:100%;height:100vh;z-index:22;opacity:0.9;\" src=\"' + documentURL.replace('&overlay=','&qw=') + '&guess=' + '\"></iframe>';

 }

 setTimeout(overlayit, 2000);

 </script>

";

}
?>
Again, you can try the changed geo_chart.php Geo Chart interfacer at this live run link.
Previous relevant Google Chart Geo Chart Small Countries Tutorial is shown below.
We last used the excellent Google Chart Geo Chart tool with the work of Window LocalStorage Client Versus Server Map Tutorial, and it was this project that alerted us to both a weakness and a strength of that chart …
- a weakness being its inability to get the resolution to shade a small country (eg. today’s tutorial picture‘s Andorra) … but, the good news, as used with this integration work above …
- a strength is the alternative display mechanism via geographical entries
… and so, what if …
- as the user enters in their Country (or Geographical) data …
- if we can determine it as being a Country being entered … and…
- you have only ever been entering Countries … and …
- any one Country so defined has a surface area less than 10000 square kilometers … then …
- we navigate to a Geographical data version of this “only Countries entered” data set … so that …
- even small such Countries will be displayed …
- as they would not if still in the default “only Countries entered” mode of display
We introduce three new sources of data in order to piece together the (Javascript via PHP coding) logic for this …
- TimeZone and Geographicals and ISO 2 Letter Code information …
var ourtzlist='<option value="Africa/Abidjan" data-geo="5.31666,-4.03334,GMT,CI,+0">Africa/Abidjan</option><option value="Africa/Accra" data-geo="5.55,-0.21667,GMT,GH,+0">Africa/Accra</option>'; // etcetera etcetera etcetera
- Country Name and ISO 2 Letter Code information (etcetera etcetera etcetera) …
<div id=dlookups>

<select id='selceq' style='display:none;'>

<option value='AF'>Afghanistan</option>

<option value='AX'>Aland Islands</option>

<option value='AL'>Albania</option>

</select></div>
- Surface Areas of Countries thanks to Wikipedia (etcetera etcetera etcetera) …
<table style='display:none;' id='surface_area' border='1' cellpadding='2' cellspacing='0'>

<tbody><tr bgcolor='#efefef'>

<th>Pos

</th><th>Country

</th>

<th>Area (km²)

</th></tr>

<tr>

<td>1</td>

<td><a data-href='/wiki/Russia' title='Russia'>Russia</a></td>

<td>17098246

</td></tr>

<tr>

<td>2</td>

<td><a data-href='/wiki/Canada' title='Canada'>Canada</a></td>

<td>9984670

</td></tr>

<tr>

<td>3</td>

<td><a data-href='/wiki/People%27s_Republic_of_China' title='People's Republic of China'>China</a></td>

<td>9572900

</td></tr>

</tbody></table>
… used where we process a user Country (or Geographical) interaction Javascript code snippet where variable thisris is that user interaction result …
 var pushfrom=[], pushto=[], pushag=[], selceqih='', saih='', oneistoosmall=false, oneisnotapplicable=false;


       if (ourtzlist.indexOf(',' + thisris.toUpperCase() + ',') != -1 && thisris.length == 2) {

             if (selceqih == '') {  selceqih=document.getElementById('selceq').innerHTML;   }

             if (saih == '') {  saih=document.getElementById('surface_area').innerHTML;   }

             pushfrom.push('[~' + thisris + '~');

             pushto.push('[' + ourtzlist.split(',' + thisris.toUpperCase() + ',')[0].split(' data-geo=\"')[eval(-1 + ourtzlist.split(',' + thisris.toUpperCase() + ',')[0].split(' data-geo=\"').length)].split(',')[0] + '|' + ourtzlist.split(',' + thisris.toUpperCase() + ',')[0].split(' data-geo=\"')[eval(-1 + ourtzlist.split(',' + thisris.toUpperCase() + ',')[0].split(' data-geo=\"').length)].split(',')[1] + '|~' + thisris.toUpperCase() + '~');

             if (selceqih.indexOf(' value=\"' + thisris.toUpperCase() + '\">') != -1) {

               pushag.push('http.' + encodeURIComponent(selceqih.split(' value=\"' + thisris.toUpperCase() + '\">')[1].split('<')[0]));

             } else {

               pushag.push('');

             }

             if (saih.indexOf('>' + selceqih.split(' value=\"' + thisris.toUpperCase() + '\">')[1].split('<')[0]) != -1) {

               thissa=saih.split('>' + selceqih.split(' value=\"' + thisris.toUpperCase() + '\">')[1].split('<')[0])[1].split('<td>')[1].split('<')[0].split(String.fromCharCode(10))[0];

               if (eval('' + thissa) < 10000) {

                oneistoosmall=true;

               }

             }

        } else if (('' + thisris).trim() != '' && selceqih.toUpperCase().indexOf('>' + thisris.toUpperCase()) != -1) {

             thisisocc=selceqih.toUpperCase().split('>' + thisris.toUpperCase())[0].split(' VALUE=\"')[eval(-1 + selceqih.toUpperCase().split('>' + thisris.toUpperCase())[0].split(' VALUE=\"').length)].split('\"')[0];

             pushfrom.push('[~' + encodeURIComponent(thisris) + '~');

             pushto.push('[' + ourtzlist.split(',' + thisisocc + ',')[0].split(' data-geo=\"')[eval(-1 + ourtzlist.split(',' + thisisocc + ',')[0].split(' data-geo=\"').length)].split(',')[0] + '|' + ourtzlist.split(',' + thisisocc + ',')[0].split(' data-geo=\"')[eval(-1 + ourtzlist.split(',' + thisisocc + ',')[0].split(' data-geo=\"').length)].split(',')[1] + '|~' + encodeURIComponent(thisris) + '~');

             pushag.push('http.' + encodeURIComponent(thisris));

             if (thisris.indexOf(' ') != -1) {

             pushfrom.push('[~' + thisris + '~');

             pushto.push('[' + ourtzlist.split(',' + thisisocc + ',')[0].split(' data-geo=\"')[eval(-1 + ourtzlist.split(',' + thisisocc + ',')[0].split(' data-geo=\"').length)].split(',')[0] + '|' + ourtzlist.split(',' + thisisocc + ',')[0].split(' data-geo=\"')[eval(-1 + ourtzlist.split(',' + thisisocc + ',')[0].split(' data-geo=\"').length)].split(',')[1] + '|~' + encodeURIComponent(thisris) + '~');

             pushag.push('http.' + encodeURIComponent(thisris));

             }

             if (saih.toUpperCase().indexOf('>' + thisris.toUpperCase()) != -1) {

               thissa=saih.toUpperCase().split('>' + thisris.toUpperCase())[1];

               thissa=thissa.split('<TD>')[1].split('<')[0].split(String.fromCharCode(10))[0];

               if (eval('' + thissa) < 10000) {

                oneistoosmall=true;

               }

             }

        }
… and if remaining relevant just before the next navigation happens, where variable indatar represents the default “only Countries entered” mode of display value …
 // var pushfrom=[], pushto=[], pushag=[], selceqih='', saih='', oneistoosmall=false, oneisnotapplicable=false;

 function assess_small(indatar) {

      var outsuffix='';

      var outdatar=indatar;

      if (pushfrom.length > 0 && !oneisnotapplicable && oneistoosmall) {

       for (var ipl=0; ipl<pushfrom.length; ipl++) {

         if (outdatar.indexOf(pushfrom[ipl]) != -1) {

         if (outsuffix == '') {

           outsuffix='&aregeographicals=' + pushag[ipl];

         } else {

           outsuffix+='%2C' + pushag[ipl];

         }

         while (outdatar.indexOf(pushfrom[ipl]) != -1) {

           outdatar=outdatar.replace(pushfrom[ipl], pushto[ipl]);

         }

         }

       }

      }


      return outdatar + outsuffix;

 }
You can try the changed geo_chart.php Geo Chart interfacer at this live run link.
Previous relevant Window LocalStorage Client Versus Server Map Tutorial is shown below.
Get a good map, and a goodly number of times you’ll want a map of smaller or larger scale than the one you have. Murphy’s Law? This is probably why in the wonderful woooooooorrrrrrrrlllllld of Google Charts they have included …
- Geo Chart topographic map of the world or of regions
- Map Chart terrestrial/satellite map of your group of markers at a zoom level of your choosing
… and hope you can see that the latter can save the day for a Short Distance Trip (corner shop, anyone?!).
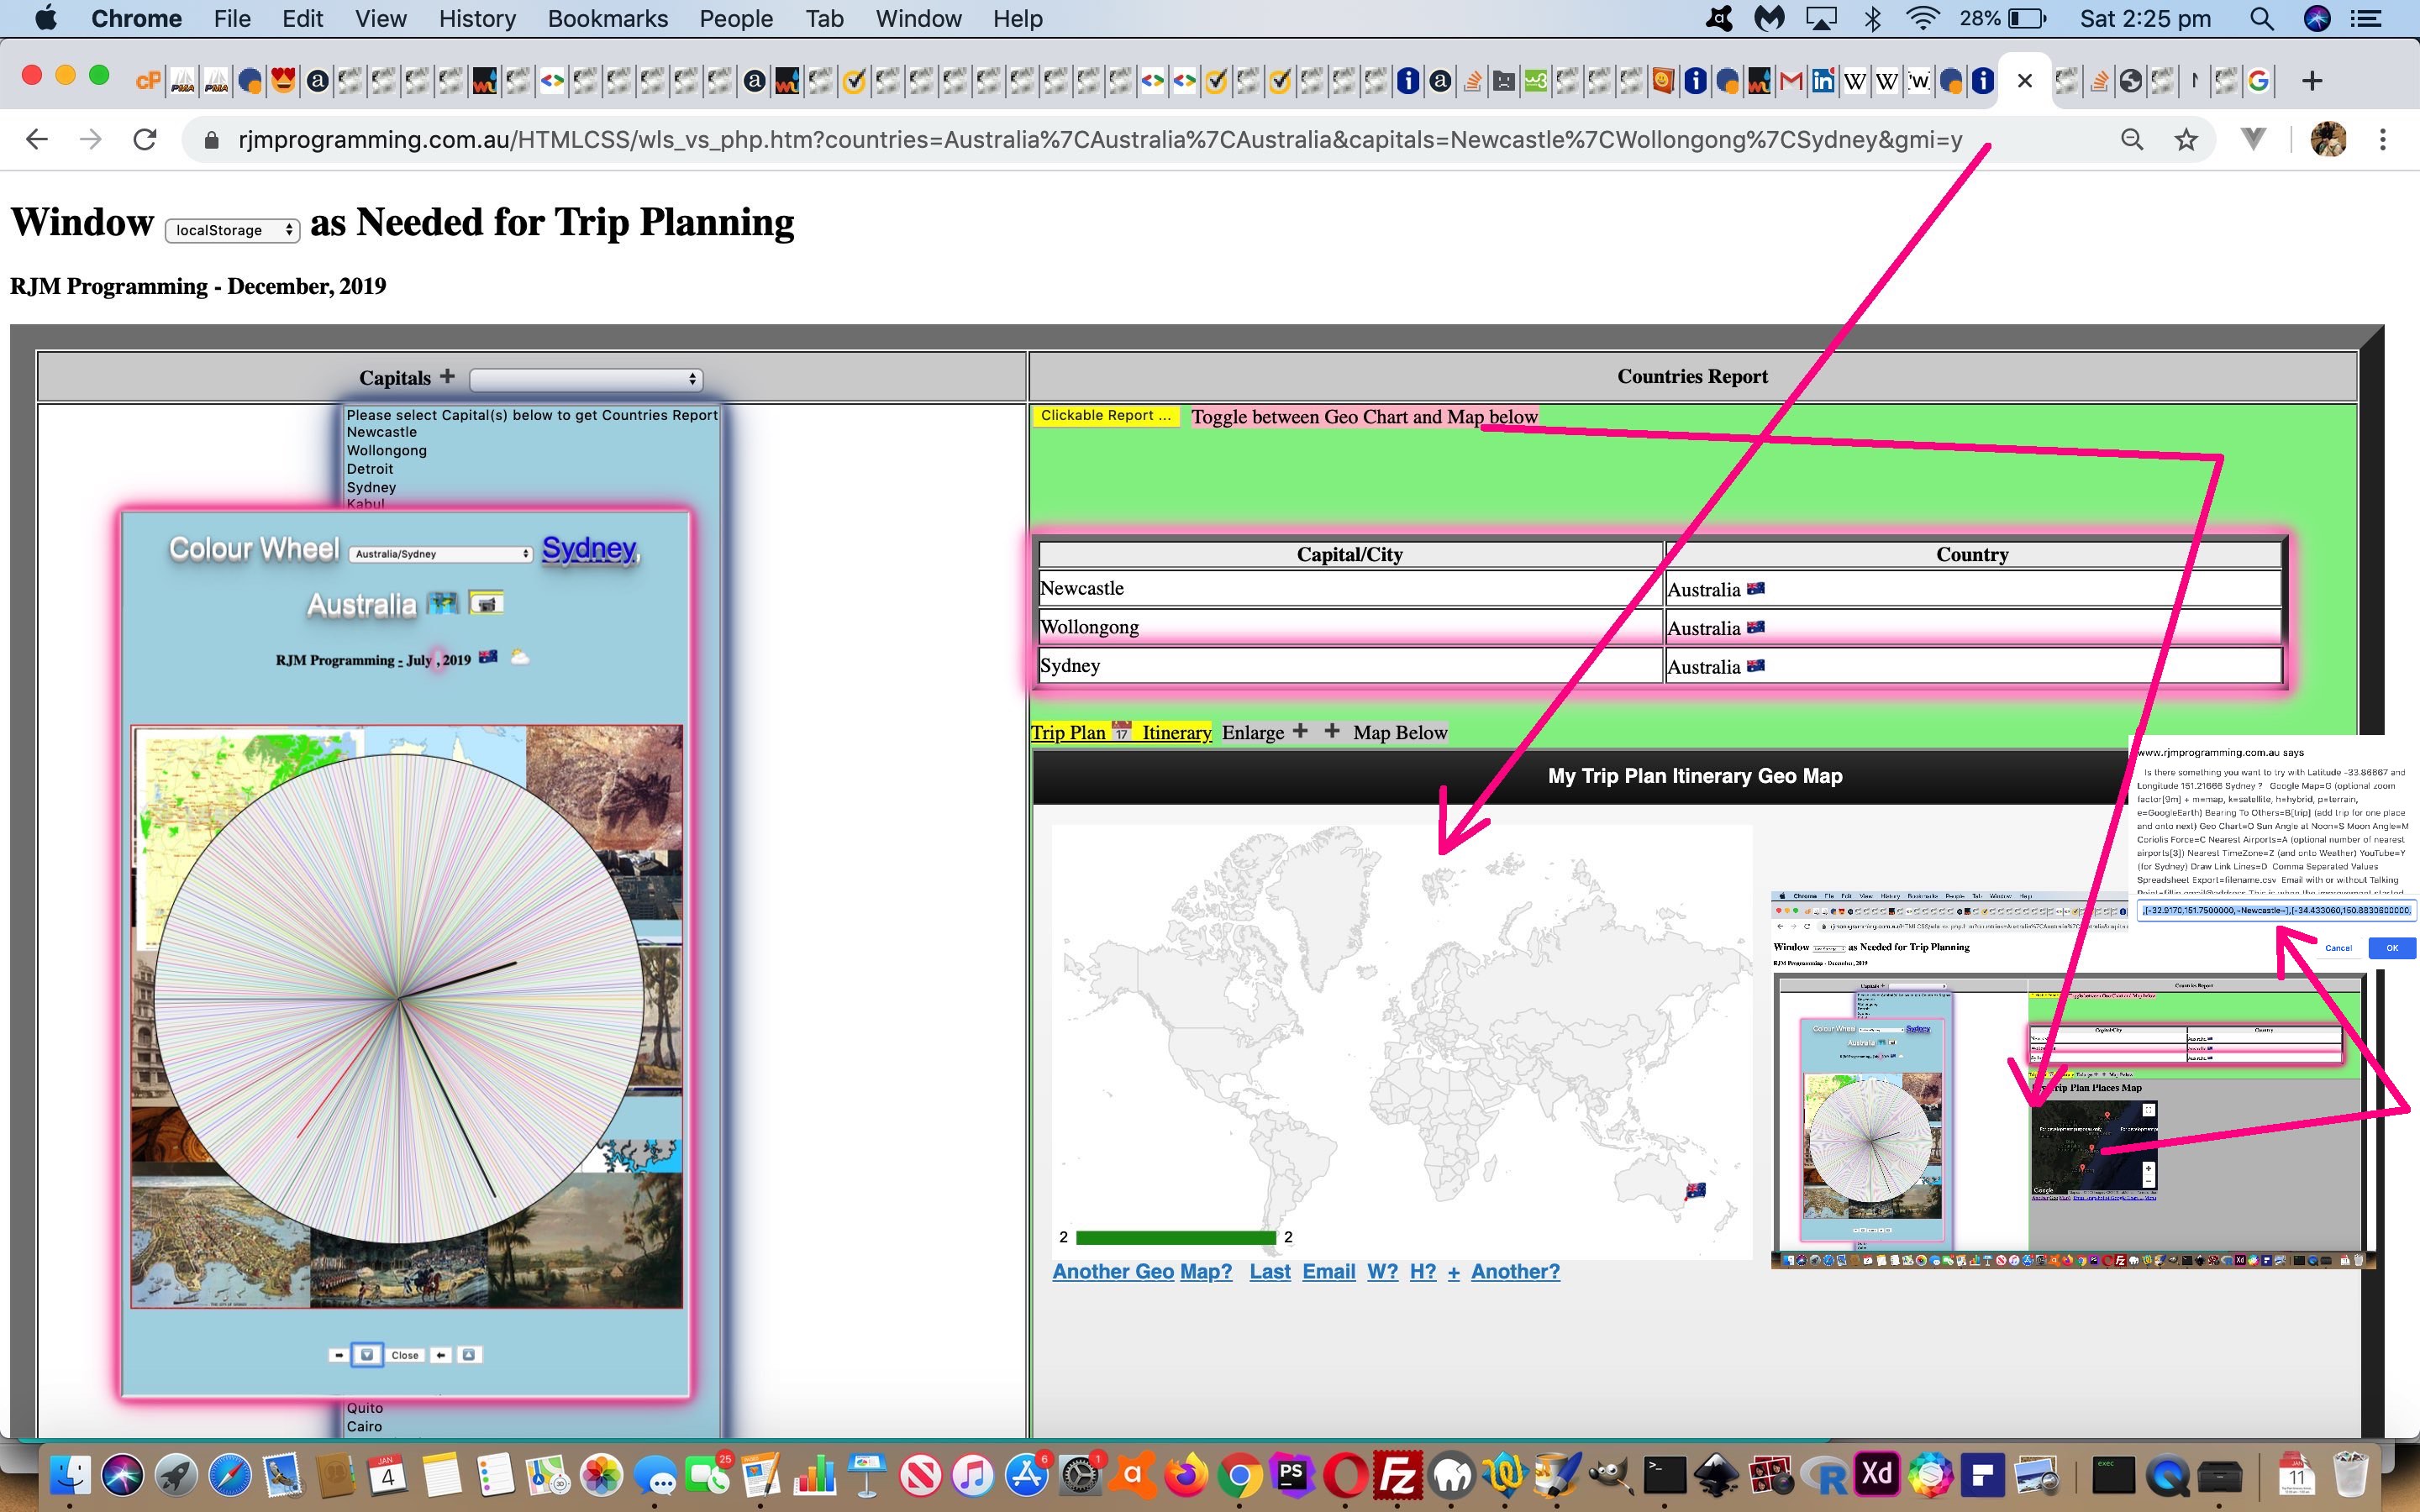
So we’ve added onto yesterday’s Window LocalStorage Client Versus Server Timeline Tutorial progress a new toggling button to view a scenario in either Google Chart scenario above.
You can see this integration work with our changed wls_vs_php.htm‘s Capital City Find Matching Country Report live run link supervising a tweaked geo_chart.php Geo Chart interfacer.
Previous relevant Window LocalStorage Client Versus Server Timeline Tutorial is shown below.
Up to yesterday’s Window LocalStorage Client Versus Server User Tutorial‘s progress, our Capital City Find Matching Country Report web application project was all about …
- where (and capital of “what”) … but we often seek out a way to add into the mix that 4th dimension …
- when (ie. time)
… and regarding the current project, a …
- where “map” … can interface with a …
- when “Trip Plan Itinerary”
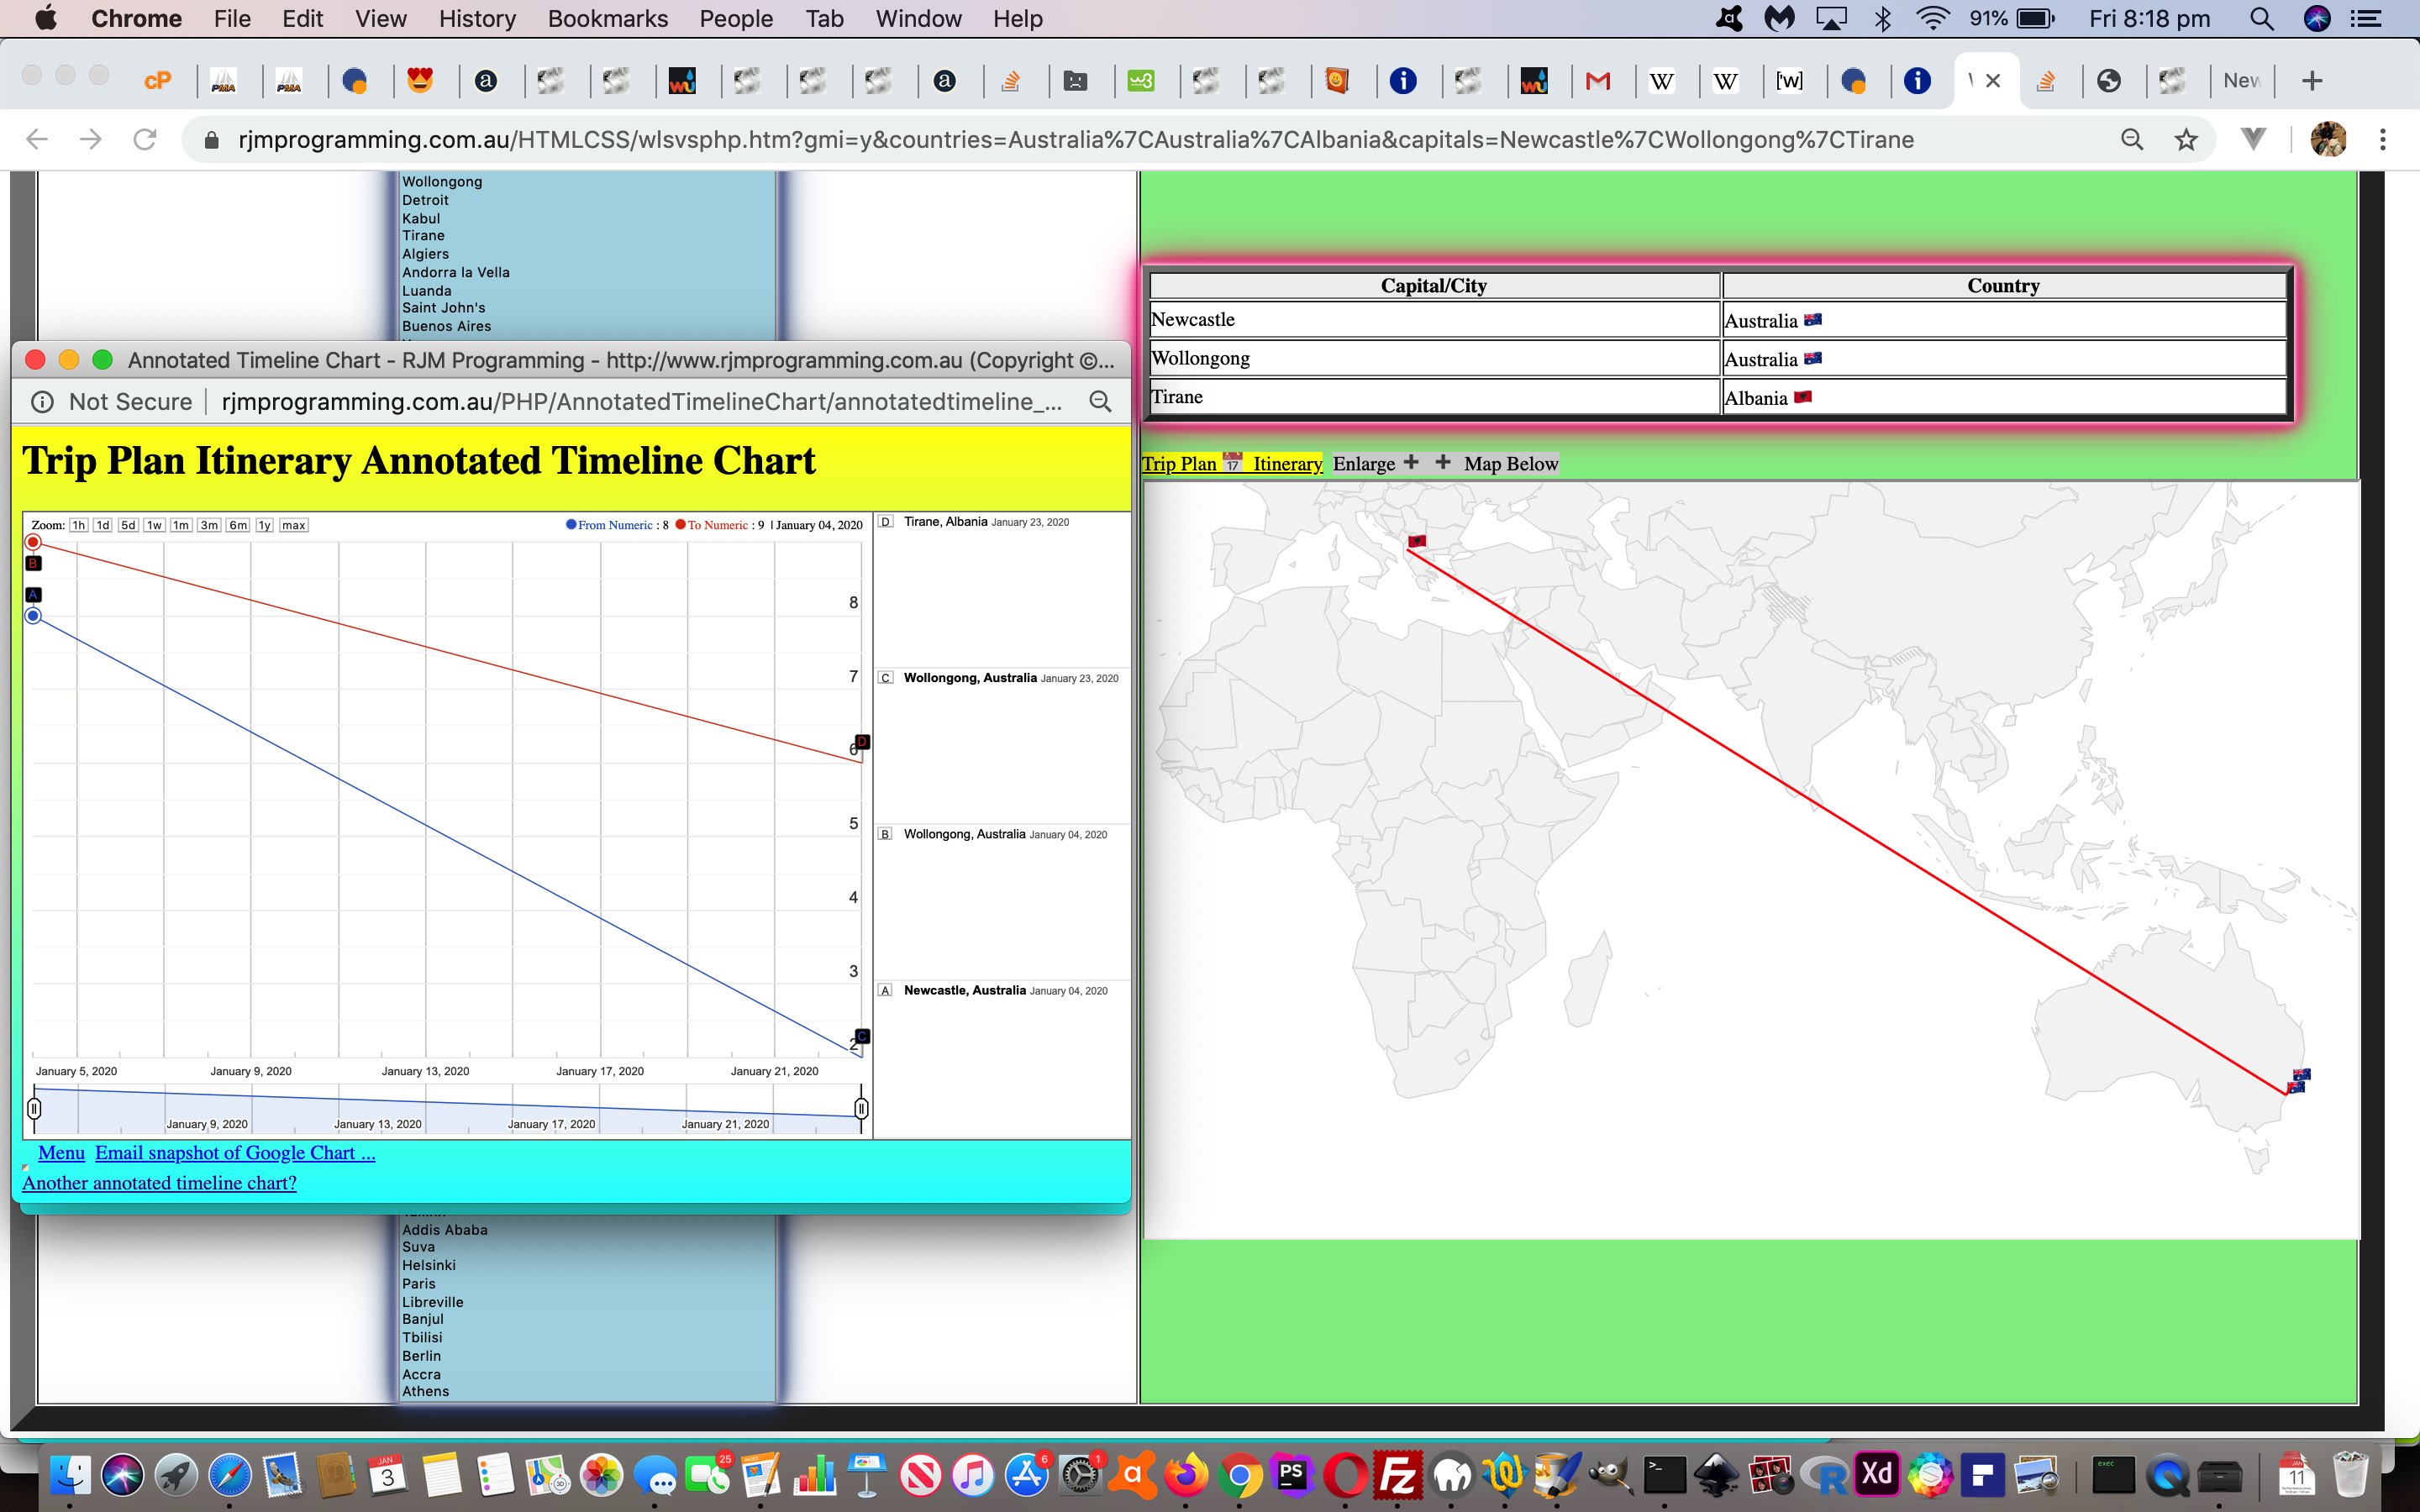
… and for this purpose, we’re going to interface to the excellent Google Charts Annotated Timeline Chart, thanks, because it combines links of “time” to “user annotations” in a timeline way, that similar way you might describe the qualities of a Trip, even before you’ve gone on that trip. We’ve also added it so that an unordered places list can be turned into a Trip Plan Itinerary at the click/touch of a new map 🗺 🗺 emoji button.
Again, see how these timeline amendments were achieved with our changed wls_vs_php.htm‘s Capital City Find Matching Country Report live run link and annotatedtimeline_chart.php which changed quite a lot.
Previous relevant Window LocalStorage Client Versus Server User Tutorial is shown below.
The inherent weakness with our current Capital City Find Matching Country Report web application project, to our minds, was that places of interest are not restricted to the Capital Cities of Countries, especially when “Trip Planning”. On the other hand, it would be impossible to cater for every “place” in the world. That is far too subjective for good web application applicability. What would be good though, is to allow in user defined …
Place name, Country name
… terms, the definitions of interest to a user. We can ask this …
- flagged by the click/touch of an emoji button … and …
- the interactive entry presented via a Javascript prompt window
. When thinking of data applicable to an individual, then that can be catered for by recording it in localStorage where it will be recalled on the next execution of that web application in the same web browser.
This, along with a Colour Wheel of the “nearest TimeZone place” onto the existing logic of yesterday’s Window SessionStorage Client Versus Server Order Tutorial progress could make for a more useful and practical tool for those Trip Planners out there!
See how this was achieved with our changed wls_vs_php.htm‘s Capital City Find Matching Country Report live run link.
Did you know?
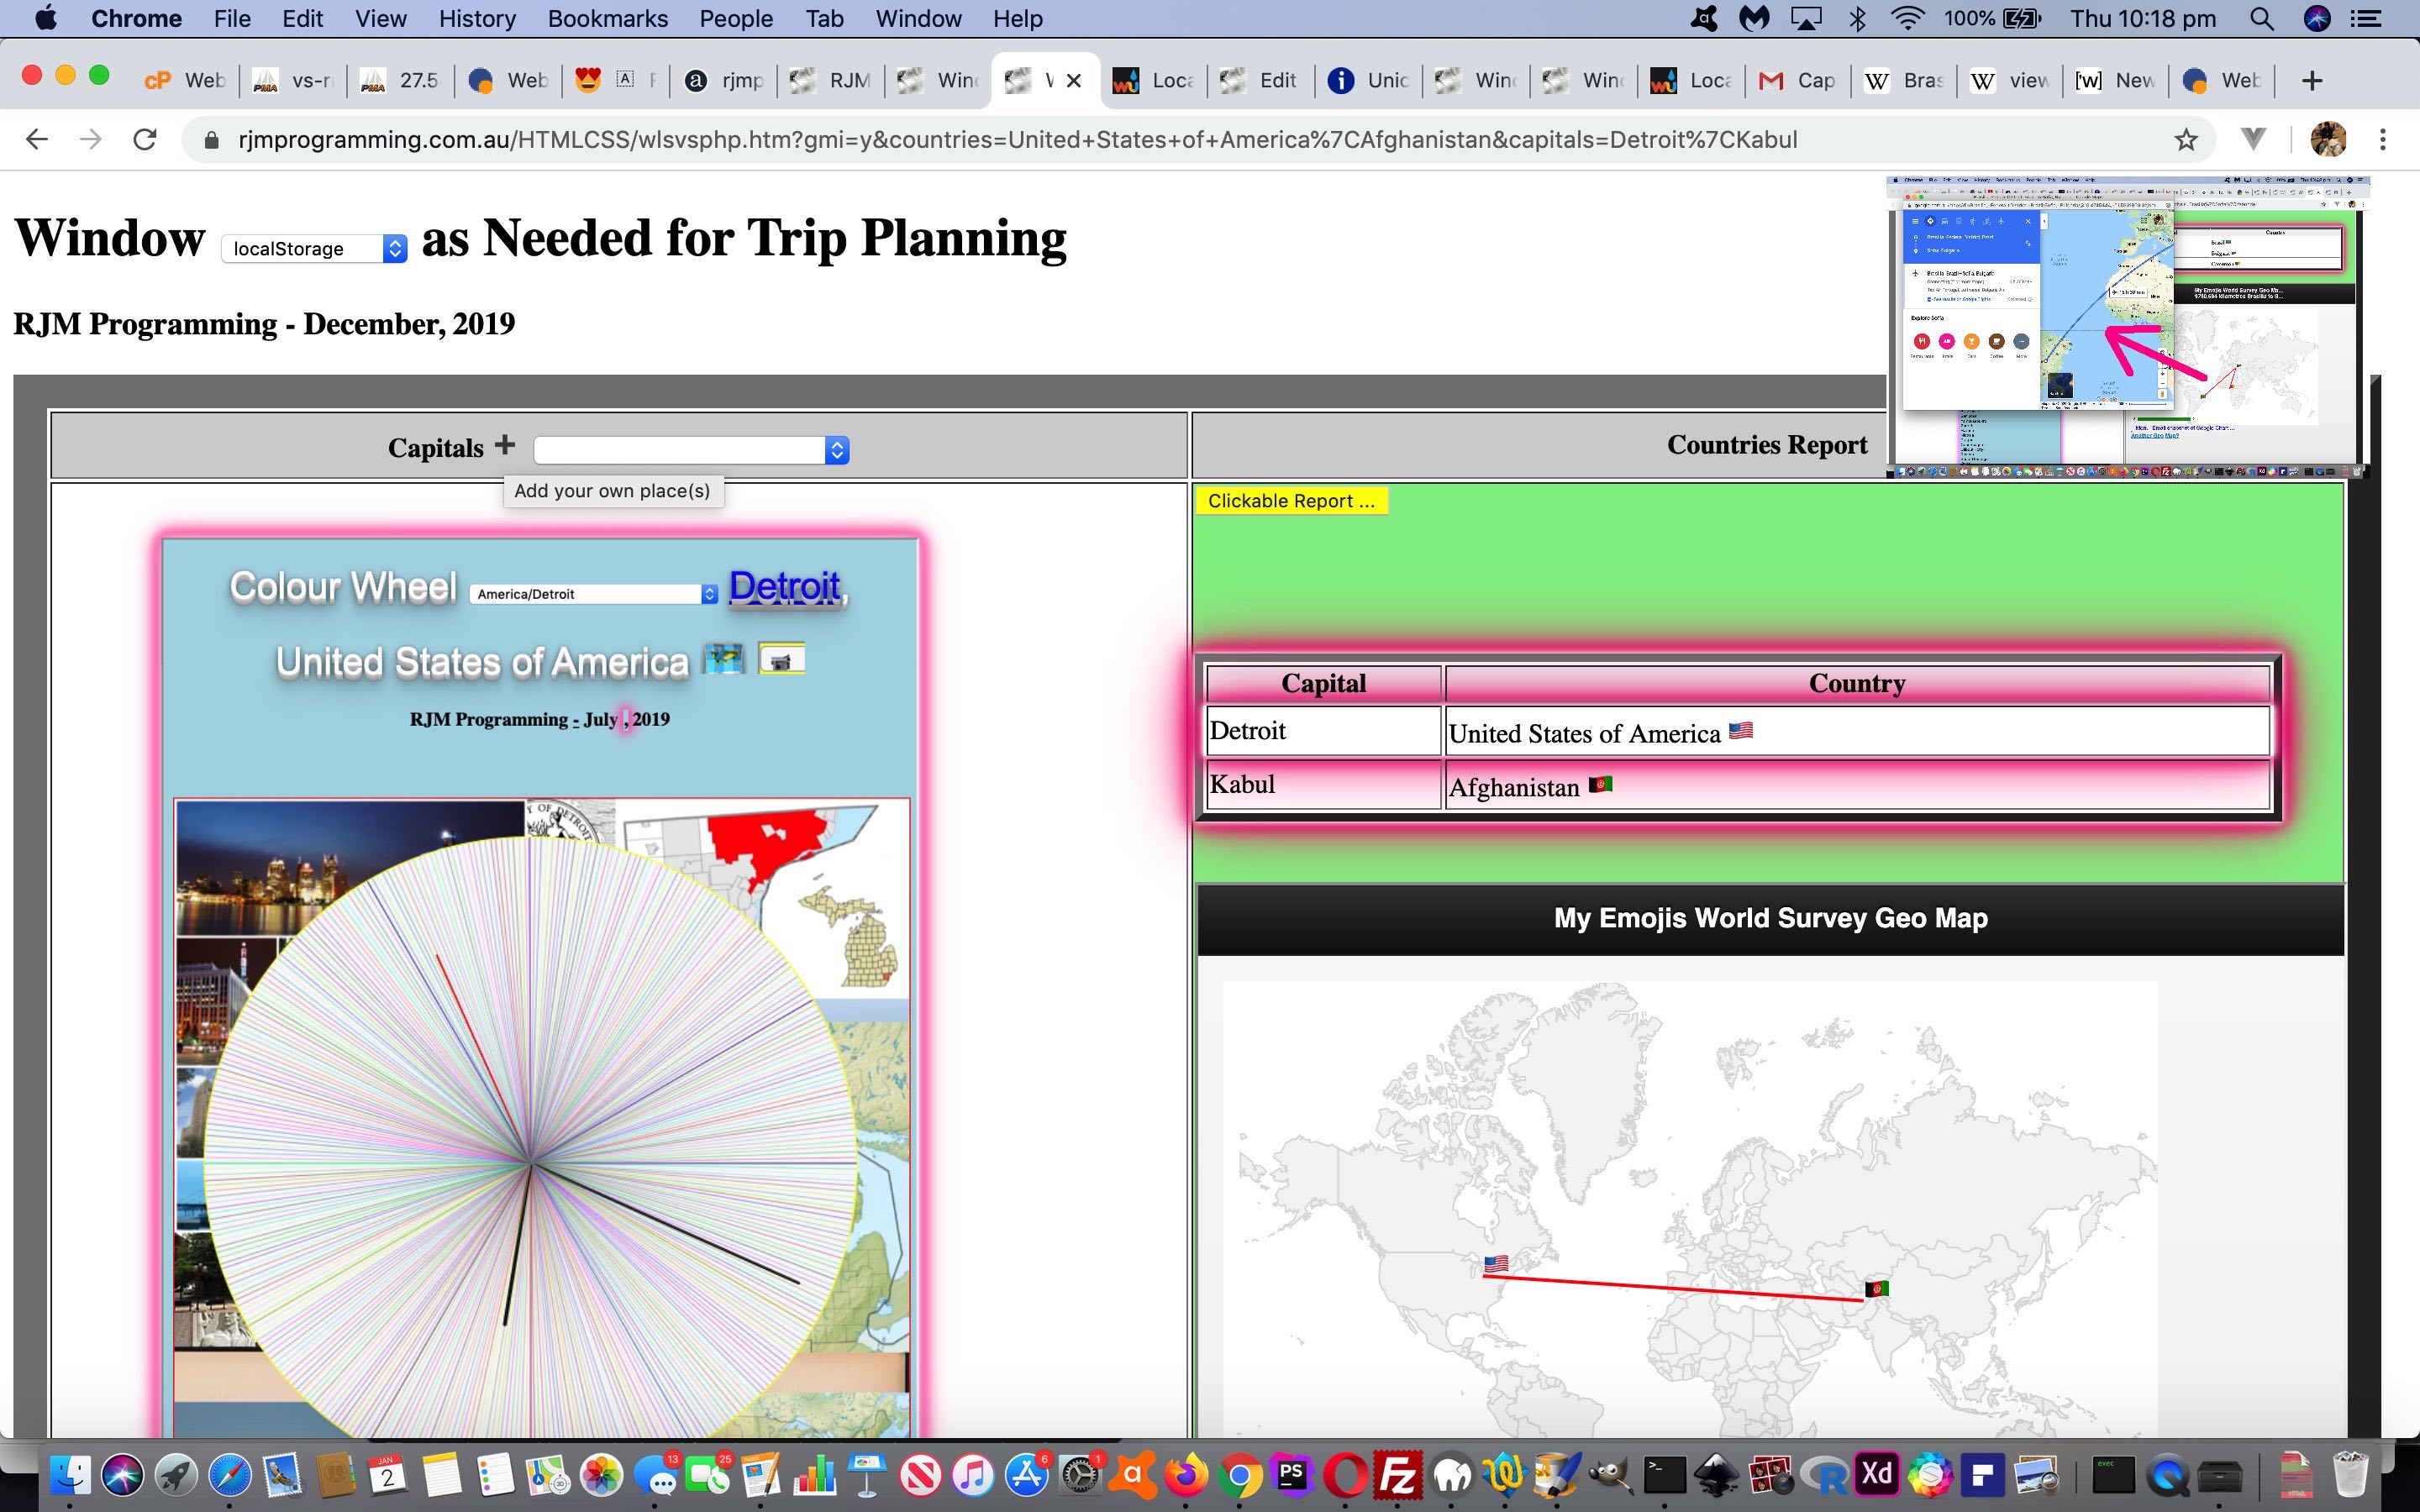
To click/touch one of those Google Chart Geo Chart lines between Emoji Flag Markers will show a new Google Maps directions web page with transport times and detail, as well as an inhouse crow fly distance of that trip leg, as shown up the top right of today’s tutorial picture.
Previous relevant Window SessionStorage Client Versus Server Order Tutorial is shown below.
If we are to honour our thoughts of being able to use our current Capital City Find Matching Country Report web application as a Trip Planner …
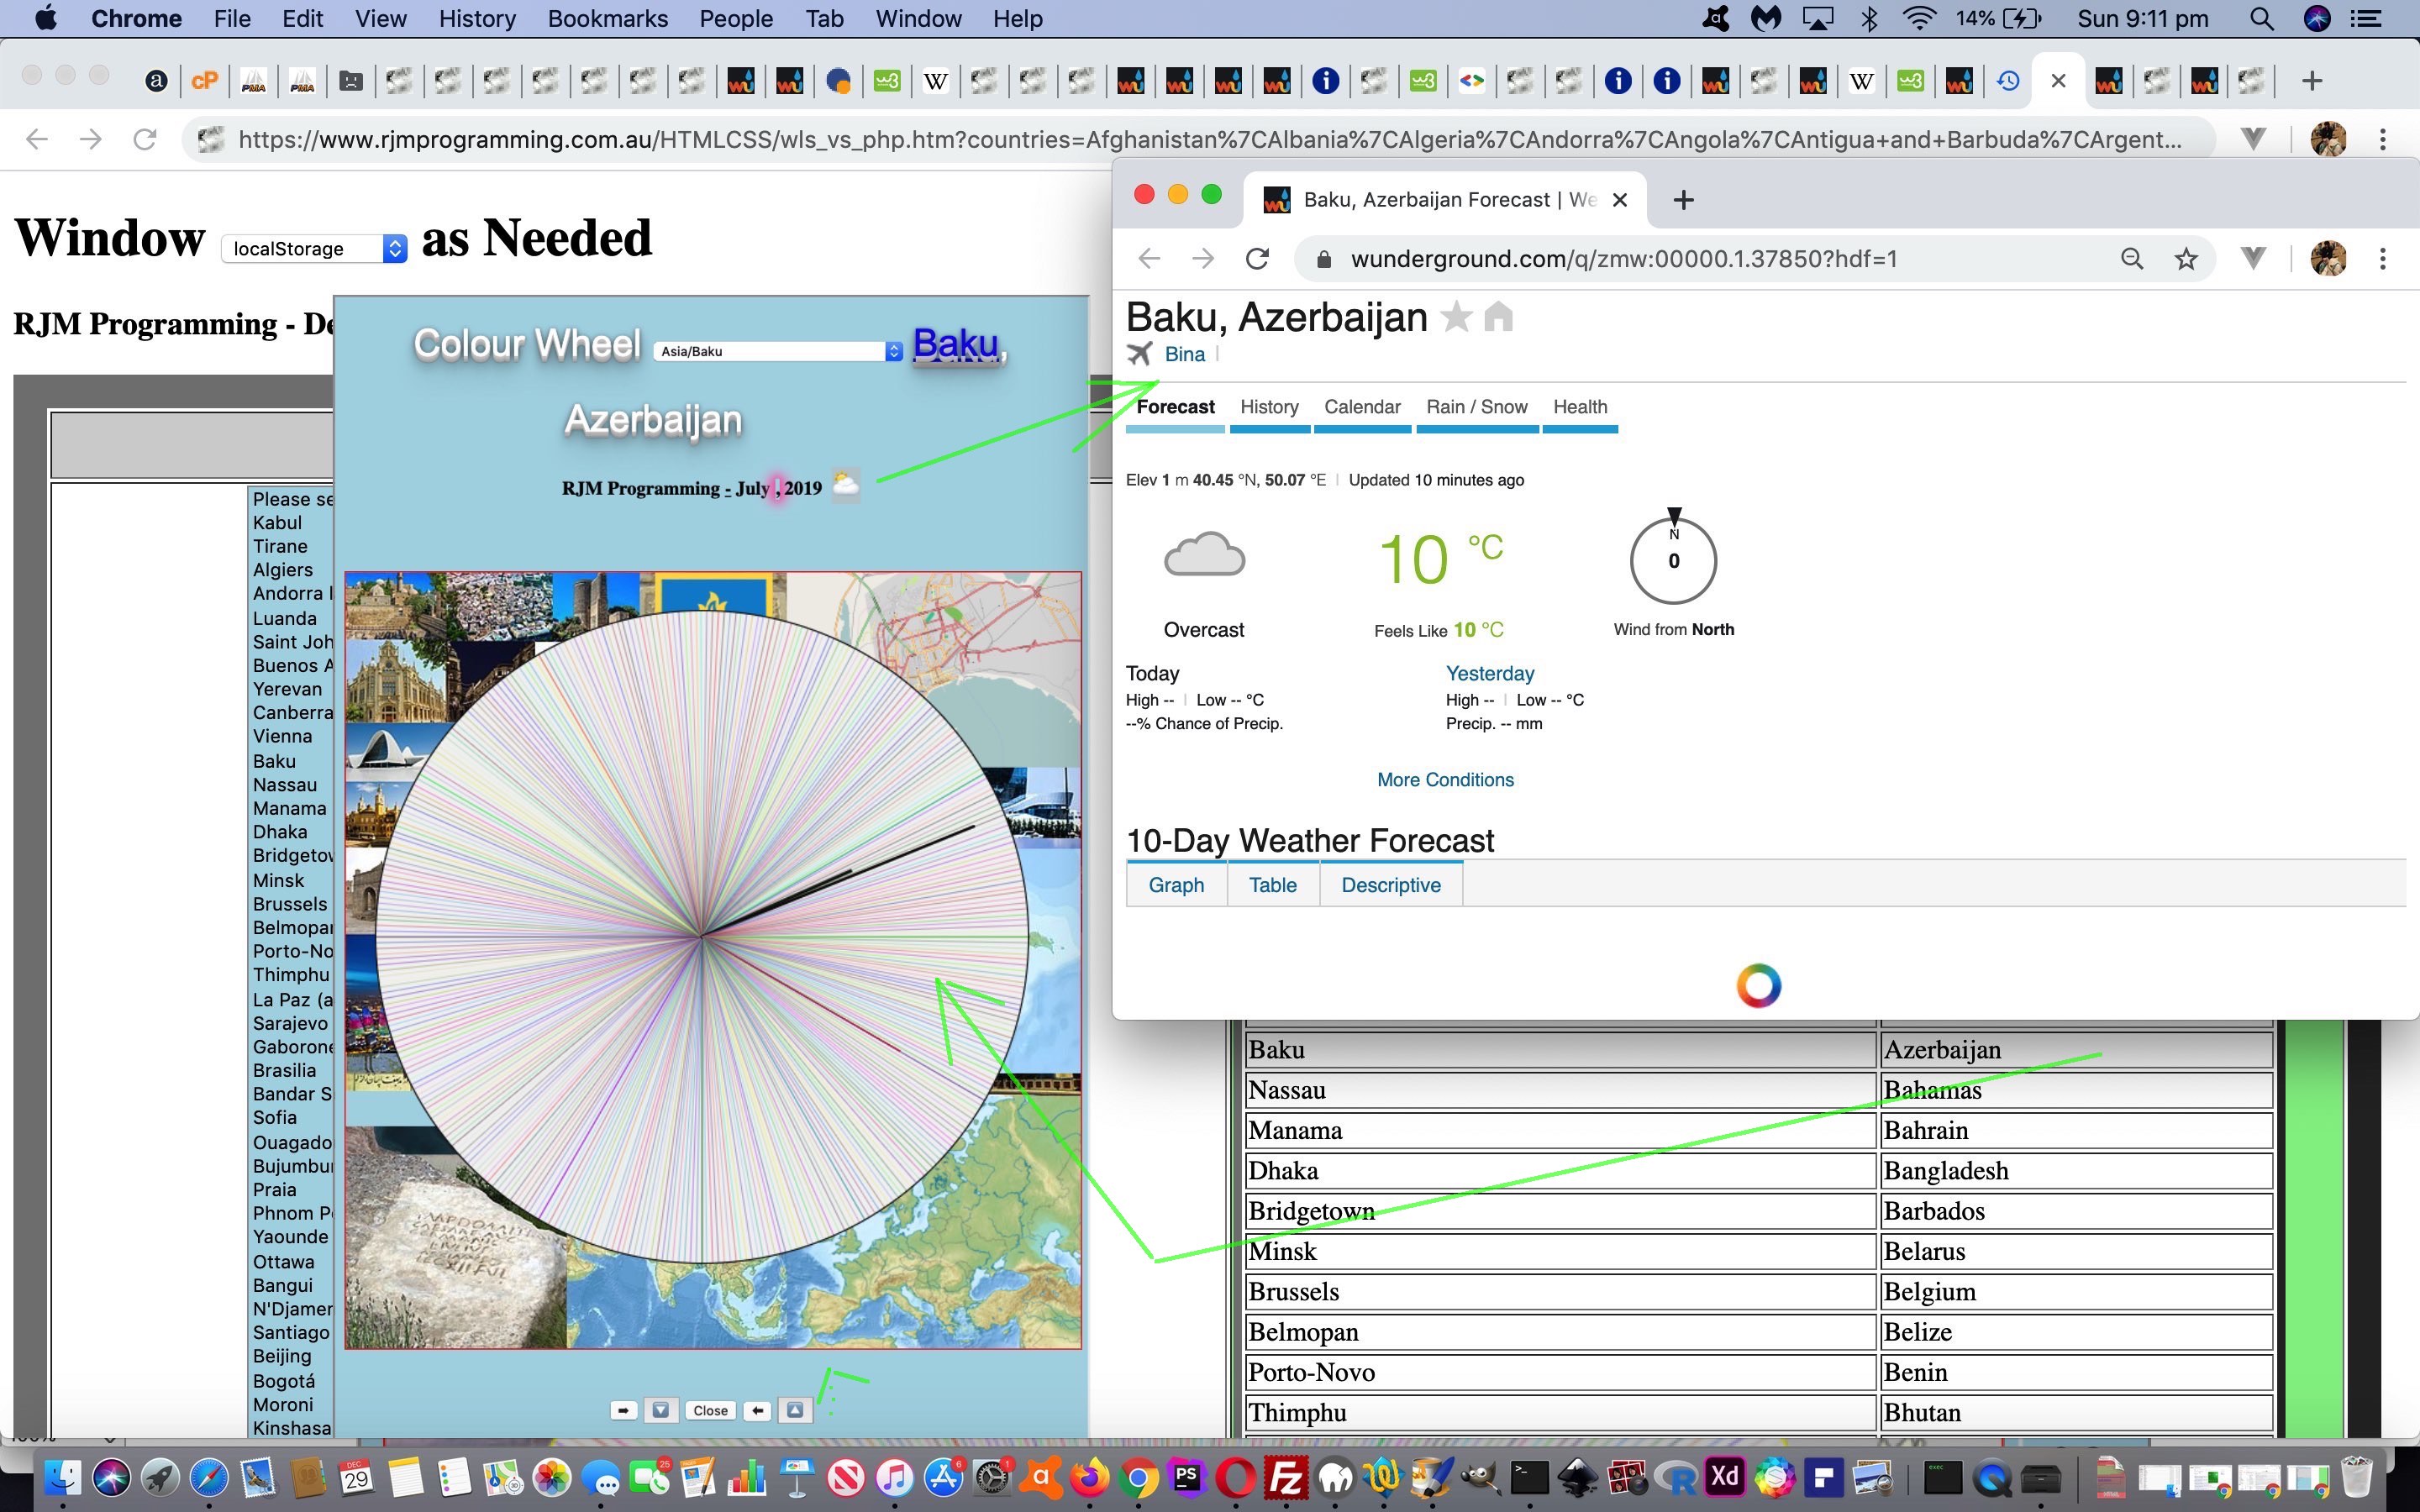
Our primary integration today is to (software) integrate the great Weather Underground and its great API service for autocomplete name searches for weather (and hurricane) information. Why bother? Well, can you not envisage a user using that Ajax functionality of yesterday’s Window SessionStorage Client Versus Server Ajax Tutorial as a trip planner, perhaps, or as a “checking up on relatives overseas” tool, perhaps? And not all the capital cities are timezone places, and so for some of those we can use Weather integration to still show apt online information when click/touching a Countries Report row. Speaking of this “row”, we make an improvement whereby on a first click of a right hand (Country) row cell, that cell is not initially a contenteditable=”true” one (that may frustrate showing the keyboard on mobile, when most likely it was the row touch intended), but then becomes a contenteditable=”true” cell henceforth.
… then yesterday’s Window SessionStorage Client Versus Server Flags Tutorial “progress to now” needs to take notice of a user’s order of multiple select (dropdown) element click/touching of Capital City option (sub)elements, just as we did with the recent User Controlled Dynamic Javascript YouTube Embedded API Ordered Tutorial‘s web application project to allow for a user ordered YouTube video playlist.
Because what is a Trip Planner without an ordered trip? Well, that is debatable, but what isn’t (debatable), is that there will be people in the world who appreciate the “mapping out” of a proposed Trip Planning Itinerary. What could we call on here? We can think of the Google Chart Geo Chart work around about the time of Google Geo Chart Co-ordinate Emojis Tutorial, when we started using …
- a world map … with …
- emoji markers … and optionally …
- joined up by straight lines
… an idea for a Trip Plan itinerary synopsis, perhaps?!
If you examined closely yesterday’s code changes you will have noticed our collecting of TimeZone Place geographical latitude and longitude information. Today, we start making use of that preparatory work with our changed wls_vs_php.htm‘s Capital City Find Matching Country Report live run link.
Stop Press
The “emoji markers” above (as of 2 January 2020) will be “country flags” (as per Window SessionStorage Client Versus Server Flags Tutorial ideas), as defined.
Previous relevant Window SessionStorage Client Versus Server Flags Tutorial is shown below.
Yes, there’s more to do onto yesterday’s Window SessionStorage Client Versus Server CSS Tutorial‘s Capital City Find Matching Country Report web application project, in our eyes. We have not even mentioned “Internationalization” as a concept up to now. In this line of thinking …
Did you know?
Emoji flags via ISO 2 character country codes are dead easy via Regional Indicator Symbol characters …
      var lri="ABCDEFGHIJKLMNOPQRSTUVWXYZ";

      var dri=["127462","127463","127464","127465","127466","127467","127468","127469","127470","127471","127472","127473","127474","127475","127476","127477","127478","127479","127480","127481","127482","127483","127484","127485","127486","127487"];


      var thiscc='AU'; // ISO 2 character countrycode for Australia

      var ccsuff='', ccchar=' ';

      for (var iccsuff=0; iccsuff<thiscc.length; iccsuff++) {

        ccchar=thiscc.substring(iccsuff, eval(1 + eval('' + iccsuff))).toUpperCase();

        ccsuff+='&#' + dri[eval('' + lri.indexOf(ccchar))] + ';';

      }

      document.getElementById('lastflag').innerHTML=ccsuff;
… to result in (via <span style=font-size:64px;>🇦🇺</span>) …
🇦🇺
… providing interest and general translatability to the changed wls_vs_php.htm‘s Capital City Find Matching Country Report live run link.
Previous relevant Window SessionStorage Client Versus Server CSS Tutorial is shown below.
Further to yesterday’s Window SessionStorage Client Versus Server Integration Tutorial we have a two pronged improvements set for you today with our current Capital City Find Matching Country Report web application project …
- CSS styling changes … and …
- additional functionality for Email and SMS links back to our current Capital City Find Matching Country Report web application project (to complete the cycle)
We use several modes of CSS application (the first and last of particular relevance to today’s “highlighting of workflow” improvements) …
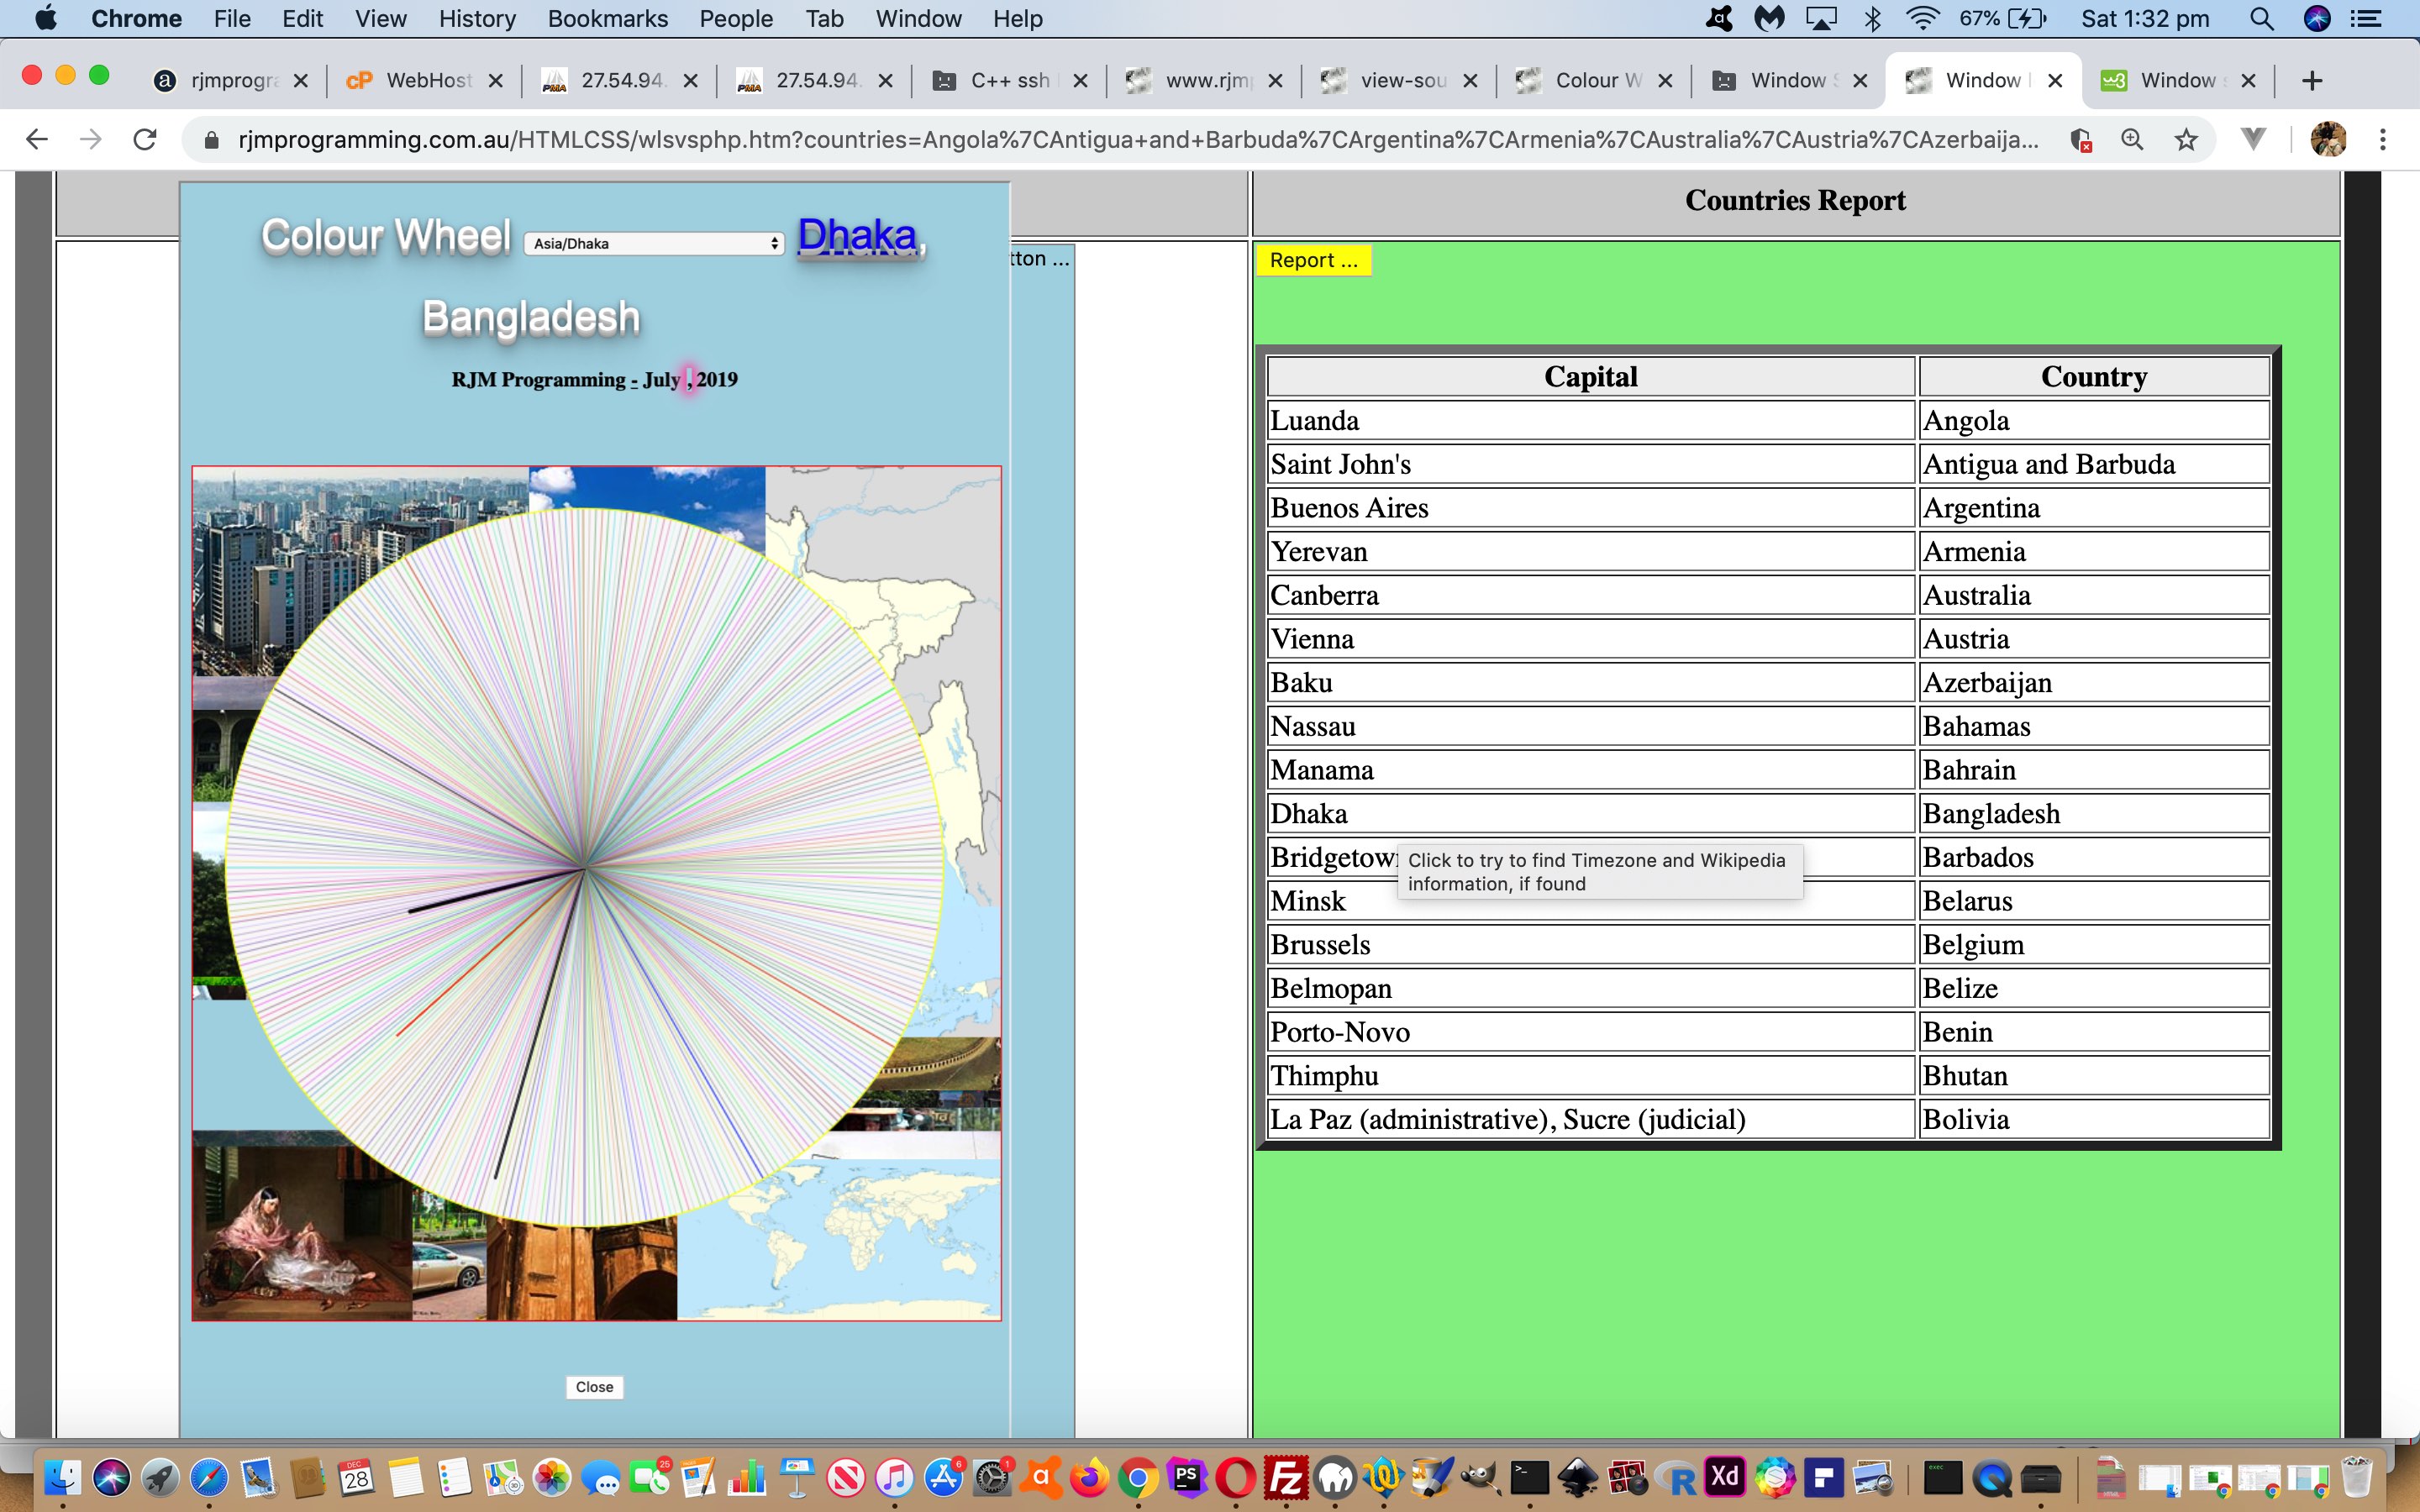
- “static” internal CSS coding within the changed wls_vs_php.htm‘s Capital City Find Matching Country Report live run link’s new CSS and linking improvements, which caused the changed colour_wheel.html‘s colour wheel (at this live run link) to be affected (by integrations “up”, opening up the Google Maps and YouTube interfacing emoji buttons there)
- “static” internal HTML “style” attribute styling
- “dynamic” Javascript DOM HTML “style” attribute changes
- “dynamic” Javascript DOM “class” modifications to dovetail with the “static” internal CSS coding as above
… the “static” measures often helping to highlight the web application’s main workflow of user interaction and the “dynamic” measures helping to alert the user as to where to proceed with their “workflow”.
In terms of CSS styling work …
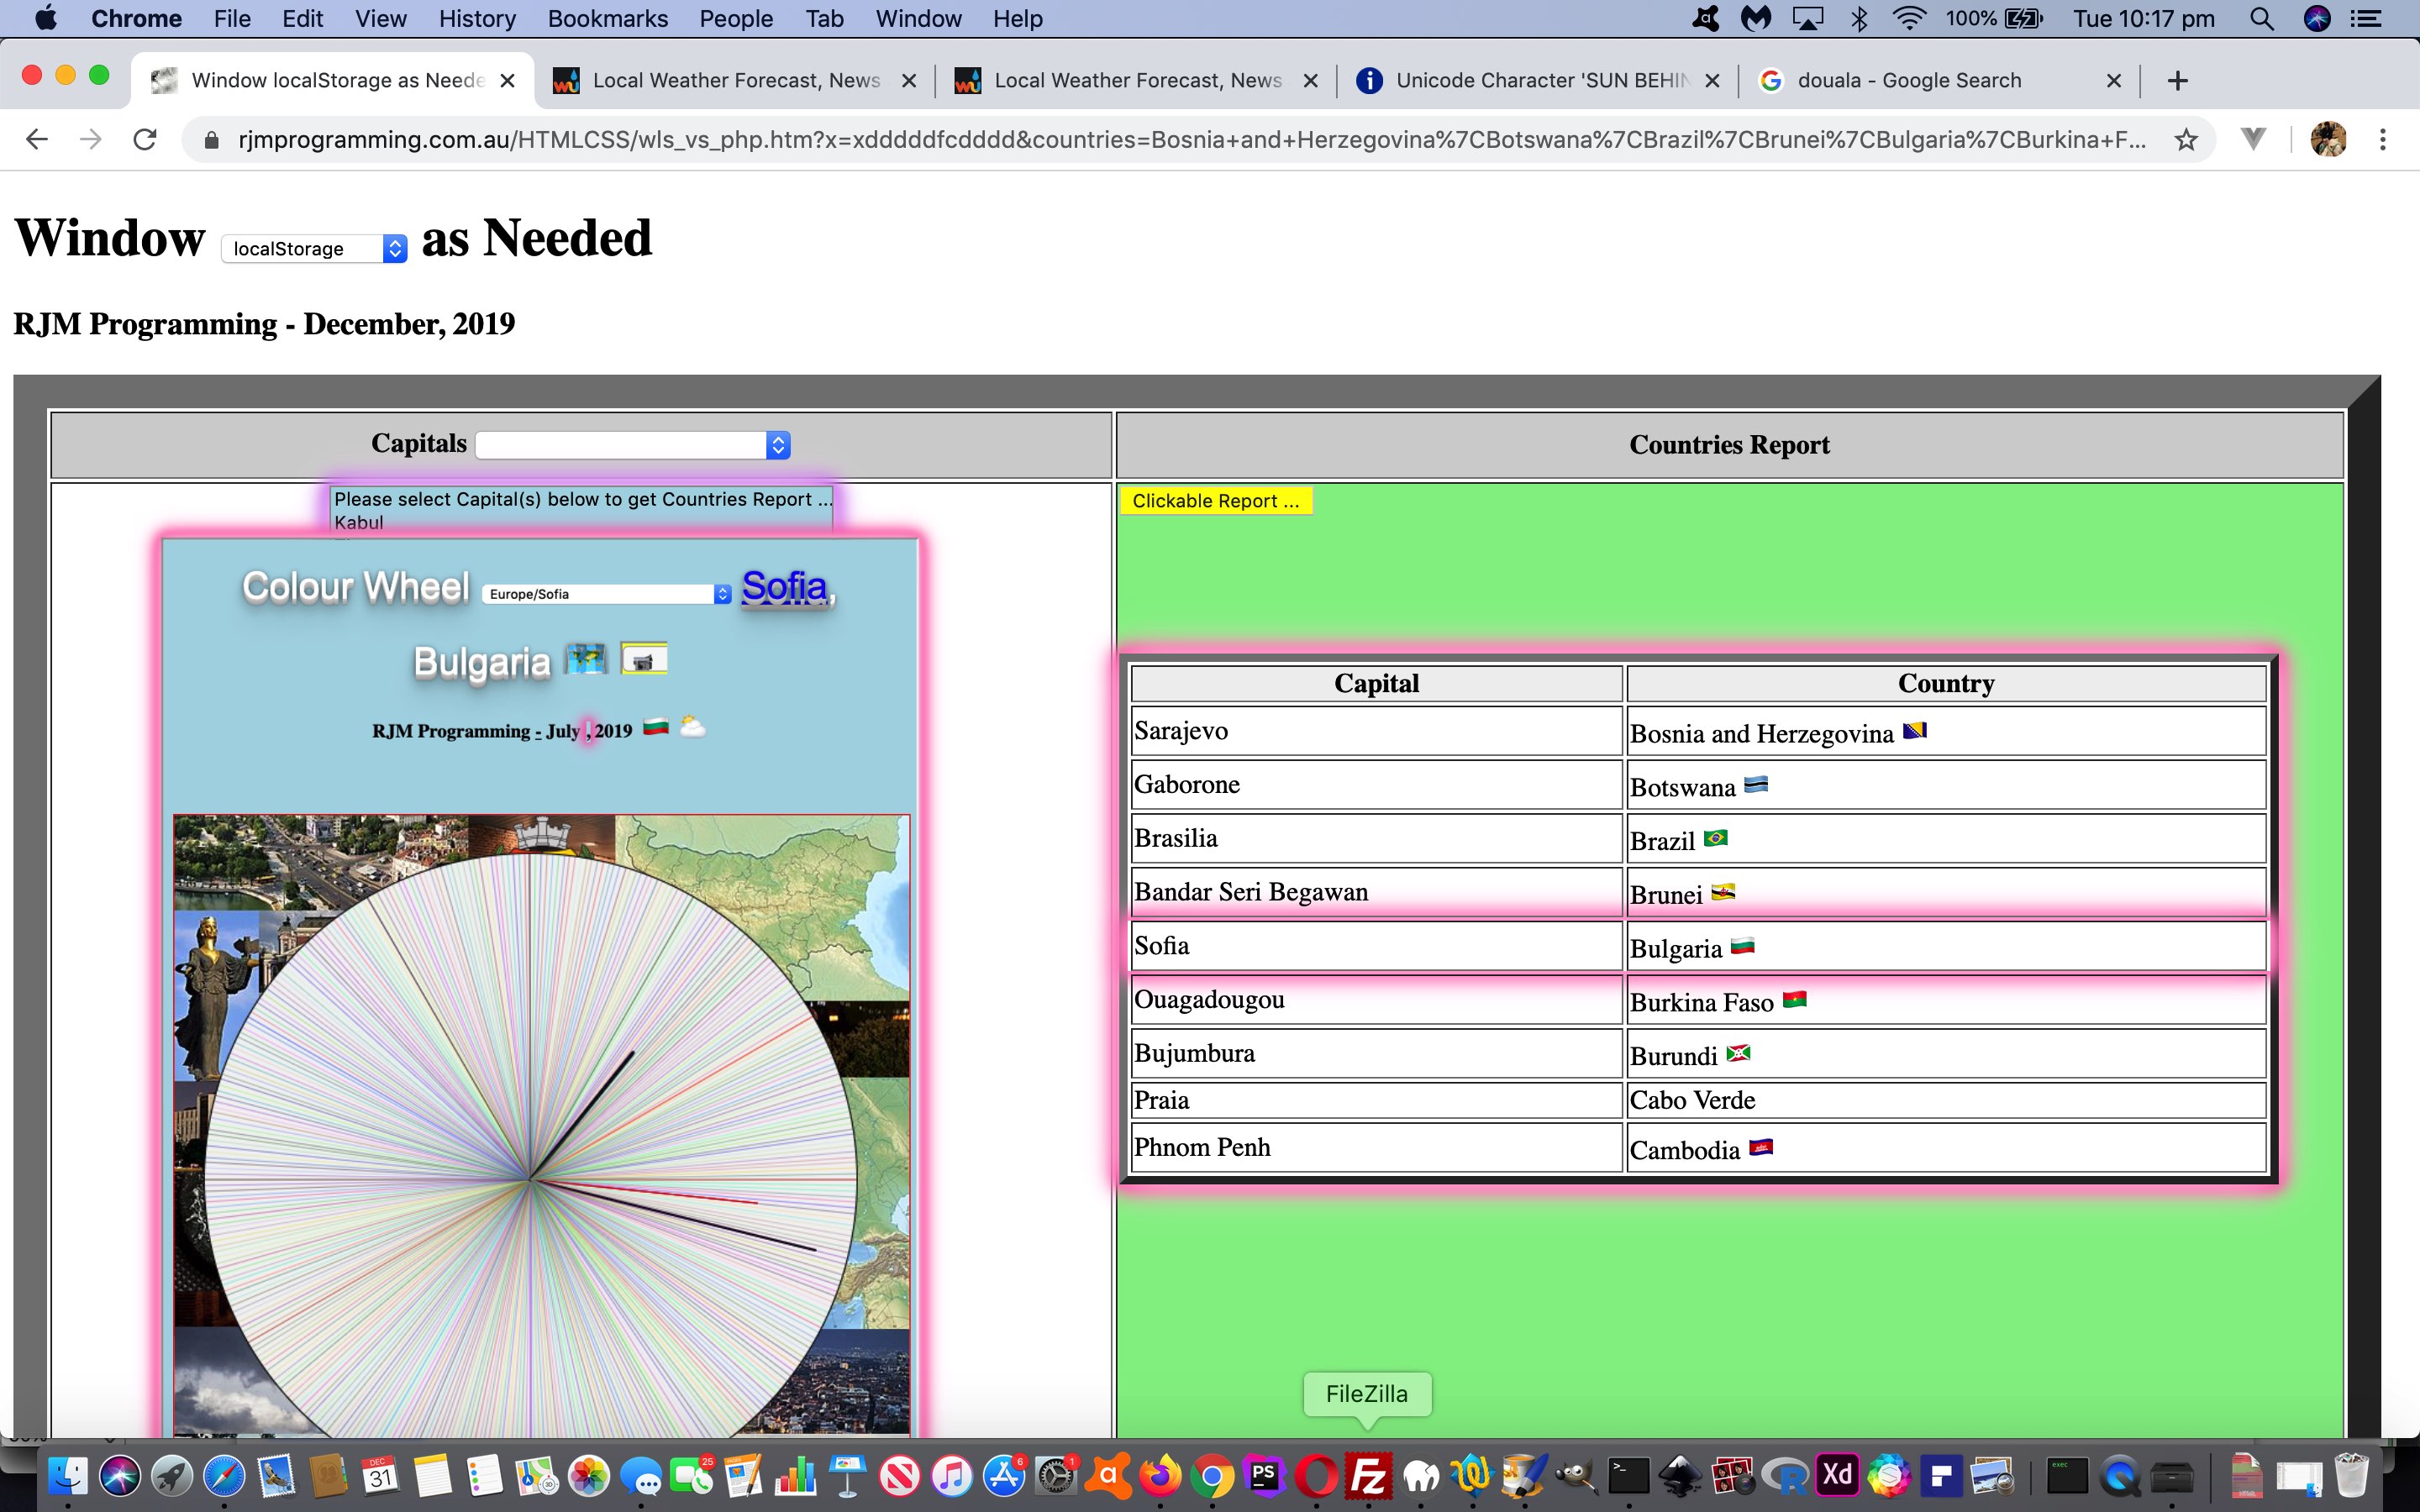
- for non-mobile platforms we allow for more columns to be applied to our Capitals select (dropdown) element (in order to reduce some user scrolling, as does our new additional A-Z letter basis sorting functionality) as per … the “dynamic” Javascript DOM “class” modifications …
if (!navigator.userAgent.match(/Android|BlackBerry|iPhone|iPad|iPod|Opera Mini|IEMobile/i)) {

    document.getElementById('lefttd').className='lefttd';

}
… dovetailing with the “static” internal CSS coding …
<style>

.lefttd {

  column-count: 4;

  max-height: 35%;

  vertical-align: top;

  max-width: 70%;

  font-size: 8px;

  background-color: rgba(205,205,205,0.5);

  background-image: -webkit-gradient(

  linear,

  right bottom,

  left top,

  color-stop(0, rgba(205, 205, 205, 0.8)),

  color-stop(0.50, rgba(255, 255, 0, 0.2))

  );

  background-image: -o-linear-gradient(left top, rgba(205, 205, 205, 1) 0%, rgba(255, 255, 0, 0.2) 50%);

  background-image: -moz-linear-gradient(left top, rgba(205, 205, 205, 1) 0%, rgba(255, 255, 0, 0.2) 50%);

  background-image: -webkit-linear-gradient(left top, rgba(205, 205, 205, 1) 0%, rgba(255, 255, 0, 0.2) 50%);

  background-image: -ms-linear-gradient(left top, rgba(205, 205, 205, 1) 0%, rgba(255, 255, 0, 0.2) 50%);

  background-image: linear-gradient(to left top, rgba(205, 205, 205, 1) 0%, rgba(255, 255, 0, 0.2) 50%);

}

</style>
… and please note that around here at RJM Programming we have a “far from hard and fast rule” (but a rule regardless) regarding HTML element ID and class attributes that they concern (and (usually) be compartmentalised into) Javascript (DOM) manipulations and CSS styling issues respectively … and add a linear-gradient background to the table cell when expecting the initial user interaction on non-mobile platforms - a “dynamic” Javascript DOM “class” modification … document.getElementById(‘myrepsb’).className=’dglow’; … is made to the “Report…” button at the Capitals select (dropdown) onfocusout event so as to highlight (with “glow” inspired styling) where user interaction may flow to
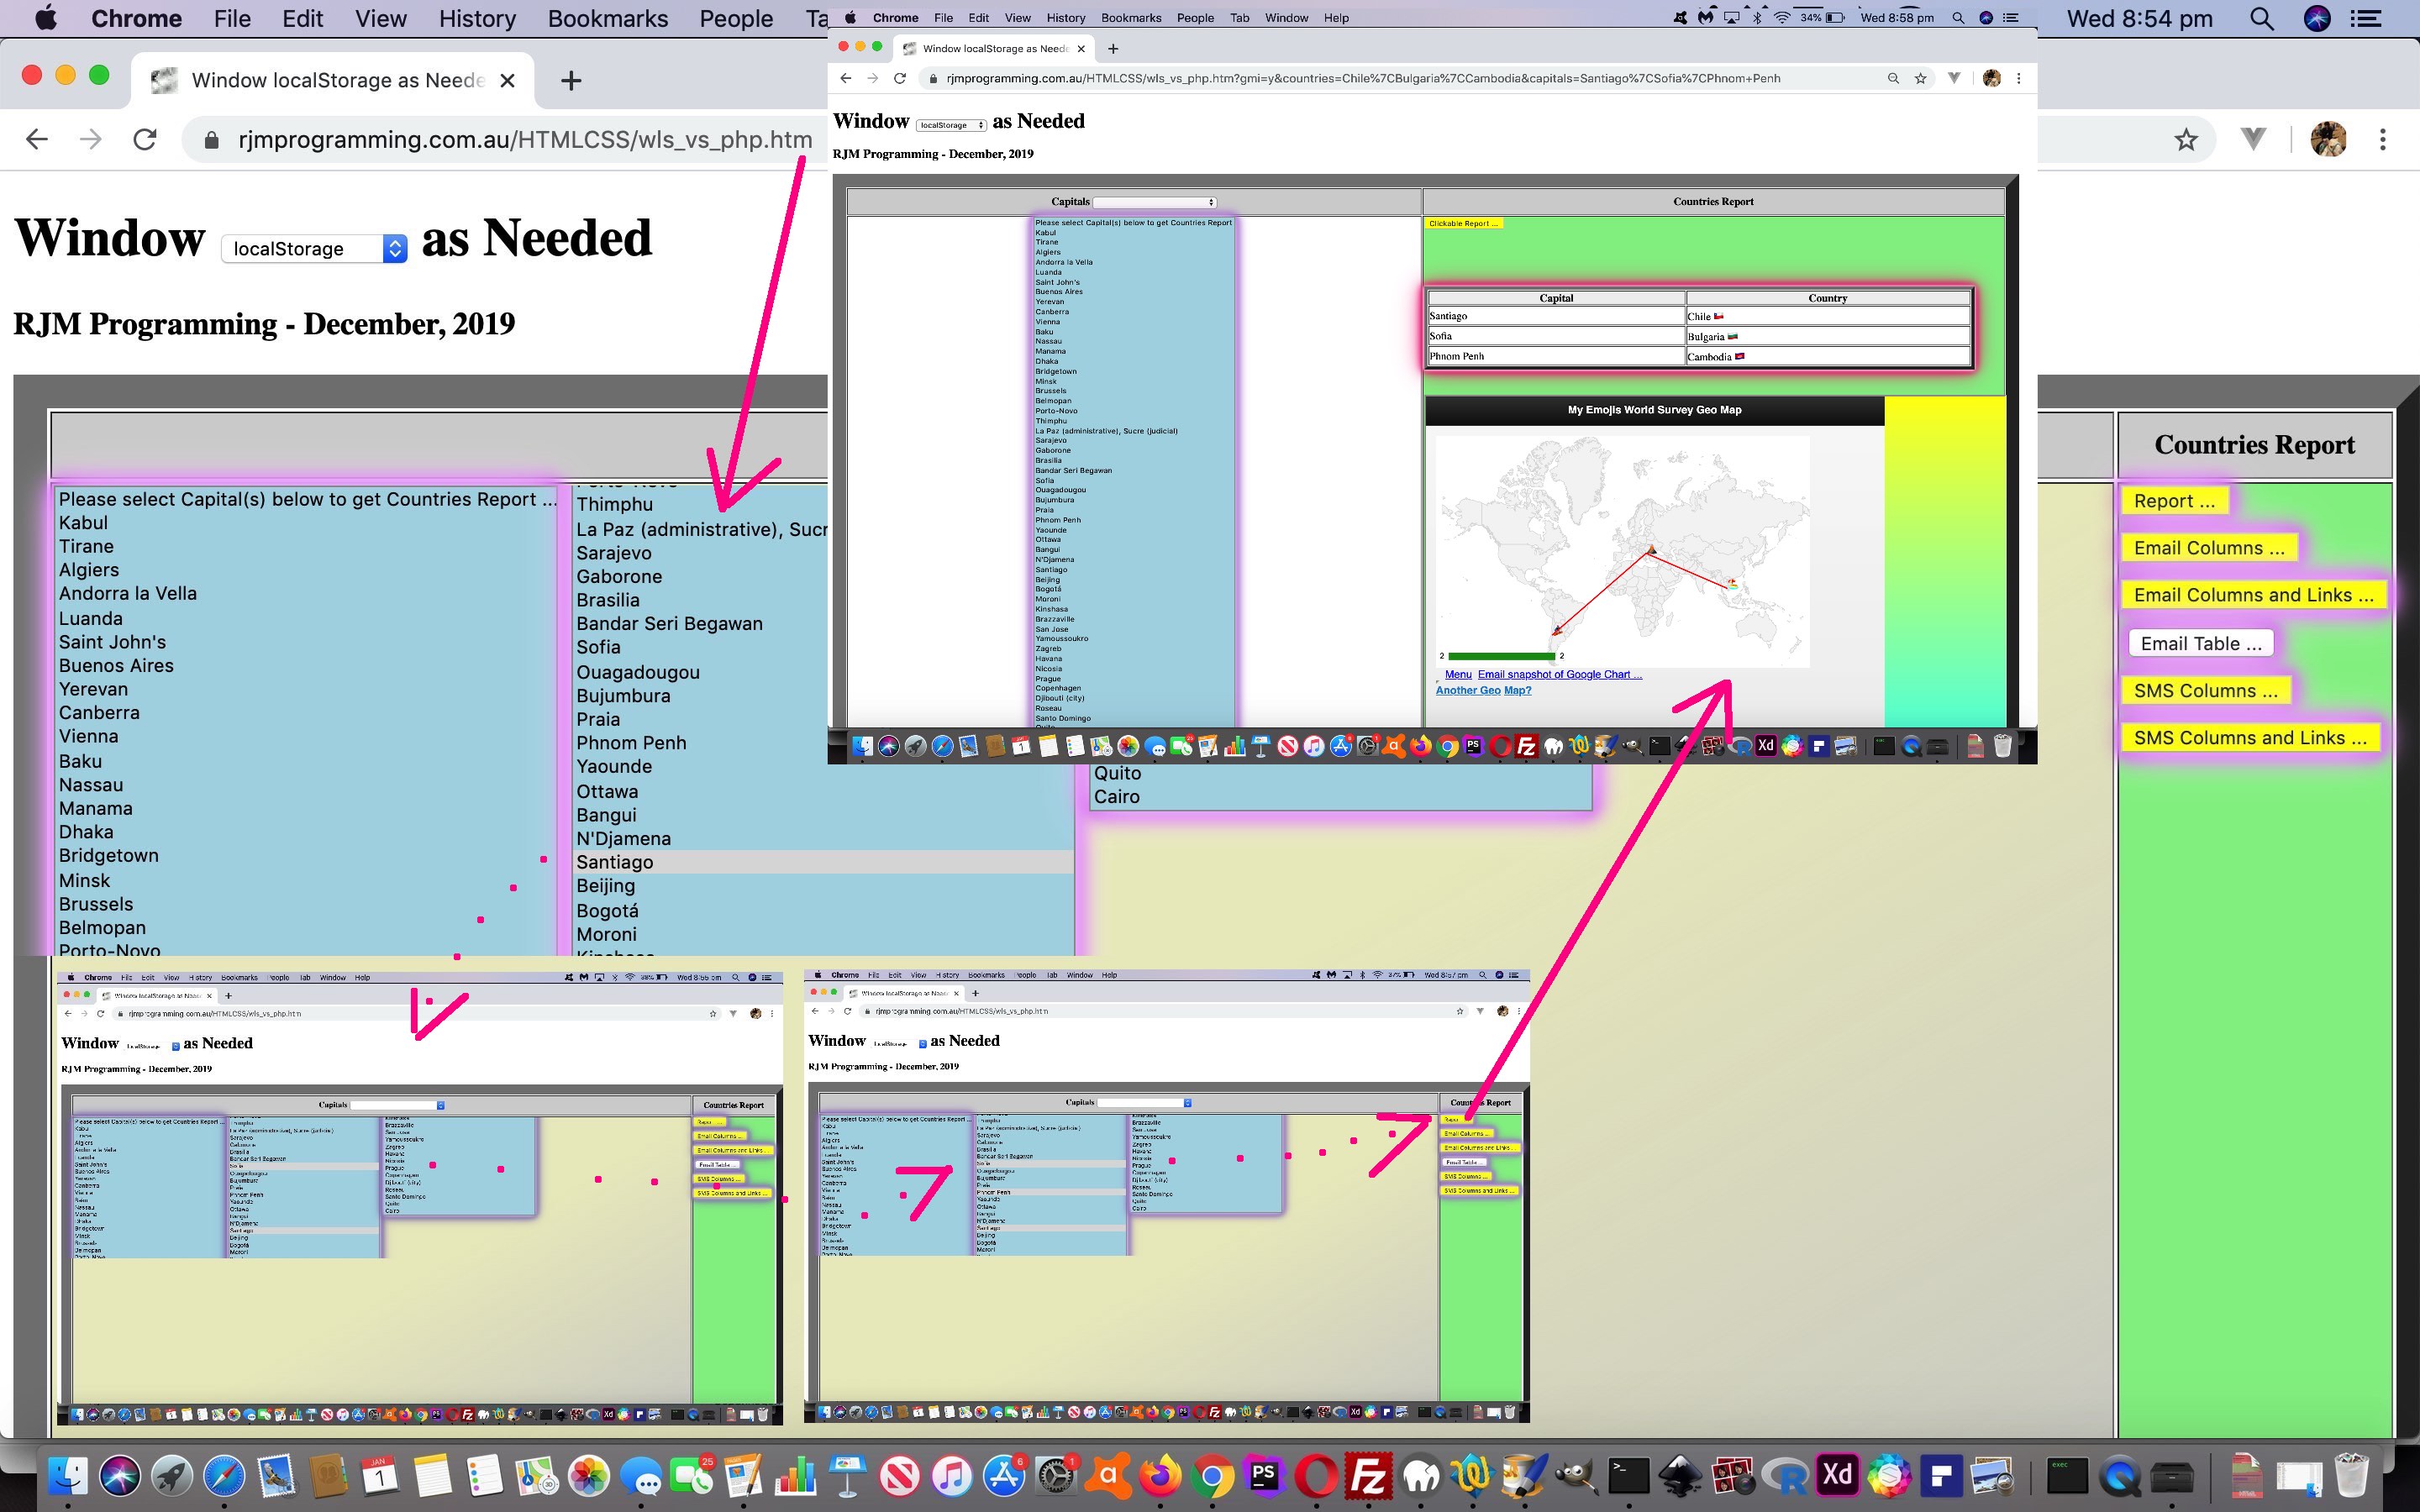
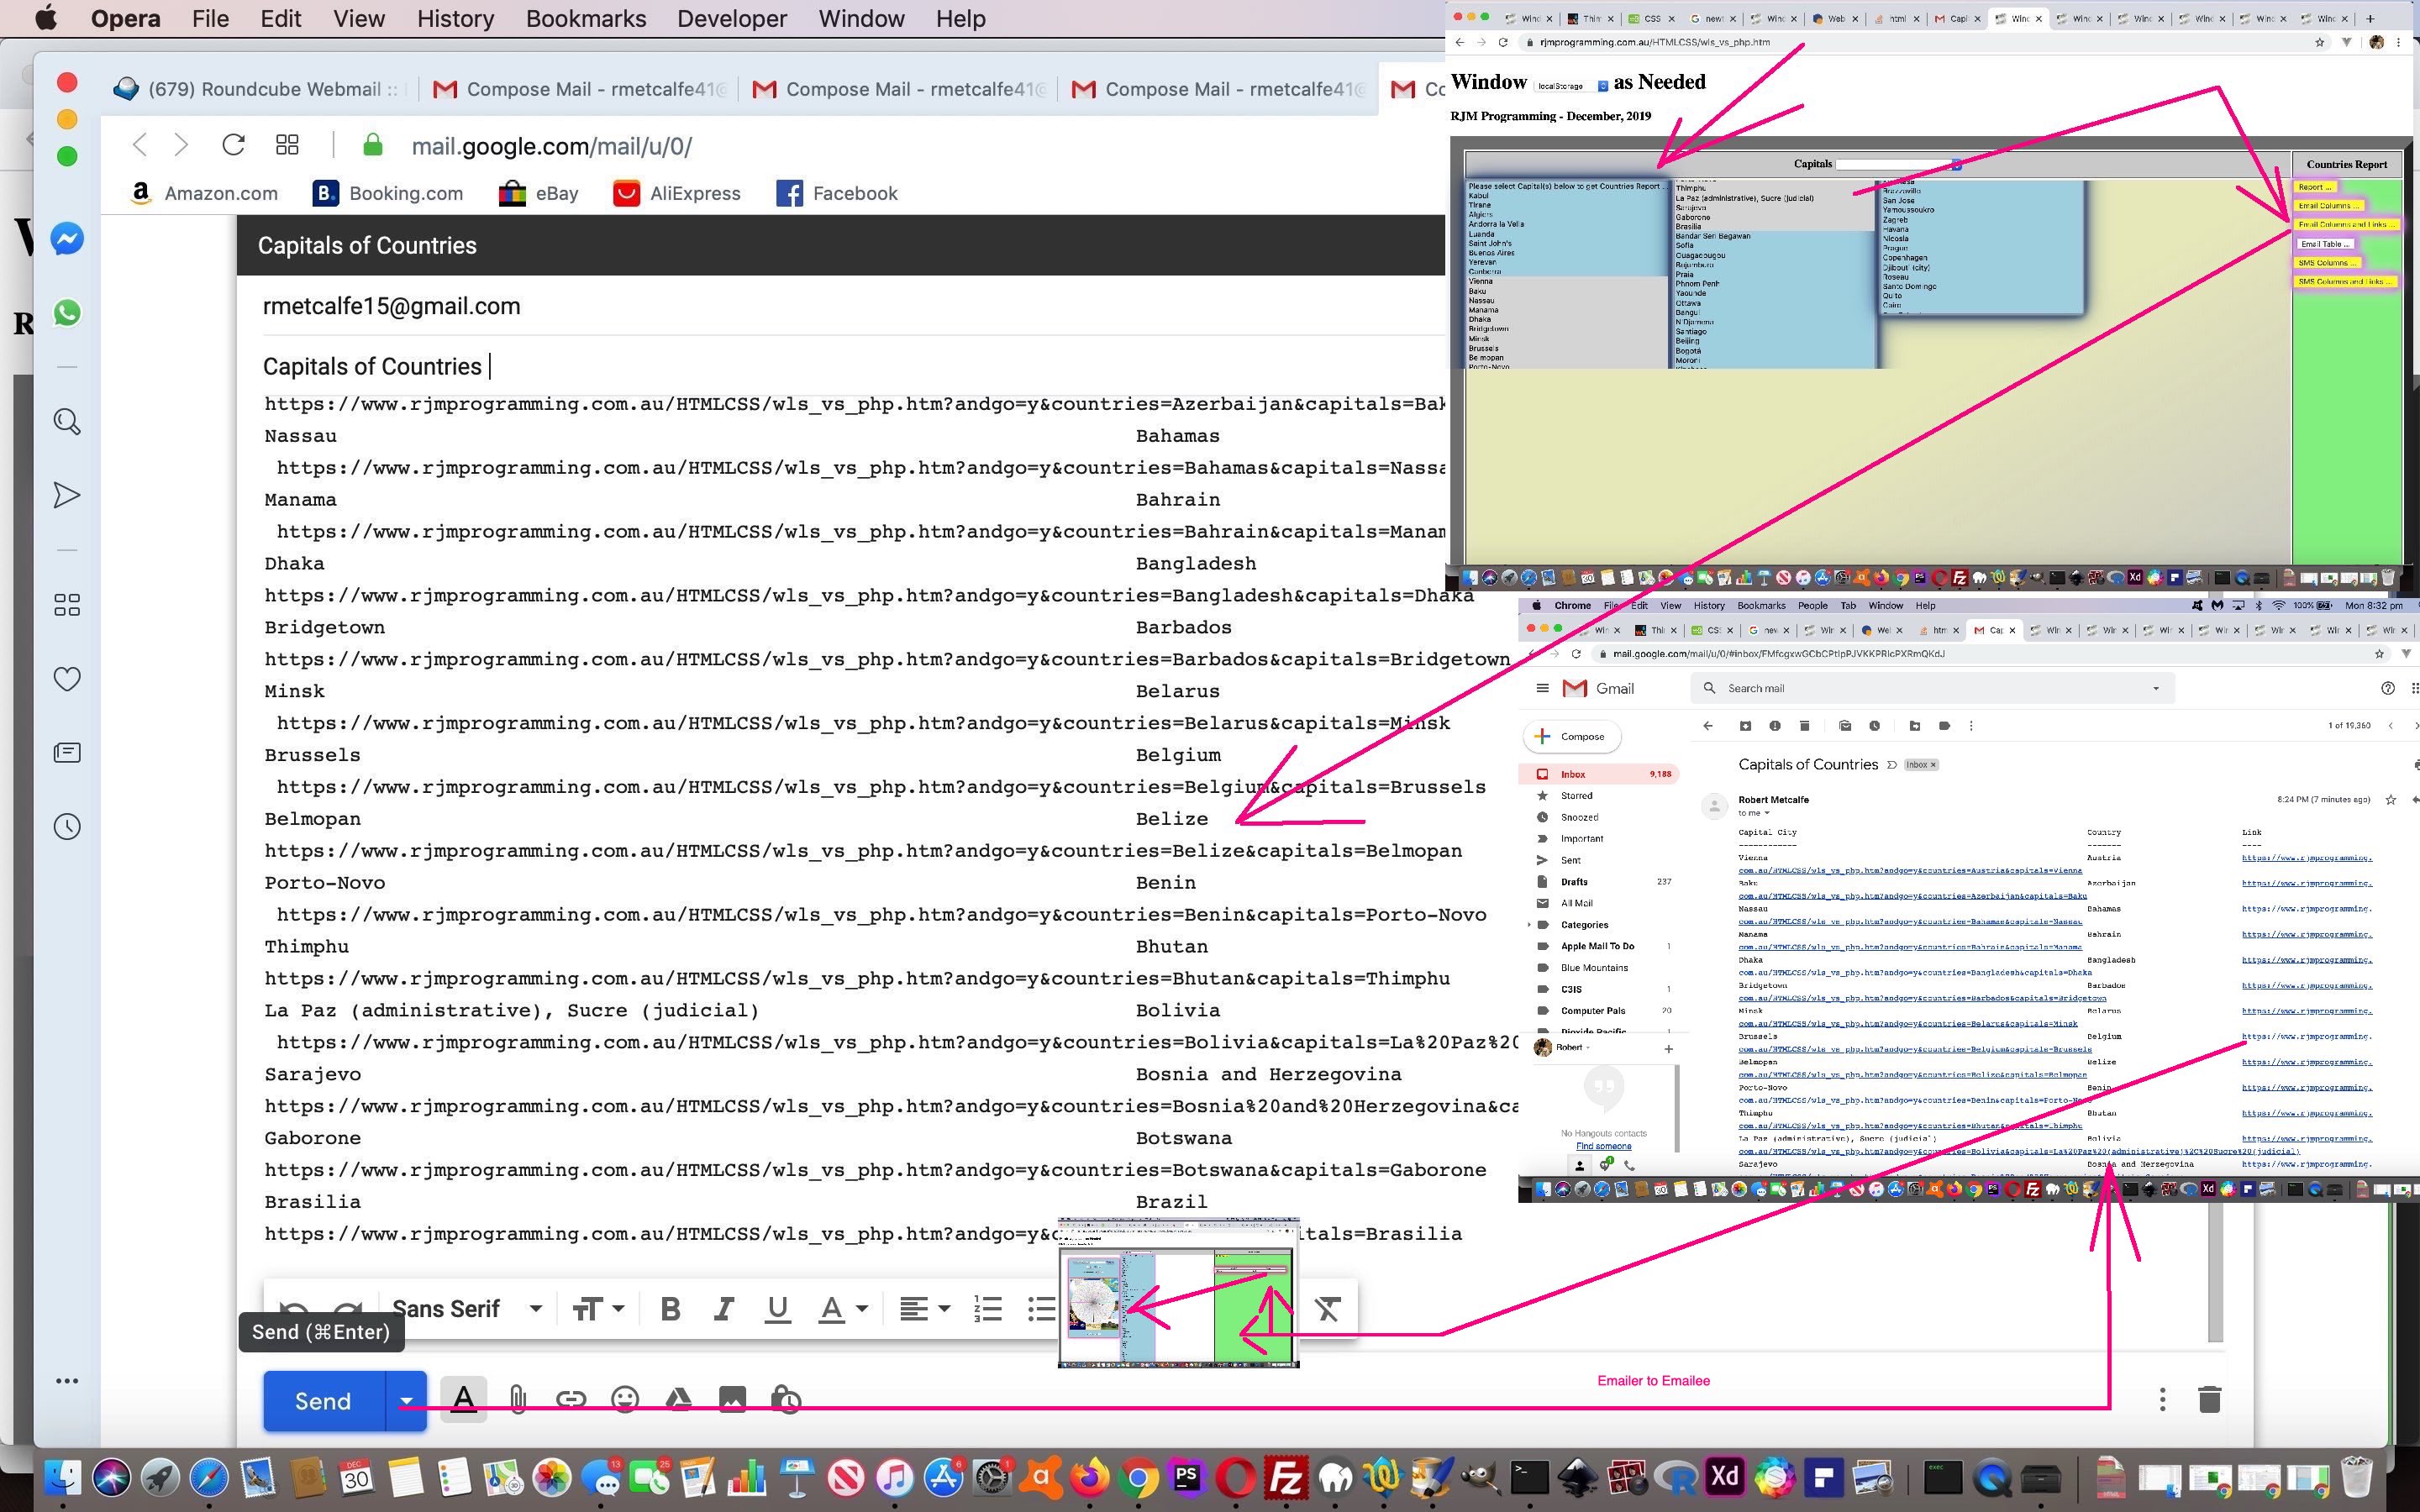
As far as links go, you may expect to need serverside means to construct these in online Email and SMS message interfacing, but email (client program) products like Gmail parse your ascii text and convert http: or https: protocol URLs in your Email body to hyperlinks, as does the Messages SMS application here on this MacBook Pro using macOS Mojave. Cute, huh?! So to close the circle back from remote thar’ parts back to our web application is a simple matter of, in broad brush terms …
- adding two new buttons called “Email Columns and Links …” and “SMS Columns and Links …” that …
- set a global variable andlinkto = true; … setting in play, within the report writing code (that likes monospaced fonts) …
- add a new links column to the right with URLs like …
https://www.rjmprogramming.com.au/HTMLCSS/wls_vs_php.htm?andgo=y&countries=Belize&capitals=Belmopan
… to tell your client programs to form the hyperlinks for us (if they are “of the mood”, that is!)
To improve user experience we use “dynamic” Javascript DOM HTML “style” attribute change means to easier close the “Colour Wheel” helper web application “above the fold” by changing the CSS z-index (Javascript DOM [element].style.zIndex) of elements accordingly, when the user clicks other elements. You can see all this with the first “the changed” link above, where all “glow” CSS styling will also feature prominently.
Previous relevant Window SessionStorage Client Versus Server Integration Tutorial is shown below.
We hope, when performing a “software integration” task, that the two or more components of that integration work with each other’s talents, rather than a big tussle like reinventing the wheel. This ideal makes the work …
- sometimes difficult but rewarding because …
- the differences between two independent software components can be quite large and daunting … and the programmer has to see that …
- care is applied so as not to wreck previous functionality and integrations in making the current integration work
… and that is why we’ve made corollaries to “building from scratch” (when planning and design is a huge component) can be a lot simpler than a software integration “renovation”, in the past, here at this blog.
Our primary integration today is to (software) integrate the great Weather Underground and its great API service for autocomplete name searches for weather (and hurricane) information. Why bother? Well, can you not envisage a user using that Ajax functionality of yesterday’s Window SessionStorage Client Versus Server Ajax Tutorial as a trip planner, perhaps, or as a “checking up on relatives overseas” tool, perhaps? And not all the capital cities are timezone places, and so for some of those we can use Weather integration to still show apt online information when click/touching a Countries Report row. Speaking of this “row”, we make an improvement whereby on a first click of a right hand (Country) row cell, that cell is not initially a contenteditable=”true” one (that may frustrate showing the keyboard on mobile, when most likely it was the row touch intended), but then becomes a contenteditable=”true” cell henceforth.
As a user experience improvement for “trip planners” perhaps, we allow the user to alphabetically sort the presented select (dropdown) element entries …
var firstopt='';

var wasopts='';

var restopts='';


function readyitforsort(iselid) {

  var optsare=[];

  var huhisel=document.getElementById(iselid).innerHTML;

  var huhsopts=huhisel.split('</option>');

  for (var ihuh=0; ihuh<huhsopts.length; ihuh++) {

    if (huhsopts[ihuh].trim() != '') {

      if (firstopt == '') {

        firstopt=huhsopts[ihuh] + '</option>';

      } else {

        wasopts+=huhsopts[ihuh].replace('option ','option data-ih="' + (huhsopts[ihuh].split('>')[eval(-1 + huhsopts[ihuh].split('>').length)] + '" ')) + '</option>';

        optsare.push(huhsopts[ihuh].replace('option ','option data-ih="' + (huhsopts[ihuh].split('>')[eval(-1 + huhsopts[ihuh].split('>').length)] + '" ')) + '</option>');

      }

    }

  }

  optsare.sort();

  for (var jhuh=0; jhuh<optsare.length; jhuh++) {

    restopts+=optsare[jhuh];

  }

}
… controlled by a new dropdown in the left hand column header cell.
We also allow the user to move the iframe element with some positioning emoji buttons near the “Close” button one (of yesterday’s work).
Into the future, too, we’ll have more to say regarding the germination of an idea “to allow a mobile onmouseover simulator (of sorts)” be to allow the user to perform a swipe across an individual HTML element of interest on mobile platforms (ie. harness ontouchmove event) as per (so far) … kicked off by “<body onload=” setTimeout(athn, 5000); “>” …
var last24='';

var rectdc;


function nodivalert() {

  document.getElementById('divalert').style.display='none';

  document.getElementById('divalert').style.zIndex='-456';

  document.getElementById('divalert').style.left=('-' + rectdc.left).replace('px','') + 'px';

  document.getElementById('divalert').style.top=('-' + rectdc.top).replace('px','') + 'px';

}


function ourdivalert(inmsg) {

  document.getElementById('divalert').style.position='absolute';

  document.getElementById('divalert').style.left=('' + rectdc.left).replace('px','') + 'px';

  document.getElementById('divalert').style.top='' + eval(-80 + eval(('' + rectdc.top).replace('px',''))) + 'px';

  document.getElementById('divalert').style.backgroundColor='#e0e0e0';

  document.getElementById('divalert').style.display='block';

  document.getElementById('divalert').style.zIndex='456';

  document.getElementById('divalert').style.opacity='0.8';

  document.getElementById('divalert').style.padding='5px 5px 5px 5px';

  document.getElementById('divalert').innerHTML=inmsg + '<br><br><input type=button value=Close onclick=nodivalert();></input>';

  setTimeout(nodivalert,9000);

}


function athn() {

  rectdc=document.getElementById('dc').getBoundingClientRect();

  if (navigator.userAgent.match(/Android|BlackBerry|iPhone|iPad|iPod|Opera Mini|IEMobile/i)) {

  document.getElementById('dc').ontouchmove=function(event) { if (last24.substring(0,eval(-1 + last24.length)) == event.target.title.substring(0,eval(-1 + event.target.title.length))) { last24=last24; } else { last24=event.target.title; ourdivalert(event.target.title); } }

  } else {

  document.getElementById('dc').onmousemove=function(event) { if (last24.substring(0,eval(-1 + last24.length)) == event.target.title.substring(0,eval(-1 + event.target.title.length))) { last24=last24; } else { last24=event.target.title; ourdivalert(event.target.title); } }

  }

}
… working with the new HTML …
<div id=divalert></div>

</body>

</html>
… to try to allow the “explainer of an element” advantages non-mobile platforms have for hovering over an HTML element with a title attribute filled in.
And so, yet again, see the changed wls_vs_php.htm‘s Capital City Find Matching Country Report live run link’s new Weather integration functionality. It caused the changed colour_wheel.html‘s colour wheel (at this live run link) to be affected (by integrations “up”).
Previous relevant Window SessionStorage Client Versus Server Ajax Tutorial is shown below.
We have a few “clientside chestnuts” to use with our current Capital City Find Matching Country Report web application project today, those being …
- Ajax functionality, kicked off by an “onclick” event set of logic, allowing mobile platforms to also have a look in (the look in that they miss when the event logic is off the “onmouseover” event)
- iframe and its …
- srcdoc attribute (“content” alternative to src “url” attribute) … along with, and crucially needing (because srcdoc ignores its own document.body onload goings on, that we need the “Iframe Client Pre-Emptive” methods below to circumvent) the …
- onload event opportunity of an iframe element (we group into “Iframe Client Pre-Emptive” methods, here)
… adding onto yesterday’s Window SessionStorage Client Versus Server Canvas Tutorial.
It’s not that involved with the Ajax work today, given that there are no cross-domain issues, though there are cross-protocol (SSL https: versus non-SSL http:) issues to be careful about. Those can be addressed because the web application is recalled to present its “Country Report” and that is the opportunity to check on protocol navigation requirements.
Along the way, we also make this happen for the user on …
- click/touching a table row … it sets off new “tr” (table row) element logic calling our (inhouse) Timezone and Wikipedia Place Information helper (HTML) via Ajax (so not leaving the webpage) … and because of place name oddities we allow for …
- “td” (table cell) element user amendments by setting their contenteditable attributes to “true” (since fixed, but we found the Timezone Europe/Tirane pointing at Tirane in Albania used to be spelt “Tirana”)
… that latter methodology normally a technique we apply to “div” elements (so, there you are!)
Also used are “overlay” techniques, two of the “usual suspects” here coming into play, to present to the “Ajax content to srcdoc iframe arrangements” …
- position:absolute property (with associated top and left (px defined) properties)
- z-index
Yet again, see the changed wls_vs_php.htm‘s Capital City Find Matching Country Report live run link’s new “Ajax” functionality.
Previous relevant Window SessionStorage Client Versus Server Canvas Tutorial is shown below.
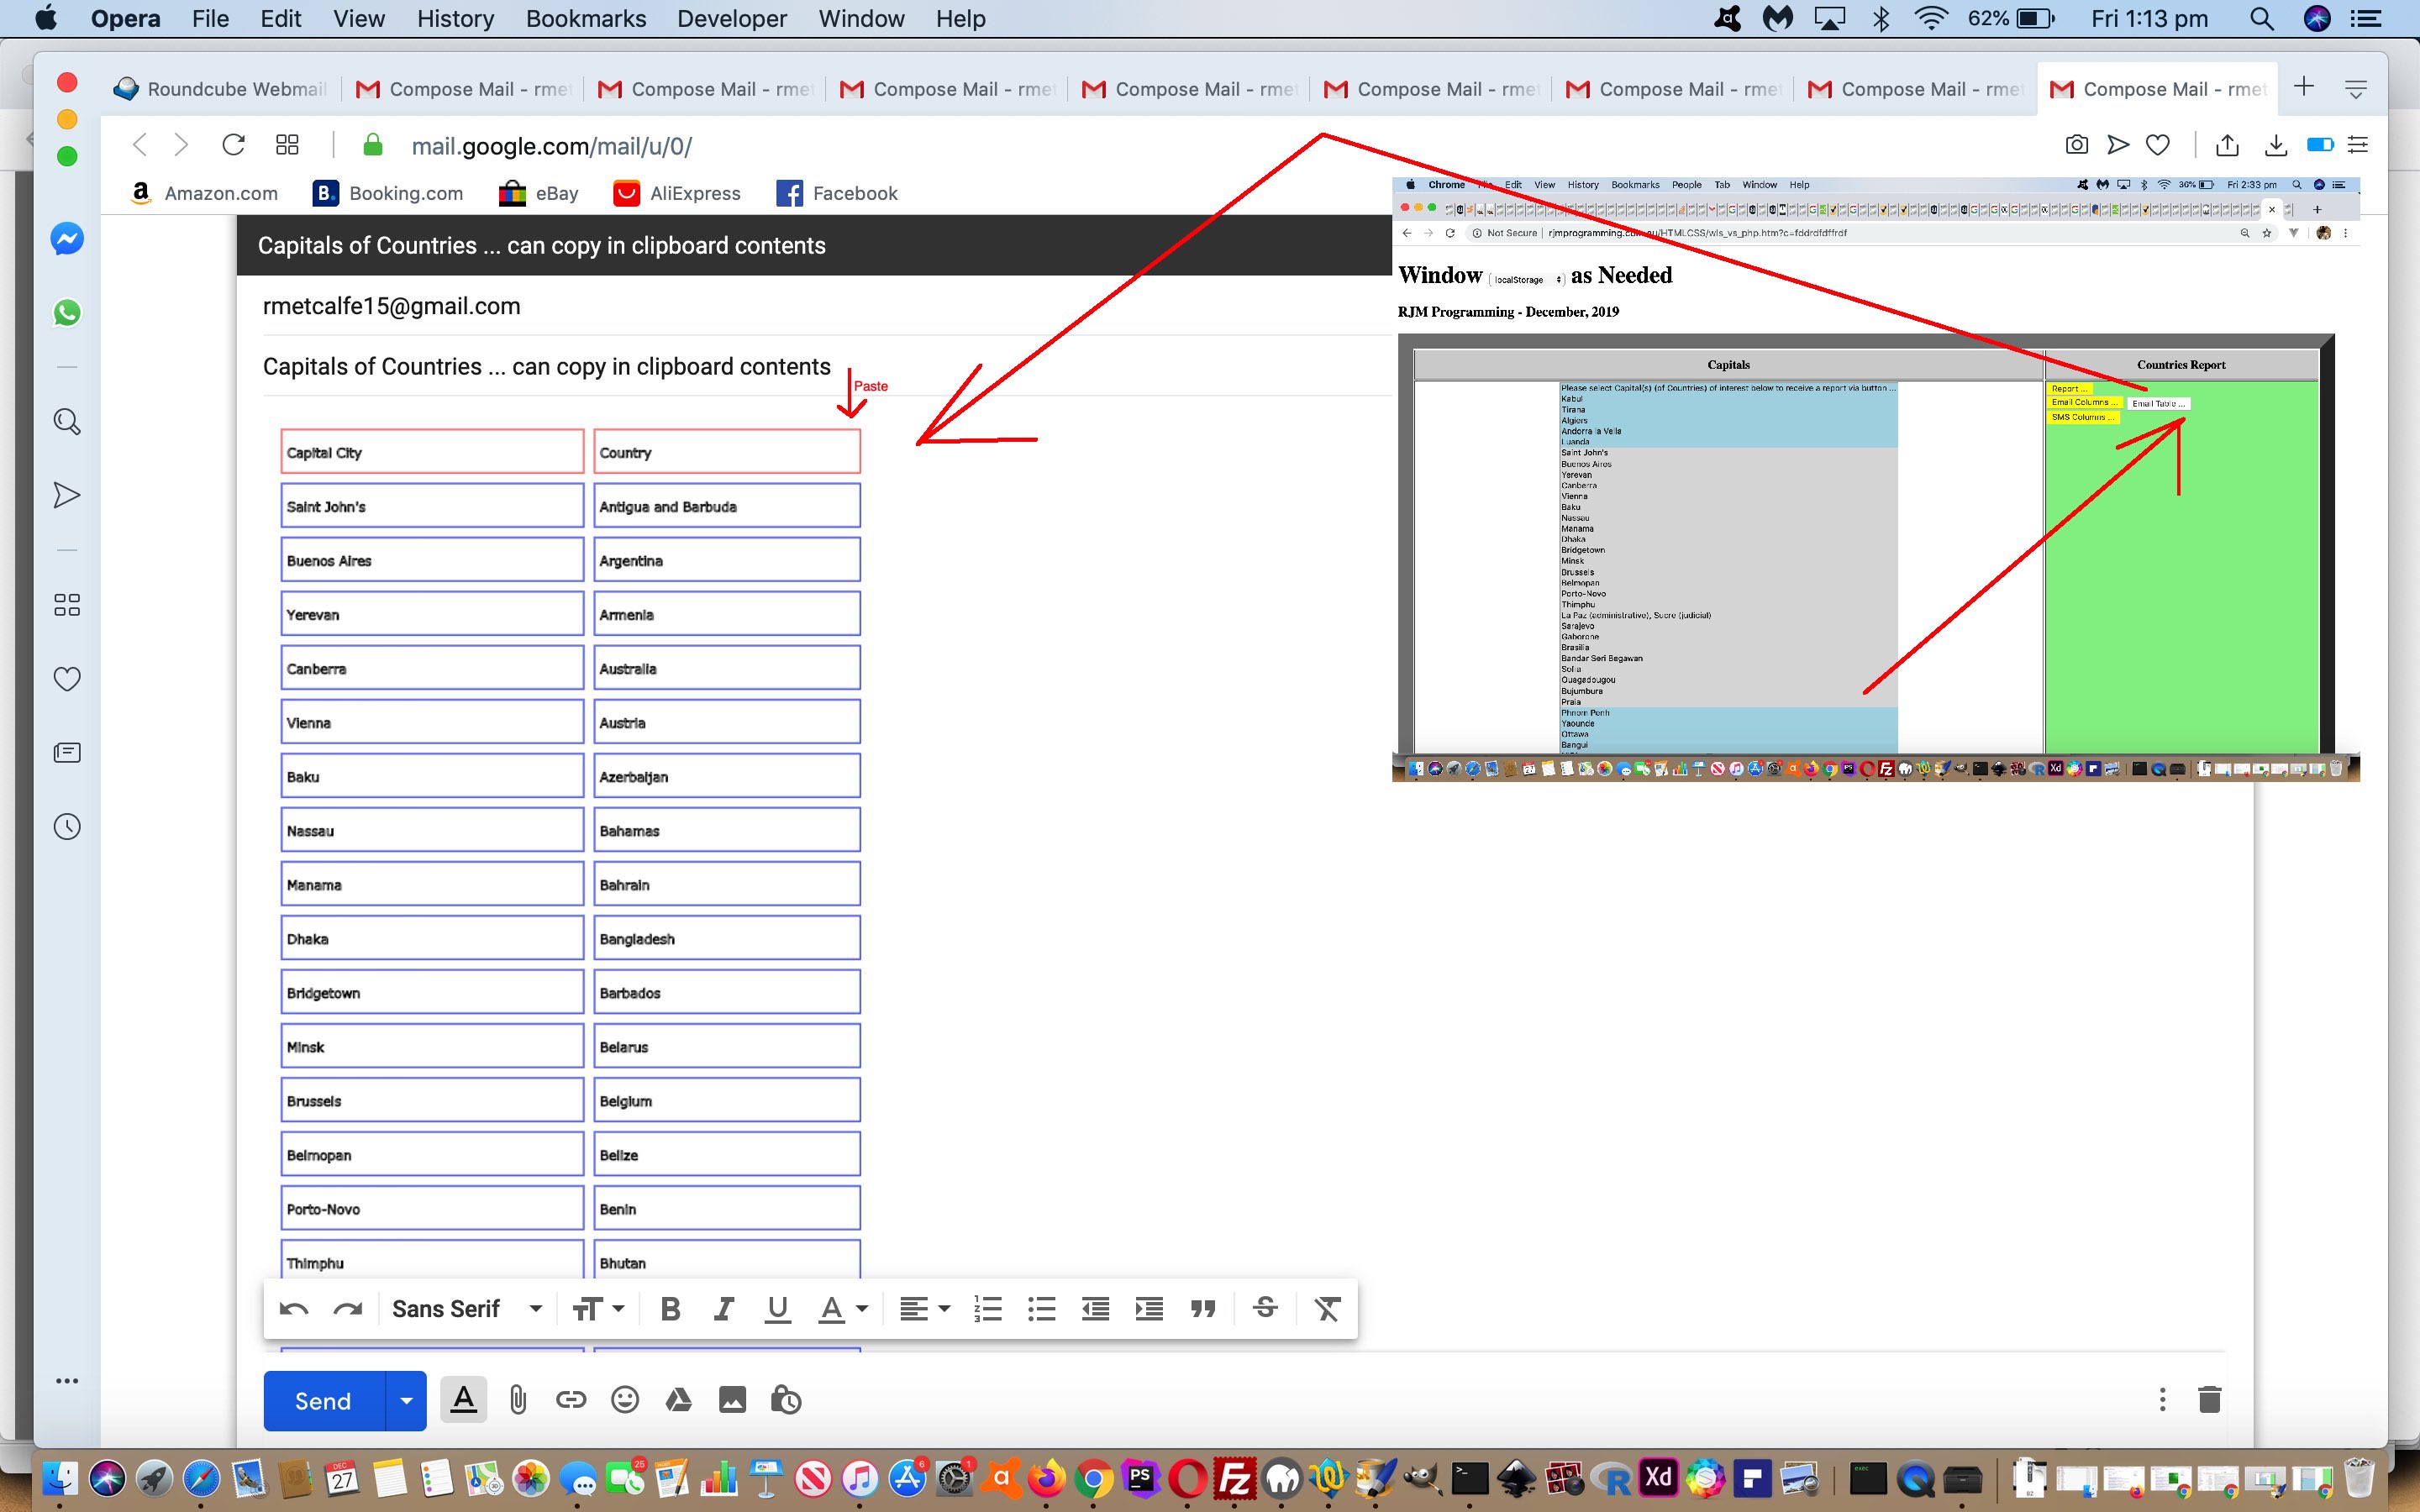
Yesterday’s Window SessionStorage Client Versus Server Share Tutorial dealt with ascii text clipboard copy assisted sharing options with our current Capital City Find Matching Country Report web application project. This suited both Email and SMS share options we coded for, but today’s extension of functionality from “ascii text” data to “graphical data” only suits Email sharing. The other caveat with our work is that no serverside (for us, PHP) help is allowed, so no PHP mail here.
What comes into play with a “graphical data” clientside (only) sharing approach? It will not surprise many readers that, for us, it involves …
- canvas element … converting HTML table outerHTML “ascii text” data … via …
- canvas drawing methods “[canvasContext].strokeRect()” and “[canvasContext].strokeText()” via “[cellElement].getBoundingClientRect()” … to convert that canvas element content via …
- [canvasElement].toDataURL() … to an …
- img element nested in a div contenteditable=true element … so as to hook in with today’s very useful helper link, thanks … use …
-
function tabletoclipboard(canvas) { // thanks to https://stackoverflow.com/questions/27863617/is-it-possible-to-copy-a-canvas-image-to-the-clipboard

 var img = document.createElement('img');

 img.src = canvas.toDataURL();


 var div = document.createElement('div');

 div.contentEditable = true;

 div.appendChild(img);

 document.body.appendChild(div);


 // do copy

 SelectText(div);

 document.execCommand('Copy');

 document.body.removeChild(div);

}


function SelectText(element) { // thanks to https://stackoverflow.com/questions/27863617/is-it-possible-to-copy-a-canvas-image-to-the-clipboard

    var doc = document;

    if (doc.body.createTextRange) {

        var range = document.body.createTextRange();

        range.moveToElementText(element);

        range.select();

    } else if (window.getSelection) {

        var selection = window.getSelection();

        var range = document.createRange();

        range.selectNodeContents(element);

        selection.removeAllRanges();

        selection.addRange(range);

    }

}
- to leave the user’s device’s clipboard containing a useful table (with linework) … ready to …
- paste into an email body section
… sharing off to an emailee collaborator.
Again, see the changed wls_vs_php.htm‘s Capital City Find Matching Country Report live run link’s new “Email Table” button functionality.
Previous relevant Window SessionStorage Client Versus Server Share Tutorial is shown below.
Yesterday’s Window SessionStorage Client Versus Server Tutorial has been amended today for two new sharing and collaboration options, those being …
- SMS
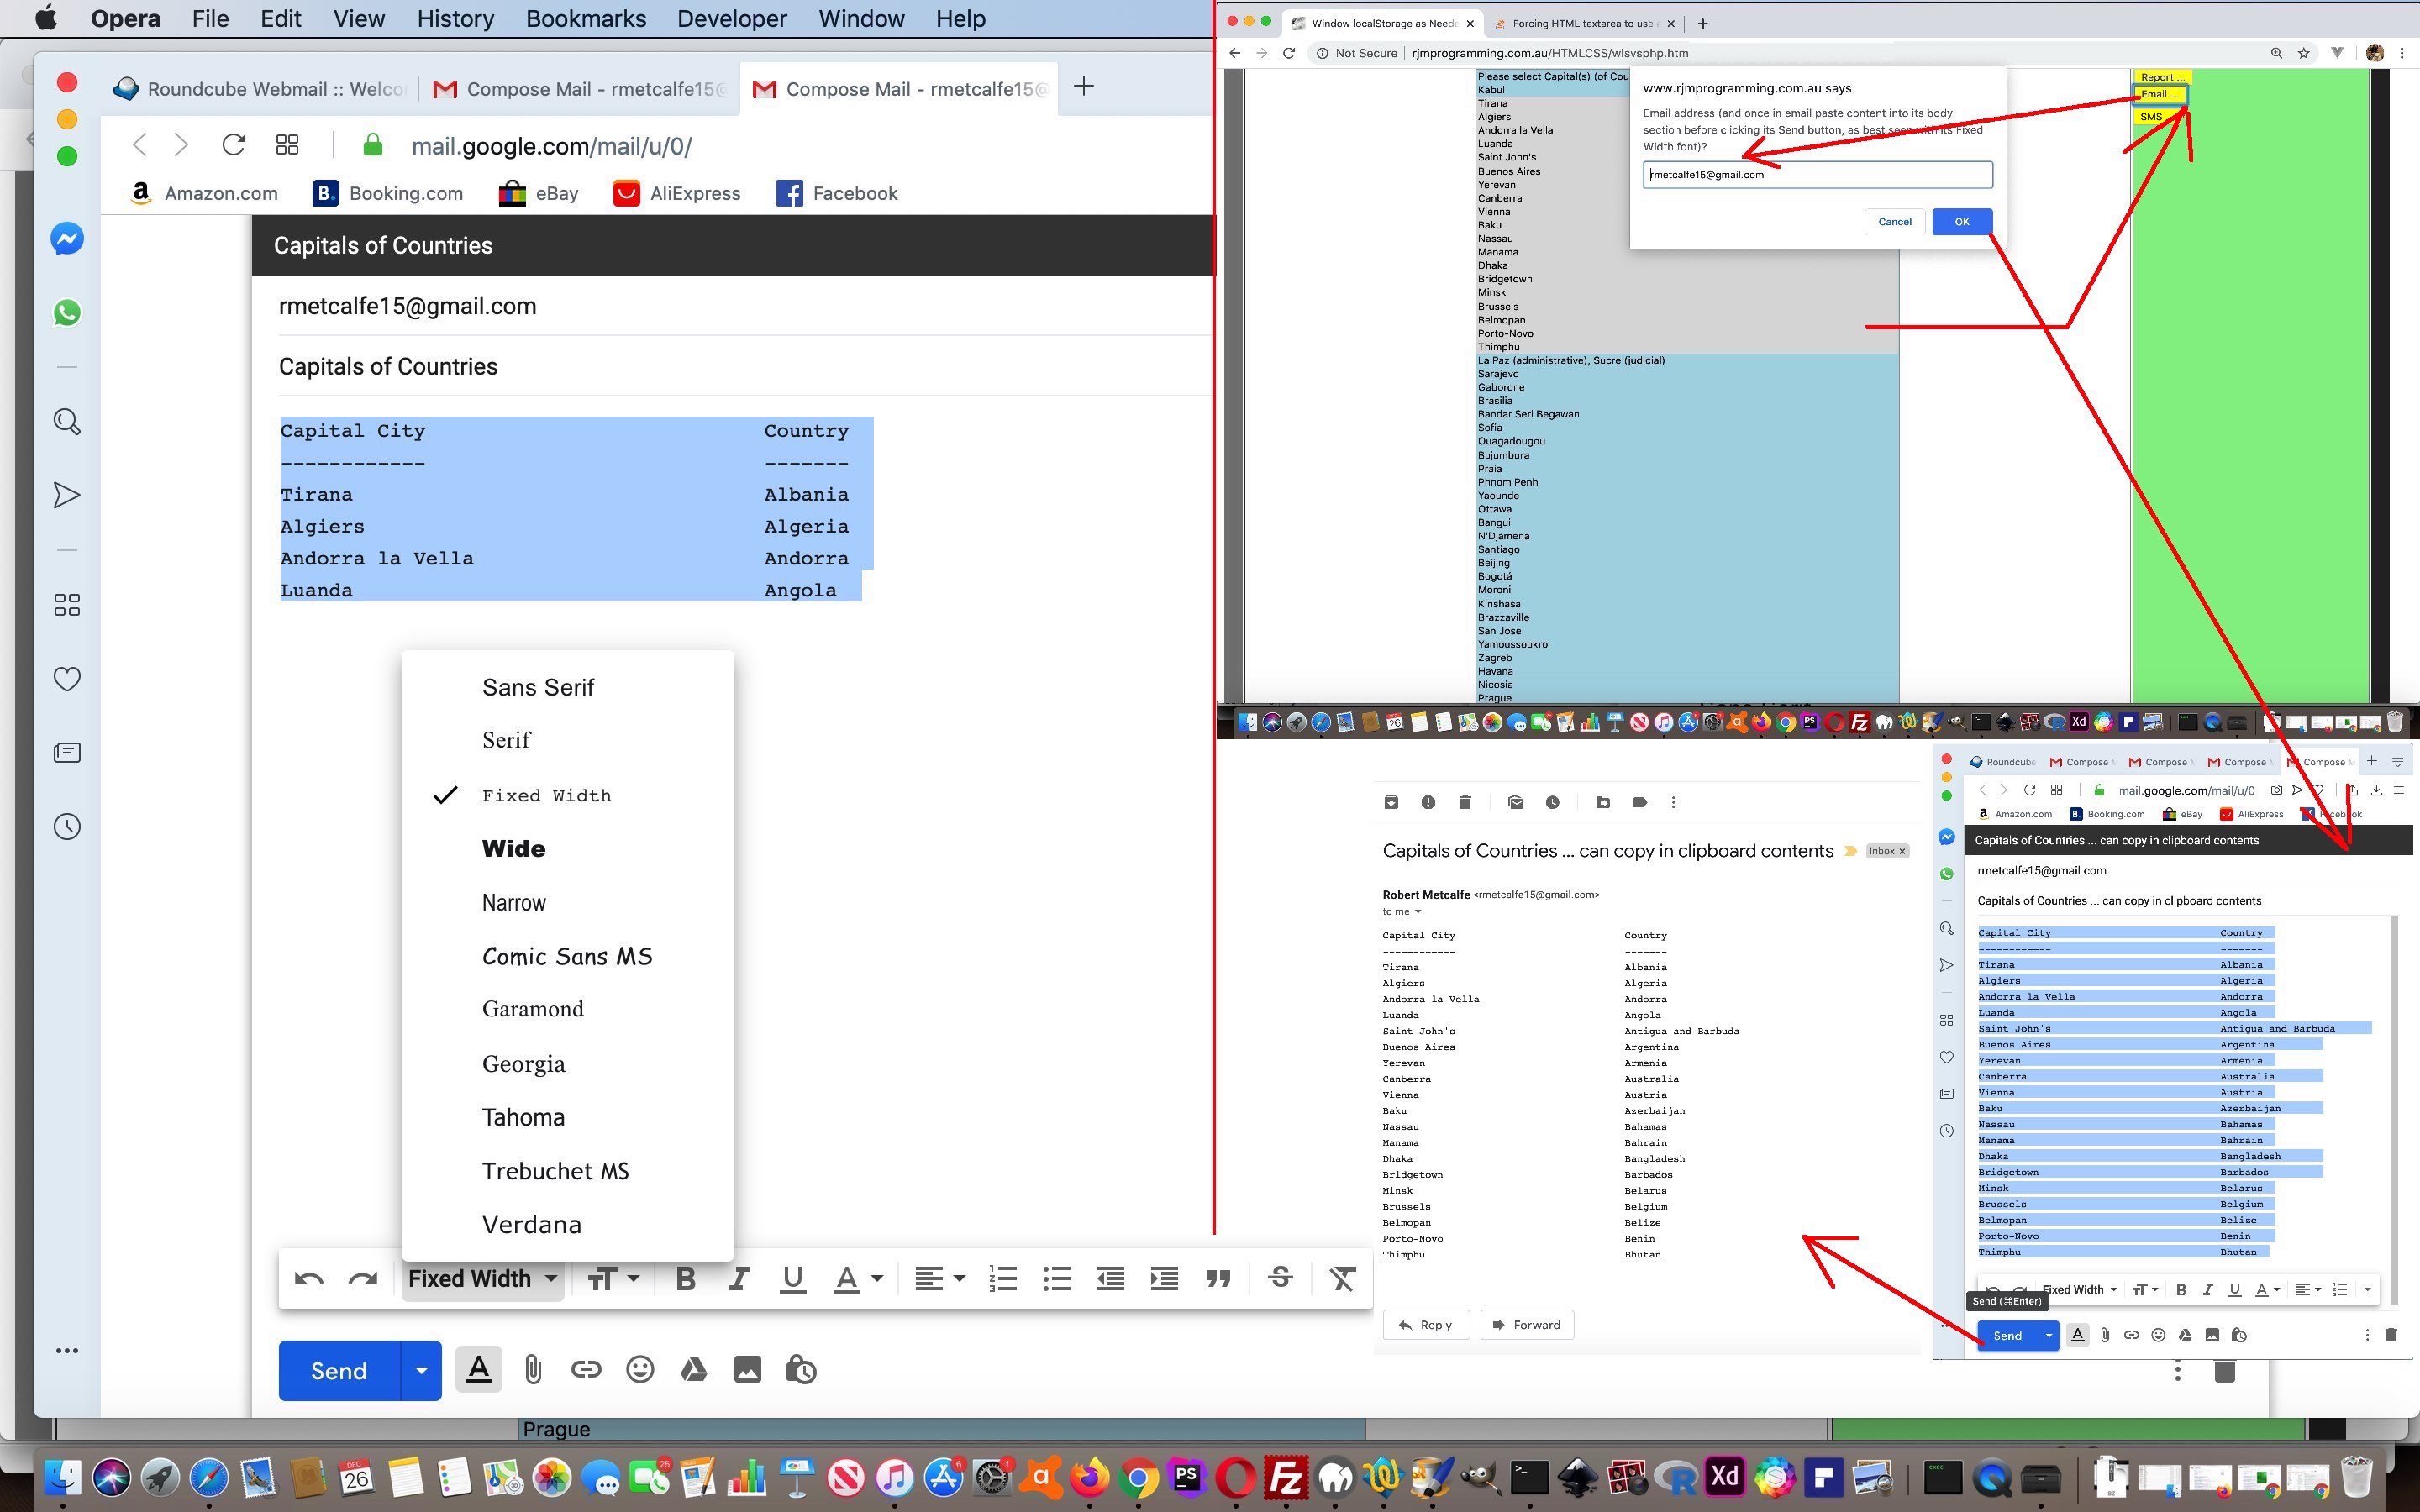
… but you may well be familiar with the restrictions on email and SMS client (program) approaches to this, coming from HTML “a” link “mailto:” and “sms:” href property prefixes respectively. We’re going to need help with the 800 odd character (length) restrictions with the (resultant) web address (bar) URL, but what? How about working off the great advice of this wonderful link, thanks, to copy what we’d have assembled into an ascii text Report into the characters contained by the user’s device’s clipboard?
function copytoclipboard(str) { // thanks to https://hackernoon.com/copying-text-to-clipboard-with-javascript-df4d4988697f

  var el = document.createElement('textarea');

  el.value = str;

  el.setAttribute('readonly', '');

  el.style.position = 'absolute';

  el.style.left = '-9999px';

  document.body.appendChild(el);

  el.select();

  document.execCommand('copy');

  document.body.removeChild(el);

}
An issue that springs up here using such clipboard ascii text content, whenever you get the Font choice given to you, pick a monospaced Font like Courier New or “Fixed Width”.
See the changed wls_vs_php.htm‘s Capital City Find Matching Country Report live run link’s new sharing functionality.
Previous relevant Window SessionStorage Client Versus Server Tutorial is shown below.
Sometimes it’s the case at this blog that we’d like to introduce a new topic, but do not do so, because we cannot show any real world (or real application) use of that concept. So it has been, up until now, with the concept of (web browser) window (object) sessionStorage property. But yesterday’s Window LocalStorage Client Versus Server Primer Tutorial represented an opportunity akin to when Haley’s Comet gets at its closest to the Earth … while you see a chance, take it … chance because of that nuance whereby we were not trying to store data for any other purpose than passing data onto …
- a known entity … ie. same web application … at …
- a known time … ie. immediately
… two conditions that make the code design “marginally” more ideal for the window object property concept of sessionStorage rather than localStorage, in that any …
localStorage.removeItem([knownLocalStorageName]);
… becomes superfluous as with sessionStorage data will disappear between web browser sessions, anyway.
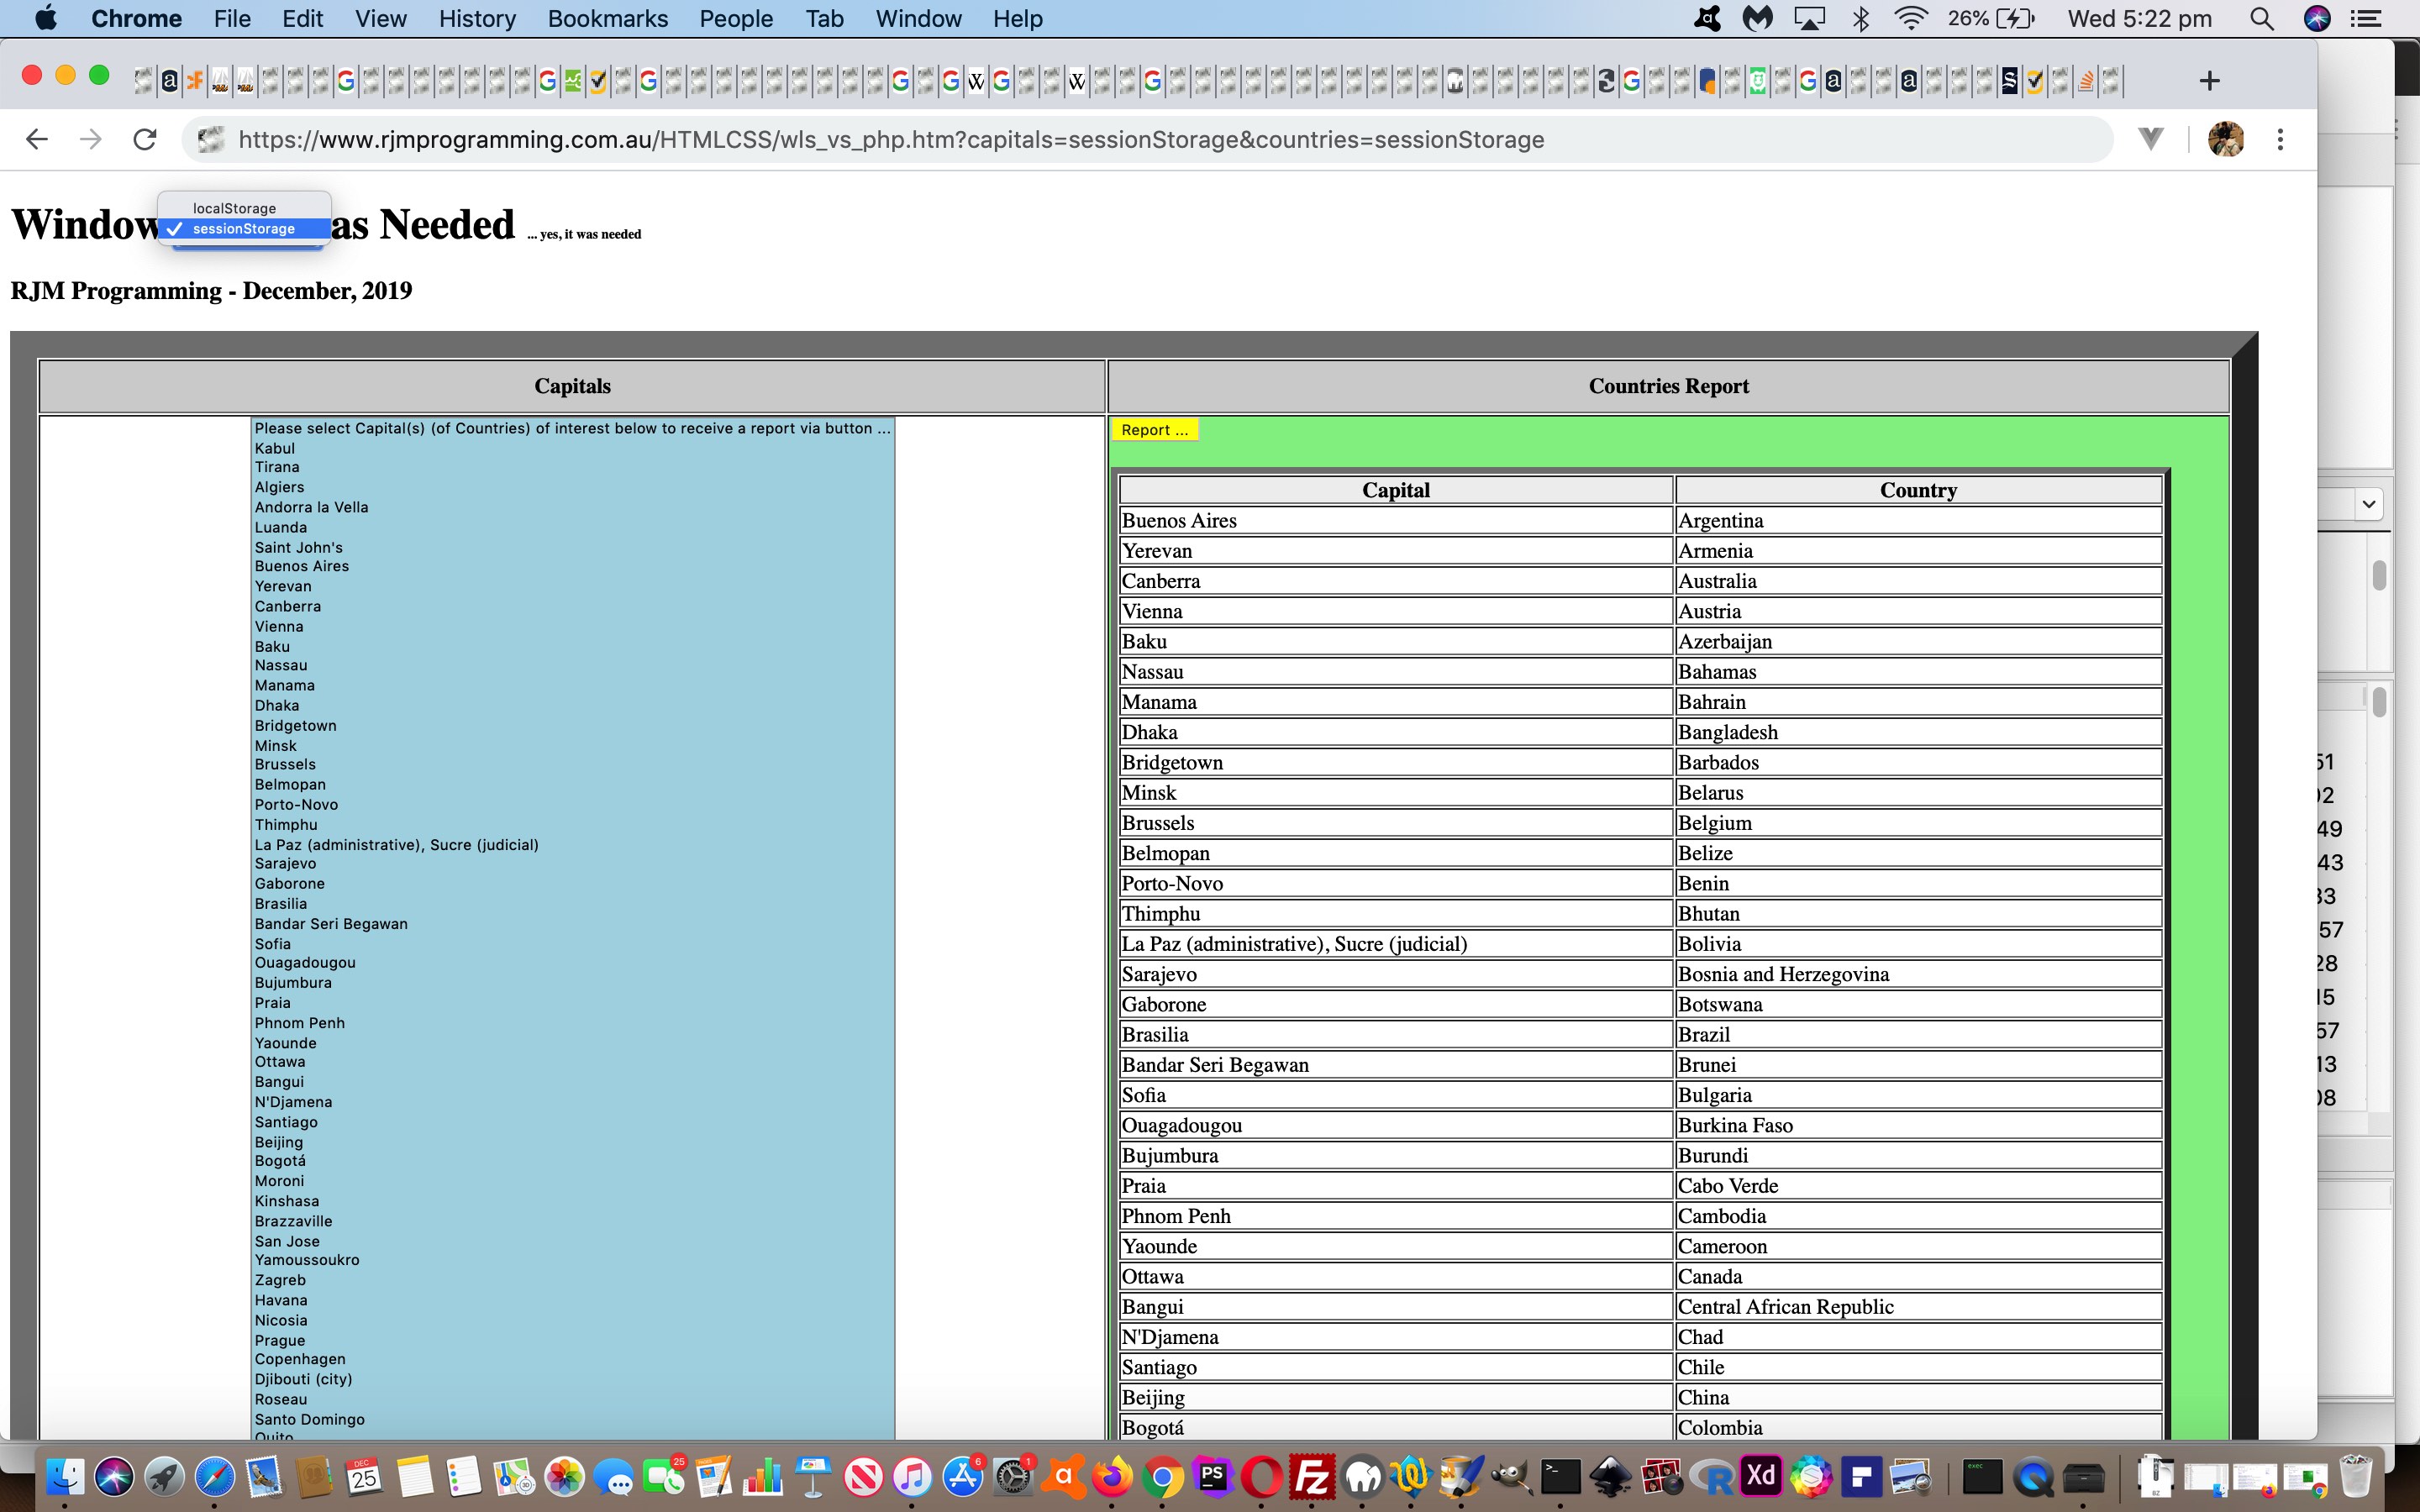
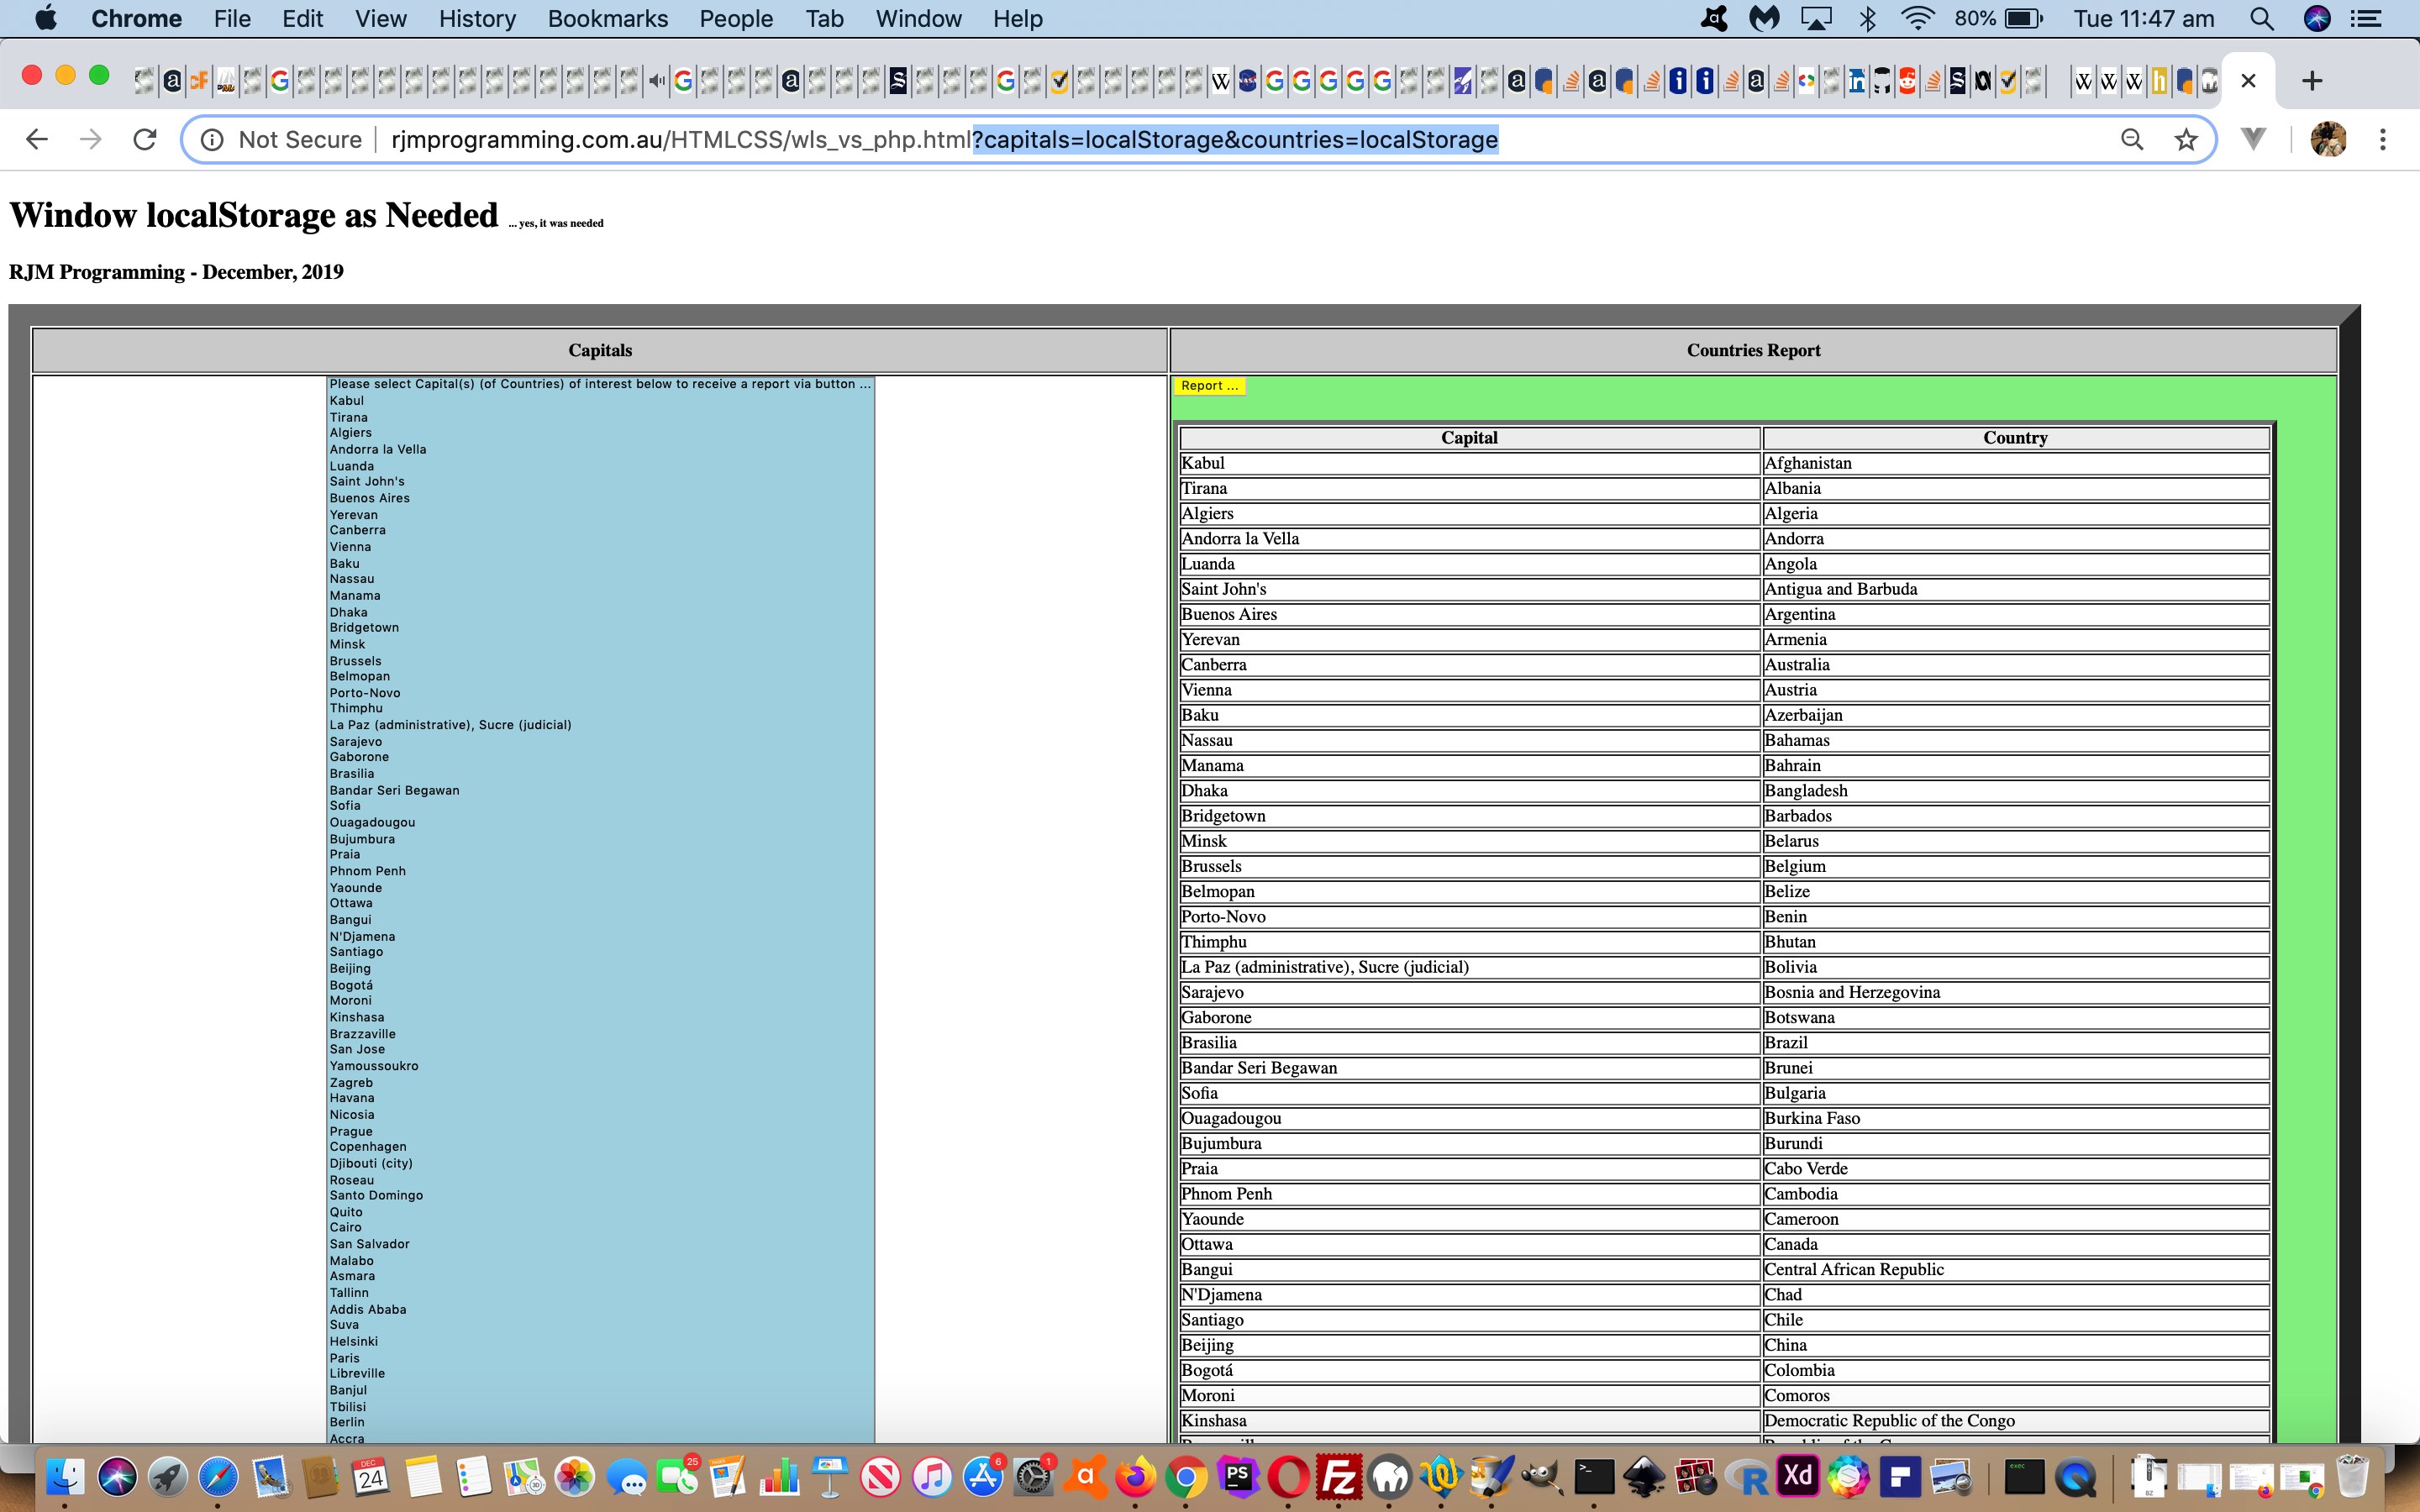
We offer this new concept as a non-default option of a select (dropdown) element replacement to the h1 element hardcoding “localStorage” with the changed wls_vs_php.htm Capital City Find Matching Country Report live run. The other nuance of difference with sessionStorage usage is that in the document.body onload event logic, we may as well (as part of other changes) pre-emptively look for, and if there, respond to, any found sessionStorage data points, even without the user having flagged it specifically …
var datamode='localStorage';


function checkforreport() {

  var divcont='';

  var dcaps, dctys, idis;

  if (getcapitals == 'localStorage') {

   if (window.localStorage) {

    getcapitals=decodeURIComponent(localStorage.getItem('wls_vs_php_capitals')).replace(/\+/g,' ');

    localStorage.removeItem('wls_vs_php_capitals');

   } else {

    getcapitals='';

   }

  } else if (getcapitals == 'sessionStorage') {

   document.getElementById('smode').value=getcapitals;

   datamode=getcapitals;

   if (window.sessionStorage) {

    getcapitals=decodeURIComponent(sessionStorage.getItem('wls_vs_php_capitals')).replace(/\+/g,' ');

   } else {

    getcapitals='';

   }

  } else if (getcapitals == '' && window.sessionStorage) {

   getcapitals=decodeURIComponent(('' + sessionStorage.getItem('wls_vs_php_capitals')).replace(/^null$/g,'')).replace(/\+/g,' ');

   if (getcapitals != '') {

    document.getElementById('smode').value='sessionStorage';

    datamode='sessionStorage';

   }

  }

  if (getcountries == 'localStorage') {

   if (window.localStorage) {

    getcountries=decodeURIComponent(localStorage.getItem('wls_vs_php_countries')).replace(/\+/g,' ');

    if (getcapitals.replace('localStorage','') != '' && getcountries.replace('localStorage','') != '') { document.getElementById('myh1').innerHTML+=' <font size=1>... yes, it was needed</font>'; }

    localStorage.removeItem('wls_vs_php_countries');

   } else {

    getcountries='';

   }

  } else if (getcountries == 'sessionStorage') {

   if (window.sessionStorage) {

    getcountries=decodeURIComponent(sessionStorage.getItem('wls_vs_php_countries')).replace(/\+/g,' ');

    if (getcapitals.replace('sessionStorage','') != '' && getcountries.replace('sessionStorage','') != '') { document.getElementById('myh1').innerHTML+=' <font size=1>... yes, it was needed</font>'; }

   } else {

    getcountries='';

   }

  } else if (getcountries == '' && document.getElementById('smode').value == 'sessionStorage' && window.sessionStorage) {

   getcountries=decodeURIComponent(('' + sessionStorage.getItem('wls_vs_php_countries')).replace(/^null$/g,'')).replace(/\+/g,' ');

   if (getcountries != '') {

    document.getElementById('smode').value='sessionStorage';

    datamode='sessionStorage';

   }

  }

  if (getcapitals != '' && getcountries != '') {

    divcont='<table border=5 style="width:95%;vertical-align:top;background-color:white;"><tr style=background-color:#f0f0f0;"><th>Capital</th><th>Country</th></tr></table>';

    dcaps=getcapitals.split('|');

    dctys=getcountries.split('|');

    for (idis=0; idis<dcaps.length; idis++) {

      divcont=divcont.replace('</table>', '<tr><td>' + dcaps[idis] + '</td><td>' + dctys[idis] + '</td></tr></table>');

    }

    document.getElementById('dreport').innerHTML=divcont;

  }

  document.getElementById('smode').value=datamode;

 }
Which beggars the question “What are the differences between sessionStorage and localStorage?” A quick reading might surmise that “the latter has an expiration date”. We leave you with an open ended Google search so that you may extend your readings on this.
Previous relevant Window LocalStorage Client Versus Server Primer Tutorial is shown below.
Even though we rave on a lot about serverside PHP and its $_POST method=POST (versus HTML/Javascript recipient via ? and & argument $_GET method=GET scenario) data length advantages as the recipient of an HTML form method=POST set of data that could be sizeable, we’ve just realized that there is a client Javascript and window.localStorage methodology that may help alleviate the need to involve PHP (and any other serverside intervention) on occasions.
Hint: Yes, we’ve raved on about this too?! Does the blog posting title give it away? Okay, yes, it should read “localStorage”, but thought we’d gone past such juvenile finickiness since the Whac-A-Mole controversy of 1st December 2019 (or even The Great Tea Trolley Disaster of ’67, we daresay).
It can even use a “self-destruct” approach to the use of this “localStorage” on having used it because …
- the web application knows who is using it (localStorage) … and on having accessed and read it …
- the web application knows it (localStorage) is of no use to any other user (in this web application’s case, at least)
… which is very pleasing for a Land Surveyor who likes to leave cow paddocks as they’ve seen them so to speak. Except it’s like having a ten tonne truck worth of data access in amongst the cow pats when having access to “localStorage” (or PHP), rather than a little piddle of calf wee (wee Metcalfes know a thing or two about these things!) data access of ? and & HTML/Javascript URL arguments (or even if we were to use HTTP Cookies).
It’s not as if we all have access to serverside language usage, though we do, because we really like PHP and MAMP and Apache/PHP/MySql web servers (and have arranged our development environment accordingly), but what if you are starting out in web development, and still want to allow for sizeable chunks of data with your web applications? Huh? Huh?! See the possibilities? Try our proof of concept wls_vs_php.html Capital City Find Matching Country Report live run, and highlight a whole swathe of (multiple mode) dropdown option Capital Cities holding down the shift key before pressing the yellow “Report” button. If the URL ends up as …
https://rjmprogramming.com.au/HTMLCSS/wls_vs_php.html?capitals=localStorage&countries=localStorage
… that’s because the web application’s …
function analyze() {

  var purl=document.URL.split('#')[0].split('?')[0] + '?capitals=' + encodeURIComponent(document.getElementById('capitals').value) + '&countries=' + encodeURIComponent(document.getElementById('countries').value);

  if (purl.length > 800) {

    if (phpexists) {

      document.getElementById('myform').method='POST';

      document.getElementById('myform').action='./wls_vs_php.php';

    } else if (window.localStorage) {

      localStorage.setItem('wls_vs_php_countries', encodeURIComponent(document.getElementById('countries').value));

      localStorage.setItem('wls_vs_php_capitals', encodeURIComponent(document.getElementById('capitals').value));

      document.getElementById('capitals').value='localStorage';

      document.getElementById('countries').value='localStorage';

      location.href=document.URL.split('#')[0].split('?')[0] + '?capitals=' + encodeURIComponent(document.getElementById('capitals').value) + '&countries=' + encodeURIComponent(document.getElementById('countries').value);

      return false;

    }

  }

  return true;

}
… HTML form onsubmit event logic …
- discovered no PHP web application existant (via Client Pre-emptive Iframe techniques) … and …
- discovered (in a sanity check feeling way) that to go down the proposed HTML form method=GET approach was risking a …
HTTP 414 "Request URI too long"
… web browser error … and that … - localStorage was a known web browser piece of functionality
- back out of the default HTML form method=GET navigation setup of the web application in favour of …
- storing that data into localStorage
- substituting into the URL ? and & arguments the hardcoding “localStorage” (and in so doing, getting back under the HTTP 414 “Request URI too long” limitation, piecing together (what amounts to) …
location.href=document.URL.split(‘#’)[0].split(‘?’)[0] + ‘?capitals=localStorage&countries=localStorage’;)
… that on a recall to this same web application a … - document.body onload event piece of Javascript logic checks the localStorage for its incoming Capital City Country Report data, as per …
var phpexists=false;

var getcapitals=location.search.split('capitals=')[1] ? decodeURIComponent(location.search.split('capitals=')[1].split('&')[0]).replace(/\+/g,' ') : '';

var getcountries=location.search.split('countries=')[1] ? decodeURIComponent(location.search.split('countries=')[1].split('&')[0]).replace(/\+/g,' ') : '';


function checkforreport() {

  var divcont='';

  var dcaps, dctys, idis;

  if (getcapitals == 'localStorage') {

   if (window.localStorage) {

    getcapitals=decodeURIComponent(localStorage.getItem('wls_vs_php_capitals')).replace(/\+/g,' ');

    localStorage.removeItem('wls_vs_php_capitals');

   } else {

    getcapitals='';

   }

  }

  if (getcountries == 'localStorage') {

   if (window.localStorage) {

    getcountries=decodeURIComponent(localStorage.getItem('wls_vs_php_countries')).replace(/\+/g,' ');

    if (getcapitals.replace('localStorage','') != '' && getcountries.replace('localStorage','') != '') { document.getElementById('myh1').innerHTML+=' <font size=1>... yes, it was needed</font>'; }

    localStorage.removeItem('wls_vs_php_countries');

   } else {

    getcountries='';

   }

  }

  if (getcapitals != '' && getcountries != '') {

    divcont='<table border=5 style="width:95%;vertical-align:top;background-color:white;"><tr style=background-color:#f0f0f0;"><th>Capital</th><th>Country</th></tr></table>';

    dcaps=getcapitals.split('|');

    dctys=getcountries.split('|');

    for (idis=0; idis<dcaps.length; idis++) {

      divcont=divcont.replace('</table>', '<tr><td>' + dcaps[idis] + '</td><td>' + dctys[idis] + '</td></tr></table>');

    }

    document.getElementById('dreport').innerHTML=divcont;

  }

}
… the localStorage.removeItem() representing that “self-destruct” nuance we were talking about before
… and so as per our localStorage logic we …
We may well use this methodology in future projects, and hope it has been of some little interest to you as well?!
If this was interesting you may be interested in this too.
If this was interesting you may be interested in this too.
If this was interesting you may be interested in this too.
If this was interesting you may be interested in this too.
If this was interesting you may be interested in this too.
If this was interesting you may be interested in this too.
If this was interesting you may be interested in this too.
If this was interesting you may be interested in this too.
If this was interesting you may be interested in this too.
If this was interesting you may be interested in this too.
If this was interesting you may be interested in this too.
If this was interesting you may be interested in this too.
If this was interesting you may be interested in this too.
If this was interesting you may be interested in this too.
If this was interesting you may be interested in this too.
If this was interesting you may be interested in this too.
If this was interesting you may be interested in this too.
If this was interesting you may be interested in this too.
If this was interesting you may be interested in this too.
If this was interesting you may be interested in this too.
If this was interesting you may be interested in this too.
If this was interesting you may be interested in this too.
If this was interesting you may be interested in this too.
If this was interesting you may be interested in this too.
If this was interesting you may be interested in this too.
If this was interesting you may be interested in this too.
If this was interesting you may be interested in this too.
If this was interesting you may be interested in this too.
If this was interesting you may be interested in this too.
If this was interesting you may be interested in this too.

