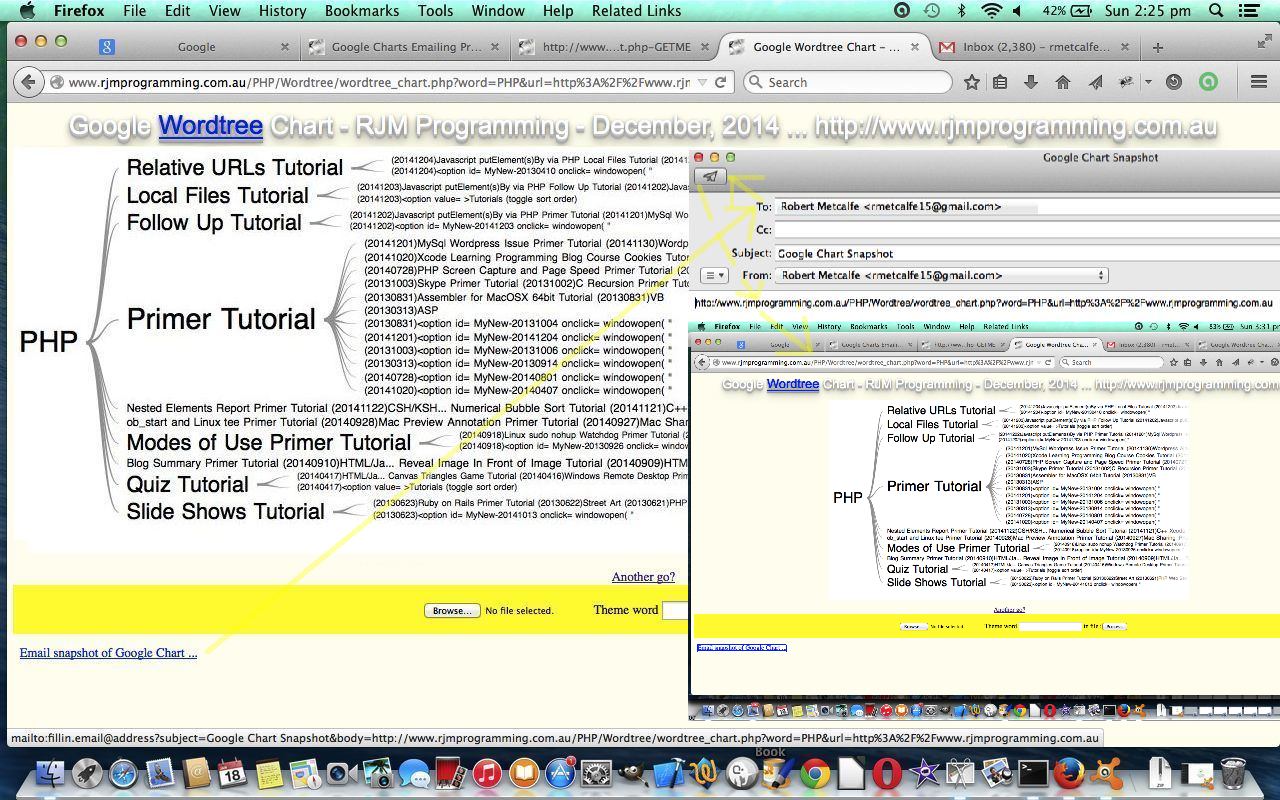
The Google Charts (derived) webpages here at this rjmprogramming.com.au WordPress blog have all changed to add functionality for emailing snapshots of the Google Charts “midstream”. You can see a table of tutorials, and corresponding PHP code (with the last row being our one new bit of Javascript code) affected below …
Let’s now discuss some tactics that can work to be a bit objective about the task of making these changes in a methodical and systematic way.
- If possible, have the change amount to the adjustment of one line of code … so we looked at one bit of Javascript called gchartgen.js called by each Google Chart application via …
<script type="text/javascript" src="http://www.rjmprogramming.com.au/gchartgen.js"></script>… the one (extra) line of code ( that is placed between <head> and </head> ) - So where can gchartgen.js intervene to do its thing (which is to add an Email link down the bottom and allow HTML h1’s be clickable to Email, as well (quite often))? … onload functionality proved to be too crowded, and as this functionality is not mission-critical it is decided that it can be created with setTimeout(gcinit, 2000); … ie. roughly 2 seconds after onload event
- Unit test this on one Google Chart scenario on local (MAMP) web server
- When happy bring all Google Charts code over to local (MAMP) web server
- Make a file of *GETME files via Linux command something like find . -name ‘*GETME’ 2> /dev/null > gclist.xxx
- Manually filter out the entries that are not “relevant latest” from this list using vi (for instance) adjusting each relevant latest to go up one (eg. _GETME goes to -GETME or -GETME goes to –GETME)
- Write a Korn shell script whose main lines of functionality look like
 #!/bin/ksh

for f in `cat gclist.xxx`; do

  pf=`echo $f | sed '/-GETME/s///g' | sed '/_GETME/s///g'`

  nf=`echo $f | sed '/-GETME/s//--GETME/g' | sed '/_GETME/s//-GETME/g'`

  cat $f | sed '/<head>/s//<head> <script type="text/javascript" src="http://www.rjmprogramming.com.au/gchartgen.js"></script>/g' > $nf

  cat $pf | sed '/<head>/s//<head> <script type="text/javascript" src="http://www.rjmprogramming.com.au/gchartgen.js"></script>/g' > ${pf}_new

  cat ${pf}_new > $pf

  rm ${pf}_new

done

exit - Run this Korn Shell on the local (MAMP) web server (Linux) environment (on Mac, is Terminal application’s Bash environment)
- Now for each Google Chart application …
- test it works on local (MAMP) web server
- upload it to live rjmprogramming.com.au place
- retest on live rjmprogramming.com.au place
- To get the table above constructed we, roughly …
- updated this blog’s All Posts table … why? pourquoi? … the All Posts functionality has a lot in common to what we want, in a table, here … good to find linkages and commonalities with software
- went to the All Posts “code download table” and sorted for latest changed source code up the top
- start up Firefox web browser’s Firebug add on … why? pourquoi? … we want to get in under any Javascript client side (in this case, sorting) rearrangements (which View->Page Source is not good enough to show) .. so we can use a dynamic Javascript DOM tool like Firebug effectively (and strategically) here
- point at the table and use the Copy HTML option to paste the buffer over to a TextWrangler (text editor) session and create a standalone piece of HTML (with only the top “today” parts of the buffer) on the local (MAMP) web server, where it is unit tested on a local web browser ( eg. http://localhost:8888/sometest.html ) over and over again until it works, in preparation for copying this into the live rjmprogramming.com.au WordPress blog post (ie. what you are reading here)
- check that it still looks okay, or not, in the scenario of being in the blog post
Here is a link to Google Chart Tools “spiritual home” … via Google.
Hope you try out some of the newly tweaked Google Charts functionality.
If this was interesting you may be interested in this too.


19 Responses to Google Charts Emailing Primer Tutorial