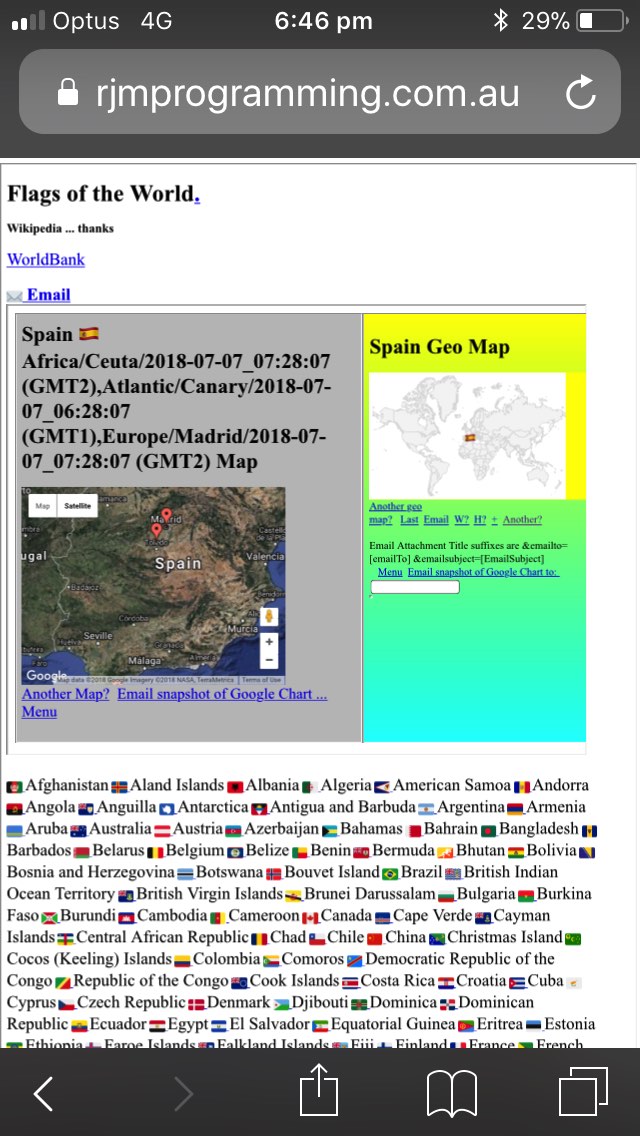
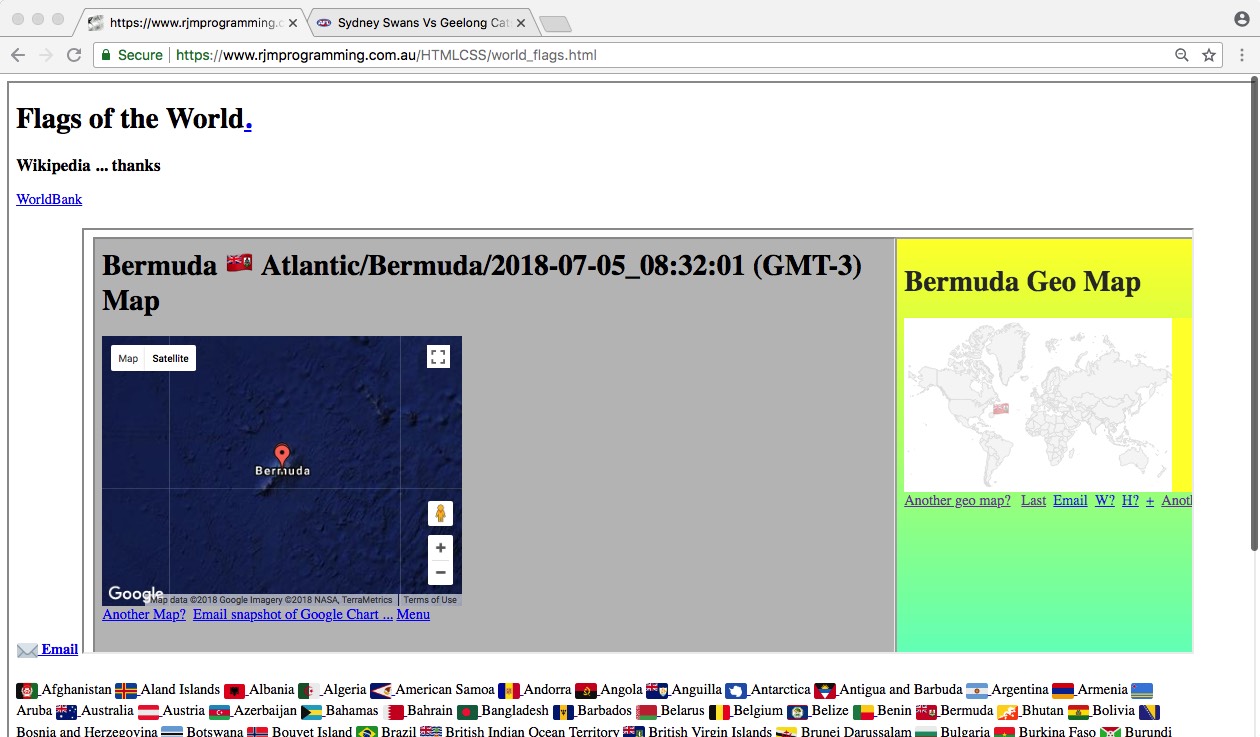
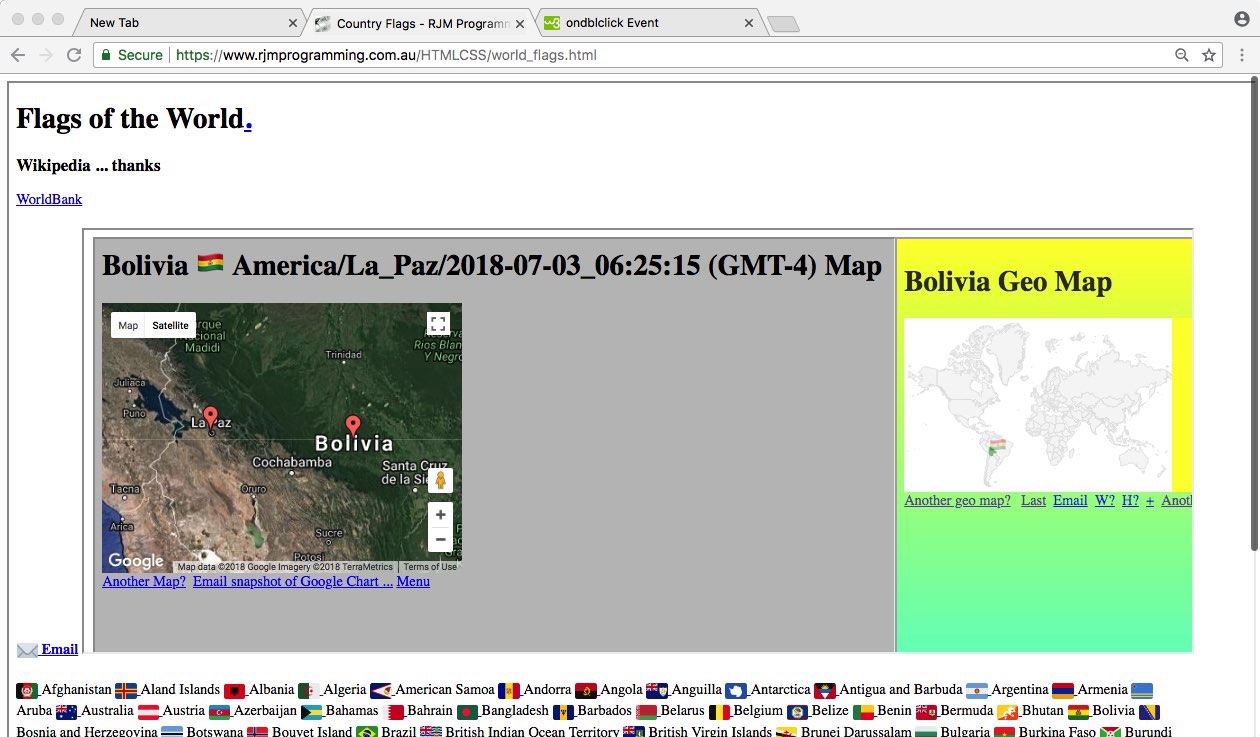
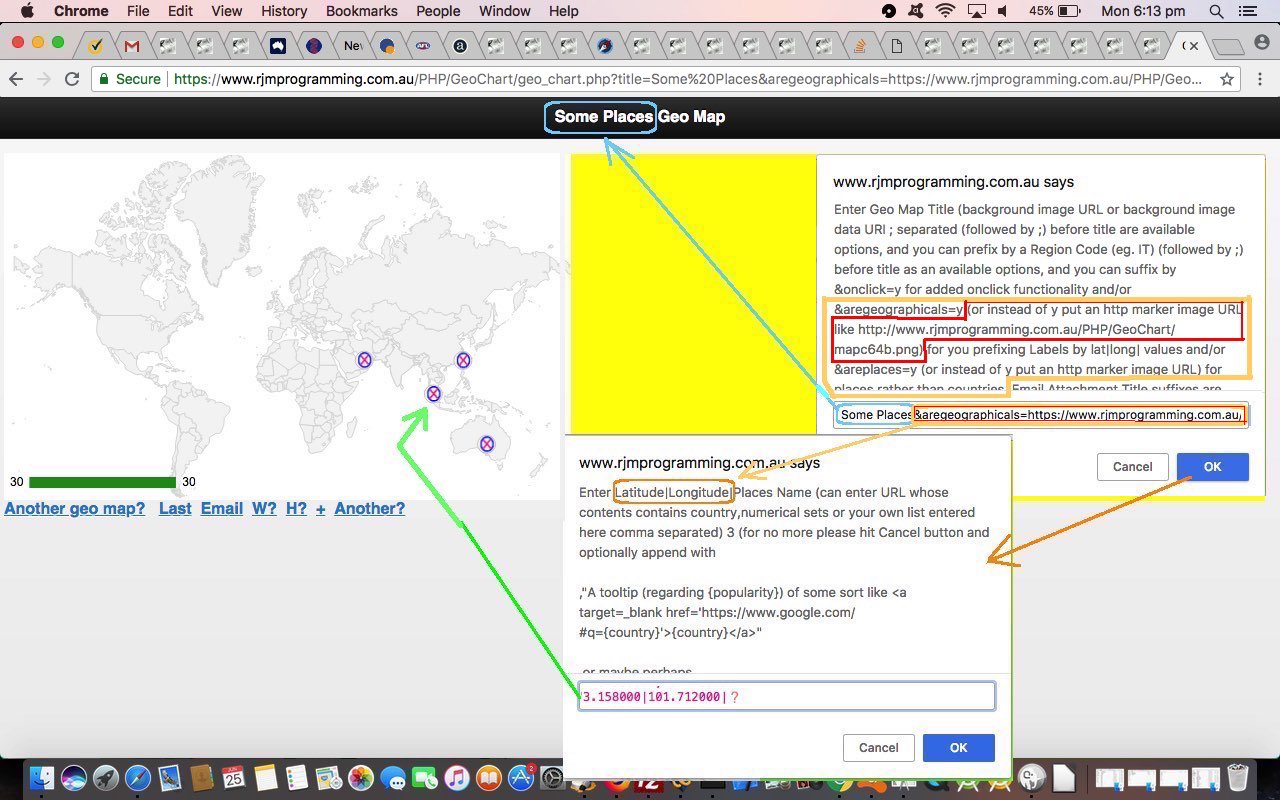
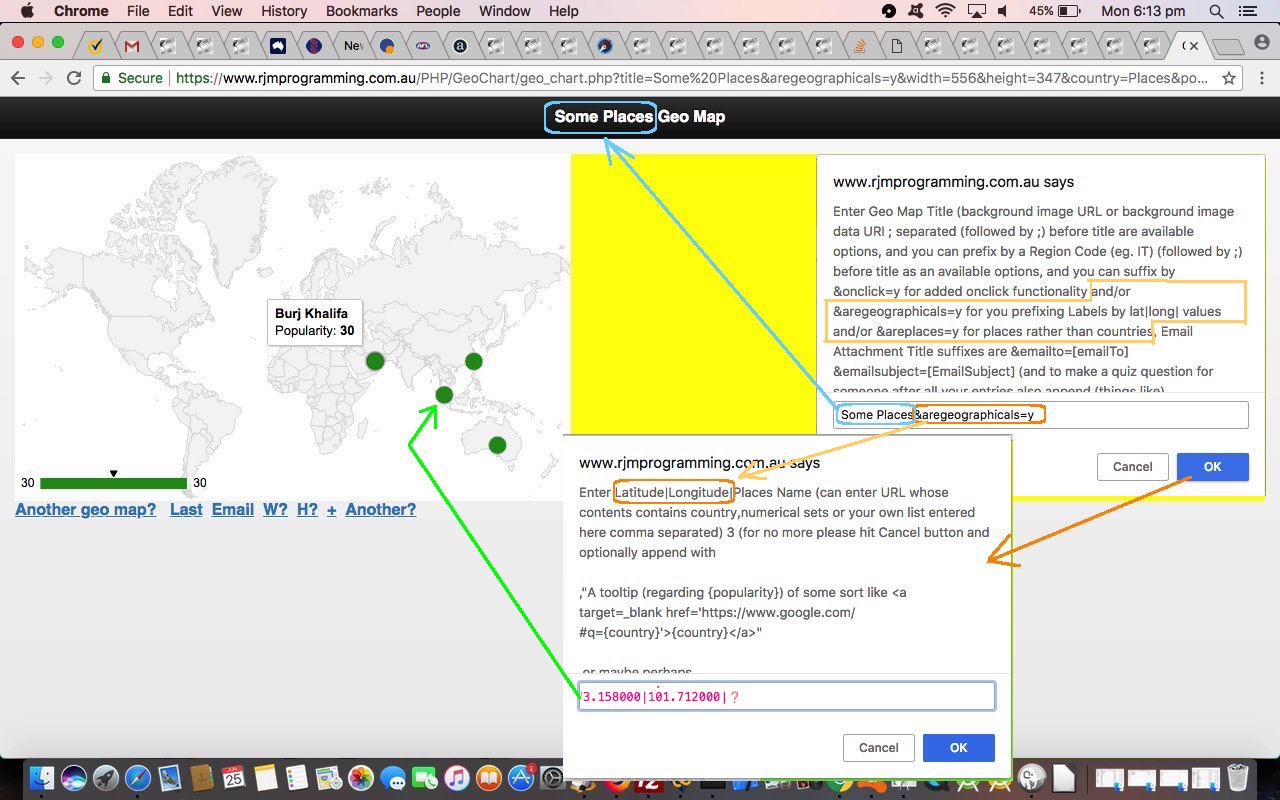
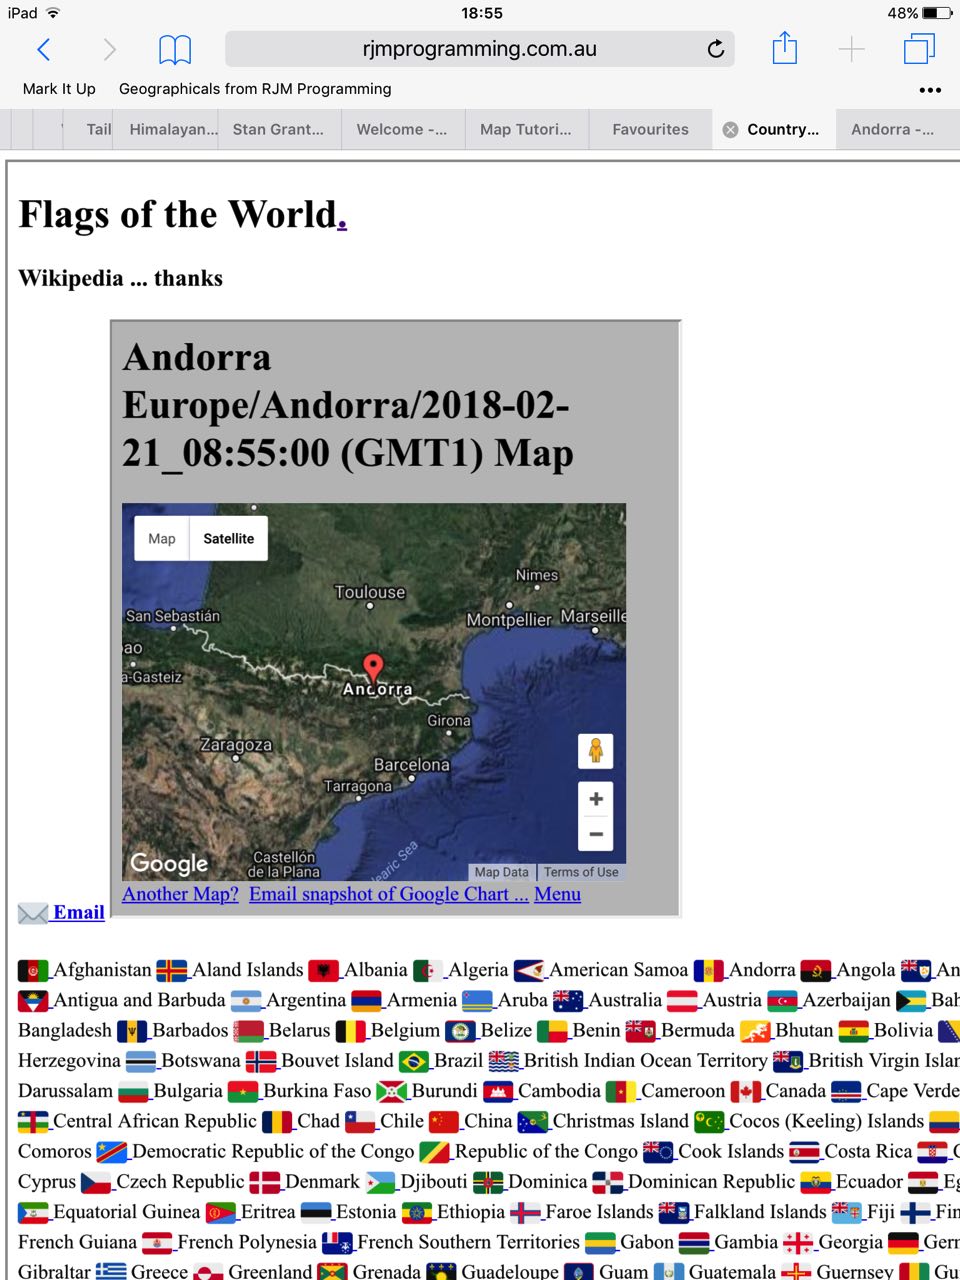
The recent Google Geo and Map Chart Co-ordinate Small Country Tutorial left us with a less than fully functional scenario for mobile platforms, especially regarding the Geo Chart part to the work.
What you find with mobile platforms is that you need to worry about the CSS width values you use, to the extent that sometimes it can look like a piece of functionality is totally missing, whereas it may be hidden, if you developed the web application on a non-mobile platform. As we’ve intimated before at this blog, no matter what, unless cornered, have Javascript functions deal with “width to the nearest pixel” (px) values, but you should try to define your own width values in terms of percentage (%) values in your hardcode CSS or inline CSS (within the HTML, via style property).
Our two favourite Javascript functions to calculate width values in pixel (px) terms are …
The first has a great strength in being able to convert percentage (%) width values to pixel (px), doing especially well on the “body” element. The latter is best used “around the traps” and will avoid the scenarios where the former function returns a value of “auto” (uggggghhhhh). The “auto” can occur when a property is not explicitly defined by the user in their hardcoded CSS or inline CSS, and is a fair enough response … we just wanted to write “uggggghhhhh” really.
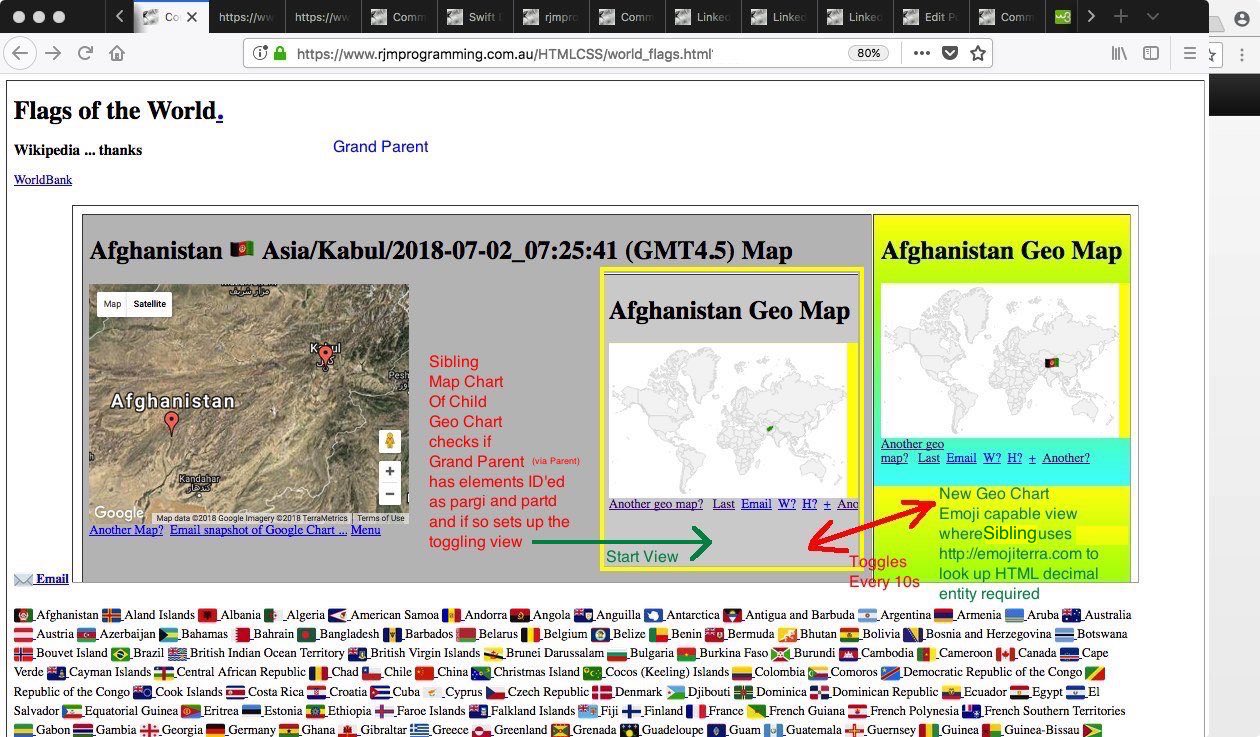
Yet again the “changers” did not involve the top supervisor (Grand Parent) but still involved the Parent and both of the Siblings, that being the Map Chart interface and the Geo Chart interface as per …
- emoticon_keyboard_shortcuts.php PHP changed Parent … to …
- Google Chart Map Chart interface we host here as the map.php‘s PHP changed live run link … Sibling … and the other Sibling …
- Geo Chart interfacing’s live run‘s geo_chart.php changed this way
Did you know?
Why would you find yourself wanting to convert width percentage (%) units to pixel (px) ones? “Scrolling” is the short answer. If you want scrolling in areas off what is going on with the screen of your webpage “at face value” you might want to redefine, in a Javascript DOM way, any supervisory nesting HTML div elements (for example) with pixel (px) defined widths, after an initial percentage (%) definition you made within the “hardcoded” CSS or inline CSS.
What is the CSS friend to scrolling with mobile platforms?
-webkit-overflow-scrolling: touch;
Previous relevant Google Geo and Map Chart Co-ordinate Small Country Tutorial is shown below.
The recent Google Geo and Map Chart Co-ordinate Overlay Tutorial had us overlaying …
- Geo Chart shows country outline … with …
- Geo Chart shows that country’s flag
… via our “World Flags” emoji based supervisory web application.
But what if the country picked by the user is too small to register its linework on your Google Chart Geo Chart? It’s time to call on the second mode of use above, and try to arrange for a tiny SVG circle element to be used. Well, on that point, we do something kind of kludgy. When there are more than one data points of different numerical values, in that latitude and longitude second scenario above, the circle of the lesser value is given a small SVG circle dimension while the other will get a much larger, possibly green, SVG circle element. We arrange for an extra data point with a large numerical value be placed at latitude -90.0 and longitude 0.0, which is at the South Pole but not displayed on a Geo Chart … problem kludged!
This approach can help locate those smaller island nations within the oceans of the world and those smaller European and Asian and African countries.
Again the “changers” did not involve the top supervisor (Grand Parent) but still involved the Parent and the other Sibling, the Geo Chart interface as per …
- Geo Chart interfacing’s live run‘s geo_chart.php changed this way
- emoticon_keyboard_shortcuts.php PHP changed a little just to label (ie. give IDs “parmc” and “partd” respectively) the HTML iframe and the table td cell it is nested by, so that the other Sibling (ie. Geo Chart interfacer) knows to try to make this happen
The Javascript code executed two seconds after the document.body onload event for the Geo Chart interfacer is the main additional change, as below …
   function check_partd_pargi_parmc() {

     if (document.URL.indexOf('aregeographicals=') == -1 && document.URL.indexOf('areplaces=') == -1 && document.URL.indexOf('&data=') != -1 && parent.document) {

      if (parent.document.getElementById('partd') && parent.document.getElementById('parmc') && parent.document.getElementById('pargi')) {

       if (parent.document.getElementById('parmc').src.indexOf('data=') != -1) {

        if (parent.document.getElementById('parmc').src.split('data=')[1].indexOf('~') != -1) {

         var latlongstuff=parent.document.getElementById('parmc').src.split('data=')[1].split('[')[1].split('~')[0];

         var fillallsame=true, initfill='', igss, ipss, pss, gss=document.getElementsByTagName('g');

         for (igss=0; igss<gss.length; igss++) {

           pss=gss[igss].innerHTML.split('</path>');

           for (ipss=0; ipss<pss.length; ipss++) {

             if (pss[ipss].indexOf('<path') != -1) {

               if (pss[ipss].split('<path')[1].indexOf(' fill="') != -1) {

                 if (fillallsame && initfill == '') {

                   if (pss[ipss].split('<path')[1].split(' fill="')[1].split('"')[0].replace('none','url(').indexOf('url(') == -1) initfill=pss[ipss].split('<path')[1].split(' fill="')[1].split('"')[0];

                 } else if (fillallsame && pss[ipss].split('<path')[1].split(' fill="')[1].split('"')[0] != initfill) {

                   if (pss[ipss].split('<path')[1].split(' fill="')[1].split('"')[0].replace('none','url(').indexOf('url(') == -1) fillallsame=false;

                 }

               }

             }

           }

         }

         if (initfill != '' && fillallsame) {

           location.href=location.href.split('#')[0].replace(/\[\~/g,'[' + latlongstuff.replace(/\%2C/g,'|').replace(/\,/g,'|') + '~').replace('&data=','&areplaces=y&data=').replace('[','[-90.0|0.0|~%20~,999999999]%20,%20[');

         }

        }

       }

      }

     }

   }
The Parent’s contribution is to now label the Map Chart HTML iframe element with the ID “parmc”, that is checked for in the code above.
Previous relevant Google Geo and Map Chart Co-ordinate Overlay Tutorial is shown below.
Yesterday’s Google Geo and Map Chart Co-ordinate Emojis Tutorial had an “Eat at Joe’s” type of animation of the two modes of interfacing to Google Chart Geo Chart and Map Chart for the Flags of the World web application, those being …
- Geo Chart shows country outline … toggles (over 10 seconds) with …
- Geo Chart shows that country’s flag
… but today’s work has us overlaying those two at the same time.
We weren’t sure whether two Google Charts could be overlaid within their “parent” iframe elements, but today’s work verifies the answer as “yes”. Maybe there will be implications for other chart work further down the line.
Again the “changers” were the same two as yesterday except that the “parent” needed the bulk of the changes this time for …
- Google Chart Map Chart interface we host here as the map.php‘s PHP changed live run link … Sibling … and the Parent …
- emoticon_keyboard_shortcuts.php PHP changed a little just to label (ie. give IDs “pargi” and “partd” respectively) the HTML iframe and the table td cell it is nested by, so that the Sibling knows to try to make this happen
A “parent” code snippet of change shows our usual “overlay” CSS suspects in play at an iframe onload event Javascript function …
function checkdc(iois) {

  var inw=false;

  dbl=false;

  if (parent.document.getElementById('gmci')) {

    if (parent.document.getElementById('gmci').title == 'dbl') dbl=true;

  }

  if (wassrc == '' && iois != null && document.getElementById('partd')) {

    inw=true;

    wassrc=iois.src.split('&rand=')[0];

  }

  if (dbl && iois != null && document.getElementById('partd') && !document.getElementById('pargialt')) {

    dbl=false;

    parent.document.getElementById('gmci').title='';

    var aconto = (iois.contentWindow || iois.contentDocument);

    if (aconto != null) {

      if (aconto.document) { aconto = aconto.document; }

      if (iois.src.indexOf('aregeographicals=') == -1 && ifw == '') {

         var rect=iois.getBoundingClientRect();

         ift='' + rect.top; //window.getComputedStyle(iois, null).getPropertyValue('top');

         ifl='' + rect.left; //window.getComputedStyle(iois, null).getPropertyValue('left');

         iois.style.opacity='0.5';

         iois.style.position='absolute';

         iois.style.top=ift;

         iois.style.left=ifl;

         issrc=iois.src.split('&rand=')[0];

         document.getElementById('partd').innerHTML+="<iframe id=pargialt style='width:100%;height:650px;z-index:6;opacity:0.6;position:absolute;top:" + ift + ";left:" + ifl + ";' src='" + wassrc + "'></iframe>";

      }

    }

  } else if (document.getElementById('partd') && document.getElementById('pargialt')) {

    if (wassrc.split('&rand=')[0] == issrc.split('&rand=')[0]) {

      issrc=document.getElementById('pargialt').src.split('&rand=')[0];

    }

    if (wassrc != '' && issrc == '' && !inw) {

      issrc=iois.src.split('&rand=')[0];

    }

    if (iois.src.split('&rand=')[0] == wassrc.split('&rand=')[0]) {

      iois.style.zIndex='6';

      document.getElementById('pargialt').style.zIndex='5';

    } else {

      iois.style.zIndex='5';

      document.getElementById('pargialt').style.zIndex='6';

    }

  }

  dbl=false;

  if (parent.document.getElementById('gmci')) {

    parent.document.getElementById('gmci').title='';

  }

}
… and see how the toggling of z-index “priorities” redistributes what “onclick” logic is “exposed” to interface with the user.
How do we allow the user to enter this “overlay” view? Via the ondblclick (double click) event on emoji flag icons, but ondblclick being the unreliable event that it is, we also code for a “click twice within a second” for this same functionality usage, and to satisfy mobile platform usage.
Previous relevant Google Geo and Map Chart Co-ordinate Emojis Tutorial is shown below.
Yesterday’s Google Geo Chart Co-ordinate Emojis Tutorial set up the interfacing PHP web application we have to the Google Chart Geo Chart be capable of displaying emojis. But other applications can find a use for this. Do you remember the blog posting series exemplified by Emoji Name Search Map Chart Weather Tutorial below where we ventured into some emoji flag work that today’s live run link points at, and which you can think of as the Grand Parent of the Parent mentioned below? Thankfully the Grand Parent we were able to leave alone today to make our …
- Geo Chart shows country outline … toggles (over 10 seconds) with …
- Geo Chart shows that country’s flag
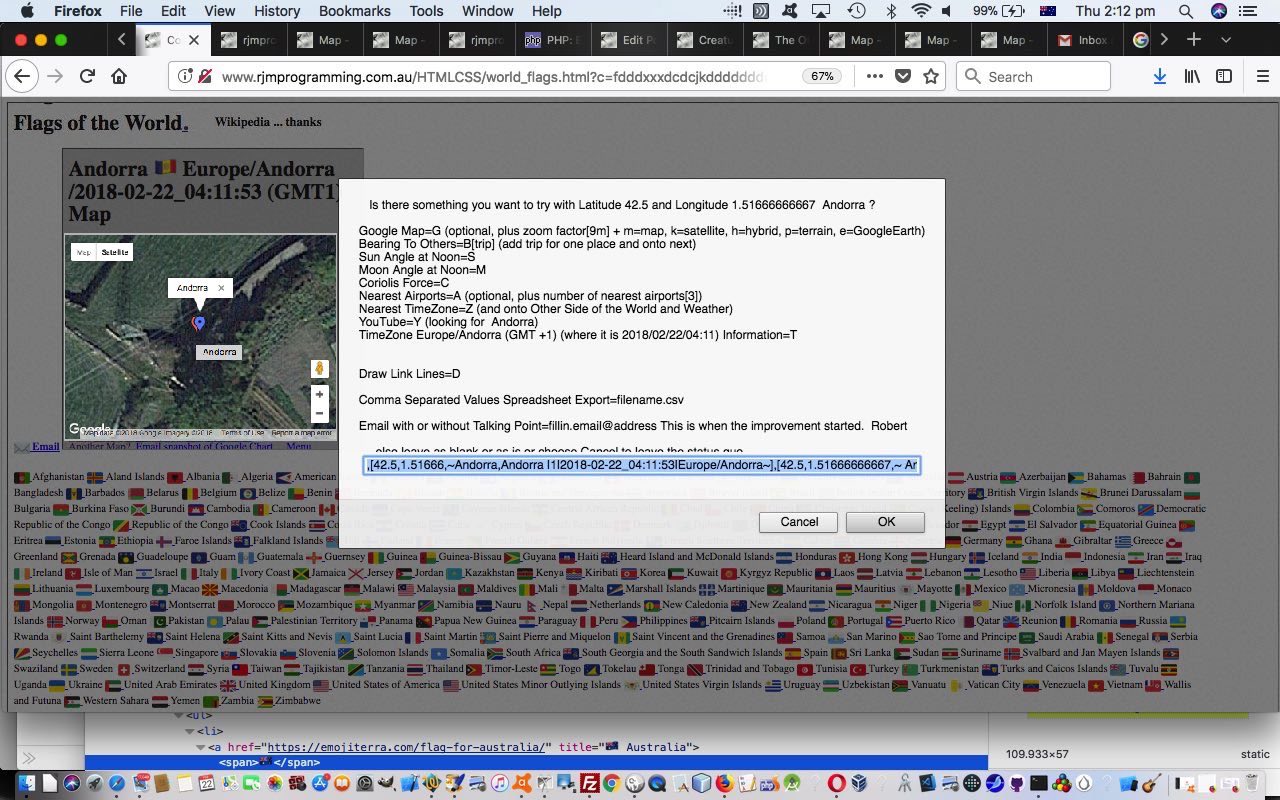
… “view” for the user clicking the flag of a country of interest. The vast bulk of the work changes today happen with the Sibling Google Chart Map Chart today, as much as anything because it already had the logic there to look up the great Emoji Terra website to find …
- an HTML decimal entity for a country flag emoji … and then add to that the …
- latitude and longitude (via PHP TimeZone functionality)
… and you’ve got the wherewithal to make the plan a reality, building on yesterday’s foundations, which required no change. By the way, this work is of most practical benefit for helping out with some sort of positioning for really tiny countries like Andorra, where the country outline is too small to see but the flag emoji can at least position the user roughly as to where Andorra is.
The “changers” were …
- Google Chart Map Chart interface we host here as the map.php‘s PHP changed live run link … Sibling … and the Parent …
- emoticon_keyboard_shortcuts.php PHP changed a little just to label (ie. give IDs “pargi” and “partd” respectively) the HTML iframe and the table td cell it is nested by, so that the Sibling knows to try to make this happen
… where that Sibling populates a $justnumber variable with the Geo Chart HTML decimal entity requirement to feed into some new pretty self contained PHP code as per …
<?php

 if ($justnumber != "") {

   $goodlat=explode(",",explode("[",$GETdata)[1])[0]; // ",[37.4232, -122.0853, 'Work']

   $goodlong=explode(",",explode("[",$GETdata)[1])[1]; // ",[37.4232, -122.0853, 'Work']

   echo "\n function check_partd_pargi() {

     if (parent.document) {

      if (parent.document.getElementById('partd') && parent.document.getElementById('pargi')) {

       if (wasurlgi == '') {

        wasurlgi=parent.document.getElementById('pargi').src;

        // https://www.rjmprogramming.com.au/PHP/GeoChart/geo_chart.php?title= Denmark&onclick=y&width=298&height=194&country=Country&popularity=Intensity&guess=&data=%20[~dk~,66]%20

        var preis=wasurlgi.split('data=')[0].replace('title=%20','title=').replace('title= ','title=');

        isurlgi=(preis + 'data=' + '%20[" . $goodlat . "|" . $goodlong . "|~' + preis.split('title=')[1].split('&')[0].trim() + '~,66]%20').replace('?','?aregeographicals=' + 'http.' + preis.split('title=')[1].split('&')[0].trim().replace(/\%20/g,'_') + '&peninfo=" . $justnumber . "_' + preis.split('title=')[1].split('&')[0].trim().replace(/\%20/g,'_') + '&').replace('popularity=Intensity','popularity=');

        parent.document.getElementById('pargi').src=isurlgi;

        setTimeout(check_partd_pargi, 10000);

       } else if (parent.document.getElementById('pargi').src.indexOf('aregeographicals=') == -1) {

        parent.document.getElementById('pargi').src=isurlgi + '&rand=' + Math.floor(Math.random() * 23456);

        setTimeout(check_partd_pargi, 10000);

       } else {

        parent.document.getElementById('pargi').src=wasurlgi + '&rand=' + Math.floor(Math.random() * 23456);

        setTimeout(check_partd_pargi, 10000);

       }

      }

     }

   } \n";

   echo "\n setTimeout(check_partd_pargi, 4000); \n";

 }

?>
Previous relevant Google Geo Chart Co-ordinate Emojis Tutorial is shown below.
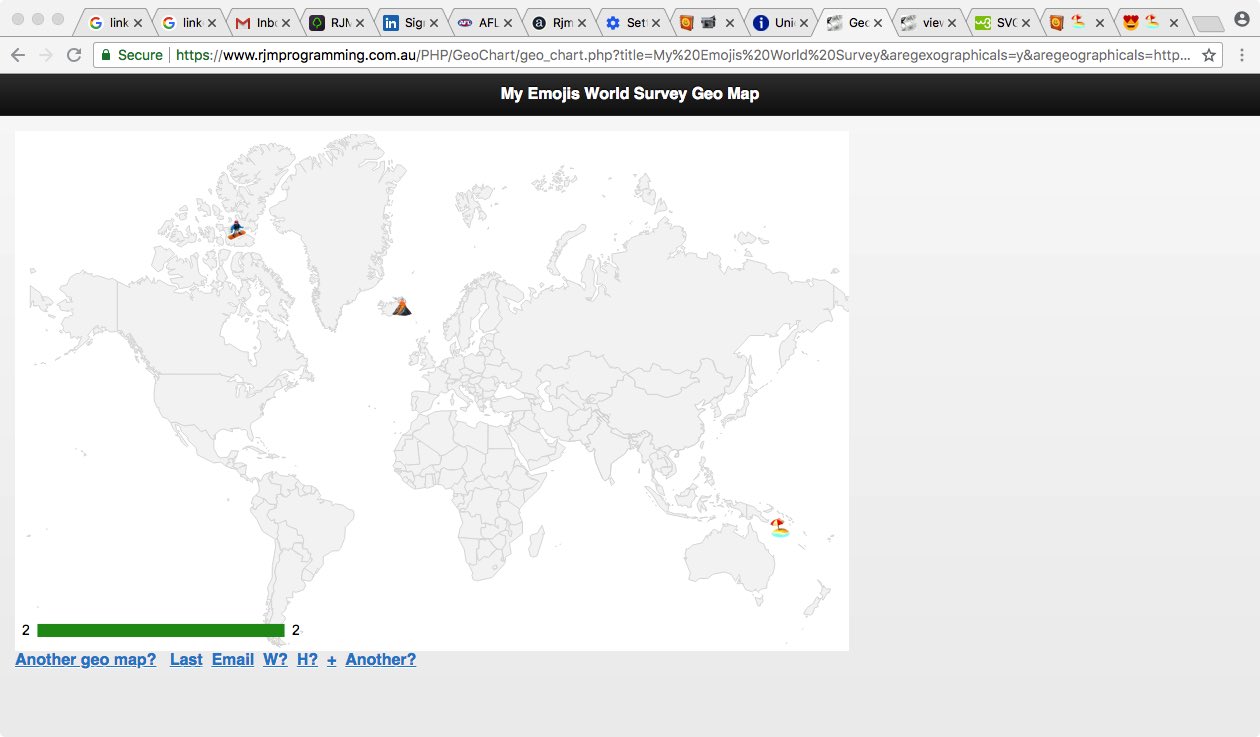
We’ve often wanted to use SVG to display emoji data. This is possible via the SVG text example below …
<text x="0" y="15" fill="red">📹</text>
… that would show a video camera (emoji) … as per 📹 … which beggars the question “Why, now, do you want to use SVG to display emoji data?”. Well, the innards of the Google Chart Geo Chart are SVG and to buck the brilliance and order of the existing (co-ordinate) system of Google SVG would be really silly. Far better is to incorporate SVG text elements like above and populate via the “lead” of the existant “marker” SVG circle elements Google supplies with their Geo Chart, we figure.
Just like with yesterday’s Google Geo Chart Contextualizes Interesting Places Tutorial “applicability” themed blog post we’ll be showing you some applications of this emoji functionality into the future, but for the meantime we’ll show you below just such a call …
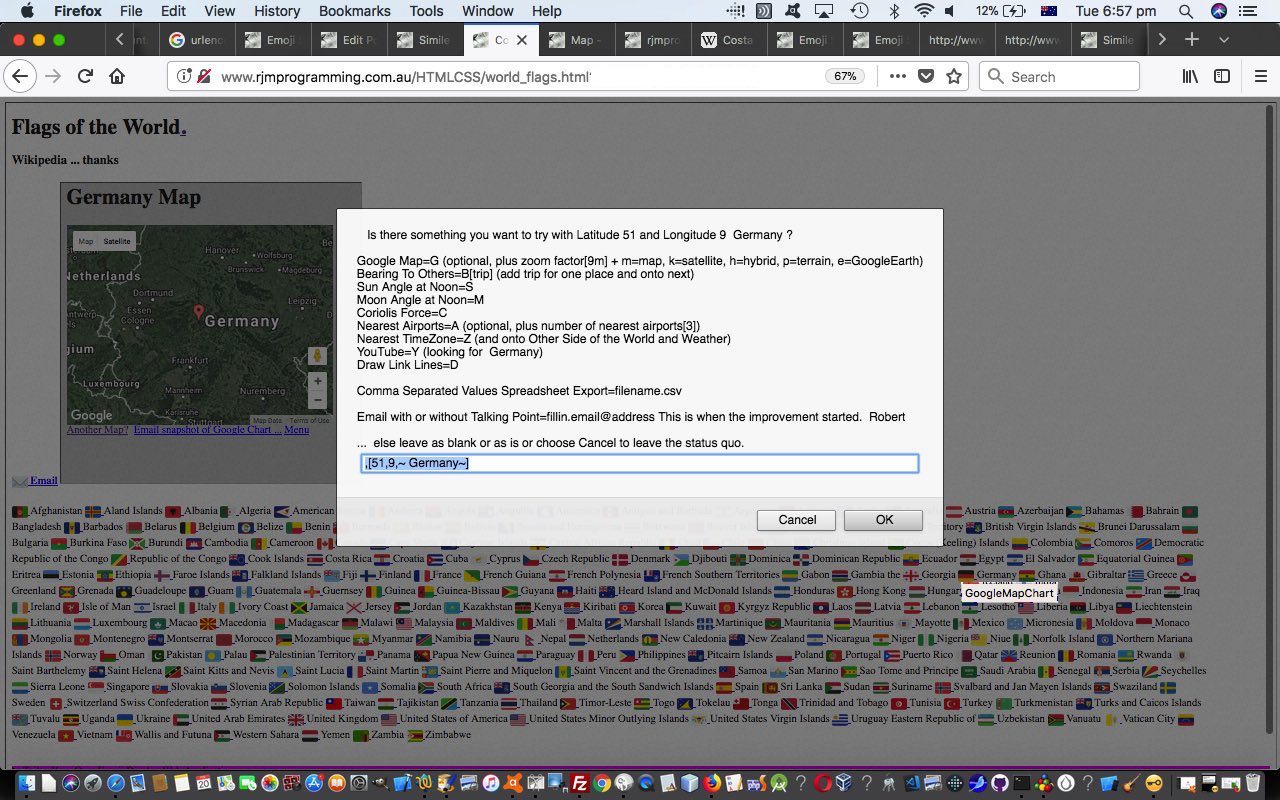
This new “emojis” functionality above we’ve added into our Geo Chart interfacing’s live run‘s geo_chart.php changed this way by the additional title prompt or textbox user advice …
... and/or &aregeographicals=y (or instead of y put an http marker image URL like HTTP://www.rjmprogramming.com.au/PHP/GeoChart/mapc64b.png) for you prefixing Labels by lat|long| values and/or &areplaces=y (or instead of y put a comma separated http marker image URL or placename list (with ,+ usage indicating to plot a line)) for places (prefixable by the number part of an emoji HTML Entity (decimal) eg. 128249 is video camera) rather than countries ...
Try it out for yourself.
Previous relevant Google Geo Chart Contextualizes Interesting Places Tutorial is shown below.
There’s still a bit to do improving the interface to the Google Chart Geo Chart on top of the recent Google Geo Chart Co-ordinate Lines Tutorial functionality extensions, but we’ll go more into that later. Today, it is time to show how all this can be a “tool”, a “contextualizing tool”, for other “where of life” web applications we’ve written around here at RJM Programming.
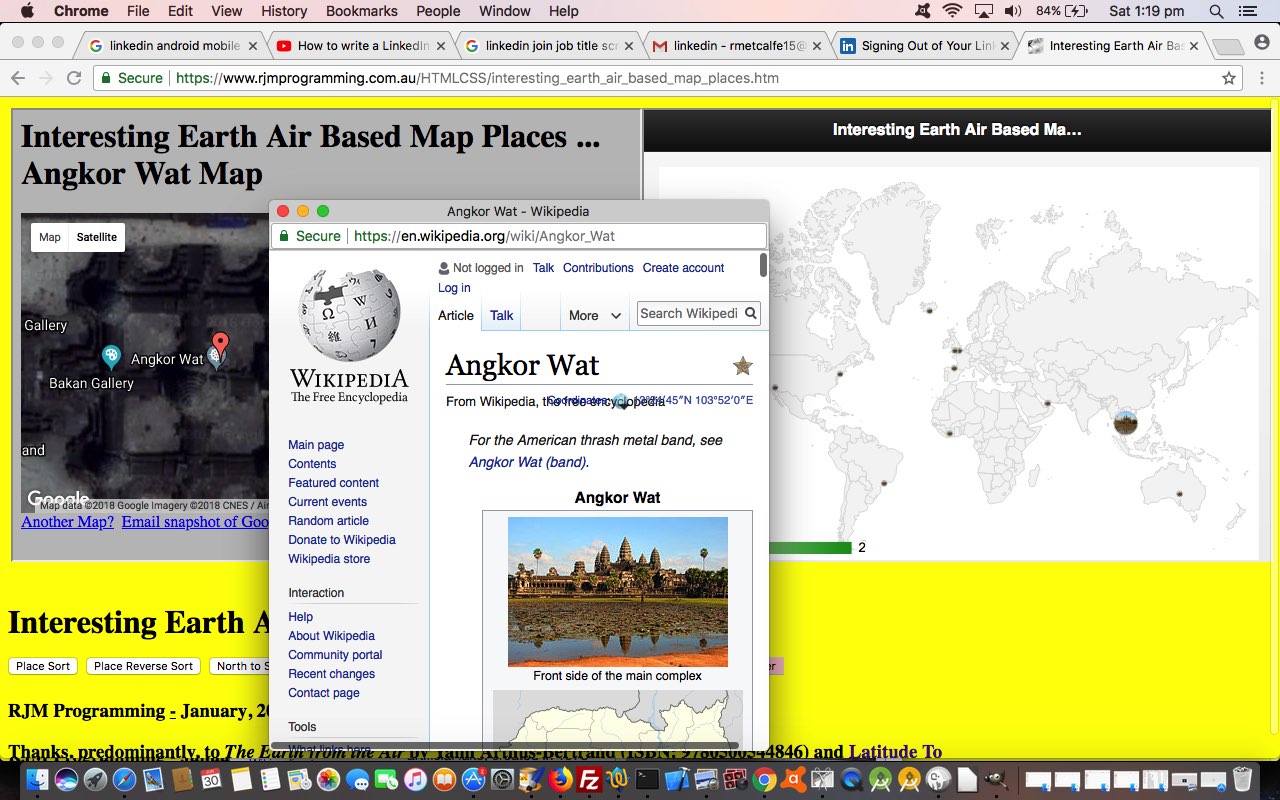
The first cab off the rank for this contextualization improvement is the web application we left off with when we presented Interesting Places Sorting Tutorial in the early part of this year. This web application, inspired by the wonderful photography of the book The Earth from the Air by Yann Arthus-Bertrand (ISBN: 9780500544846) used the Google Chart Map Chart to attempt to recreate what Yann must have seen in his aeroplane, even if a lot of it has changed since.
We really like using the Map Chart but the Map Chart usage alone can be lacking a bit of contextualization in that a lot of us would be lost in terms of what we are looking at relative to … to … the wooooooorrrrrrrllllllddddd, that’s what!
Mars is out of this wooooooorrrrrrrllllllddddd, but the Google Chart Geo Chart sticks to the confines of the wooooooorrrrrrrllllllddddd to give us a decent place on which “to hang our hats”, especially as there are no hat racks that I know of on Mars.
As you use today’s changed HTML and Javascript interesting_earth_air_based_map_places.html‘s live run link you now see an additional top right HTML iframe hosting the newly implemented Geo Chart following your choices around the wooooooorrrrrrrllllllddddd looking for interesting places. It works that the recent choice gets a bigger marker than others chosen earlier, and if that marker contains a localized image it is likely that to click it will navigate you to a relevant Wikipedia webpage where the user can find out more about that place. This additional “onclick” logic augments other existant Map Chart “select” event (the Google Charts equivalent of the “onclick” event) menu functionality that is also available to the user.
Please feel free to give it a go.
Previous relevant Google Geo Chart Co-ordinate Lines Tutorial is shown below.
Lately we’ve been using the variants of the word “plot” a lot. Digitise, plot, overlay are words that Information Technology took up with zeal in the 1970’s and on in particular, because digital mapping became more feasible with the mainframe computer and graphic machine abilities then. Photogrammetry and mapping, surveying and hard copy digitising were growing fields. Back then, programming comments would talk a lot about “move pen” …
- pen up
- pen down
… as the two modes needed to “plot” linework.
Yesterday, am not sure if you noticed but we had in our web address URL arguments “&junk=” which happened in the code to, when the user defines a title suffix such as …
&areplaces=Sydney,Brisbane,Tennent Creek,Cairns,Broome,Hobart
… as a “reasonable ask” we internally reorganized to change the web address URL arguments to …
&aregeographicals=http.Sydney%2Chttp.Brisbane%2Chttp.Tennant_Creek%2Chttp.Cairns%2Chttp.Broome%2Chttp.Hobart&junk=Sydney,Brisbane,Tennant%20Creek,Cairns,Broome,Hobart
.. for … don’t you just love it … “internal use only” and the “&junk=” was there because we hadn’t thought about whether there was a way to reuse what the user actually entered. Then we thought about the possibility of “overlaying” (which we don’t “actually” do today, but it feels like it) lines between places (ie. markers).
Joining all points with lines when you have a lot of points rarely “means” anything much, but suppose we introduced “pen up, pen down” “plotting” logic? You see those commas in the “&junk=” data? Why not have a mechanism to flag a non-default “pen down” by allowing “,+” equate to “pen down” and the default “,” represents “pen up”? And change “&junk=” to “&peninfo=”. Sound like a plan? We hope so.
What can those new “line” SVG line elements help represent? Well, that is up to the user, but we can think of …
- trip planner (which a Google Maps directions mode map we help you out with)
- trip report
- crow fly distance calculator (which we help you out with)
- linkage indicator that the numerical (defaults to “Popularity”) data field can relate to (this numerical data field is mentioned on a marker’s tooltip, and affects the size of the marker)
As you can imagine, with an “overseas trip planner” “pen down” usage can equate to the aeroplane flights or sea voyages or train trips or road trips involved in the overall trip. Discrete point maps are totally “pen up” (default) “&peninfo=” scenarios, where the numerical data field may be the important feature of your map’s data.
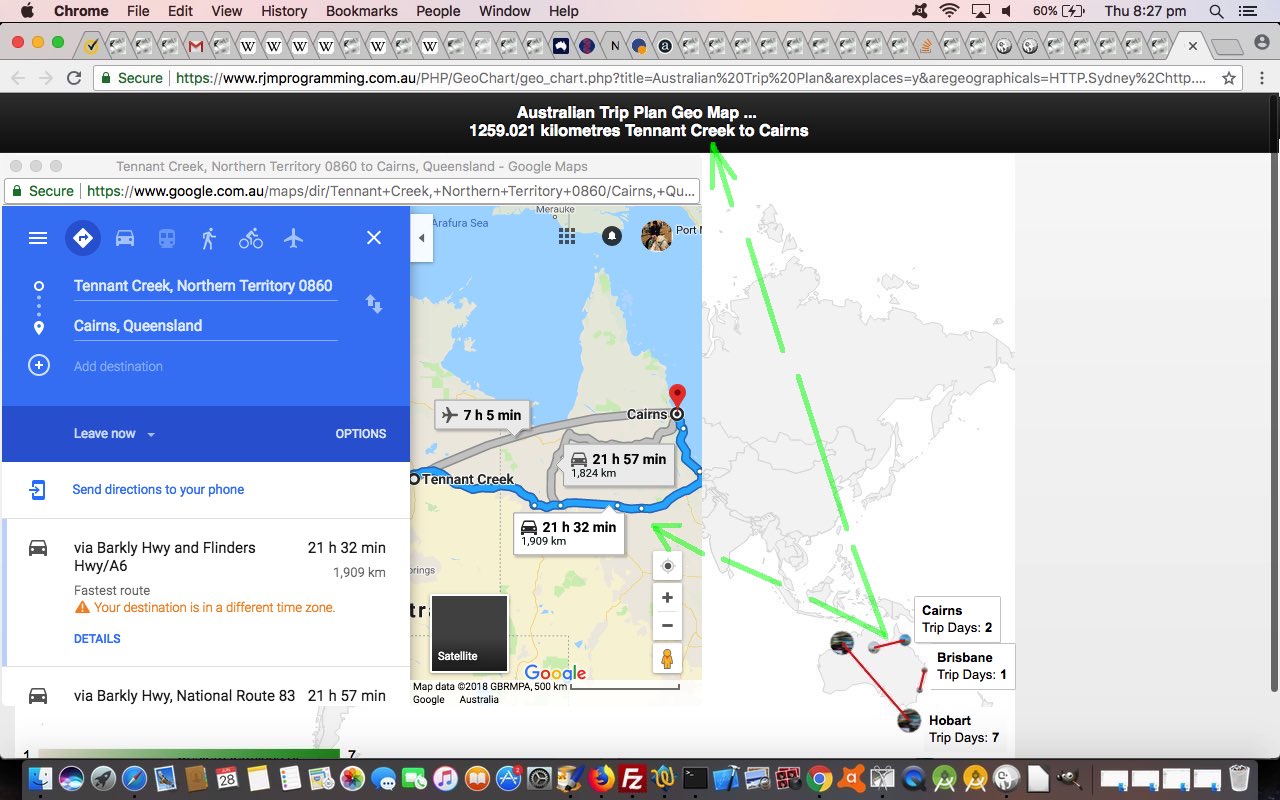
The changes to yesterday’s Google Geo Chart Co-ordinate Ajax Tutorial involved adding SVG line elements and “intelligence” (via a title property) to the existant (g element nested) SVG circle element to store the placename it refers to, whereas the SVG line element title property is created with a “From place to To place” designation. We use events on …
- SVG circle element onclick opens a relevant Wikipedia webpage as a popup window
- SVG line element onmouseover and ontouchdown open a Google Map directions mode webpage as a popup window
The way this can be flagged by the user is again at the title prompt ot textbox using the
... and/or &aregeographicals=y (or instead of y put an http marker image URL like HTTP://www.rjmprogramming.com.au/PHP/GeoChart/mapc64b.png) for you prefixing Labels by lat|long| values and/or &areplaces=y (or instead of y put a comma separated http marker image URL or placename list (with ,+ usage indicating to plot a line)) for places rather than countries ...
Using yesterday’s URLs as a basis, we’ll show you below just such a call …
The new “lines” functionality above we’ve added into our Geo Chart interfacing’s live run‘s geo_chart.php changed this way.
Previous relevant Google Geo Chart Co-ordinate Ajax Tutorial is shown below.
We’re joining …
- placenames … to …
- latitude and longitude geographical (co-ordinates)
… adding onto yesterday’s Google Geo Chart Co-ordinate Marker Tutorial‘s work meaning that the modified title rules regarding this now go …
... and/or &aregeographicals=y (or instead of y put an http marker image URL like HTTP://www.rjmprogramming.com.au/PHP/GeoChart/mapc64b.png) for you prefixing Labels by lat|long| values and/or &areplaces=y (or instead of y put a comma separated http marker image URL or placename list) for places rather than countries ...
… that if used by the user gives our interfacing PHP to the Google Chart Geo Chart the chance to fill in Latitude|Longitude|Placename default values further down the line of Javascript prompt or textboxes that follow, the information gleaned from one of the following sources …
… the first of these can be handled by Javascript arrays, the second one needing the great advice of this wonderful webpage for an Ajax “Claytons Ajax synchronous calling via queue” … ie. asynchronous Ajax feels synchronous via efficient queue usage.
Below we’ll show you just such a call below …
The new “place meets geographicals” functionality above we’ve added into our Geo Chart interfacing’s live run‘s geo_chart.php changed this way.
Previous relevant Google Geo Chart Co-ordinate Marker Tutorial is shown below.
Before we start in on “this new tool helping contextualise some other web applications involving latitude and longitude geographical information” of yesterday’s Google Geo Chart Co-ordinate Plotting Tutorial there are some interesting ways to improve functionality for our interfacing to the Google Chart Geo Chart as per, today …
- allow for “stage 1” tailored markers (for plotting) via http image URLs … and …
- look into large user defined chart widths and heights and the implication of that for scrolling
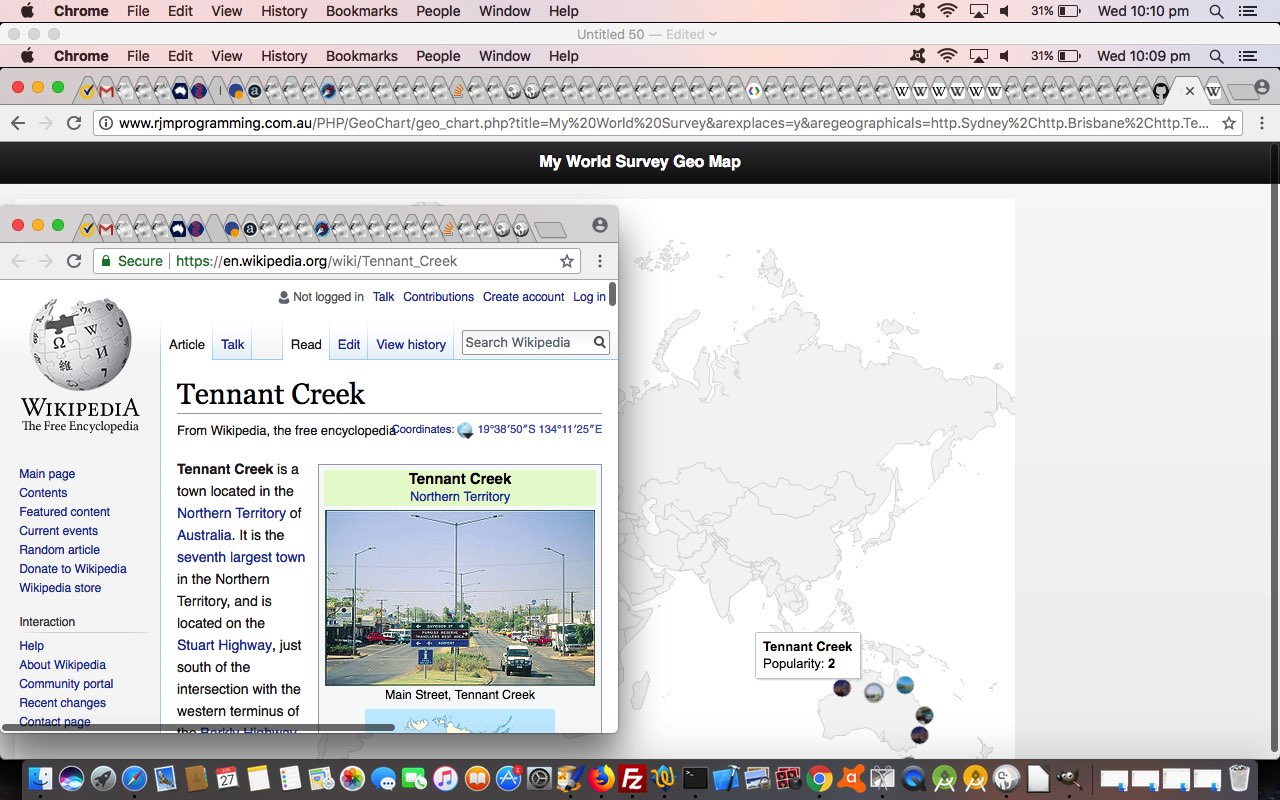
With the tailored markers we’d like to thank this webpage‘s advice, from which “section 7” was our favourite. To get that advice to apply we needed to analyze Google’s SVG element g subelement circle subsubelement markers, to change their “fill” property to something like …
<circle cx = "50%" cy = "50%" r = "35%" fill = "url(#attachedImage)"/>
The way the user implements this is via the title prompt’s &aregeographicals=(http image URL) and we’ll show you just such a call below …
As far as big width and/or height scrolling (implications) goes, we needed to …
- make document.body element width:100%
- apply to two level of div element nesters (id=od1 and od2) of the Geo Chart (id=chart_div) element …
style='display:inline-block;width:800px;overflow:scroll;-webkit-overflow-scrolling:touch;'
… whose 800px width is later (Javascript DOM) changed via … - two seconds after load …
if (document.getElementById('od1')) { document.getElementById('od1').style.width='' + eval(window.getComputedStyle(document.body, null).getPropertyValue('width').replace('px','')) + 'px'; }

if (document.getElementById('od2')) { document.getElementById('od2').style.width='' + eval(window.getComputedStyle(document.body, null).getPropertyValue('width').replace('px','')) + 'px'; }
The new functionality above we’ve added into our Geo Chart interfacing’s live run‘s geo_chart.php changed this way.
Previous relevant Google Geo Chart Co-ordinate Plotting Tutorial is shown below.
Sometimes you read something so useful on the “web”, thanks, it opens your eyes to a whole new way to use something you had already written as a web application, just with some small tweaks.
So it was today, building on the Google Chart Geo Chart work we’d last visited with our PHP interfacing to it mentioned in Google Geo and Intensity Chart via Clipboard Co-ordinates Tutorial.
We already knew it could …
- highlight countries of interest in the world
- highlight some regions of interest within some countries … but discoveries today involved …
- the Google Chart Geo Chart can recognize some place names (it knows) and plot them … or …
- the Google Chart Geo Chart can be supplied latitude and longitude data to plot places on a map of the world
… and it is this latter capability that is most exciting to us. We can see “contextual” benefits interfacing to this new functionality we’ve added into our Geo Chart interfacing’s live run‘s geo_chart.php changed this way.
Stay tuned for this new tool helping contextualise some other web applications involving latitude and longitude geographical information.
Previous relevant Google Geo and Intensity Chart via Clipboard Co-ordinates Tutorial is shown below.
There are synergies among Google Chart …
- Pie Chart (remember the recent Google Pie Chart via Clipboard Co-ordinates Tutorial)
- Geo Chart
- Intensity Map (or chart)
… in that …
- Pie Chart and Geo Chart ask for a non-numerical,numerical set of data sets
- Geo Chart and Intensity Map (or chart) are both concerned with a Country (Code or Name) non-numerical first data set member
- Geo Chart can provide the Intensity Map (or chart) with help regarding an onclick “select” event chance to enhance its functionality
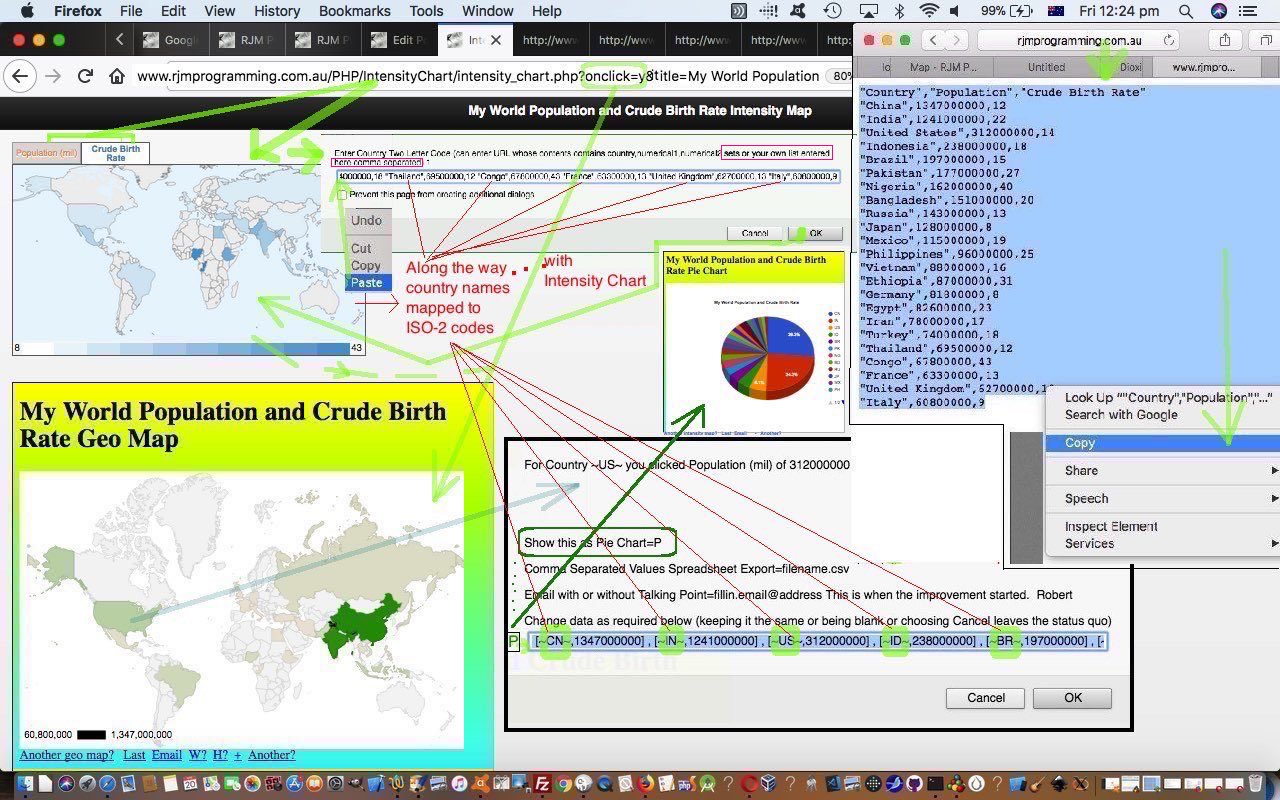
In this regard, it will be no surprise to many of you that with today’s changes to Geo Chart and Intensity Map (or chart) PHP interfacings we take on today can be shown to you, again, using that data source (helper) we’ll present, again, today, below …
If you want to recreate the conditions as shown in today’s tutorial picture …
- copy the contents below …
… - and paste into the 5th prompt (window’s text) box of the Google Charts Intensity Map (or Chart) interfacing live run link
- click OK button … P.S. On first prompt, appending &onclick=y to what you want as an Intensity Map (or Chart) title will work the Geo Chart’s select event logic we harness with this interfacing
- … or, if you are feeling lazy …
http://www.rjmprogramming.com.au/PHP/IntensityChart/intensity_chart.php?title=My%20World%20Population%20and%20Crude%20Birth%20Rate&onclick=y&width=300&height=300&country=Country&area=Crude%20Birth%20Rate&population=Population%20(mil)&data=,%20[~http;China,1347000000,12,India,1241000000,22,United%20States,312000000,14,Indonesia,238000000,18,Brazil,197000000,15,Pakistan,177000000,27,Nigeria,162000000,40,Bangladesh,151000000,20,Russia,143000000,13,Japan,128000000,8,Mexico,115000000,19,Philippines,96000000,25,Vietnam,88000000,16,Ethiopia,87000000,31,Germany,81800000,8,Egypt,82600000,23,Iran,78000000,17,Turkey,74000000,18,Thailand,69500000,12,Congo,67800000,43,France,63300000,13,United%20Kingdom,62700000,13,Italy,60800000,9~,0,0]
There was that “clipboard” and URL compatibility worked on today, and, biting the bullet, getting great help from this useful link, thanks, we improved the Intensity Map (or Chart) input requirements, allowing (quietly) a user to enter whole Country Names, and behind the scenes we’ll try to map these to the ISO-2 character country codes the Intensity Map (or Chart) requires as input data.
The two Google Charts featuring today, we like to think of as two of the “where triplets”, those being, to us …
- Map Chart (remember the recent Google Map Chart via Clipboard Co-ordinates Tutorial live run)
- Geo Chart live run‘s geo_chart.php changed this way
- Intensity Map (or chart) live run‘s intensity_chart.php changed this way
… along with the PHP helper csv.php changed this way.
Previous relevant Google Pie Chart via Clipboard Co-ordinates Tutorial is shown below.
Yesterday’s Google Map Chart via Clipboard Co-ordinates Tutorial was a good precursor to today’s work interfacing this time to the Google Chart Pie Chart.
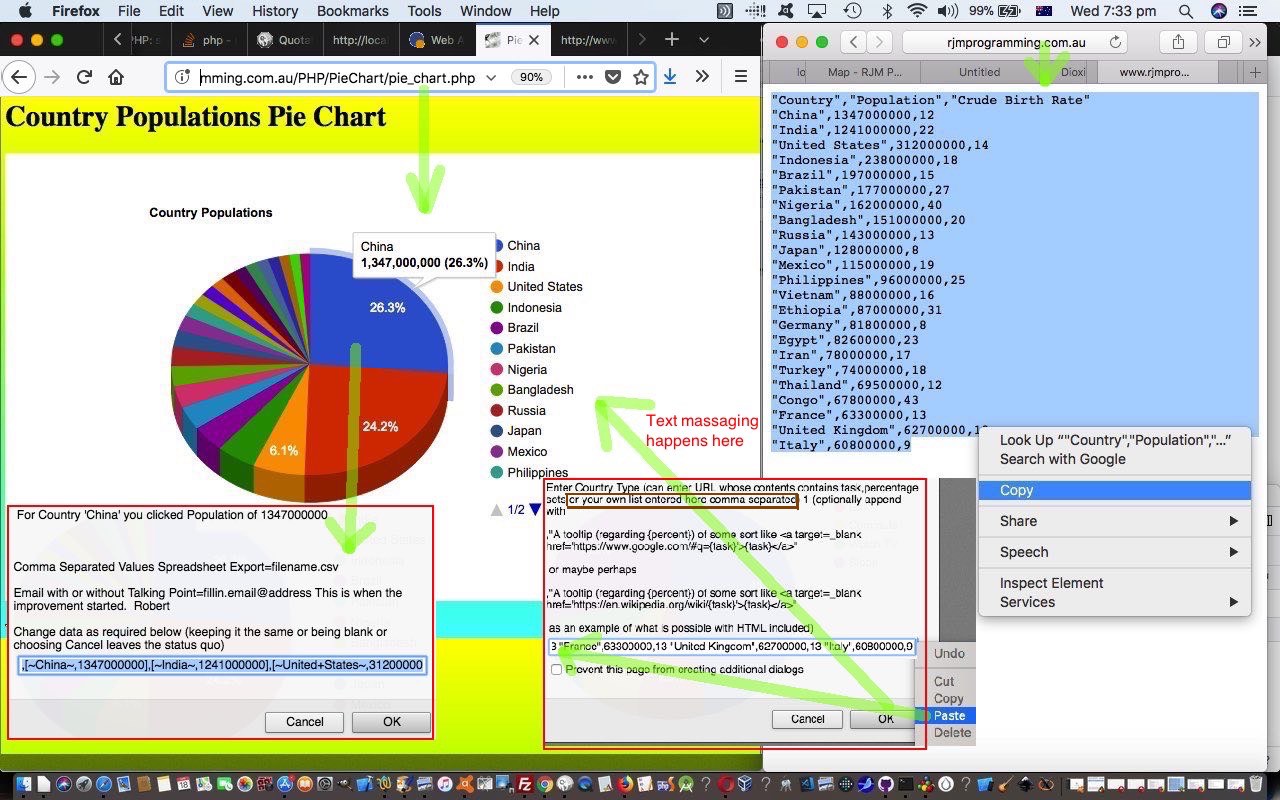
With this work, we’ve started refining the clipboard “smarts” by looking for linefeeds … in Javascript thoughts …
String.fromCharCode(10)
… and as the data exits the Javascript prompt window on its way, before navigating back to the PHP itself, we can check for too many fields to the right of the data, and truncate the clipboard data, as necessary. Along the way, we may be able to reject any header records with this same approach. We can check for no numerical fields here. Business specific logic can be applied here too. With a Pie Chart, the original data, or the user, may be tempted to place “%” after the numerical data, and we can take the opportunity to weed these out. Also, with the character data, it may be delimited by a double quote (ie. within “”), and with this knowledge in mind, we may be able to weed out confusing additional commas that could confuse us with the clipboard comma separated value format of the data.
The lesson here, is to “validate early” and it could be good to “validate often” as well. Real data can be strange indeed.
 function dlp(thisris) {

      if (thisris != null) {

        var commacount=thisris.toLowerCase().replace(/\<\/td\>/g,'  ,  ').indexOf(',');

        if (thisris.toLowerCase().replace('https:','http:').indexOf('http:') == 0) {

             fti=true;

             allowed=true;

             datac=thisris;

        } else if (commacount >= 0) {

             var thatris=thisris.replace(/\ \"/g,String.fromCharCode(10) + '"').replace(/\<tr\>/g,'').replace(/\<\/td\>\<td\>/g,',').replace(/\<\/tr\>/g,String.fromCharCode(10)).replace(/\<\/td\>/g,',').replace(/\,\,/g,',').replace(/\,\,/g,',').replace(',' + String.fromCharCode(10),String.fromCharCode(10));

             var zisok=true, fldq=thatris.split(',');

             var pielines=thatris.split(String.fromCharCode(10));

             if ((fldq[0].replace('"','').trim() + ' ').substring(0,1) < '0' || (fldq[0].replace('"','').trim() + ' ').substring(0,1) > '9') {

              if ((fldq[eval(-1 + fldq.length)].replace('"','').trim() + ' ').substring(0,1) < '0' || (fldq[eval(-1 + fldq.length)].replace('"','').trim() + ' ').substring(0,1) > '9') {

               zisok=false;

              }

             }

             if (!zisok && pielines.length > 1) {

             fldq=pielines[1].split(',');

             zisok=true;

             if ((fldq[0].replace('"','').trim() + ' ').substring(0,1) < '0' || (fldq[0].replace('"','').trim() + ' ').substring(0,1) > '9') {

              if ((fldq[eval(-1 + fldq.length)].replace('"','').trim() + ' ').substring(0,1) < '0' || (fldq[eval(-1 + fldq.length)].replace('"','').trim() + ' ').substring(0,1) > '9') {

               zisok=false;

              }

             }

             }

             if (zisok) {

             while (thatris.indexOf(String.fromCharCode(10)) != -1) {

              var inpies, pied='';

              thatris='';

              var sthatris='';

              for (var ipie=0; ipie<pielines.length; ipie++) {

               inpies=pielines[ipie].split(',');

               if (inpies.length > 1) {

                if ((inpies[0].trim() + " ").substring(0,1) == '"' && (inpies[1].trim() + " ").substring(0,1) == '"') {

                sthatris=pied + inpies[0].trim().substring(1).split('"')[0].trim().replace('%','').replace(',','').replace(',','') + ',' + inpies[1].trim().substring(1).split('"')[0].trim().replace('%','').replace(',','').replace(',','');

                } else if ((inpies[0].trim() + " ").substring(0,1) == '"') {

                sthatris=pied + inpies[0].trim().substring(1).split('"')[0].trim().replace('%','').replace(',','').replace(',','') + ',' + inpies[1].trim().replace('%','').replace('"','');

                } else if ((inpies[1].trim() + " ").substring(0,1) == '"') {

                sthatris=pied + inpies[0].trim().replace('%','') + ',' + inpies[1].trim().substring(1).split('"')[0].trim().replace('%','').replace(',','').replace(',','');

                } else {

                sthatris=pied + inpies[0].trim().replace('%','') + ',' + inpies[1].trim().replace('%','').replace('"','');

                }

                inpies=sthatris.replace(pied,'').split(',');

                if (((inpies[0].trim() + " ").substring(0,1) >= '0' && (inpies[0].trim() + " ").substring(0,1) <= '9') || ((inpies[1].trim() + " ").substring(0,1) >= '0' && (inpies[1].trim() + " ").substring(0,1) <= '9')) {

                thatris+=sthatris;

                pied=',';

                }

               }

              }

             }

             thatris=thatris.replace(/\,\,/g,',');

             fti=true;

             allowed=true;

             datac='http;' + thatris;

             thisris='http;' + thatris;

             }

        }

      }

      return thisris;

 }
Our PHP Google Chart Pie Chart interface is pie_chart.php changed this way for today’s work, that you can try yourself at this live run link.
Our PHP helper csv.php changed this way for today’s work.
If you want to recreate the conditions as shown in today’s tutorial picture …
- copy the contents below …
… - and paste into the 4th prompt (window’s text) box of the Google Charts Pie Chart interfacing live run link
- click OK button … P.S. On first prompt, appending &onclick=y to what you want as a Pie Chart title will work the Pie Chart’s select event logic we harness with this interfacing
- … or, if you are feeling lazy …
https://www.rjmprogramming.com.au/PHP/PieChart/pie_chart.php?title=Country%20Populations&onclick=y&task=Country&desc=Populations&data=,%20[~https;China,1347000000,India,1241000000,United%20States,312000000,Indonesia,238000000,Brazil,197000000,Pakistan,177000000,Nigeria,162000000,Bangladesh,151000000,Russia,143000000,Japan,128000000,Mexico,115000000,Philippines,96000000,Vietnam,88000000,Ethiopia,87000000,Germany,81800000,Egypt,82600000,Iran,78000000,Turkey,74000000,Thailand,69500000,Congo,67800000,France,63300000,United%20Kingdom,62700000,Italy,60800000~,100]
Previous relevant Google Map Chart via Clipboard Co-ordinates Tutorial is shown below.
Yesterday’s Google Map Chart via URL Co-ordinates Tutorial added functionality directed towards a …
- secondary data source, that you access … but today we are going to extend that functionality to support a …
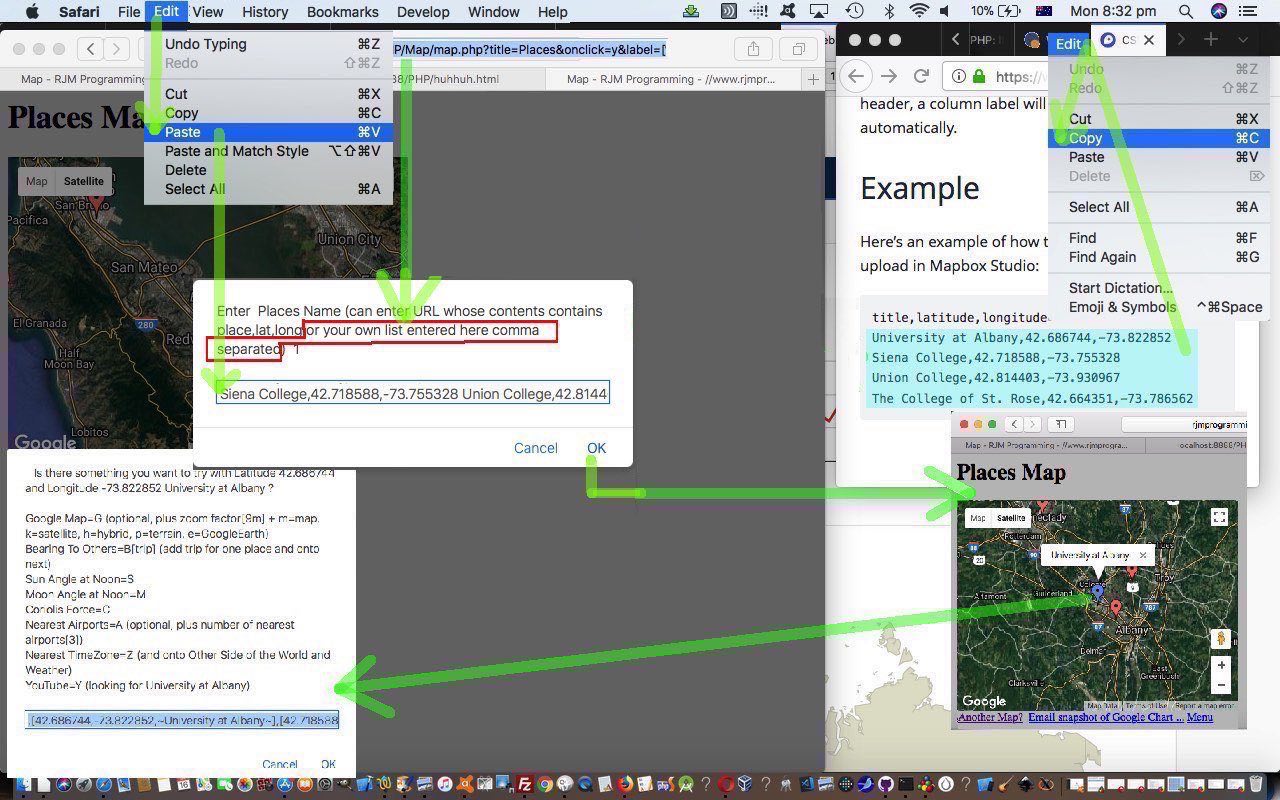
- primary data source that you enter a comma separated values list for the [place,lat,long] data sets (yourself, via the computer keyboard) … as well as a …
- “subset” of a secondary data source, that you access, more than likely, using you computer device’s clipboard
The invention of the clipboard was a brilliant step. Before it, we were so beholden to programmers to get tailored work done, and though it’s sad that so many of you get on without us (cough, cough) … well … we were being overworked anyway … and there was that project to “make the morning breakfast coffee before you even know you wanted it” to get onto … finally.
Perhaps we all forget now what the clipboard has meant, for so many of us. It is the freedom of “copy and paste”, the individualism tool of content creation.
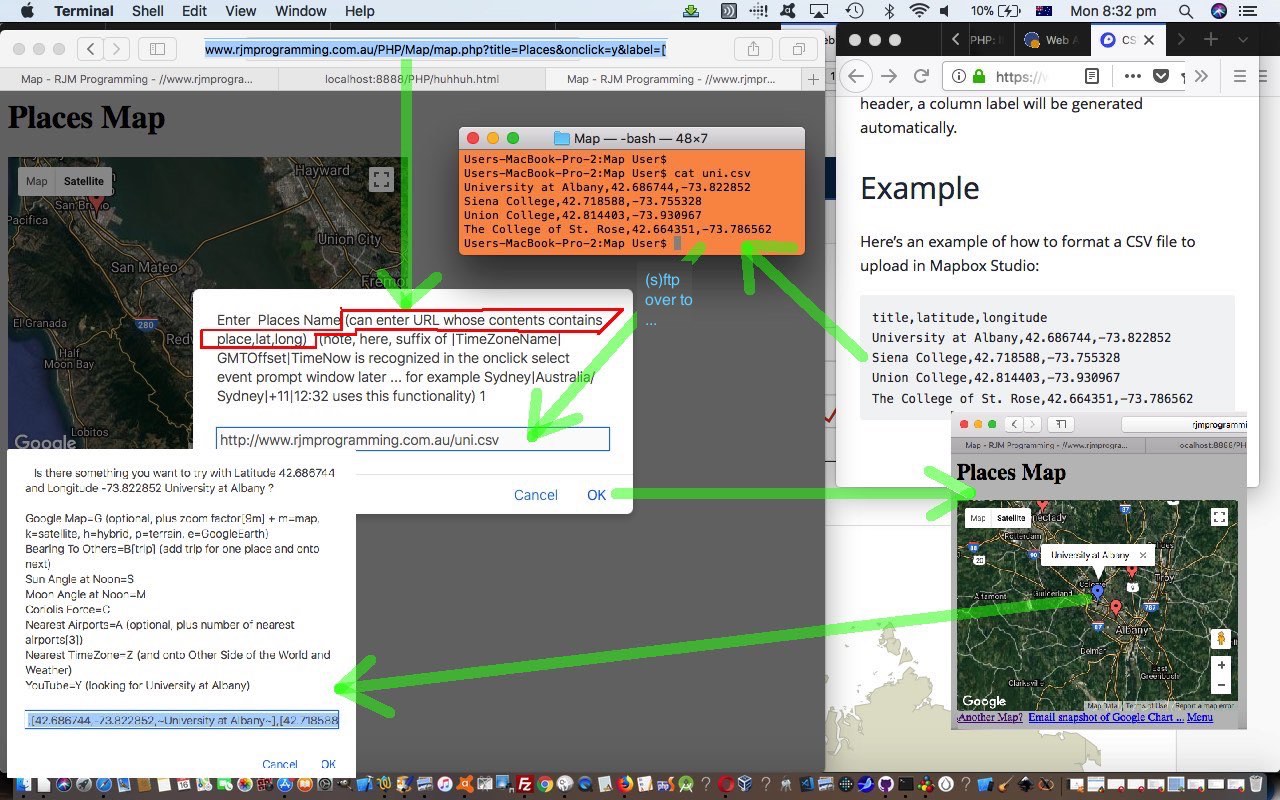
Yesterday’s functionality idea is a case in point. “Secondary data sources” are, by definition, out of your control, as to what the content of a web page is. Notice how, yesterday, we made some content that was (s)ftp transferred over to the rjmprogramming.com.au domain via … yes, you guessed it …
- me copying (off the mapbox.com website, thanks, as part of the contents of a webpage) … then …
- pasting that content into a csv text file on the MacBook Pro computer we’re using (locally) … and then …
- (s)ftp transferred over to rjmprogramming.com.au domain to represent a …
- URL usable within the functionality of our Google Chart Map Chart interface we host here as the PHP map.php‘s live run link
But there you are, an intelligent human, able to determine for yourself the data you are interested in (quite often not the entire contents of a webpage, as yesterday’s work is ideally asking for), so that being the case, the map.php modifications to PHP code we’ve made today, make it possible for (the much simpler) …
- me copying (off the mapbox.com website, thanks, as part of the contents of a webpage) … then …
- pasting that content within the functionality of our Google Chart Map Chart interface we host here as the PHP map.php‘s live run link
If you have the clipboard as your friend, your time around computers becomes so much more enjoyable, and flexible, and within your control. We, as programmers, need to think, on occasions, or encourage, on occasions, how the user is likely to use the clipboard, in conjunction with our applications. As you might surmise, that can be a pretty unpredictable “artform”.
Our PHP helper csv.php changed this way for today’s work.
Previous relevant Google Map Chart via URL Co-ordinates Tutorial is shown below.
The last blog posting referring to the Google Chart Map Chart interface we host here was with Emoji Name Search Map Chart Weather Tutorial, but today we are presenting a major functionality addition with implications for other Google Chart interfacing PHP codesets here. We are allowing the user at the second prompt to take the data from a URL data source containing CSV (comma separated values) place,latitude,longitude data or those three fields in an HTML table element contents perhaps.
We’ve added the ability to “map” (tee hee) …
HTTP://www.rjmprogramming.com.au/PHP/Map/map.php?title=Where%20We%20Are&onclick=y&label=['Lat',&value='Lon',%20'Name']&data=,%20[-33.90743410270099,151.17646964910696,~Parent1~]%20,%20[-33.907440603083124,151.1764659419197,~Parent2~]
… from a CSV data URL look with contents …
-33.907434102700991,151.17646964910696,Parent1

-33.907440603083124,151.17646594191973,Parent2
… that if placed at rjmprogramming.com.au’s Document Root and called parent.csv then a URL of …
HTTP://www.rjmprogramming.com.au/PHP/Map/map.php?title=Where%20We%20Are&onclick=y&label=['Lat',&value='Lon',%20'Name']&data=,%20[0.00000001,0.0000000,~HTTP://rjmprogramming.com.au/parent.csv~]
… could be a shortcut to that first URL same look. You can see another example using data from mapbox.com, thanks, show the scenario our tutorial picture illustrates.
The way this “mapping” (tee hee, tee hee) of URLs can happen is that the PHP supervisor map.php (changed this way and which you can try with this live run link) “includes” (ie. calls) …
include "../csv.php";
… a (now bigger, and more functional) csv.php (changed this way) does its best to handle a few looks to the CSV or tabular data, with code to allow for …
- CSV data ordered place,latitude(decimal),longitude(decimal) or latitude(decimal),longitude(decimal),place or place,longitude(decimal),latitude(decimal) or longitude(decimal),latitude(decimal),place
- CSV data ordered place,latitude(W/S/E/N_deg_min_secs),longitude(W/S/E/N_deg_min_secs) or latitude(W/S/E/N_deg_min_secs),longitude(W/S/E/N_deg_min_secs),place or place,longitude(W/S/E/N_deg_min_secs),latitude(W/S/E/N_deg_min_secs) or longitude(W/S/E/N_deg_min_secs),latitude(W/S/E/N_deg_min_secs),place
- HTML tabular data ordered place,latitude(decimal),longitude(decimal) or latitude(decimal),longitude(decimal),place or place,longitude(decimal),latitude(decimal) or longitude(decimal),latitude(decimal),place
- HTML tabular data ordered place,latitude(W/S/E/N_deg_min_secs),longitude(W/S/E/N_deg_min_secs) or latitude(W/S/E/N_deg_min_secs),longitude(W/S/E/N_deg_min_secs),place or place,longitude(W/S/E/N_deg_min_secs),latitude(W/S/E/N_deg_min_secs) or longitude(W/S/E/N_deg_min_secs),latitude(W/S/E/N_deg_min_secs),place
Previous relevant Emoji Name Search Map Chart Weather Tutorial is shown below.
If you’ve been studying the code of our hierarchy for our Emoji Flags of the World web application …
- grandparent Emoji Flags of the World live run, with this HTML and Javascript world_flags.html HTML and Javascript, unchanged from yesterday’s Emoji Name Search Timezone Tutorial … supervising …
- parent emoticon_keyboard_shortcuts.php PHP partner, also unchanged from yesterday, because, today, our focus is on what this supervises …
- child map.php PHP that changed in this way (and which is an independent Google Chart Map Chart interfacing live run in its own right)
… am sure you’ll have noticed how bottom heavy it is on the “child” as far as functionality goes. What we like to call “the hard working duck syndrome”. Partly, that is because we see the Google Charts Map Chart interface we have as being a very useful “meeting point” with interfacing web applications tending towards the “where” of life.
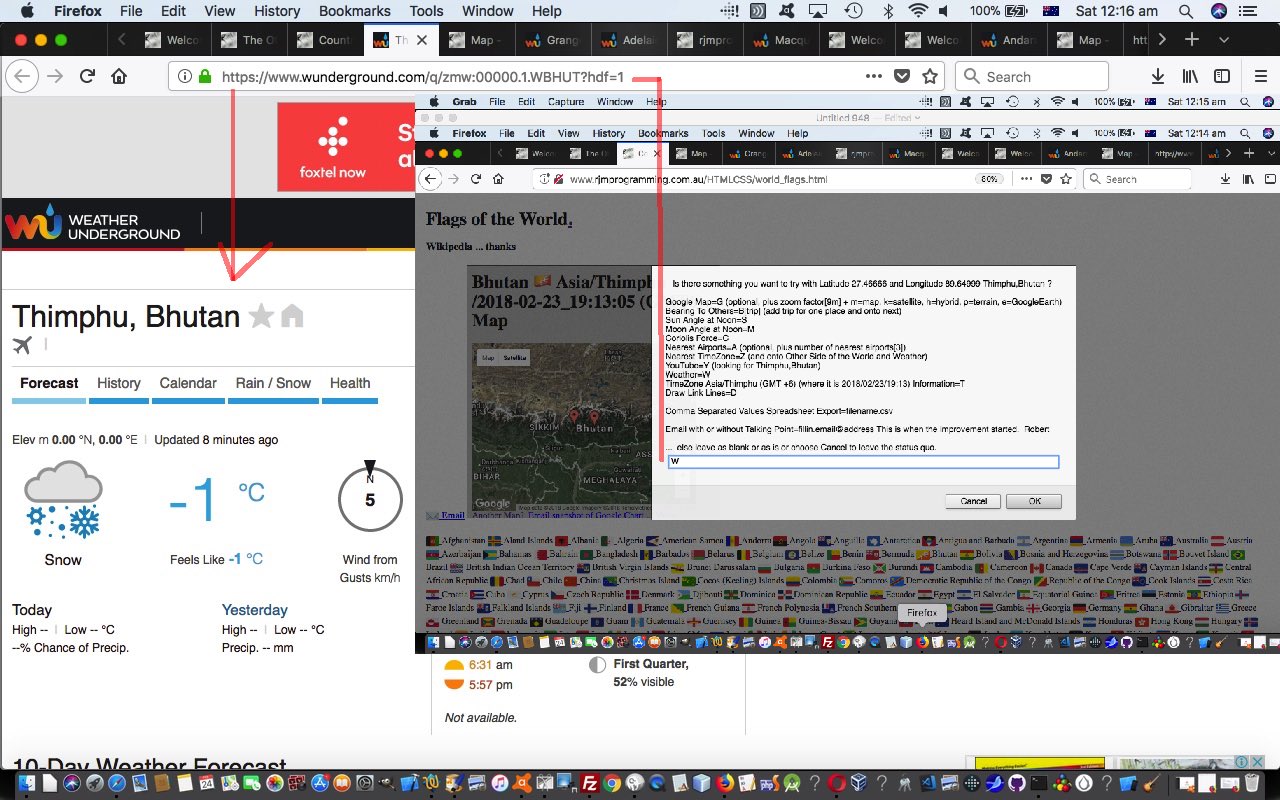
Today’s job, extending yesterday’s Emoji Name Search Map Chart Tutorial is to add Map Chart interfacing to the great Weather Underground and its great API service for autocomplete name searches for weather (and hurricane) information … thanks.
The changes are again just to that “hard working duck” Map Chart interface “child” web application, as for yesterday’s work. We were very keen to do this, especially because …
- Weather Underground database works most succinctly with Placename, Country identification pairs, better than for the …
- Continent/Placename setup of (PHP) Timezones
… and so, while we are going to so much trouble scouring Timezone places for their associated Countries, it is a really good opportunity to slot in some Weather API interfacing to our Emoji World Flags web application, which is starting to be looking better and better as a trip planning aid.
Previous relevant Emoji Name Search Map Chart Tutorial is shown below.
We now have a three tier functionality hierarchy for our Emoji Flags of the World web application …
- grandparent Emoji Flags of the World live run, with this HTML and Javascript world_flags.html HTML and Javascript, unchanged from yesterday’s Emoji Name Search Timezone Tutorial … supervising …
- parent emoticon_keyboard_shortcuts.php PHP partner, also unchanged from yesterday, because, today, our focus is on what this supervises …
- child map.php PHP that changed in this way (and which is an independent Google Chart Map Chart interfacing live run in its own right)
… all made so very possible when web applications sit in the same domain and you utilize the HTML iframe element.
We wanted to enhance its integration by …
- adding in “locality pins” for all PHP Timezone places in the country of interest
- involving Emoji flags in the Map Chart title (rather than as a pin) because Emojis, after all, are like textual data, not HTML (but can use HTML Entity representations in both)
To work the latter of these we called on recent experience with the “Fifth Beatle” discussion in Emoji Name Search Primer Tutorial …
We got quite excited recently with Rainbow Games PHP Emoji Tutorial when we added a (fourth Beatle) emoji helper, called Emoji Terra, into the mix of tools to gather emoji information. Today, we’ve got a new Emoji Search web application that introduces a new (fifth Beatle(?)) emoji helper tool to add into the “how we see it” mix …
We found that Emoji Terra could be used in our map Chart interfacing PHP to look up the HTML Decimal Entity for a flag of a country via the URL pattern …
HTTP://www.emojiterra.com/flag-for-[CountryNameSpacesMakeMinusSignsLowerCase]
So even though Google Chart Map Charts do not allow HTML in their titles there is nothing stopping you putting in an HTML Entity Emoji coding.
As far as the former goes, we again called on the PHP DateTimeZone class to scrutinize the first Timezone in the Map Chart title, derive its ISO 2 letter Country Code, and look through the array list of (PHP) Timezones to garner latitude and longitude, time now, and GMT offset information necessary to improve the “where” and “when” aspects of our Google Chart Map Chart interfacing.
Previous relevant Emoji Name Search Timezone Tutorial is shown below.
Yesterday’s Emoji Name Search Map Tutorial was a step in the direction of “where” functionality, but because PHP teams up with the supervisory HTML “Emoji World Flags” web application, to make all this happen, there is the opportunity to add interest by adding a “when” aspect to how it works.
As we’ve said many times now, should you have access to PHP, you also have access to its DateTimeZone class where Timezones can be linked to ISO 2 letter Country Codes, useful as an integration point as of recent times when we introduced ISO 2 letter Country Codes to today’s (supervisory) live run‘s world_flags.html HTML and Javascript code.
But it is not HTML code that changes today. It is its PHP partner emoticon_keyboard_shortcuts.php changed in this way, that arranges that its call of Google Charts Map Chart passes across a new URL …
&ccode=[ISO 2 letter Country Code]
… argument that uses a new PHP function as below (arrays shortened for practicality purposes) …
<?php

 function inctycodecheck($incd, $sofar) {

    $nearname=["Africa/Abidjan","Africa/Accra", ... ]; // array of Timezone names

    $retv="";

    $retd="";

    $otz = new DateTimeZone("UTC");

    $jj=0;

    $origin_dt = new DateTime("now", $otz);

    for ($best1=0; $best1<sizeof($nearname); $best1++) {

        try {

        $tz = new DateTimeZone($nearname[$best1]);

        $cloc = $tz->getLocation();

        $ctrycode = $cloc['country_code'];

        if (strtoupper($incd) == strtoupper($ctrycode)) {

         $remote_dt = new DateTime("now", $tz);

         $offset = ($tz->getOffset($remote_dt) - $otz->getOffset($origin_dt)) / 3600;

         $newp=$retd . $nearname[$best1] . "/" . $remote_dt->format('Y-m-d_H:i:s') . " (GMT" . $offset . ")";

         $huhs=explode(" (GMT" . $offset . ")", $retv);

         if (sizeof($huhs) == 2) {

           if (explode("/", $newp)[0] != explode("/", explode(",", $huhs[0])[-1 + sizeof(explode(",", $huhs[0]))])[0]) {

             $huhs=explode("youwillneverfindthis", $retv);

           }

         }

         if (($sofar + strlen(urlencode(($retv . $newp)))) < 950 && $jj < 10 && sizeof($huhs) == 1) {

          $retv.=$newp;

          $retd=",";

          $jj++;

         }

        }

        } catch (Exception $exc) { }

    }

    return $retv;

 }

?>
… called later in the code with the new block of code as per …
<?php

       $urlis=urldecode($_GET['gmc']); // URL to point at template Google Chart Map Chart call for Country of interest

       if (strpos($urlis, ',,') !== false) {

       $urlis=str_replace(",,", urlencode($latis . "," . $longis . ","), $urlis);

       } else {

       $urlis=str_replace(urlencode(",,"), urlencode($latis . "," . $longis . ","), $urlis);

       }

       if (isset($_GET['ccode'])) {

        $urlis=str_replace("&onclick=", "%20" . urlencode(inctycodecheck(urldecode($_GET['ccode']), (strlen($urlis) + 3))) . "&onclick=", $urlis);  // appends to the title argument

       }

if (isset($_SERVER['HTTPS'])) {

    if ($_SERVER['HTTPS'] == "on") {

       header("Location: https:" . $urlis);

    } else {

       header("Location: http:" . $urlis);

    }

} else {

       header("Location: http:" . $urlis);

}

       exit;

?>
Previous relevant Emoji Name Search Map Tutorial is shown below.
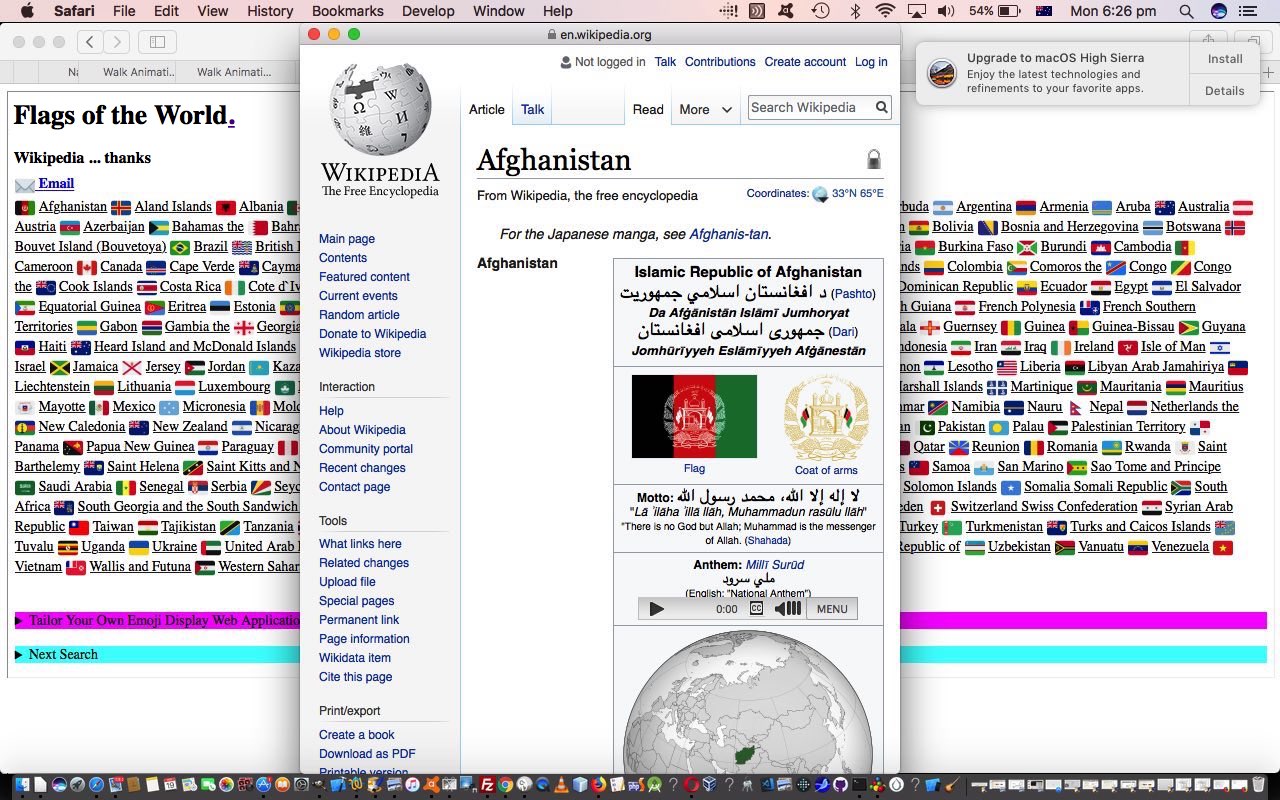
Yesterday’s posted data Emoji Name Search Posting Tutorial functionality opened the door to “where” web application (software) integration, because the wonderful Wikipedia has compiled Latitude,Longitude co-ordinate pairs for those countries, and that is our foot in the door to place an HTML a link under the Emoji flags, that points to our favourite “where” interfacing tool, the Google Charts Map Chart.
Because the Map Chart and Emoji Flag web application share the same domain we can keep this functionality on this same Emoji Flag webpage in an …
- HTML iframe element name=gcmi id=gcmi initially invisible … “populated by” …
- HTML a element target=gcmi href=[URL to Map Chart for Country of Interest] onclick=aoc(); …
function aoc() {

   document.getElementById('gmci').style.width='450px';

   document.getElementById('gmci').style.height='450px';

   document.getElementById('gmci').style.display='inline-block';

}
Another way to zoom around the world online!
You can try the Emoji Flags live run (with underlying world_flags.html changed this way) or the other Emoji functionalities that have this live run and/or its PHP source code emoticon_keyboard_shortcuts.php changed in this way to extend its software integration capabilities.
Previous relevant Emoji Name Search Posting Tutorial is shown below.
Yesterday’s Emoji Name Search Tailoring Tutorial was suitable for data sets of that smaller size able to be handled by the web server limit of URL length. But what if there are too many data items in your data set to be handled by PHP’s $_GET[] array URL ? and & delimited URLs? We, having PHP serverside code at our disposal, can turn to $_POST[] (HTML) method=POST form action=[here’sLookingAtYouKid] scenarios, to get around this issue. The unfortunate side effect of this is that the HTML mailto: a link (email client) method of sharing your Emoji web application relies on that $_GET[] approach, that is, unless you wrote a whole “bespoke” web application to help out, like we do today for our new Emoji “World Flags” web application with this live run, with this HTML and Javascript world_flags.html source code.
That new “supervisor” being a guinea pig idea into the $_POST[] thinking, we add some HTML form element input type=text additions to allow for, out of …
- Emoji look class … and …
- Wording next to Emoji … and …
- URL of Wording’s link, be that substituted or appended
… mapped values, optionally, off a newly offered HTML form element input type=text for this mapped comma or blank separated word list.
Perhaps, now, you “long data set thinkers” want to try the live run and/or its PHP source code emoticon_keyboard_shortcuts.php changed in this way to extend its data set size capabilities.
Previous relevant Emoji Name Search Tailoring Tutorial is shown below.
Information Technology is full of “buzz words”, and am sure you wince at some to all of them yourselves. That’s a bit why am using “Tailoring” rather than …
- sharing
- personalization
… to give you a slumberrest from having to look under struck throughdeleted wording to look for hidden “buzz words”terminology that makes your harehair sit upstand watchingon Bugs Bunnyend.
We think, perhaps, that emojis can be important for young “would be” programmers to launch into. Personally wonder how many “would be” programmers give the game up far too soon just because they don’t have those graphics skills, well, with emojis, a lot of that hard work, in miniature, has been done for you by some pretty creative people, so why not enjoy the fruits (chortle, in context, chortle) of their labour and start developing your own web applications to use them. Daily, their use is increasing, as are the sharing of access methods.
In today’s extension to the functionality started with yesterday’s Emoji Name Search Primer Tutorial we separate the Emoji Terra aspects to how it works and allow the user to …
- supply an Emoji Word List of interest
- perhaps supply a heading and subheading to describe the “concept” of that list
- supply either a …
- URL prefix … or …
- URL with the ~ (tilde) character where you want, substituted, your emoji name
… to be a navigation destination in that similar new window navigation we used to access Emoji Terra …
- presenting all this in an HTML form action=[here’sLookingAtYouKid] method=GET …
- that method=GET opening the door to be able to offer an email client engine method to
“share”email somebody the link to a screen that looks like the one you’re seeing
Of course, we’d like you to find some of your own such Emoji Display Dynamically Created Web Applications yourself, but to encourage, we, in the web application, today, identified two ideas, namely …
- Fruit and Vegetables via Wikipedia at https://en.wikipedia.org/wiki/ as a prefix … and …
- Astrology via Cafe Astrology at https://cafeastrology.com/~dailyhoroscope.html via ~ (tilde) character substitution
… each of which (and any you make will also) feature a link to the HTML mailto: a link out through the email client and to your recipient who can click the email link to “share”compare notes.
Perhaps, now, you want to try the live run and/or its PHP source code emoticon_keyboard_shortcuts.php changed in this way to extend its functionality, involving a reveal favourite of ours, the use of HTML(5)’s details (and summary) element.
You can also see this play out at WordPress 4.1.1’s Emoji Name Search Tailoring Tutorial.
Previous relevant Emoji Name Search Primer Tutorial is shown below.
We got quite excited recently with Rainbow Games PHP Emoji Tutorial when we added a (fourth Beatle) emoji helper, called Emoji Terra, into the mix of tools to gather emoji information. Today, we’ve got a new Emoji Search web application that introduces a new (fifth Beatle(?)) emoji helper tool to add into the “how we see it” mix below …
- Emojipedia is good for looking up Emoji names or concepts in words
- FileFormat Information is great for HTML Entity determinations for your less complex Emojis
- Iemoji is great for HTML Entity determinations for Emojis of all complexities
- Emoji Terra performs similar functionality as Iemoji but has a permalink organization more friendly to an “emoji search via emoji title” query, and that has suited our purposes today, and before, so, thanks a lot
- Emoji CSS performs similar functionality to Emojipedia, but has a pictorial view of Emoji names as well, right from the word go, thanks
With these emoji tools in mind we wrote a new PHP web application combining those last two to show Emojis pictorially (with their short name) initially and allow the user to search for an Emoji (match) list via their HTML input type=text (textbox) entry, which results in …
- the Emoji (match) list look (as an Emoji “display”) … and …
- an HTML a link which is that Emoji’s short name … linking to …
- an Emoji Terra webpage with more detail, including HTML Entity information if “short name” is unique, or one extra click away, if not
Maybe you need to try the live run and/or its PHP source code emoticon_keyboard_shortcuts.php to download, perhaps?
Previous relevant Rainbow Games PHP Emoji Tutorial is shown below.
In order to take that further genericization step onto the achievements of yesterday’s Rainbow Games Genericization Tutorial to get onto (the mathematics Induction principle inspired) …
- prove for the first case
- prove for the second case
- prove for the nth case
… we had a choice of …
- continue on (with) the HTML code creation of new “hardcoded” arrays (managed by Javascript eval abstractional approach) … or “bite the bullet” and …
- try to work out a generic “emoji lookerer upperer” arrangement
Guess you can tell we opted for the latter, huh?! We started the investigation of this by examining our three favourite emoji informational websites, namely …
… and were a bit surprised that we could not quite swing a generic method to glean the information, so don’t know whether our new “player” is “Ringo Starr” or not, but can tell you this, “its beat is much better than its bite” … chortle, chortle …
Emoji Terra performs similar functionality as Iemoji but has a permalink organization more friendly to an “emoji search via emoji title” query, and that suits our purposes today, so, thanks a lot. Without this query by “emoji title” possibility we’d have been forced to adopt more of those “hardcoded” arrays, which would have been alright, but this second approach opens the door to “sport” events in “The Rainbow Games” web application using emojis of the future (ie. they haven’t been invented yet).
How to work the interfacing to Emoji Terra?
- good ol’ PHP serverside language
- good ol’ PHP’s file_get_contents (supplemented by)
- good newish “PHP Source File as the Database Source” we’ve talked about in the past with PHP Require Database Primer Tutorial and Signature Signature PHP Tutorial whereby the PHP Source File updates itself with web application data
This new PHP emoji_lookup.php treats the “prove for the nth case” sports as ones to …
- look up the emoji information for (in the order “PHP Source File as the Database Source” then try file_get_contents of Emoji Terra lookup), and …
- read the HTML partner source code live run‘s underlying HTML and Javascript and CSS emoji_walk_animation.htm (which changed in this way)
- amend that HTML source to supplant the “Sprint” default sport for this new nominated sport … trying not to fall over laughing at some of the new sports we present (inspired by a visit to Emoji Terra search)
- write out that amended HTML code as the web page (the beauty of a serverside language like PHP)
The more detailed specifics of the file_get_contents of Emoji Terra lookup above are …
- build up a URL starting with HTTP://emojiterra.com/ … then …
- in emojiland arrangements there are two genders (as our prefixes if you will) … woman- and man-
- then add on a “middle” sport descriptor (eg. biking)
- in emojiland emoticonland arrangements there are five descriptors (as our suffixes if you will) … -dark-skin-tone, -medium-dark-skin-tone, -medium-skin-tone, -medium-light-skin-tone, -light-skin-tone
- for that set of 2x1x5=10 URLs glean what “HTML dec” (HTML Entity) information you can glean via the file_get_contents call of the Emoji Terra URLs described above (eg. Emoji: Woman Biking: Dark Skin Tone) … built into a Javascript array string to “plug into” the previously read HTML partner source code, and amended to output as the web page the user sees
Sports of the future in emojiland? Just ask for the equivalent of biking (above) off the user via a Javascript prompt window (on the proviso you read Conditional Alternative to Javascript Popup Windows in iOS Tutorial first please).
Previous relevant Rainbow Games Genericization Tutorial is shown below.
What would help genericize the recent Rainbow Games Double Transformation Tutorial “Rainbow Games” web application? How about introducing another sport?
Again, in honour of “onions of the 4th dimension” approaches, we mainly, turn to the power of Javascript’s eval methodology to achieve this abstracted feeling to our web application. Today, with this, we go two thirds of the way along the “Mathematical Induction” approach …
- prove for the first case
- prove for the second case
- prove for the nth case
How does this use of Javascript eval manifest itself in this way?
- there are two arrays that work with the “content” of our “Rainbow Games” sport(s) (well, at least, the first “sprint running” sport) called emoticons[] and choices[]
- wherever we find references in the code to either of these two arrays we start to involve the global variable verbsuffix …
var verb='Sprint';

var verbs=['Sprint','Row'];

var anotherverb='run';

var verbsuffix='';
… in altered ways like …
function plus(ih,ihep) {

  var outihep=ihep;

  if (eval("emoticons" + verbsuffix + "[" + ih + "]").indexOf('<p>') != -1) {

    outihep += ' (' + eval("emoticons" + verbsuffix + "[" + ih + "]").split('<p>')[1].split('<')[0] + ')';

  }

  return outihep;

}
… in that abstracted way … noting that sometimes you don’t need the “eval()” encasings … - and so, working through the code this way it just falls to the coder to define new members for all the arrays for all the new sports (ours is “rowing” today), some of those new arrays (like for rowing are emoticonsrowing[] and choicesrowing[]) to involve …
- looking up emoji definitions from …
… not forgetting to …
- make sure the event logics work for multiple sport scenarios … but mostly they do by sticking to the principles above … especially for the …
- new HTML select (dropdown) element allows the user to pick a sport
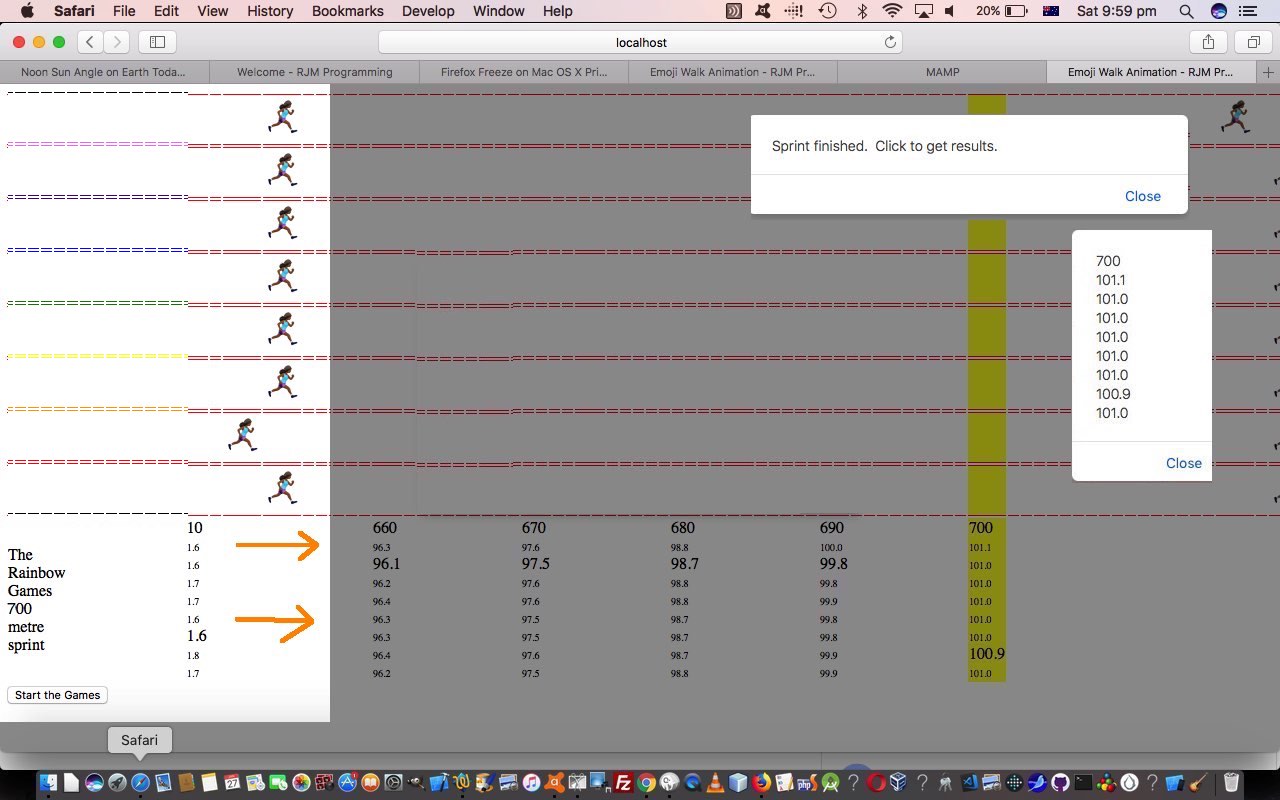
Remaining a work in progress, you can try out our live run link that has underlying HTML and Javascript and CSS emoji_walk_animation.htm, and which changed in this way regarding today’s genericization work. We hope it gives you food for thought.
Previous relevant Rainbow Games Double Transformation Tutorial is shown below.
We were on the “road to personalization” for the web application game we started with yesterday’s Rainbow Games Primer Tutorial when “an old chestnut” came up again. It’s happened before, the desire to “double transform” in CSS came about from our emoji …
| 🏃🏾♀️ |
… table cell mirroring styling as per …
<style>

* { overflow-x: visible; }


select { font-size: 36px; }


td.runner { width: 50px; word-wrap: break-word; font-size: 36px;

     transform: scale(-1, 1); -o-transform: scale(-1, 1); -moz-transform: scale(-1, 1); -ms-transform: scale(-1, 1); -webkit-transform:  scale(-1, 1);

        }   //
| 🏃🏾♀️ |
tr { max-height: 40px; }
</style>
… necessary to make our running emojis run from left to right (that, alas, also transformed any accompanying …
| 🏃🏾♀️
Florence |
… name), was added to in this double transformational clause to prove what this wonderful web page advice had to say. In other words, a “double transform” CSS styling scenario like the one below …
<style>

* { overflow-x: visible; }


select { font-size: 36px; }


td.runner { width: 50px; word-wrap: break-word; font-size: 36px;

     transform: scale(-1, 1); -o-transform: scale(-1, 1); -moz-transform: scale(-1, 1); -ms-transform: scale(-1, 1); -webkit-transform:  scale(-1, 1);

        }

tr { max-height: 40px; }


p {

    display: block;

    font-size: 12px;

    -webkit-transform: matrix(-1, 0, 0, 1, 0, 0);

    -moz-transform: matrix(-1, 0, 0, 1, 0, 0);

    -o-transform: matrix(-1, 0, 0, 1, 0, 0);

    transform: matrix(-1, 0, 0, 1, 0, 0);

}    //
| 🏃🏾♀️
Florence |
</style>
… works as a “double transform” to first …
- mirror (image) flip the table cell (td) emoji data … but us appending some “Runner Name” textual data underneath also, annoyingly, got flipped until …
- within that (same) table cell (td) element and after the emoji data we append an HTML p(aragraph) element to both …
- introduce a new HTML element type into the (CSS styling) mix … and to …
- introduce a new CSS transformation type, the matrix … perhaps either or both new parts to the problem critical to its success when, believe me, lots of other approaches don’t work
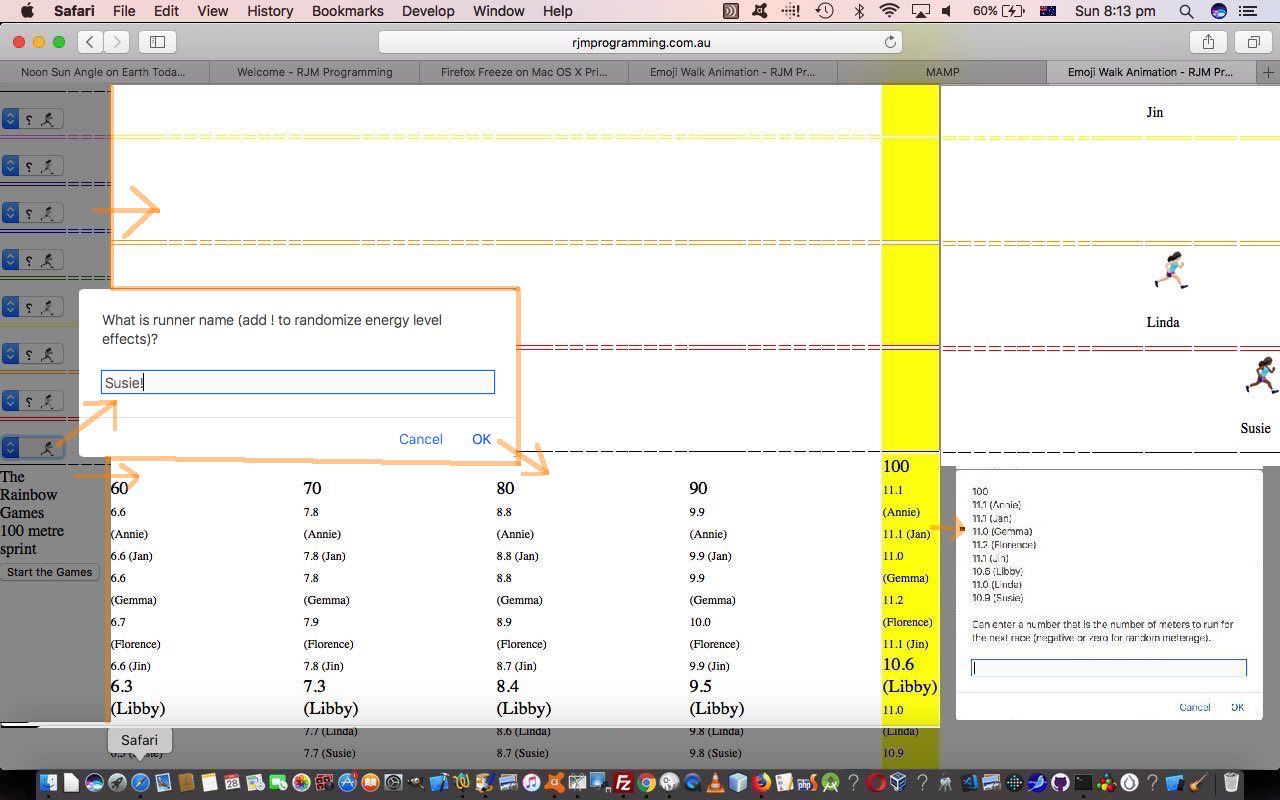
… to personalize the “runners” and “users”, optionally, “into the game”, by allowing the “user” to name their “runners” and allow for a “runner energy” setting be a bit randomized, to add for some other interest “variety” to the game’s workings. So, still a work in progress that you can try out at our live run link that has underlying HTML and Javascript and CSS emoji_walk_animation.html, and which changed in this way regarding today’s work.
Previous relevant Rainbow Games Primer Tutorial is shown below.
It’s been a while since we’ve written any conventional HTML and Javascript and CSS game. Today’s game uses the “emoticon” section of the Emoji character set, defaulting so far, to the “running woman” emoji featuring in Compound Emoji WordPress Usage Tutorial.
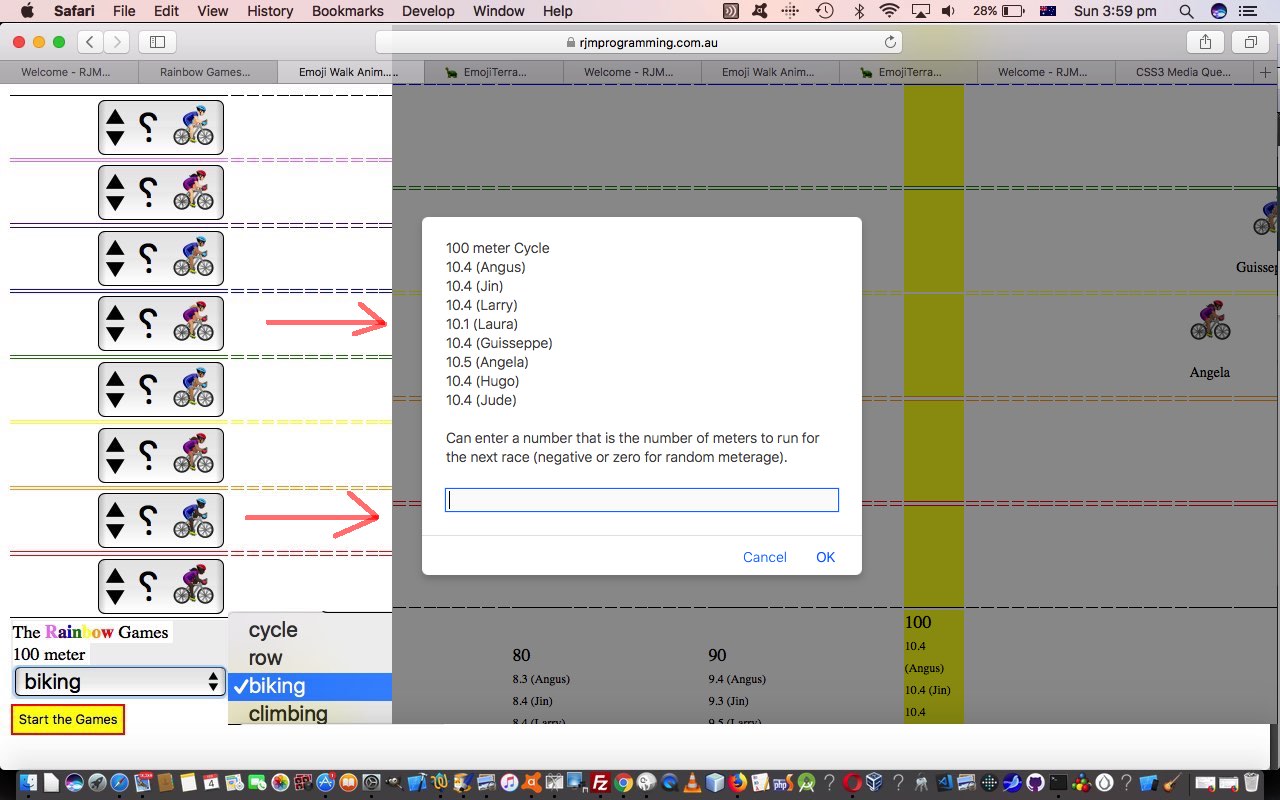
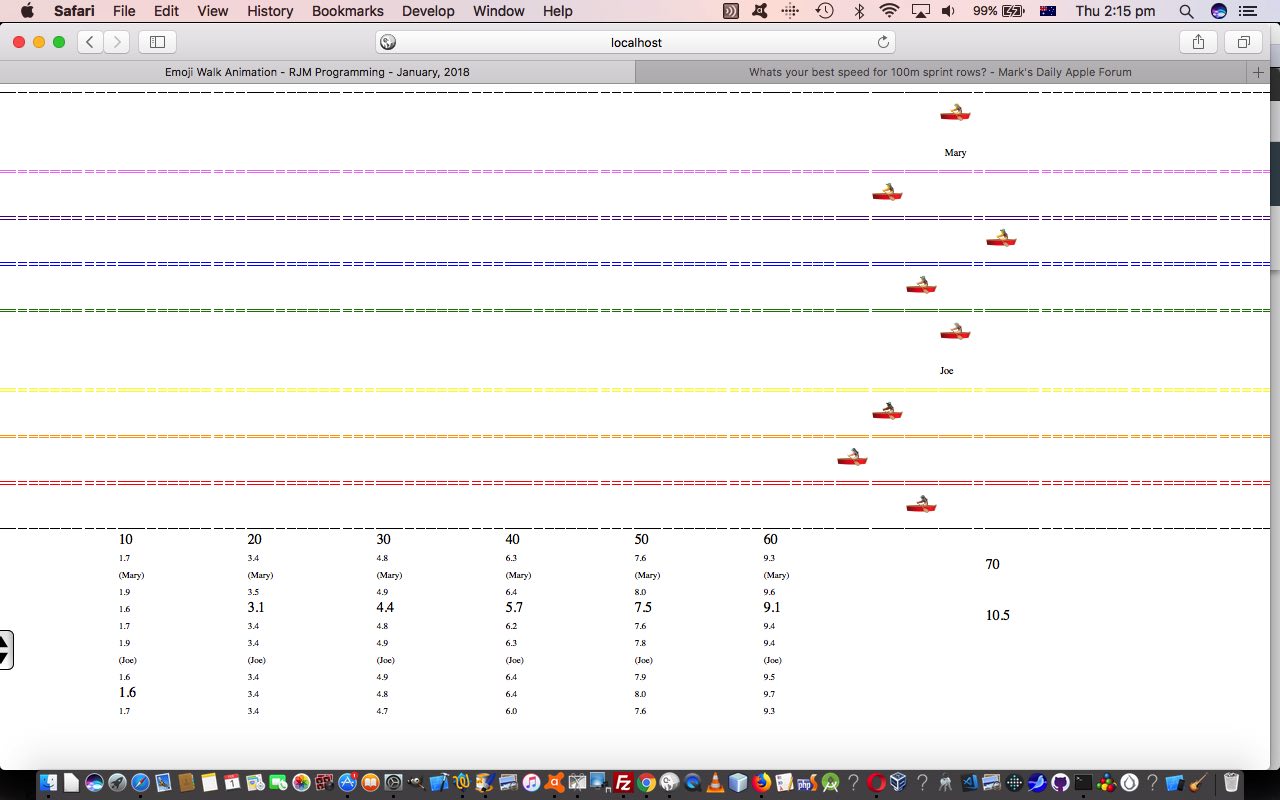
It’s the early days of our “Rainbow Games” web application, and we’re starting with the animation featuring horizontal hashtag navigation techniques for a running race start to our game. Where it finishes? Hard to say! Today, we’ve looked at “splits” and a finish line.
You can try out our burgeoning live run game concept link that has underlying HTML and Javascript and CSS emoji_walk_animation.html.
If this was interesting you may be interested in this too.
If this was interesting you may be interested in this too.
If this was interesting you may be interested in this too.
If this was interesting you may be interested in this too.
If this was interesting you may be interested in this too.
If this was interesting you may be interested in this too.
If this was interesting you may be interested in this too.
If this was interesting you may be interested in this too.
If this was interesting you may be interested in this too.
If this was interesting you may be interested in this too.
If this was interesting you may be interested in this too.
If this was interesting you may be interested in this too.
If this was interesting you may be interested in this too.
If this was interesting you may be interested in this too.
If this was interesting you may be interested in this too.
If this was interesting you may be interested in this too.
If this was interesting you may be interested in this too.
If this was interesting you may be interested in this too.
If this was interesting you may be interested in this too.
If this was interesting you may be interested in this too.
If this was interesting you may be interested in this too.
If this was interesting you may be interested in this too.
If this was interesting you may be interested in this too.
If this was interesting you may be interested in this too.
If this was interesting you may be interested in this too.

