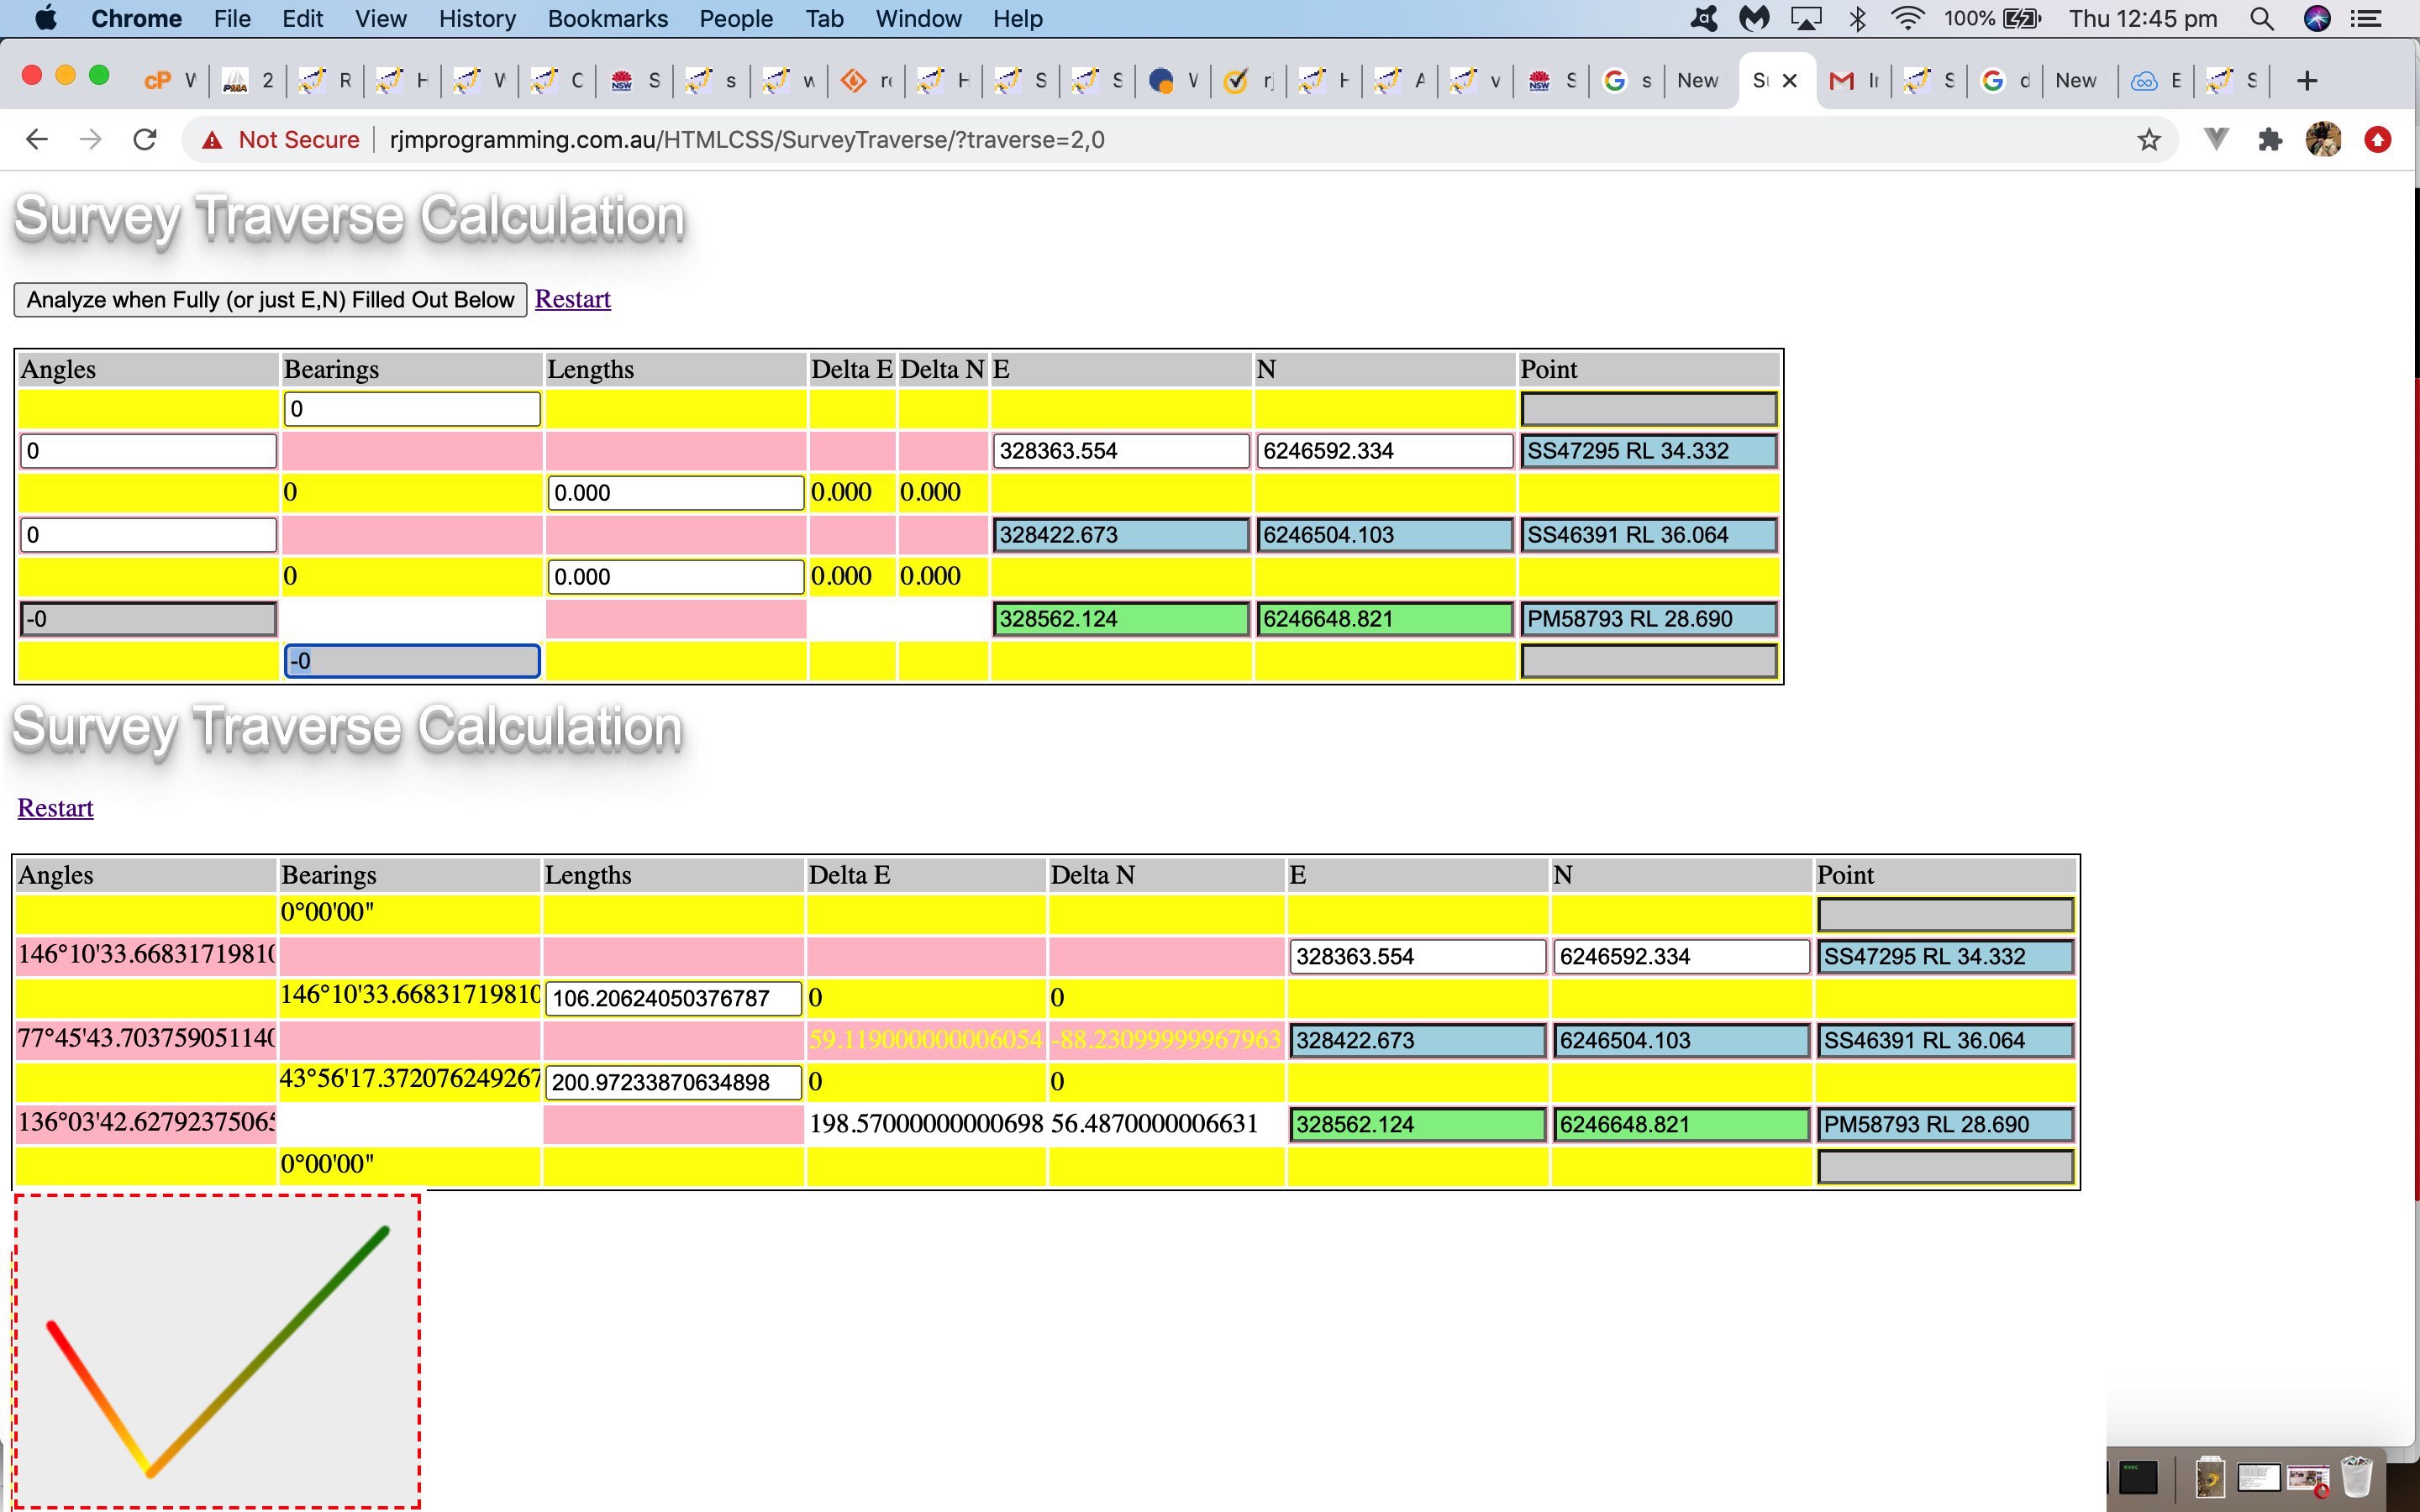
Onto yesterday’s HTML and Javascript and CSS NSW State Survey Traverse Tutorial progress with our Survey Traverse web application functionality we wanted to augment …
- the existent tabular data … with …
- new canvas graphics to show the (Easting,Northing) co-ordinate sets of the Survey Traverse
… involving the collection of minimums and maximums Javascript “ifzeromakezero” function code changes …
var edone=false, ndone=false;

var maxe=-1.0, mine=-1.0, maxn=-1.0, minn=-1.0;


function ifzeromakezero(innum,e_or_n) {

 var cinnum = innum.toString();

 if (cinnum.indexOf("e-") != (0 - 1)) {

   if (e_or_n == 1) {

     if (!edone) {

       mine=0.0;

       maxe=0.0;

     } else {

       if (mine > 0.0) { mine=0.0; }

       if (maxe < 0.0) { maxe=0.0; }
     }
     edone=true;
   } else if (e_or_n == 2) {
     if (!ndone) {
       minn=0.0;
       maxn=0.0;
     } else {
       if (minn > 0.0) { minn=0.0; }

       if (maxn < 0.0) { maxn=0.0; }
     }
     ndone=true;
   }

   return 0.000;

 }

 if (e_or_n == 1) {

     if (!edone) {

       mine=innum;

       maxe=innum;

     } else {

       if (mine > innum) { mine=innum; }

       if (maxe < innum) { maxe=innum; }
     }
     edone=true;
 } else if (e_or_n == 2) {
     if (!ndone) {
       minn=innum;
       maxn=innum;
     } else {
       if (minn > innum) { minn=innum; }

       if (maxn < innum) { maxn=innum; }
     }
     ndone=true;
 }

 return innum;

}
… and the canvas creation and line plotting, featuring (thanks to (linear gradients on canvas) ideas from this excellent link) canvas Javascript code …
    document.getElementById('overlays').innerHTML+='<br><br><canvas style="background-color:#f0f0f0;border:2px dashed red;" height=' + eval(40 + eval('' + maxn) - eval('' + minn)) + ' width=' + eval(40 + eval('' + maxe) - eval('' + mine)) + ' id=mycanvas></canvas>';

    setTimeout(postspanscheck, 5000);

    var ele=document.getElementById('mycanvas');

    var context=document.getElementById('mycanvas').getContext('2d');

    var iz=0, mto=true, grad;


    // var pts = [[0, 0, "red"], [0, 0, "green"], [0, 0, "blue"], [0, 0, "purple"], [0, 0, "olive"], [0, 0, "magenta"], [0, 0, "cyan"], [0, 0, "brown"], [0, 0, "black"], [0, 0, "pink"], [0, 0, "darkgreen"], [0, 0, "darkblue"], [0, 0, "darkorange"]];

    var pts = [[0, 0, "red"], [0, 0, "orange"], [0, 0, "yellow"], [0, 0, "green"], [0, 0, "cyan"], [0, 0, "blue"], [0, 0, "violet"]];

    var begin = pts[0];

    var end = pts[1];


    while (document.getElementById('E' + iz)) {

      if (document.getElementById('E' + iz).value != '') {

        if (mto) {

          context.lineWidth = 6;

          context.lineJoin = "round";

          context.lineCap = "round";

          //context.strokeStyle = "black";

          context.beginPath();

          begin=pts[eval(iz % pts.length)];

          begin[0] = eval(20 + eval('' + document.getElementById('E' + iz).value) - eval('' + mine));

          begin[1] = eval(eval('' + maxn) + 20 - eval('' + document.getElementById('N' + iz).value) + 0 * eval('' + minn));

          context.moveTo(eval(20 + eval('' + document.getElementById('E' + iz).value) - eval('' + mine)), eval(eval('' + maxn) + 20 - eval('' + document.getElementById('N' + iz).value) + 0 * eval('' + minn)));

        } else {

          end=pts[eval(1 + eval(iz % 5))];

          end[0] = eval(20 + eval('' + document.getElementById('E' + iz).value) - eval('' + mine));

          end[1] = eval(eval('' + maxn) + 20 - eval('' + document.getElementById('N' + iz).value) + 0 * eval('' + minn));

          grad = context.createLinearGradient(begin[0], begin[1], end[0], end[1]);

          grad.addColorStop(0, begin[2]);

          grad.addColorStop(1, end[2]);

          context.strokeStyle = grad;

          context.lineTo(eval(20 + eval('' + document.getElementById('E' + iz).value) - eval('' + mine)), eval(eval('' + maxn) + 20 - eval('' + document.getElementById('N' + iz).value) + 0 * eval('' + minn)));

          context.stroke();

          //context.strokeStyle = "black";

          context.beginPath();

          context.moveTo(eval(20 + eval('' + document.getElementById('E' + iz).value) - eval('' + mine)), eval(eval('' + maxn) + 20 - eval('' + document.getElementById('N' + iz).value) + 0 * eval('' + minn)));

          begin=pts[eval(iz % pts.length)];

          begin[0] = eval(20 + eval('' + document.getElementById('E' + iz).value) - eval('' + mine));

          begin[1] = eval(eval('' + maxn) + 20 - eval('' + document.getElementById('N' + iz).value) + 0 * eval('' + minn));

        }

        mto=false;

      }

      iz++;

    }

  }
… via our changed SurveyTraverse.htm live run link.
Previous relevant HTML and Javascript and CSS NSW State Survey Traverse Tutorial is shown below.
Yesterday’s HTML and Javascript and CSS Survey Traverse Co-ordinates Tutorial was kind of “mathematical” by nature. Today we add some realism.
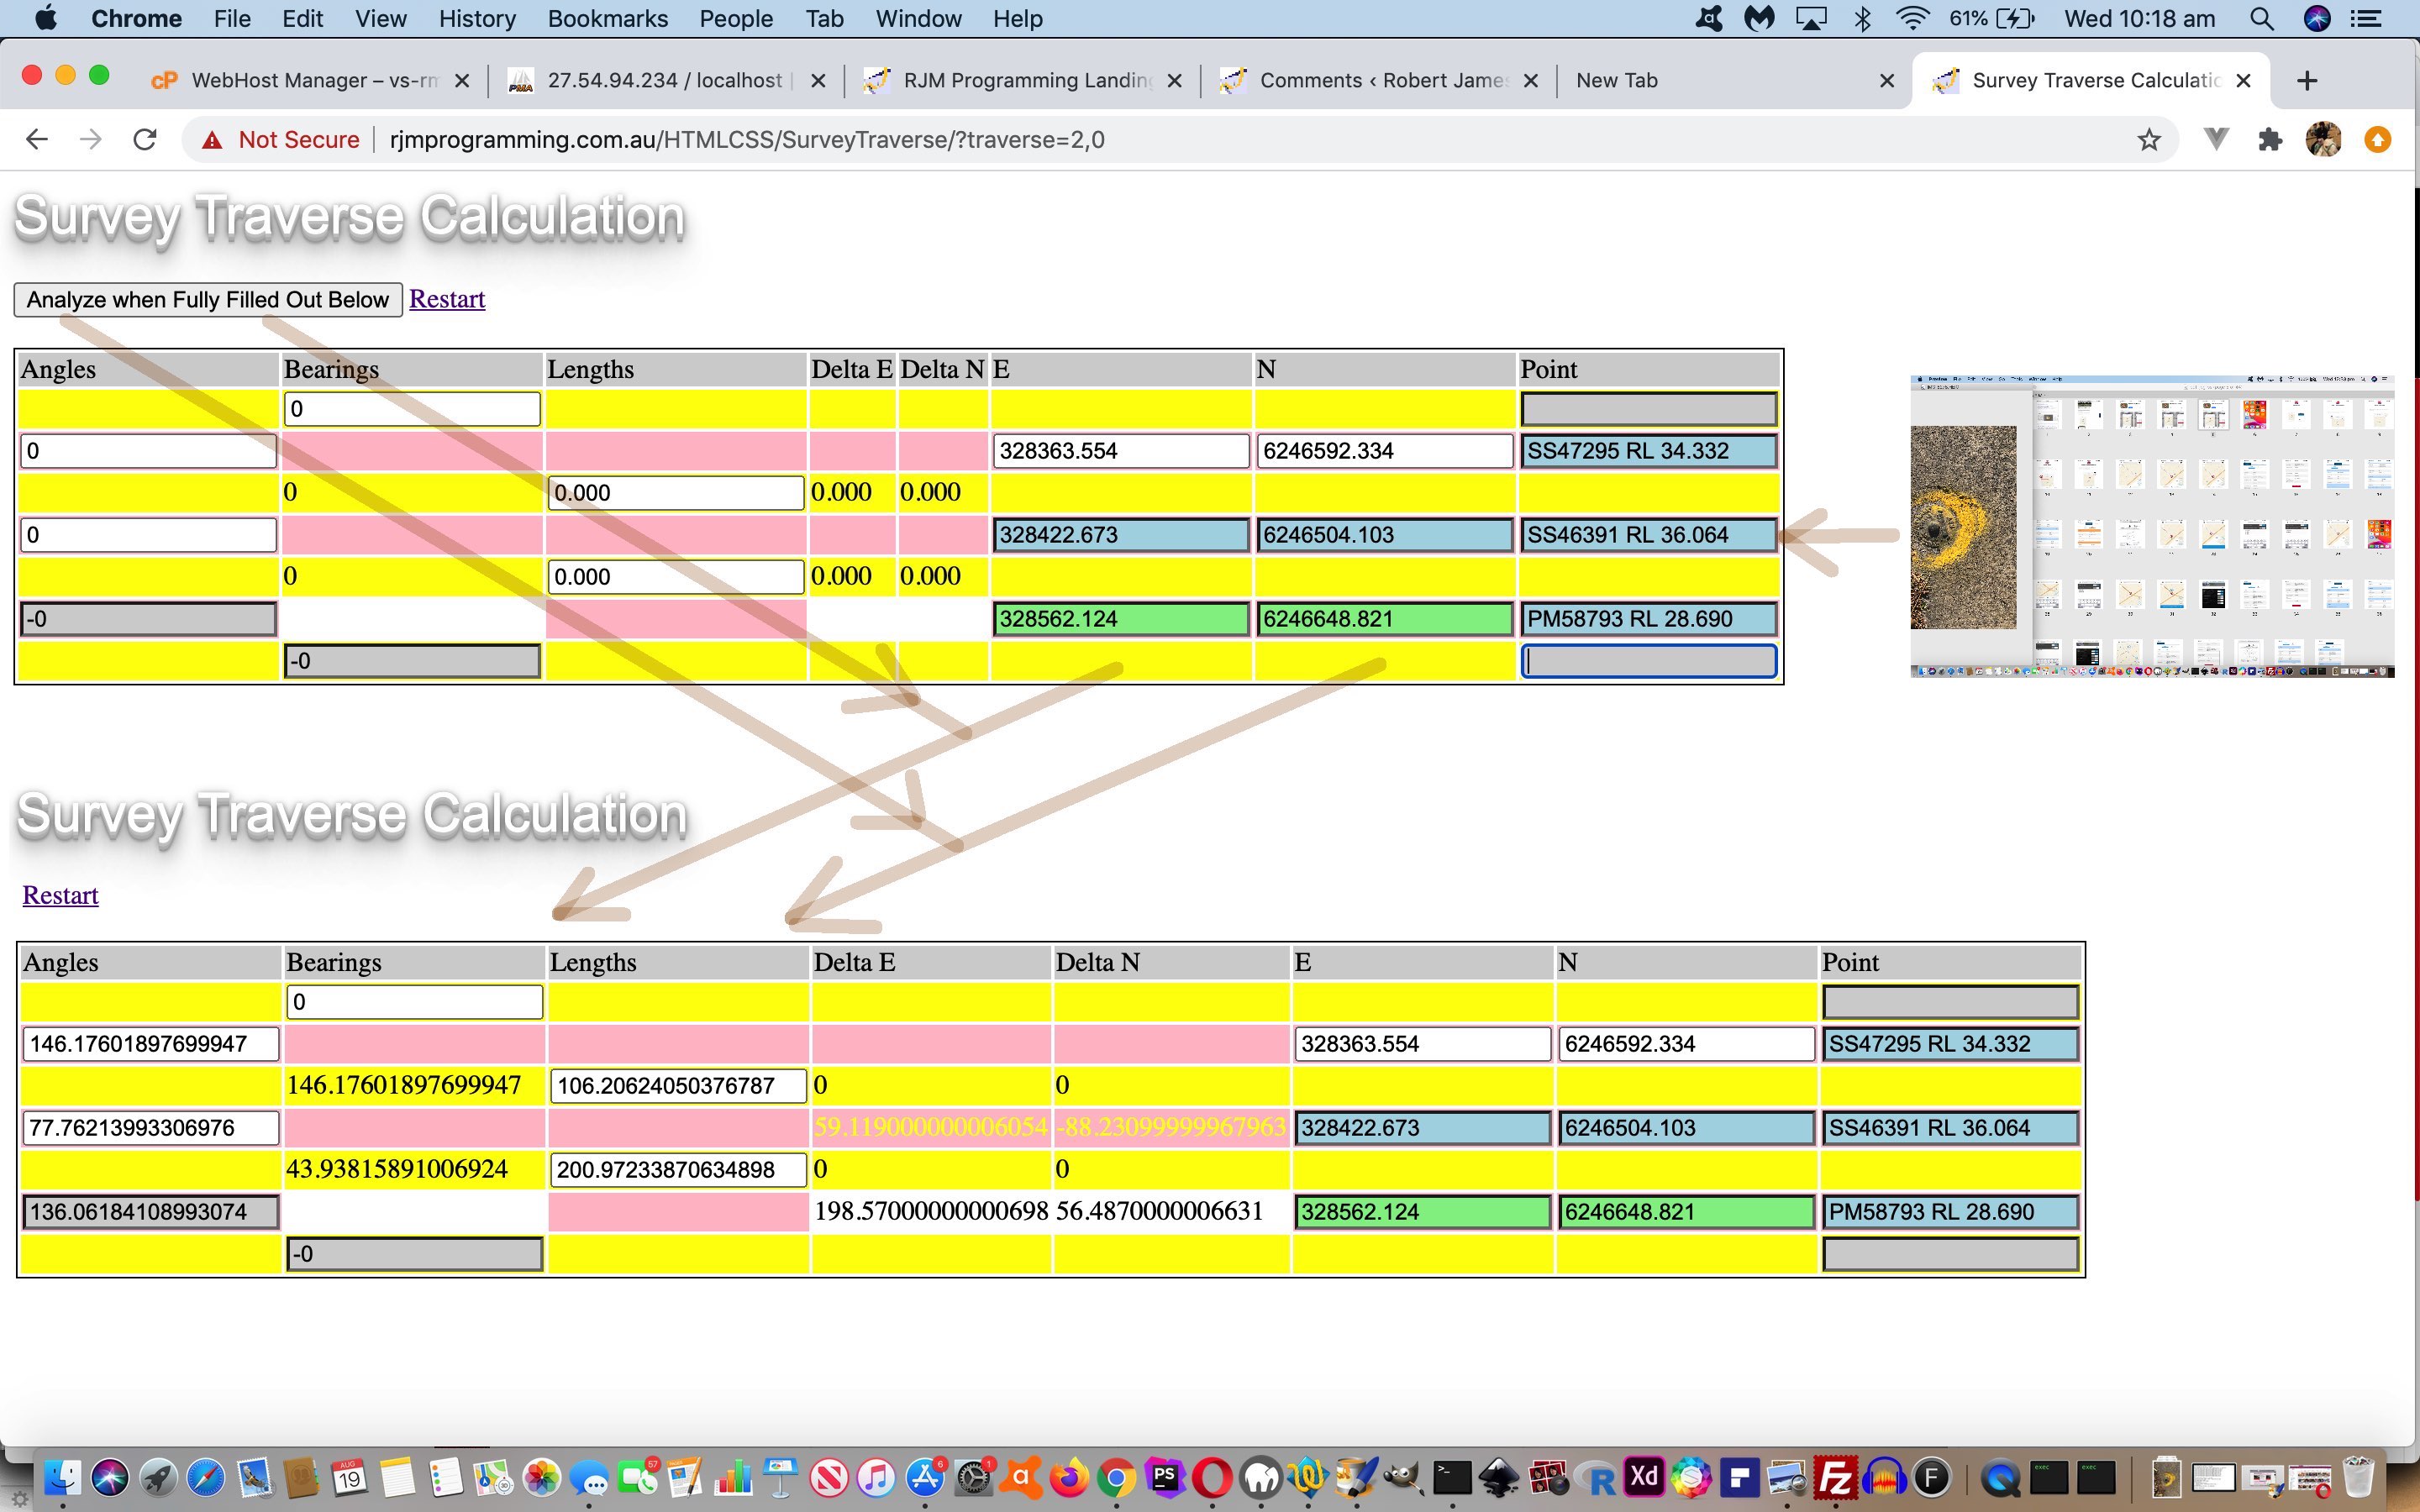
This realism stems from the discovery of a NSW State Survey mark in the local area (to the right of today’s tutorial picture). Having a Land Surveying background, an indestructible looking survey mark is a joy to behold. The thing is though, when I was doing a Bachelor Of Surveying in the late 1970’s and early 1980’s, this survey mark was much more an object of awe than perhaps such a mark is to people, even me, today. Mystery surrounded it, it taking a visit to a government agency (NSW Titles Office), and no doubt some paperwork to match, would be required to find out anything about it, Land Surveyors at the very least curious about …
- (Easting, Northing) co-ordinates in AMG (Australian Map Grid) (in whatever ellipsoid of relevance)
- Reduced Level (at whatever datum of relevance)
We decided on our iPhone to feed that SS46391 survey mark name into Google, thanks, and see what comes up, and discovered the “NSW Survey Marks” iOS app that we downloaded and spent a happy half hour “in a wooooorrrrrllllllddd of discovery and interest” (well, you had to be there).
You see, this app is just great! The information above is augmented by location Sketch Maps (that a Land Surveyor from the past would have created in the NSW Titles Office).
This way, in that half hour we looked for 3 survey marks in that local area, and gleaned their co-ordinates to come up with the …
- (Easting, Northing) co-ordinates in AMG (Australian Map Grid) (from the NSW Survey Marks app)
- Bearings and Distances and theodolite Angles derived
… also shown in today’s tutorial picture … via our changed SurveyTraverse.html live run link, the changes concerning allowing both …
- decimal degrees … as well as …
- degrees, minutes and seconds (useful for setting an angle with a theodolite)
… for those aforesaid mentioned Angles and Bearings (with your compass or iPhone compass app).
Some of this “NSW Survey Marks” app’s workings can be viewed with today’s accompanying PDF presentation.
Previous relevant HTML and Javascript and CSS Survey Traverse Tutorial is shown below.
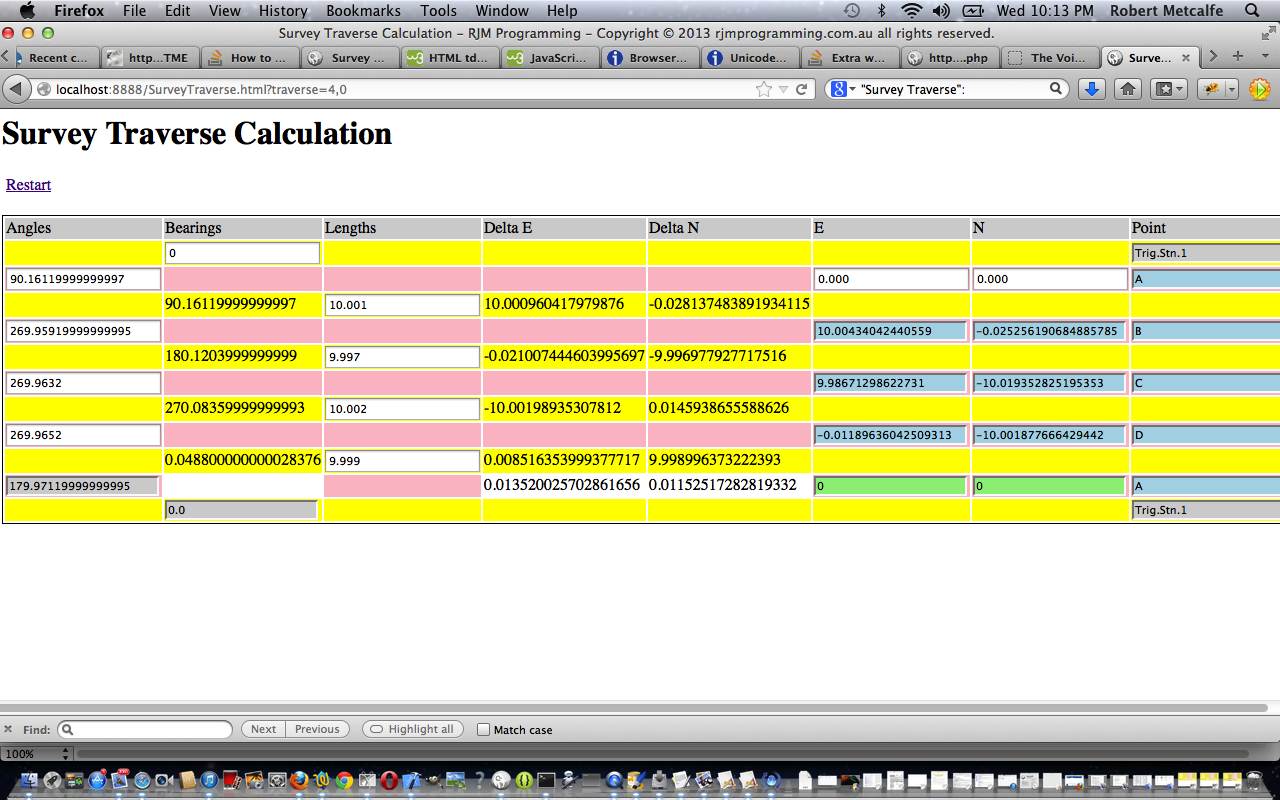
Here is a tutorial showing some client-side basics in HTML and Javascript and CSS all in the one HTML file, to simplify concepts. The tutorial subject matter is a webpage to perform Survey Traverse calculations. A Survey Traverse is:
Traverse is a method in the field of surveying to establish control networks.[1] It is also used in geodesy. Traverse networks involve placing survey stations along a line or path of travel, and then using the previously surveyed points as a base for observing the next point. Traverse networks have many advantages, including:
Less reconnaissance and organization needed;
While in other systems, which may require the survey to be performed along a rigid polygon shape, the traverse can change to any shape and thus can accommodate a great deal of different terrains;
Only a few observations need to be taken at each station, whereas in other survey networks a great deal of angular and linear observations need to be made and considered;
Traverse networks are free of the strength of figure considerations that happen in triangular systems;
Scale error does not add up as the traverse is performed. Azimuth swing errors can also be reduced by increasing the distance between stations.The traverse is more accurate than triangulateration[2] (a combined function of the triangulation and trilateration practice).[3]
Let’s see some simple HTML in action in a tutorial …
Link to HTML “spiritual home” … at W3Schools has many tutorials.
Link to Survey Traverse live run … here.
Link to Survey Traverse live run (additional Google Line Chart functionality) here.
Link to Survey Traverse information … from Wikipedia from which quote above comes.
Link to some downloadable HTML code … rename to SurveyTraverse.html which packages up a lot of Javascript and a little bit of CSS … or JaCvasScriptS … not sure whether this would ever catch on.
Link to some downloadable PHP programming code (additional Google Line Chart functionality) … rename to SurveyTraverse.php
If this was interesting you may be interested in this too.
If this was interesting you may be interested in this too.
If this was interesting you may be interested in this too.
If this was interesting you may be interested in this too.


