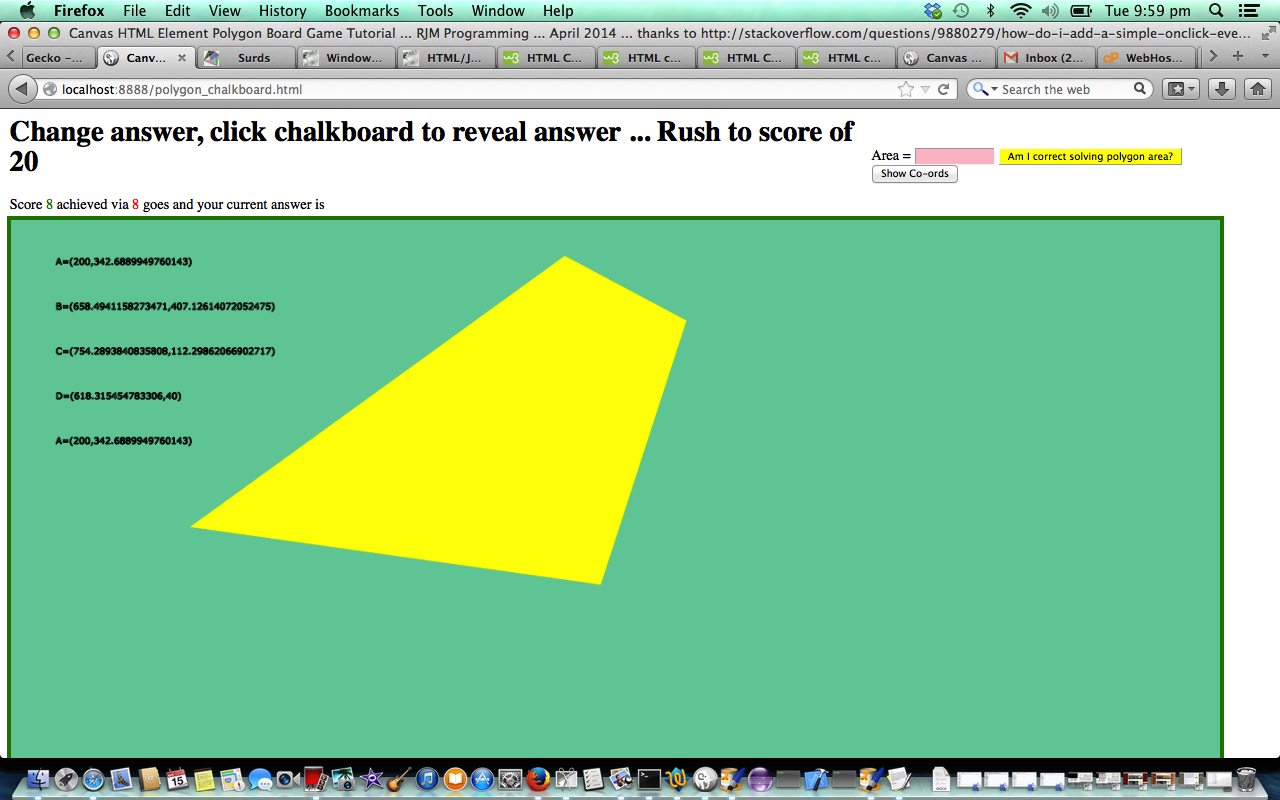
The Canvas HTML element tag can be used as the container to draw graphics on the fly usually via the use of Javascript functions for rendering and event management.
In today’s tutorial we touch on the functionality to plot a polygon on the canvas via beginPath(), moveTo(), lineTo(), fillStyle() and fill() methods and to draw text via strokeText() method. In the case of this tutorial that plotting contributes to the user answering some mathematical trigonometrical questions regarding Polygon area calculations on a simulated “chalkboard”.
You may want to read more at HTML Canvas Reference as a generic reference, or here, at the tutorial javascript – How do I add a simple onClick event handler to a canvas element? – Stack Overflow.
As you can imagine, this HTML canvas element, new to HTML5, can be very useful for some practical client-side web functionality.
Link to some downloadable HTML programming code … rename to polygon_chalkboard.html
You’ll notice heavy use of the Javascript Math.random() function.
We hope you enjoy this tutorial as a live run.
Yes … you’ve reached the end … hope you have a good time practising your mathematical trigonometrical knowledge of Polygon area calculationss (there is advice, if you want to learn … you can get it when you give an incorrect answer)!
If this was interesting you may be interested in this too.


