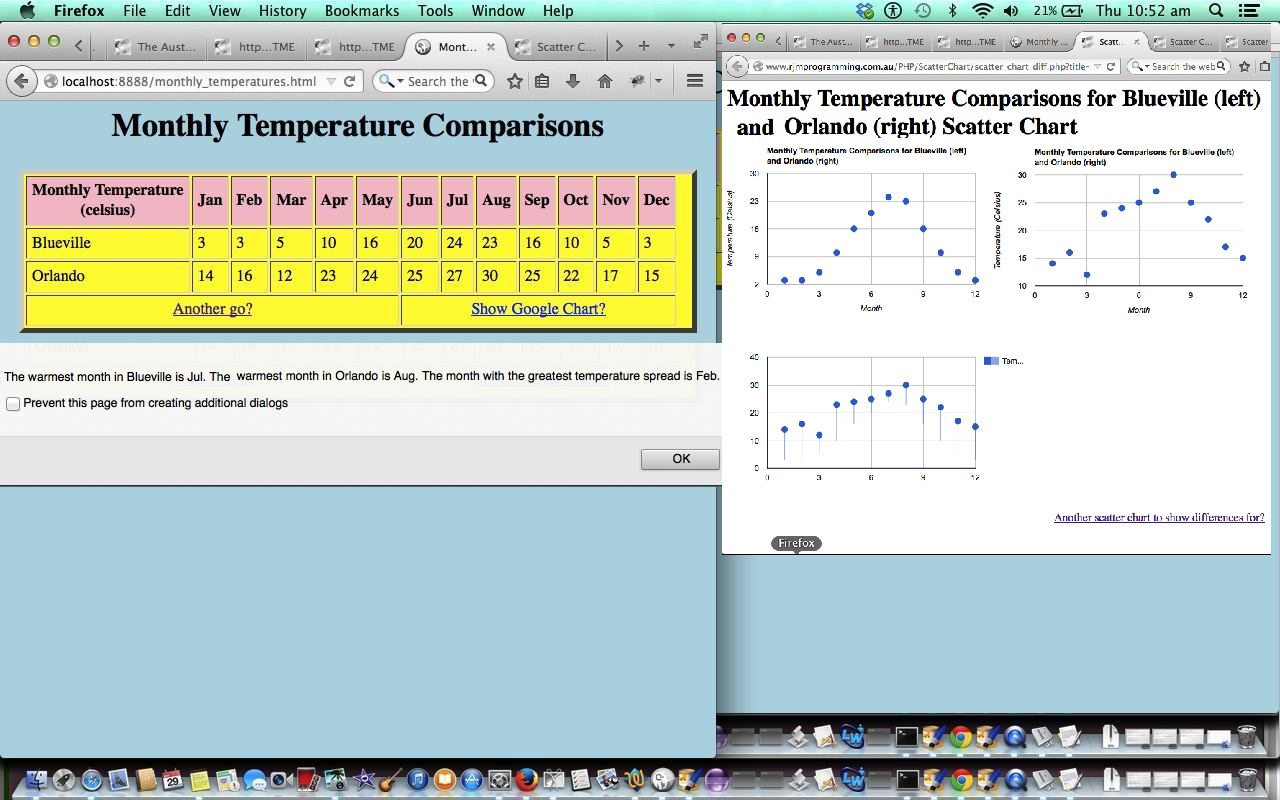
Here is a tutorial showing some client-side basics in HTML and Javascript that helps with a tabular display of Monthly Temperature Comparisons. The inspiration for this came from a Yahoo Answers question here, so thanks a lot.
Link to some downloadable HTML programming code … rename to monthly_temperatures.html
Guess most of the work for such a tutorial is the way to organise the look of the display of the table as it dynamically gets populated and the functional thought of linking it to a Google Chart Scatter Chart Difference scenario, for some optional visual appeal, as was also done in HTML/Javascript Visual Change Drop Punt Game Tutorial.
If this was interesting you may be interested in this too.


