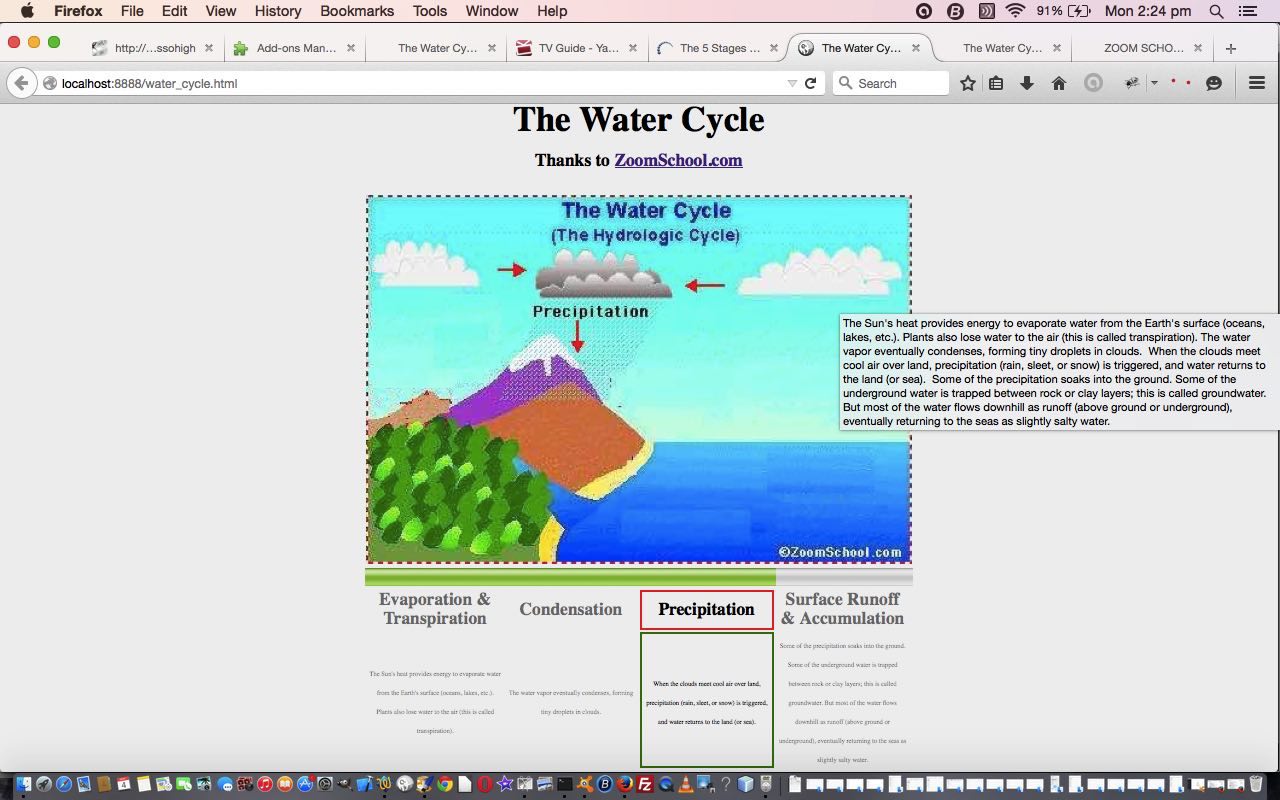
Slideshows can be a great way to present information. A slideshow is a form of animation that at its fastest is like a movie, where the images overlay on top of each other so fast our brains declare it a “stream of vision”, but today we “stage” the information slowly, in order to help let visual and textual information be absorbed, perhaps over several repeated viewings.
We think the “<meter>” HTML5 element can help this presentation enormously. It helps reduce anxiety with learning if the learner is presented with some idea of the size of the whole project they’re undertaking, and where they are at with this during their specific “slide” view, and a “<meter>” is a great presentation tool for this.
Today we study The Water Cycle (and thanks to this link for good information), but you’ll see this staged approach when you tackle many eCommerce website Shopping Cart functionalities, as well.
Another good tool to use is the idea of drilling down on the information, especially if you have the luxury of being able to repeat the presentation, as we allow for here, today. Drilling down can involve, as we do today, visual cues and textual information that at first pares the gist of the information into big text, and then allows the learner to drill down into the smaller text sized detail information, also available as bigger text at any time by a (non-mobile) hover over the visual image presented.
So sit back and see what you learn (if you didn’t know already) from The Water Cycle as a live run or study the code you could call water_cycle.html
If this was interesting you may be interested in this too.


12 Responses to HTML/Javascript Staged Animation Meter Presentation Tutorial