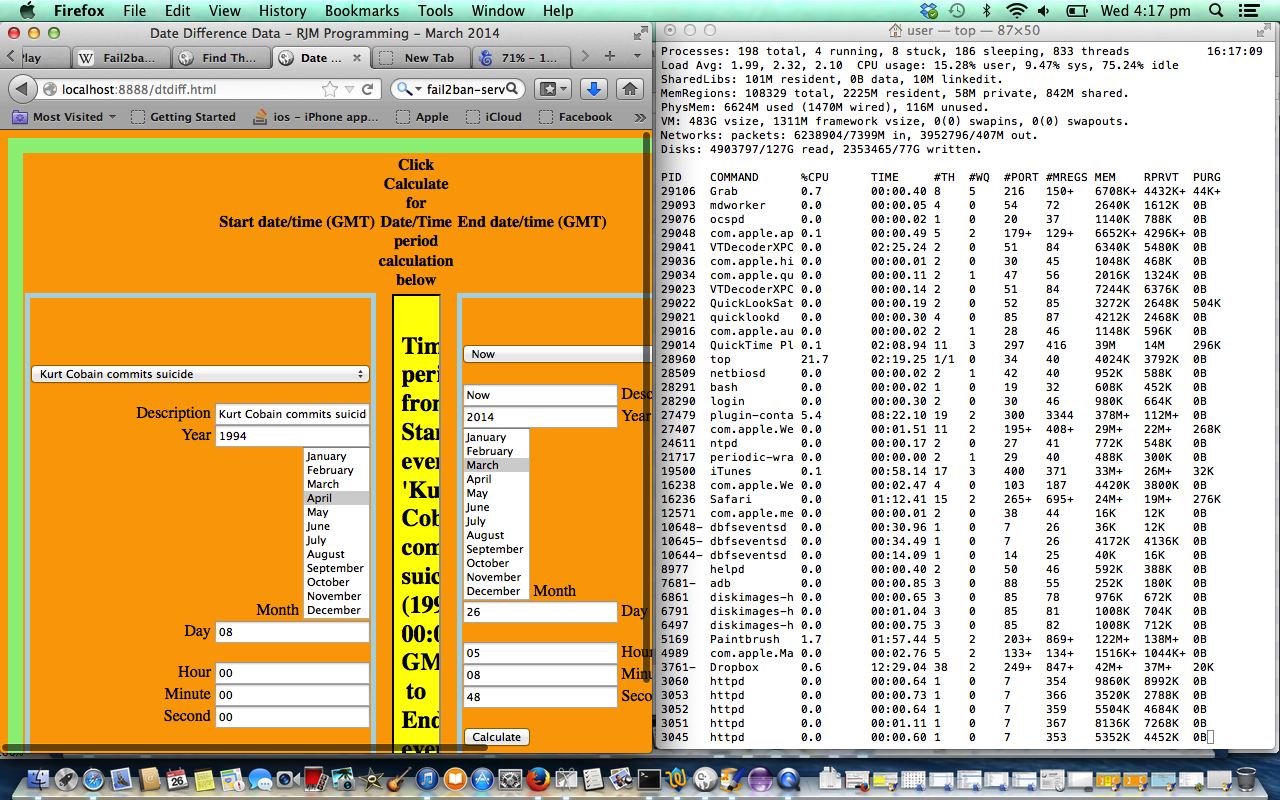
Linux (or Unix) servers have a “top” command for monitoring processes. It’s top … chortle, chortle.
When you are analyzing performance it can be that a live monitoring of a web server, for instance, might tell you more than a log file will. With web server frameworks you can often also turn statistical packages on to capture findings for you. With this, as with top, there is a small price to pay for the resources used by the monitoring.
In the case of an Apache/PHP/MySql web server there are a lot of considerations regarding performance, just a few of which are:
- number of processors that can help out with the CPU load
- the amount of RAM (memory) available to processes as a whole, and to MySql as a secondary issue
- swapping required by the system
- amount of diskspace available to the system
- database architecture quality
- database amount of data
- long running MySql queries
- number of MySql connections allowed
- number of open files allowed
No one monitoring tool will satisfy your curiosity regarding everything you want to know, but top is a good start on your road to getting some initial feelings about what the server is doing. You may find, by using top, an unusual process that spikes heavily at odd occasions, and which then either disappears, or does not appear at the top of the list of processes, until another spike. Events like this can give you pointers to aspects of the hosting you weren’t expecting, and this often leads to other findings.
So today we see top in action with this tutorial.
Fancy a very droll joke … What’s the nickname of the host-s with the most-s?
If this was interesting you may be interested in this too.


