If you were to nominate the most frequent “chore” you set your “software programs” to do, and we should never forget we are here to make software that achieves something, there is a big chance you’d choose the job of sorting data. The why I guess relates to how a lot of we humans want data presented … we seek order … and are generally a bit afraid of chaos … whether this is good always is for 56784532 other conversations to have.
Let’s go back to a thinking close to the operating system of interest … and today that is Linux … and look at some command line Linux that will work on most/all Linux or Unix operating systems … it is pretty fundamental stuff.
The base command of interest may amaze you … are you ready …
sort [inputFile]
… gasp … but sort just like that assumes some of the defaults (depending on your deep configuration settings (ie. in your profile, with an alias, you can change them)) …
- alphabetical sorting
- total record sorting (as if all the characters on a carriage return/line feed delimited string)
- ascending sort (from least to greatest)
- the sort determination looks from the leftmost character and proceeds to the right
… but, today, with our piped sort commands we present switches that can change the first three defaults, respectively …
- -n
- -k [colNumber] -t[delimiterCharacter]
- -r
… in other words …
- numerical sort
- sort by field [colNumber] where fields are separated by [delimiterCharacter]
- descending sort
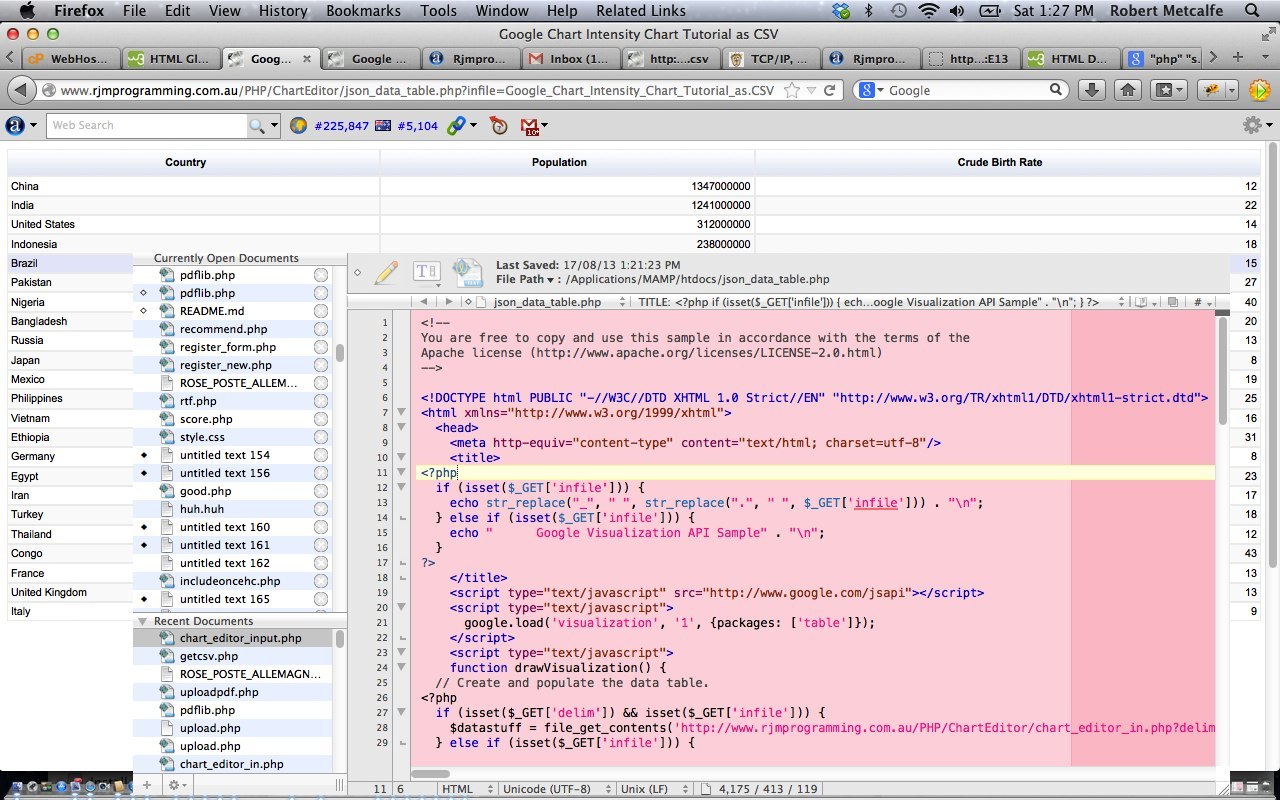
We also touch on other commands with our look at Linux sorting of our input CSV data that we talked about with PHP/Javascript/HTML Google Chart JSON Data Table Import of CSV Tutorial as shown below that has fields “Country”,”Population”,”Crude Birth Rate” …
- cat [CSVfileName] … type a file called [CSVfileName]
- uniq … pipe to enforce record uniqueness
- sort -u … pipe and switch to enforce field (of record) uniqueness
- grep ‘[searchCriteria]’ … piped filter to include only records satisfying [searchCriteria]
- sed ‘/$/s//,5/g’ … piped record modifier adding a new column (ie. ,5) to right of our input CSV data
Hope you find some interest in this Linux operating system command discussion. This is raw command line talk but it can also be supervised as a useful component tool by, (amongst other ideas by) …
- web server side language supervision … eg. via PHP exec for example, or via curl (of that PHP)
- called by compiled desktop program, such as Java, C++, C
- called by a Linux/Unix shell script … in Bourne Shell, Korn Shell, C Shell, tcsh, Unix Shell
Previous relevant data from PHP/Javascript/HTML Google Chart JSON Data Table Import of CSV Tutorial is shown below.
Here is a tutorial that introduces you to Google Graphs API, or Google Chart Tools, and its JSON Data Table functionality.
Google Chart Tools provide a perfect way to visualize data on your website. From simple line charts to complex hierarchical tree maps, the chart galley provides a large number of well-designed chart types. Populating your data is easy using the provided client- and server-side tools.
Thanks to the World Bank for some statistics which helped a lot.
Let’s see some PHP code in live action for this tutorial where you see a JSON Data Table derived from a filename passed as a parameter in the URL. The data shown is based on a CSV file of a previous PHP/Javascript/HTML Google Chart Intensity Map Tutorial shown below.
Link to Google Chart Tools “spiritual home” … via Google.
Link to Google Chart Tools JSON Data Table information … via Google.
Link to some downloadable PHP programming code … rename to chart_editor_in.php.
Link to some downloadable PHP programming code … rename to json_data_table.php.
Link to some downloadable input CSV data … rename to Google_Chart_Intensity_Chart_Tutorial_as.CSV.
Previous PHP/Javascript/HTML Google Chart Intensity Map Tutorial below …
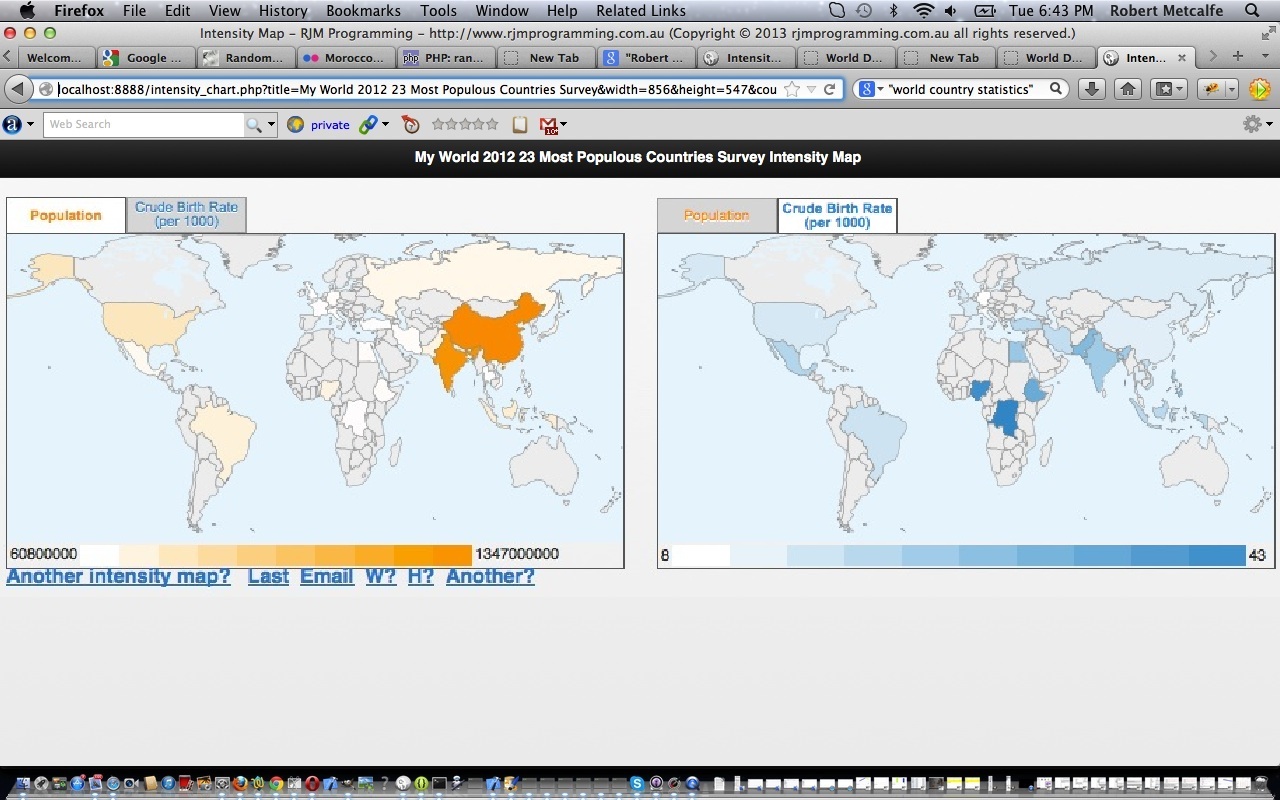
Here is a tutorial that introduces you to Google Graphs API, or Google Chart Tools, and its Intensity Map functionality.
Google Chart Tools provide a perfect way to visualize data on your website. From simple line charts to complex hierarchical tree maps, the chart galley provides a large number of well-designed chart types. Populating your data is easy using the provided client- and server-side tools.
Thanks to the World Bank for some statistics which helped a lot.
Let’s see some PHP code in live action for this tutorial where you define your intensity map characteristics and data.
Now part of an Android App called Geo Chart++ in July 2013.
Link to Google Chart Tools “spiritual home” … via Google.
Link to Google Chart Tools Intensity Map information … via Google.
Link to some downloadable PHP programming code … rename to intensity_chart.php.
If this was interesting you may be interested in this too.
If this was interesting you may be interested in this too.
If this was interesting you may be interested in this too.


13 Responses to Linux sort Tutorial