Here is a tutorial that introduces you to a great suite of office automation programs called OpenOffice, by Apache Software Foundation. OpenOffice has functionality like the Microsoft Office suite of programs, bringing the user a lot of the feel of those well loved concepts to your document creation work, and integrated into the one place. Great, mates, huh?!
Apache OpenOffice (AOO) is an open-source office productivity software suite. It descends from OpenOffice.org and IBM Lotus Symphony.[5]
Apache OpenOffice contains a word processor (Writer), a spreadsheet (Calc), a presentation application (Impress), a drawing application (Draw), a formula editor (Math), and a database management application (Base).[6]
Apache OpenOffice’s default file format is the OpenDocument Format (ODF), an ISO/IEC standard, which originated with OpenOffice.org. It can also read a wide variety of other file formats, with particular attention to those from Microsoft Office.
Apache OpenOffice is developed for Linux, OS X and Windows, with ports to other operating systems. It is distributed under the Apache License.[4] The first release was version 3.4.0, on 8 May 2012.[1]
As you would imagine, such a project has many parts to it, and we will explore some over time, but, as always …
- Feel free to explore yourself
- Visit search engines with more specific queries about specific topics, always add “OpenOffice” in there somewhere, and arrive at specialized forums and/or blogs and/or official sites
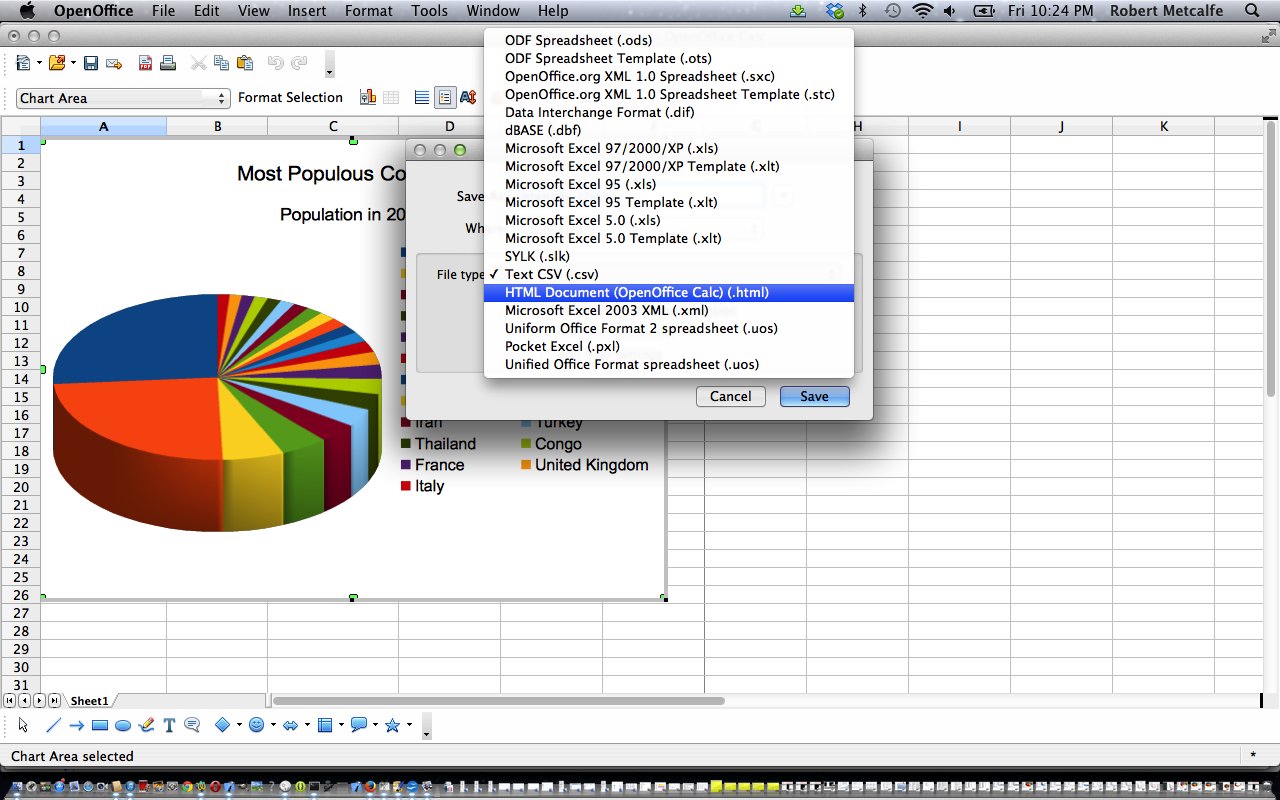
Today, we use some CSV data used previously at PHP/Javascript/HTML Google Chart JSON Data Table Import of CSV Tutorial to open a spreadsheet (like Microsoft Office Excel would do), and we will delimit, as required, and create a couple of charts (of interpretations of the data), which we will export to PDF and display on a local MAMP webserver (we are on a Mac laptop … we have shrunk to a bit of dust that you get near the bottom left of the keyboard’s “A” key (why so much there?) … hello). Who could call this website lame lame lame?!!
Link to input data file intensity_chart.csv
Link to output PDF Pie Chart data file intensity_chart_piechart.pdf
Link to output PDF Line Column chart data file intensity_chart_linecolumn.pdf
Link to output spreadsheet saved as webpage intensity_chart.html
Link to OpenOffice information … from Wikipedia as used by quote above.
Link to OpenOffice “spiritual home” … via Apache Software Foundation.
If this was interesting you may be interested in this too.


