YouTube API Caller Winding Up For Now Tutorial
We’re calling it quits after today regarding the YouTube media aspects to the Media Gallery web application yesterday’s YouTube API Caller Order and Completion Tutorial.
We’ll be back, because we always find things, and come across, via others mostly (thanks), new ways to do things, but what are the things achieved for the firstish time, for us, in this project? We think …
- Radio Play (better than a previous incarnation) of YouTube videos on mobile or non-mobile (and for the first time we can remember there were days when mobile was out ahead of non-mobile for it all working, curiously)
- Bluetooth has “hidden powers” … sorry to be this vague, but you need to test this YouTube API logics going into and out of Bluetooth
- continuous YouTube media play, this way, at the end of the day, needs your website to not be struggling, the logic dependent on setTimeout logics (which have to be continually called) … ie. you need to maintain “connection”
- how good is Lorem Picsum, thanks, regarding being a great free image repository … old news but good news
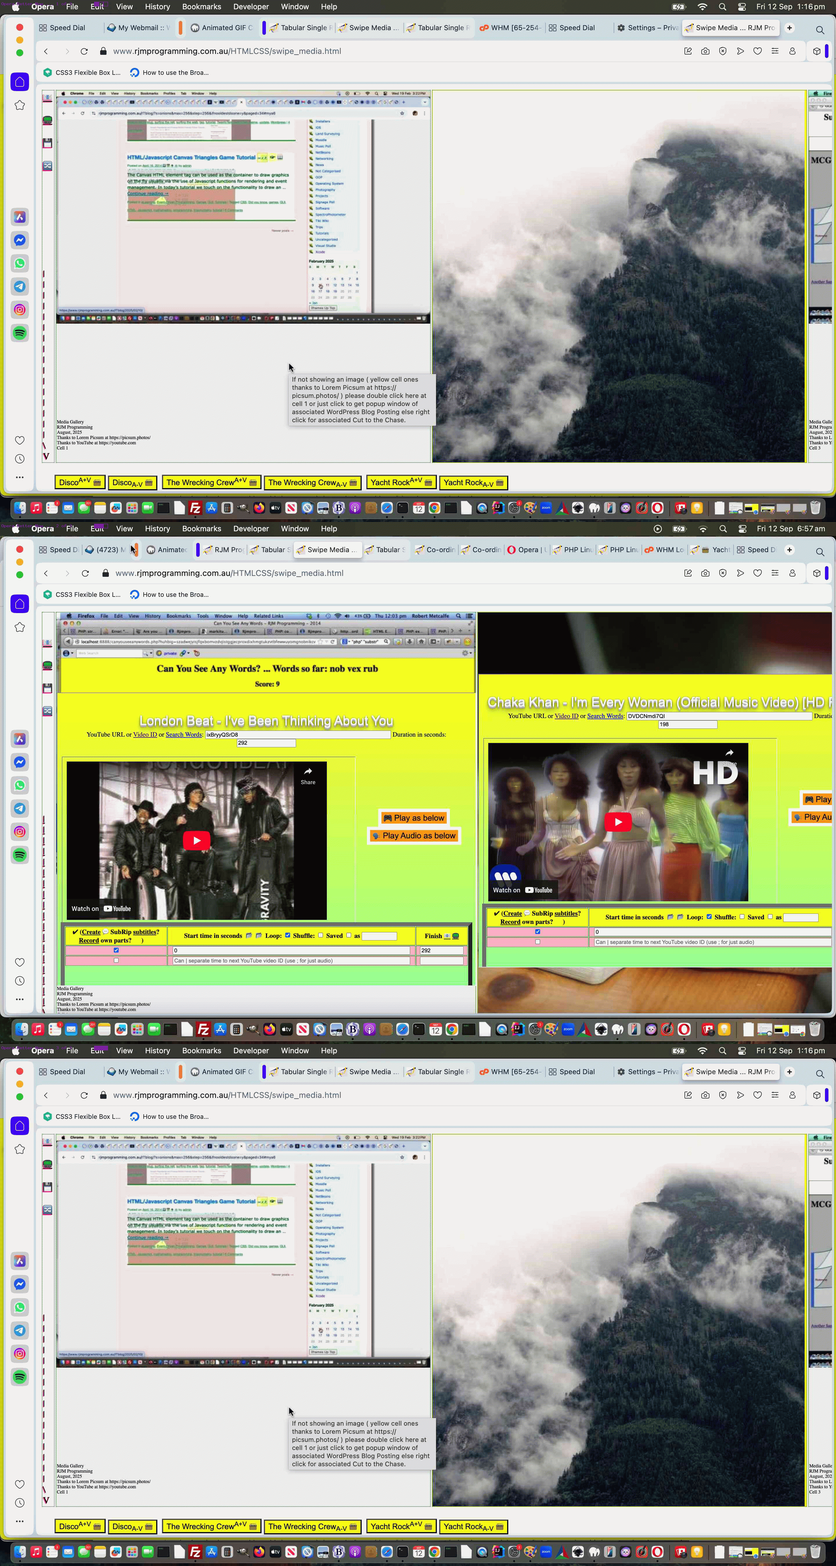
And so, today, we fixed up an issue that appeared to us using the macOS Opera browser. The bottom buttons were missing, and the fix will surprise some. Not fancy pants thinking …
var isOpera = (navigator.userAgent.match(/Opera|OPR\//) ? true : false);
var agentruew=eval('' + document.documentElement.clientWidth);
var agentrueh=eval('' + document.documentElement.clientHeight);
var amax=Math.max(agentruew,agentrueh);
var amin=Math.min(agentruew,agentrueh);
amin-=60;
//if (isOpera) {
// amin-=80;
//}
… just “dumbing it down” if you will. Trying a simple fix, like …
- removing two of the left hand cell | characters fixed the issue (highlighting the CSS subtleties of visibility:hidden; (still retaining the whitespace) versus display:none; (no retension of whitespace) approaches to hiding elements, in our case the “breadcrumb navigation” first approach we’re leaving in, in case we return to the idea under a visibility:hidden; paradigm)
- and while we were there removed the grating underlining of these
Doh!
And so, feel free to try the mildly tweaked swipe_media.html Tabular Single Row Media Gallery web application.
Did you know?
Yes, overthinking things can be detrimental. It is good to think complex issues through, away from any struggle you’ve been having for hours, when you only expected that issue to take a few minutes.
But … even above … we would not have arrived at the “| character removal” fix quickly, if we had not gone though the other “overthinking part tests” to ascertain what was possible, if you get my drift. How you spend development hours, and how efficient you are are variables, and will change from day to day. There might be days you are best not touching the keyboard (and ditch the mobile too).
Previous relevant YouTube API Caller Order and Completion Tutorial is shown below.
YouTube API Caller Order and Completion Tutorial
Up until yesterday’s YouTube API Caller Breadcrumb Navigation Tutorial a lot of the theme to …
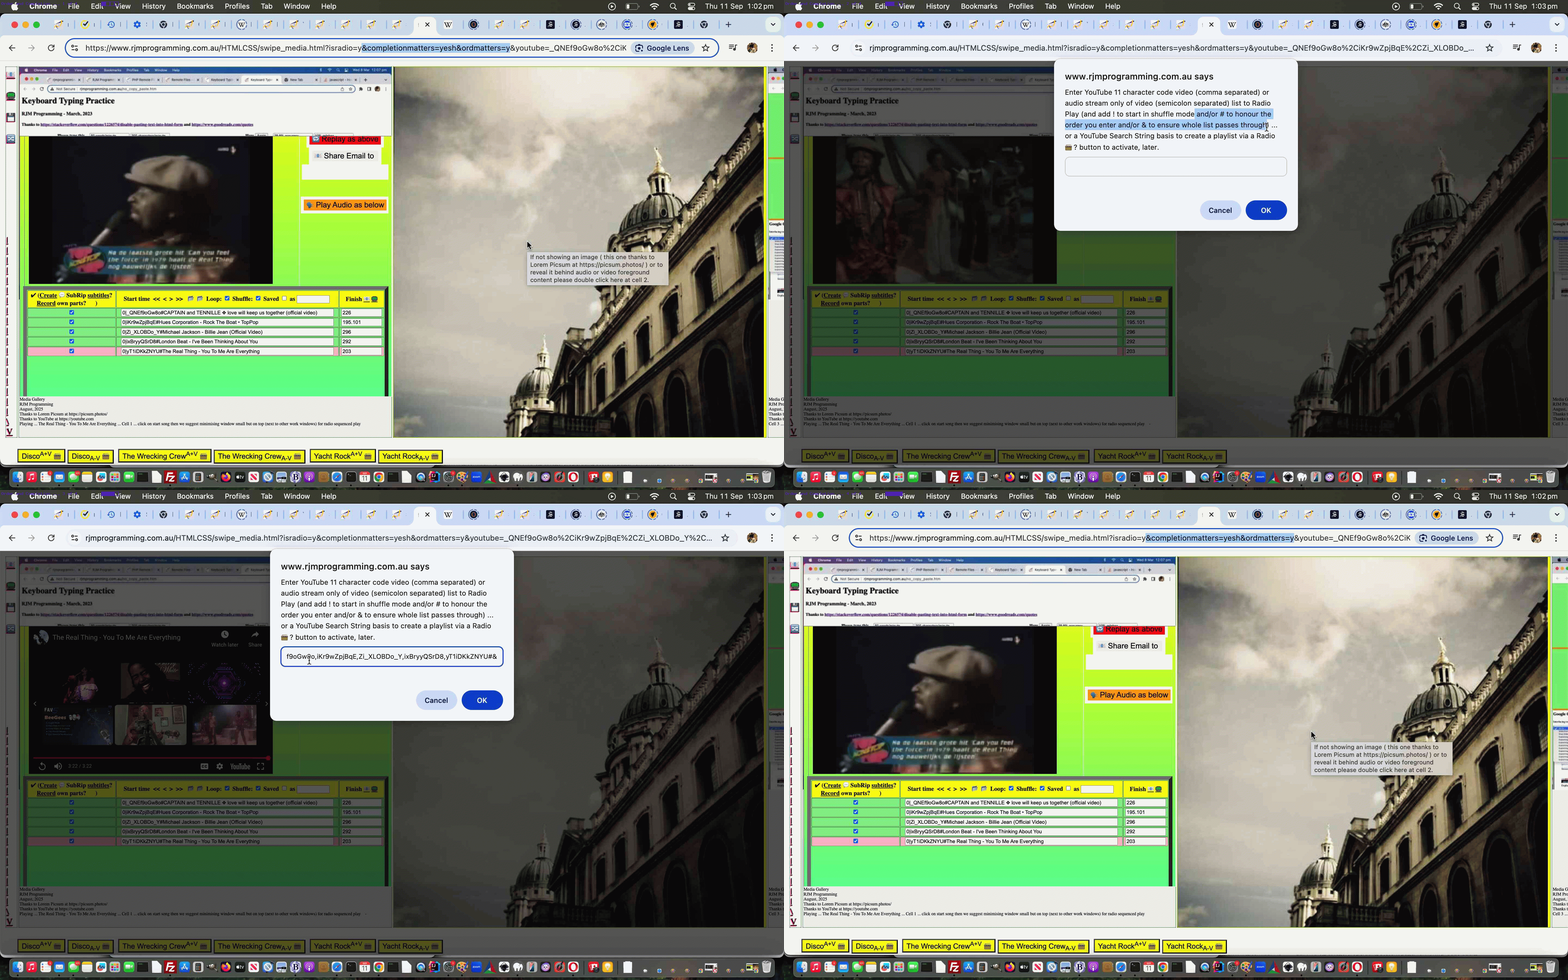
And further to the work of the day before yesterday’s YouTube API Caller Replaced Video Entry Tutorial we wanted to extend that logic introduced there in two ways …
- allow for a comma separated list of 11 character YouTube video IDs be accepted …
- have entries be immediately processed should the entry (or comma separated entries) be made in the currently active YouTube playing video’s associated textbox … via …
var geleven=-1;
function onoff() {
var nnum=0;
if (geleven >= 0) {
backtolist=['c' + eval('' + geleven)];
document.getElementById('c' + geleven).checked=false;
while (document.getElementById('i' + nnum)) {
if (('' + nnum) != ('' + geleven)) {
if (document.getElementById('c' + nnum).checked) {
backtolist.push('c' + eval('' + nnum));
}
document.getElementById('c' + nnum).checked=false;
}
nnum++;
}
//document.getElementById('c' + geleven).checked=true;
geleven=-geleven;
//checkval(document.getElementById('i' + Math.abs(geleven)));
setTimeout(function(){ document.getElementById('c0').checked=false; document.getElementById('c' + Math.abs(geleven)).checked=true; }, 2400);
setTimeout(function(){ for (var ik=0; ik<backtolist.length; ik++) { document.getElementById(backtolist[ik]).checked=true; } backtolist=[]; }, 6500);
}
}
… into the mix in …
Previous relevant YouTube API Caller Breadcrumb Navigation Tutorial is shown below.
YouTube API Caller Breadcrumb Navigation Tutorial
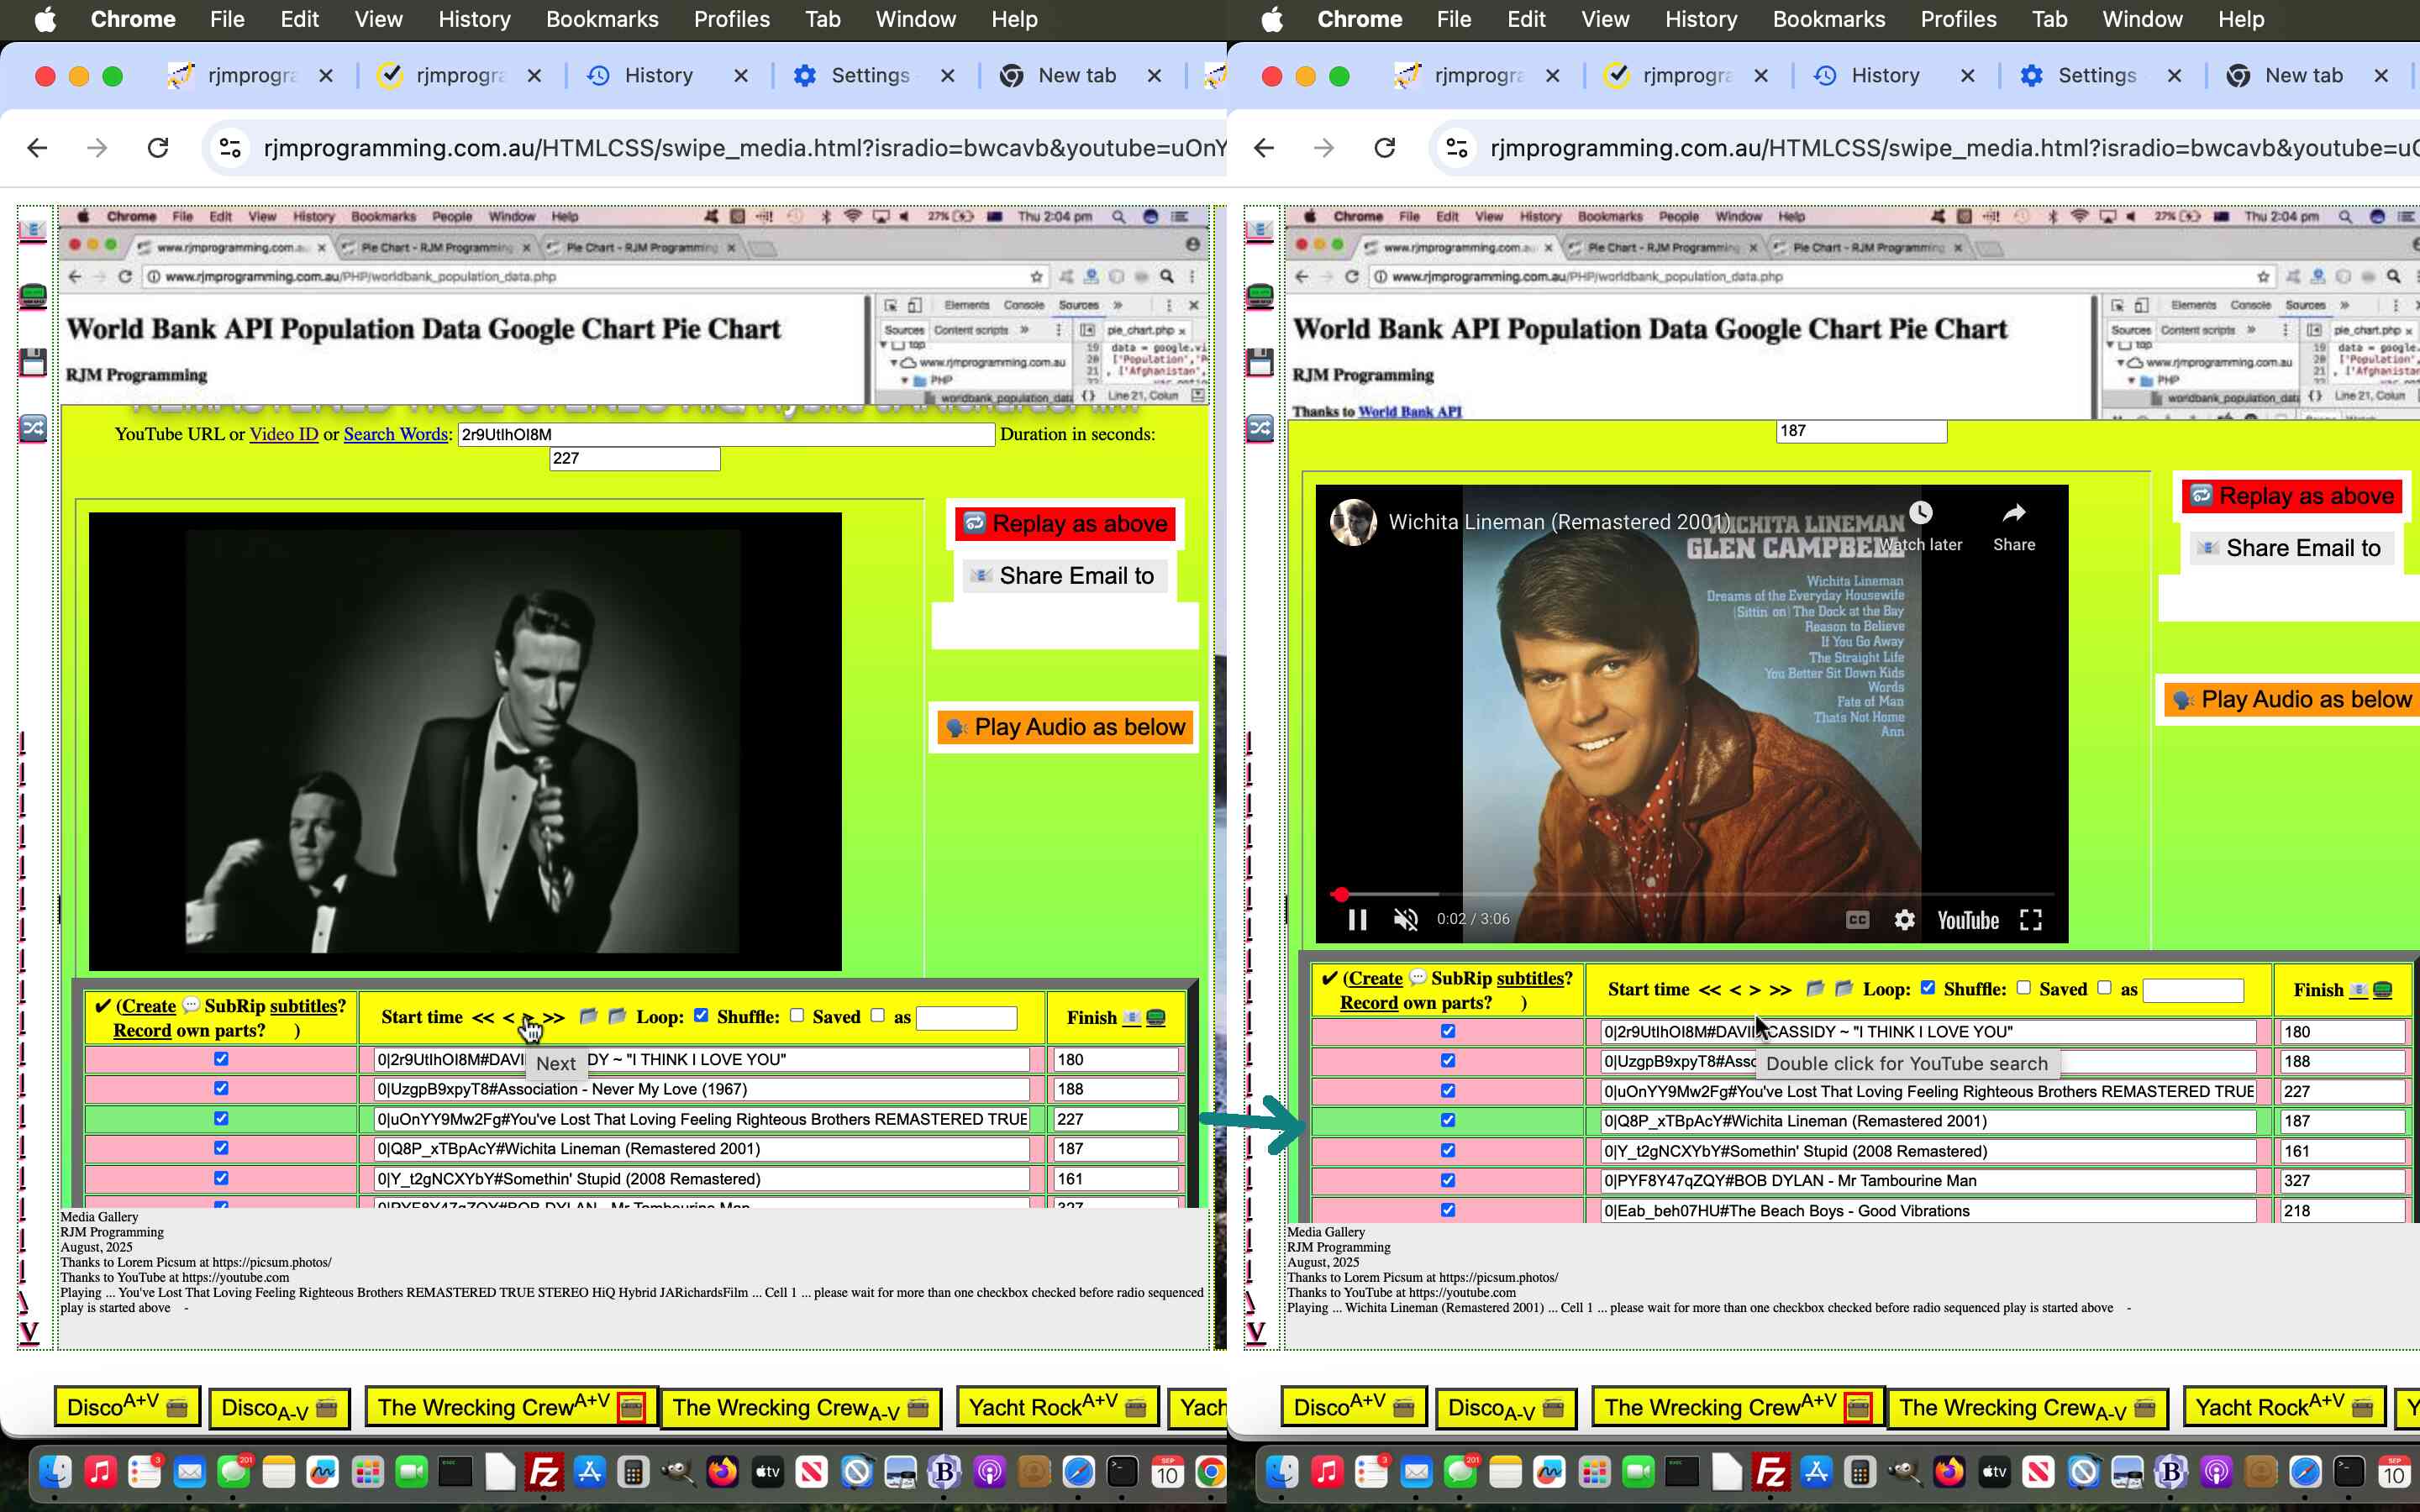
Further to yesterday’s YouTube API Caller Replaced Video Entry Tutorial we wanted to offer the “Radio Play” users of our Tabular Single Row Media Gallery web application the chance to use Breadcrumb style navigation aids regarding …
- << … navigate to first YouTube video of interest in the playlist
- < … navigate to previous YouTube video of interest in the playlist
- > … navigate to next YouTube video of interest in the playlist
- >> … navigate to last YouTube video of interest in the playlist
… referencing this onclick Javascript logic …
function knaviga(evt) {
var oso=evt.target;
evt.stopPropagation();
if (eval('' + backtolist.length) > 0) {
for (var iik=0; iik<backtolist.length; iik++) {
document.getElementById('' + backtolist[iik]).checked=true;
}
}
backtolist=[];
var keepg=true, ik=0, lva='0';
prevwoin='0';
woinnext='0';
woinlast='0.0';
firstwoin='0.0';
//xnextwoin='999';
var knum=0;
while (document.getElementById('xx' + knum)) {
if (('' + document.getElementById('xx' + knum).outerHTML).indexOf('green') != -1) {
prevwoin='' + lva;
if (1 == 1 || eval('' + knum) > eval('' + xnextwoin)) { xnextwoin='' + knum; }
lva='' + knum;
woinnext=woinnext.replace('.0','');
}
if (document.getElementById('c' + knum)) {
if (document.getElementById('c' + knum).checked) {
if (firstwoin.indexOf('.0') != -1) {
firstwoin='' + knum;
woinlast='' + knum;
} else {
woinlast='' + knum;
}
if (eval('' + knum) == eval('' + xnextwoin)) {
woinnext='' + knum + '';
} else if (eval('' + knum) > eval('' + xnextwoin) && woinnext.indexOf('.0') == -1) {
woinnext='' + knum + '.0';
}
backtolist.push('c' + knum);
}
}
knum++;
}
knum=0;
while (document.getElementById('c' + knum)) {
if (eval('' + knum) < eval('' + xnextwoin)) { prevwoin='' + knum; }
knum++;
}
var ourthisval='' + oso.id;
//top.document.title='' + xnextwoin + ':' + document.getElementById('xx0').outerHTML.split('>')[0] + ':' + ('' + new Date());
if (keepg && window.parent) {
if (top.document.getElementById('navig')) {
if (ourthisval.trim() != '') {
if (ourthisval.trim() == 'sback') {
if (document.getElementById('c' + xnextwoin)) {
for (ik=0; ik<knum; ik++) {
if (('' + ik) != ('' + prevwoin) && document.getElementById('c' + ik)) {
document.getElementById('c' + ik).checked=false;
}
}
setTimeout(function(){ for (var ik=0; ik<backtolist.length; ik++) { document.getElementById(backtolist[ik]).checked=true; } backtolist=[]; }, 3500);
}
} else if (ourthisval.trim() == 'snext') {
if (document.getElementById('c' + xnextwoin)) {
for (ik=0; ik<knum; ik++) {
if (('' + ik) != ('' + woinnext.split('.')[0]) && document.getElementById('c' + ik)) {
document.getElementById('c' + ik).checked=false;
}
}
setTimeout(function(){ for (var ik=0; ik<backtolist.length; ik++) { document.getElementById(backtolist[ik]).checked=true; } backtolist=[]; }, 3500);
}
//alert('bYES ' + nextwoin + parent.document.getElementById('navig').value);
} else if (ourthisval.trim() == 'sfirst') {
if (document.getElementById('c' + xnextwoin)) {
for (ik=0; ik<knum; ik++) {
if (('' + ik) != ('' + firstwoin.split('.')[0]) && document.getElementById('c' + ik)) {
document.getElementById('c' + ik).checked=false;
}
}
setTimeout(function(){ for (var ik=0; ik<backtolist.length; ik++) { document.getElementById(backtolist[ik]).checked=true; } backtolist=[]; }, 3500);
}
} else if (ourthisval.trim() == 'slast') {
if (document.getElementById('c' + xnextwoin)) {
for (ik=0; ik<knum; ik++) {
if (('' + ik) != ('' + woinlast.split('.')[0]) && document.getElementById('c' + ik)) {
document.getElementById('c' + ik).checked=false;
}
}
setTimeout(function(){ for (var ik=0; ik<backtolist.length; ik++) { document.getElementById(backtolist[ik]).checked=true; } backtolist=[]; }, 3500);
}
}
parent.document.getElementById('navig').value='';
}
}
}
}
… along with the “single song obsessional looping” logic of a couple of days ago made toggleable (to better fit in with these new ideas, we felt), all in the changed karaoke_youtube_api.htm inhouse YouTube video interfacer and establish a two day limit of availability regarding data URI public URL media links, enough time we figure for sharing and any collaboration (but will not translate well for any saved playlist arrangements involving any data URI user based entries and outside those two days, alas) in our changed PHP helper signature_signature.php …
<?php
if (isset($_POST['an_i_tidy']) || isset($_GET['an_i_tidy'])) {
foreach (glob($_SERVER['DOCUMENT_ROOT'] . DIRECTORY_SEPARATOR . 'tmp' . DIRECTORY_SEPARATOR . 'karaoke_i_bizzo_' . '*.*') as $dfilename) {
$filemtime = filemtime($dfilename);
if (time() - $filemtime >= 172800) { // 86400 seconds in a day
unlink($dfilename);
}
}
}
?>
… called by the modified stop_start_youtube.html YouTube API caller.
Previous relevant YouTube API Caller Replaced Video Entry Tutorial is shown below.
YouTube API Caller Replaced Video Entry Tutorial
In addition to the …
- user entry URL … and now …
- user entry data URI … optionally using local file browsing …
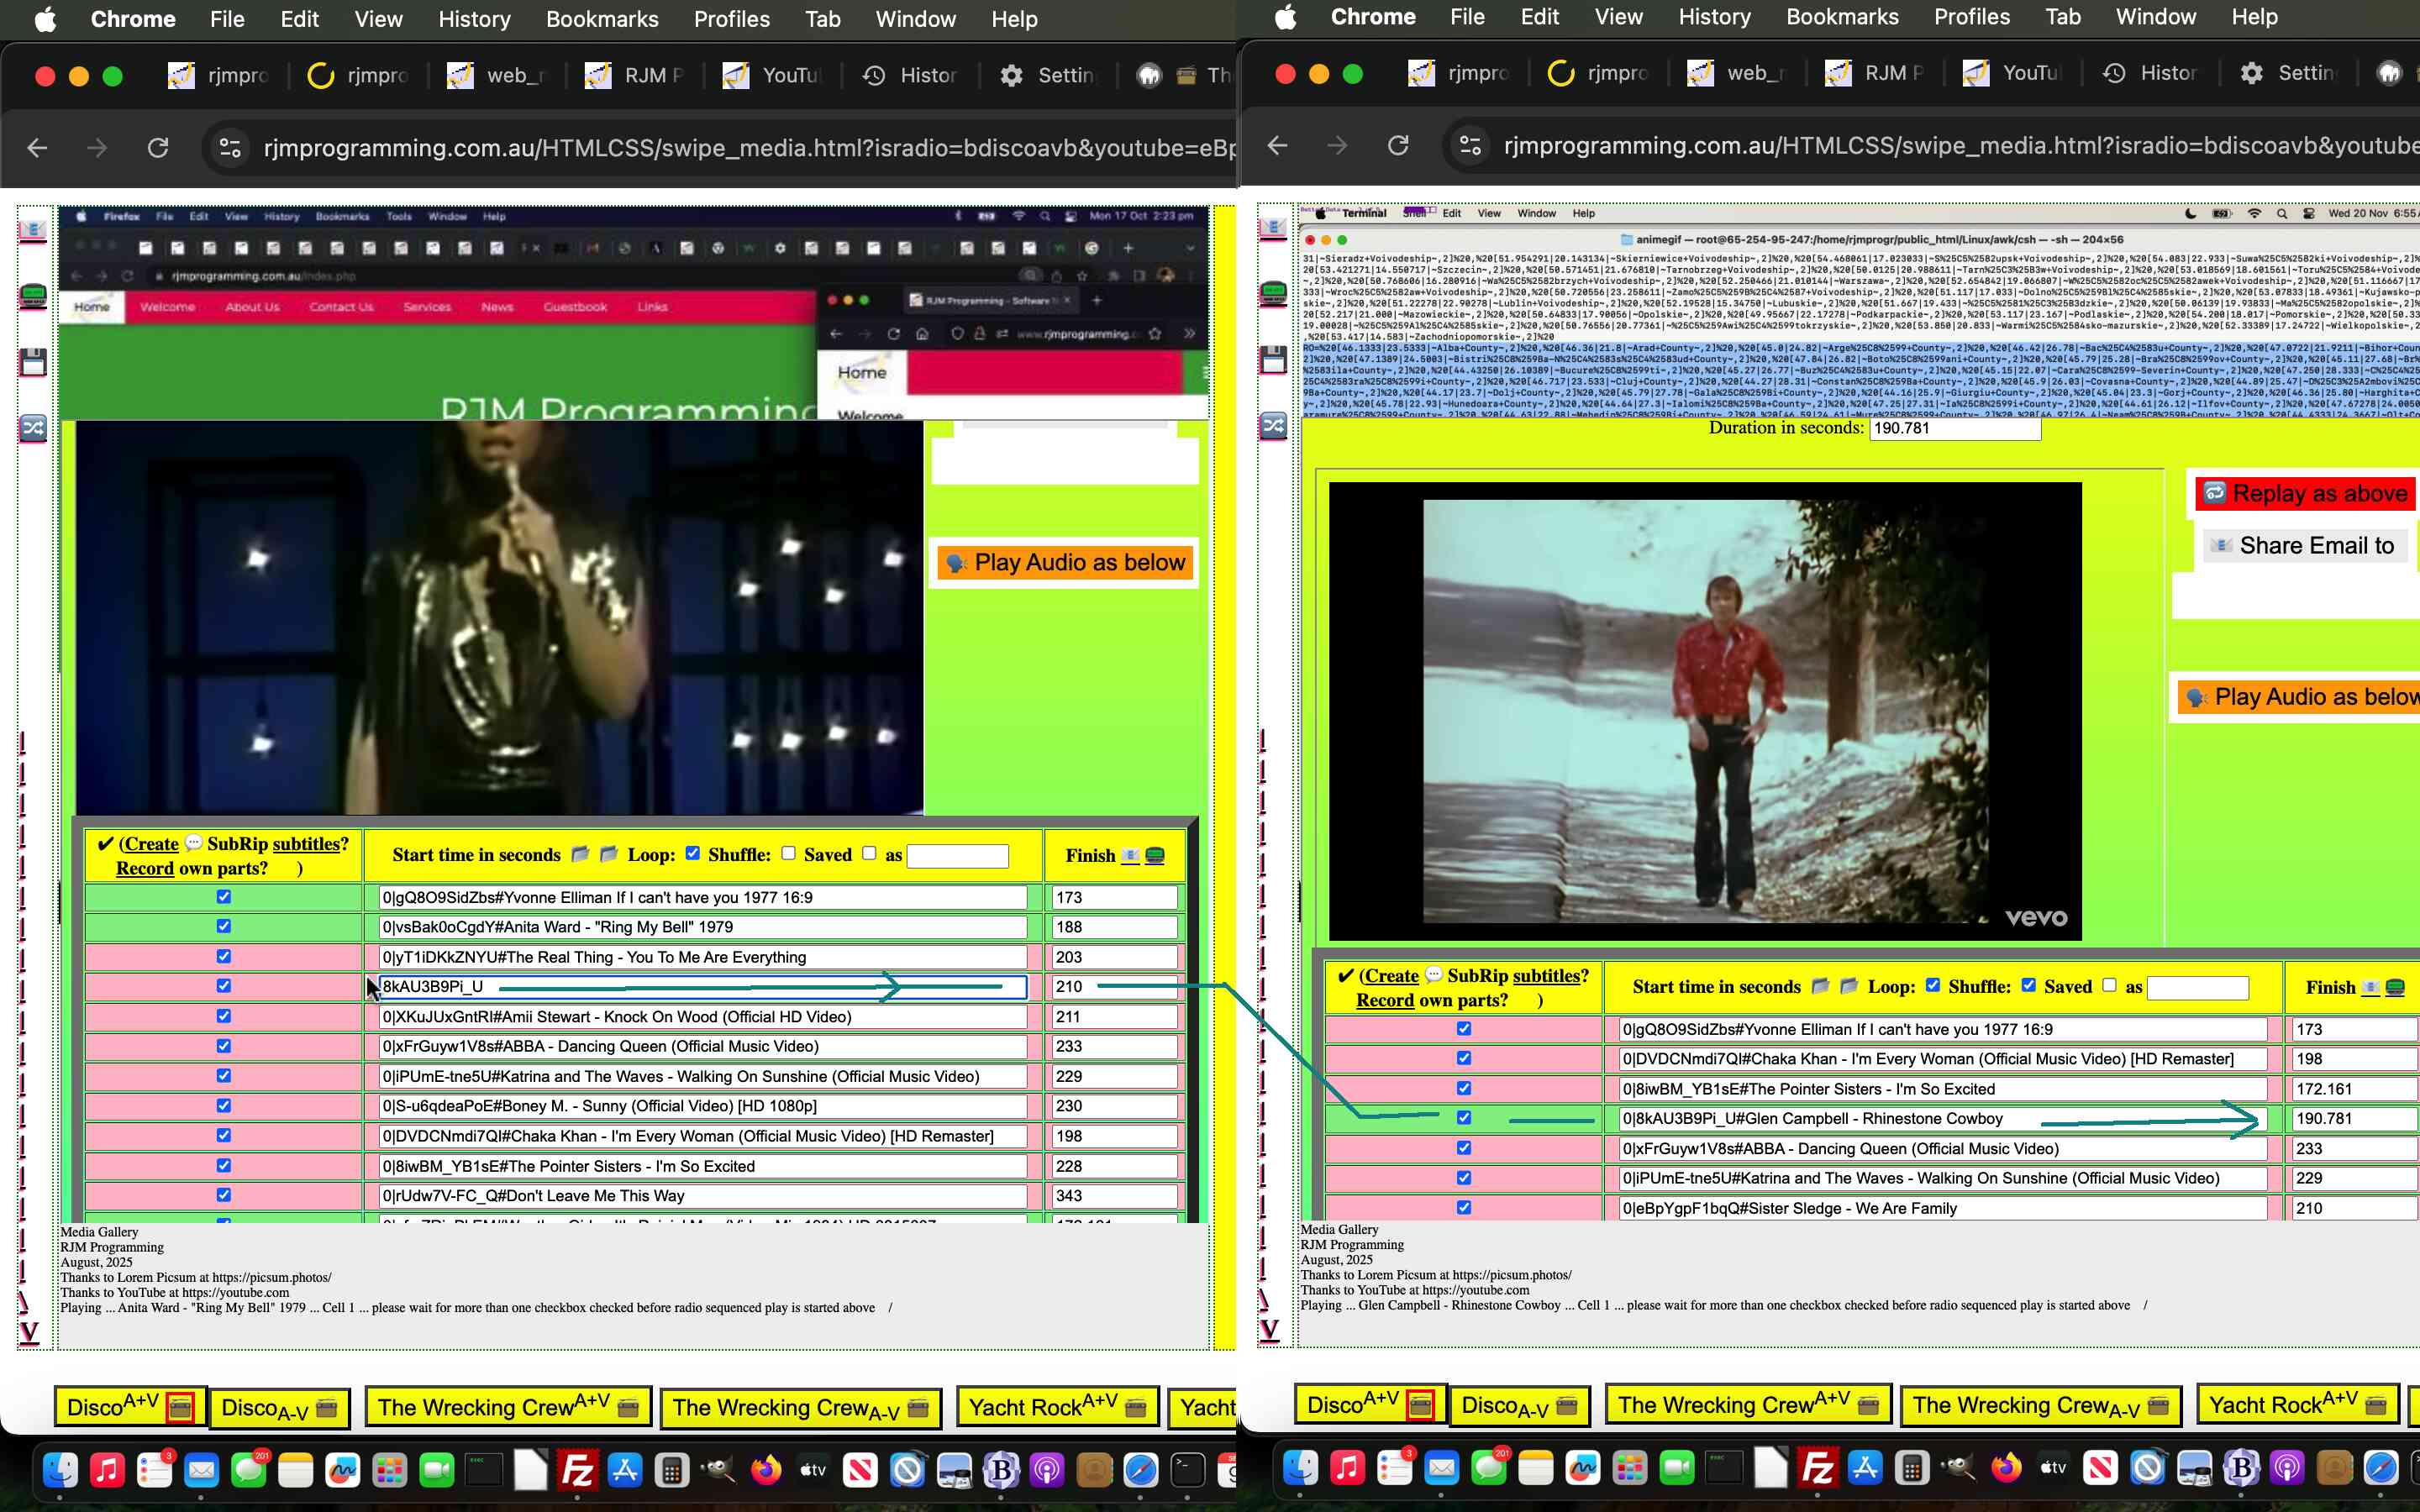
… playlist amending tools available to users within yesterday’s YouTube API Caller Radio Play Phase Two Data URI PHP Tutorial today we’ve added the more obvious …
user entry of different YouTube 11 character video ID
… into the mix in …
Previous relevant YouTube API Caller Radio Play Phase Two Data URI PHP Tutorial is shown below.
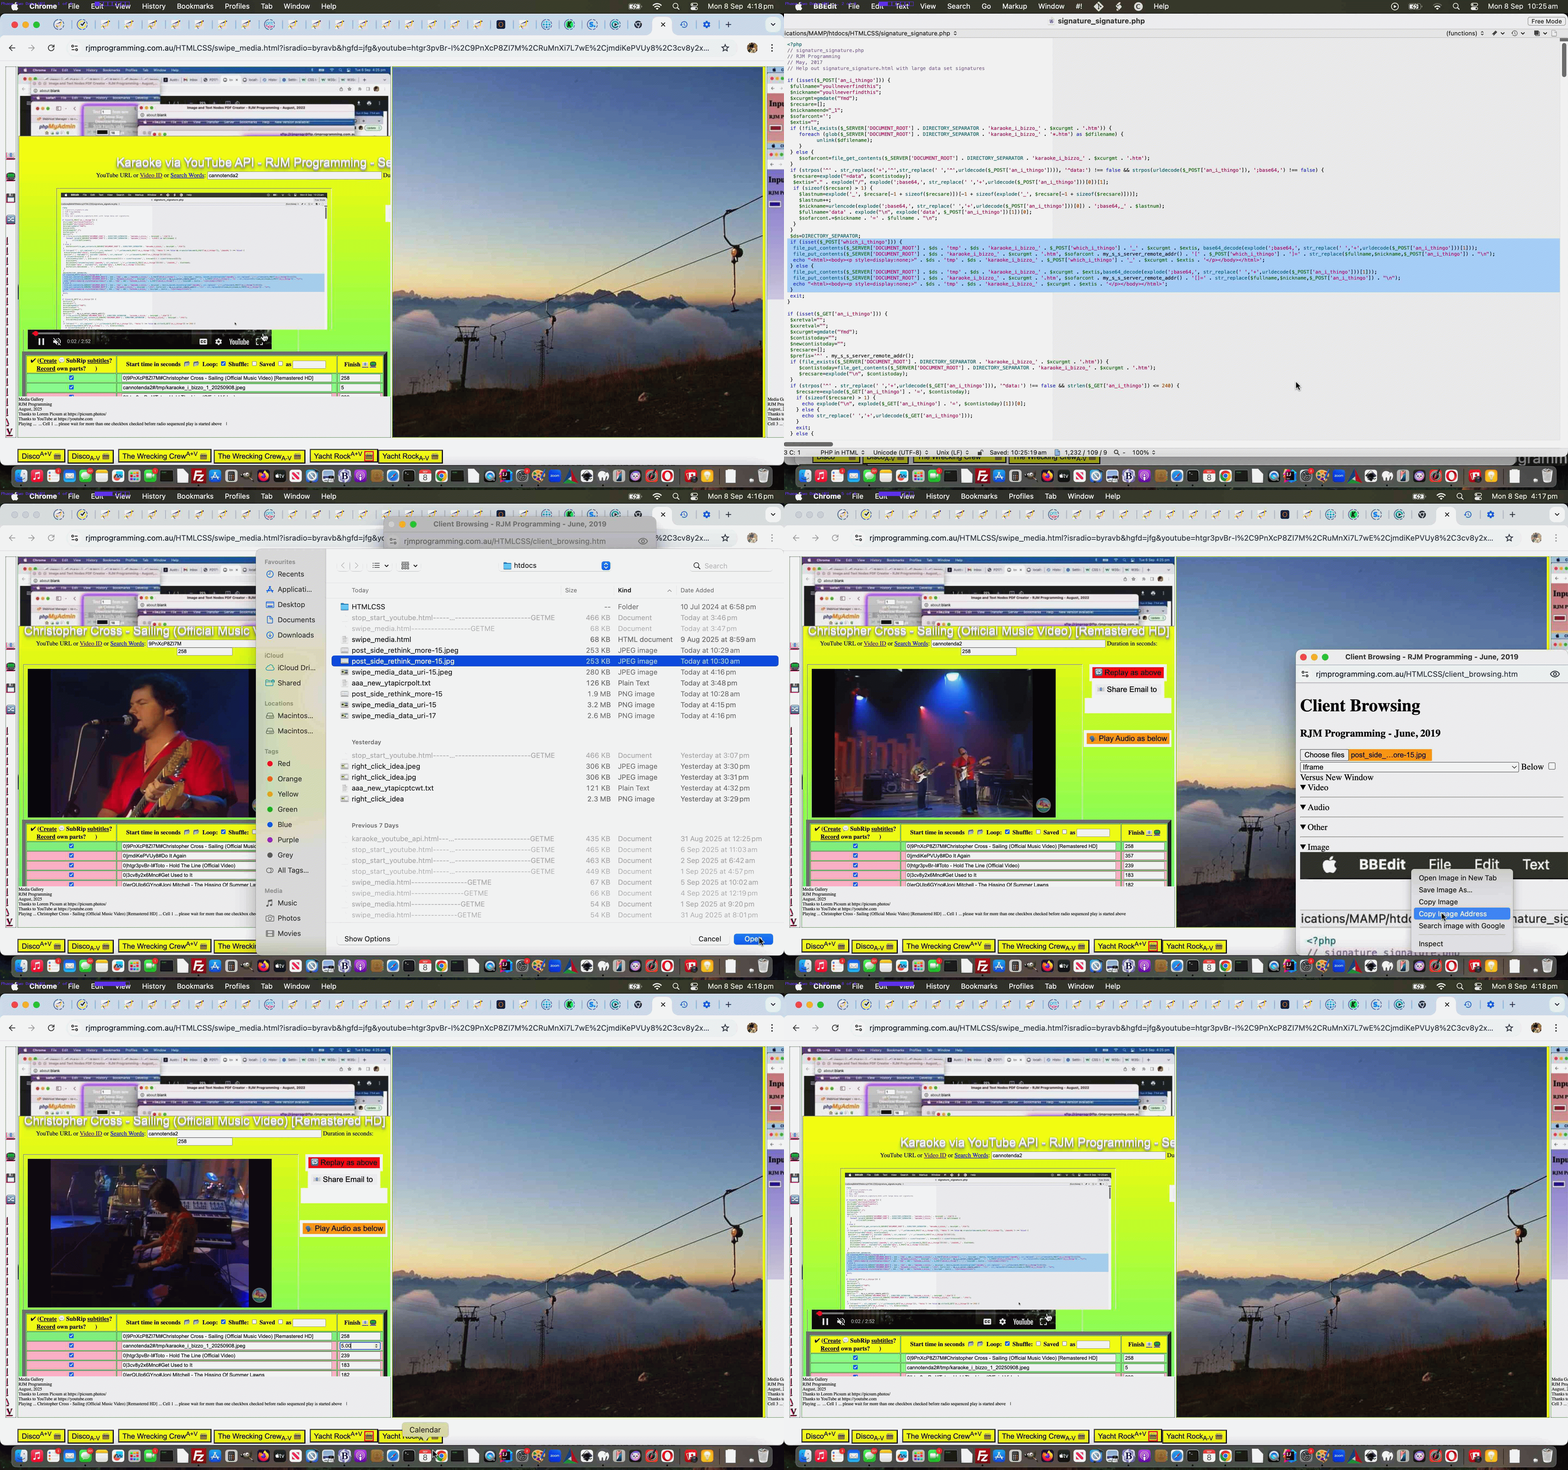
YouTube API Caller Radio Play Phase Two Data URI PHP Tutorial
Further to yesterday’s YouTube API Caller Radio Play Obsession Looping Tutorial, and concerning …
- phase two data URI user media interactive textbox entries …
- we’d actually started down it’s road in our first pass of PHP work a couple of weeks ago … and we are really happy we “let that stew” because …
- returning to the work today we developed a much easier concept than …
- give the data URI a nickname shortening that data URI and bring it into play at the appropriate moment … versus today’s much better …
- store the data as a media file on our server for a length of time (we haven’t organized yet)
That way a …
- data URI is entered into a textbox by the user … and they can locally browse for this if they want …
- the onblur event logic immediately calls the PHP to create the temporary web server media file (stored in a public URL place) … so …
- into the textbox we map the public URL place media URL over the data URI
… and avoid any “too long URL” errors as well as not needing to map between any nicknames with real data URI data … much easier!
Why involve PHP? The amounts of data regarding data URIs precludes a feasible (ie. we’re not saying it’s impossible) clientside only approach. We need to create data files and the serverside is the best place we can think of to do that in …
Previous relevant YouTube API Caller Radio Play Obsession Looping Tutorial is shown below.
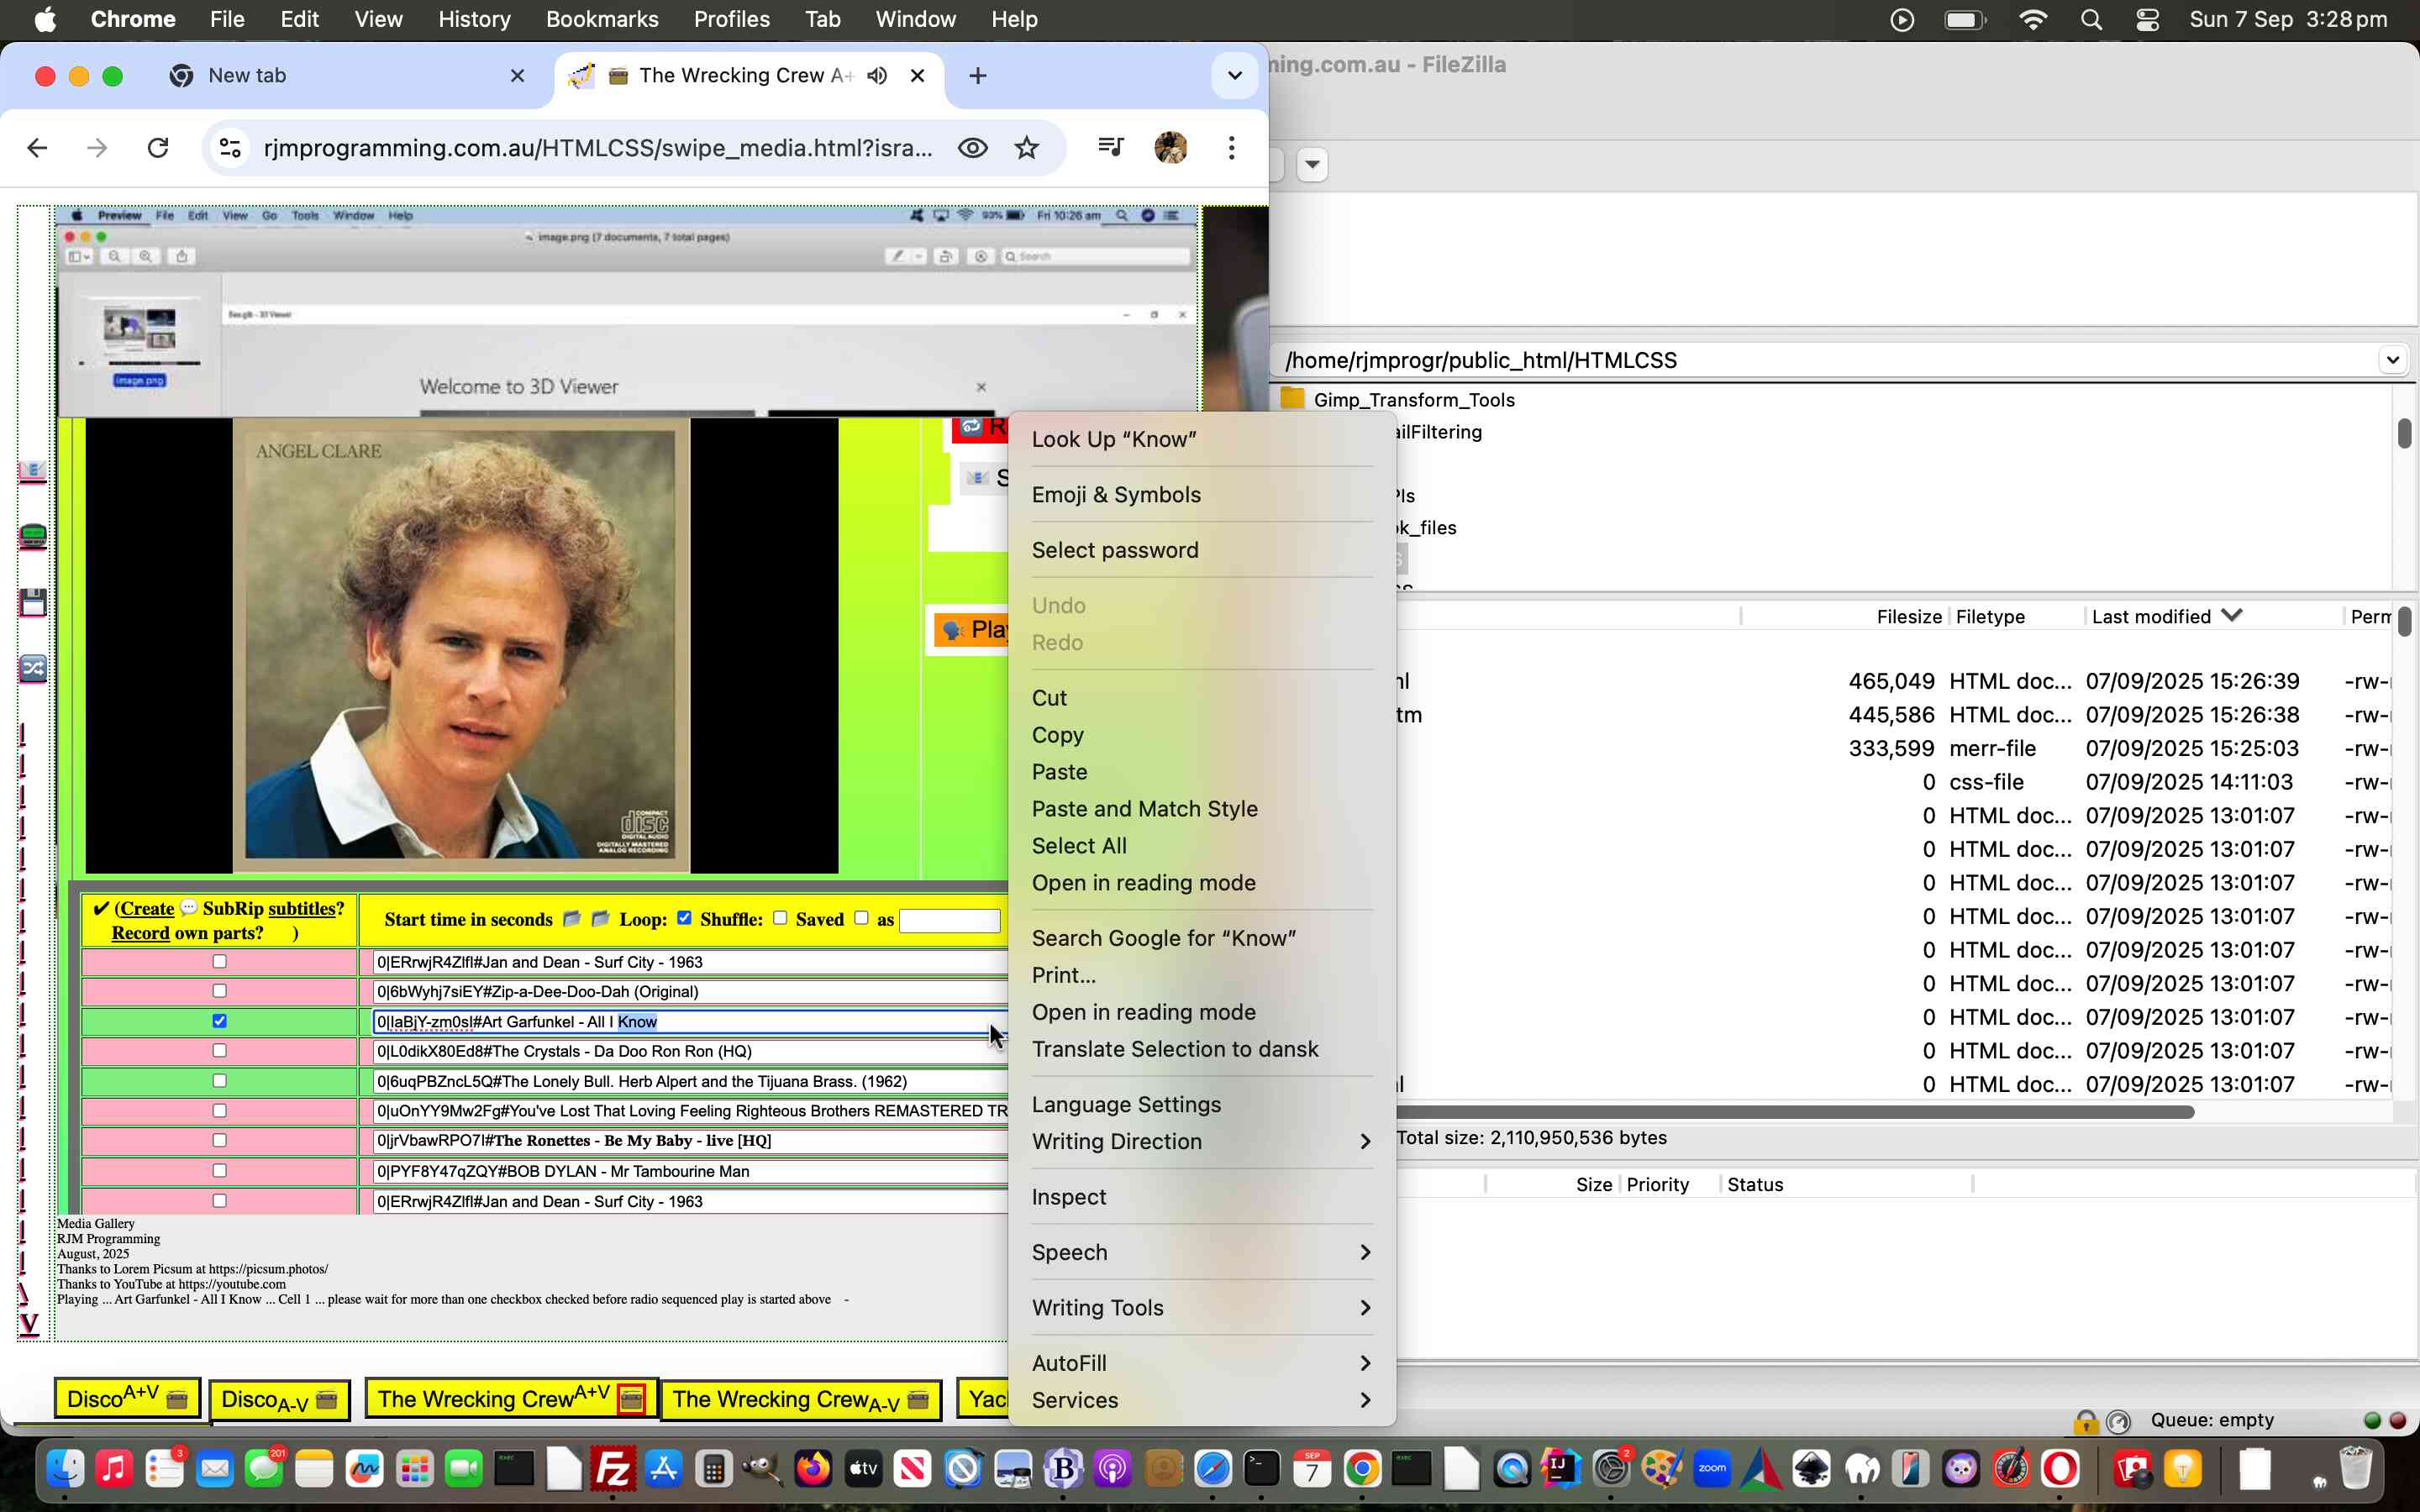
YouTube API Caller Radio Play Obsession Looping Tutorial
Yesterday’s YouTube API Caller Phase Two Console Warning Tutorial outlined why …
- “single song obsessional looping” … sits uneasily with …
- “set of song videos looping” … in Radio Play mode of use
… with our recent Tabular Single Row Image Gallery web application.
But they don’t have to be totally inalienable concepts, as we outlined …
where, now, if you are after some “single song obsessional looping” try unchecking all checkboxes except the one of your obsession … and good luck ending the itch!
That remains true, but we wanted an easier way to allow for “single song obsessional looping” in Radio Play modes of use. We wanted to hook into an unused event arrangement related to those textboxes to the right of the left hand side checkboxes. We decided on …
- oncontextmenu … ie. right click … on non-mobile platforms … and …
- ontouchmove … on mobile platforms
… via (at the grandchild level) …
for (var iipp=0; iipp<=29; iipp++) {
if (('' + top.document.URL).indexOf('isradio=') != -1) {
if (parent.document.getElementById('i' + iipp).outerHTML.indexOf(' oncontextmmenu=') == -1) {
parent.document.getElementById('i' + iipp).oncontextmenu=function(event){ parent.obsessabout(event); };
parent.document.getElementById('i' + iipp).ontouchmove=function(event){ parent.obsessabout(event); };
if (istitles.indexOf(iipp) == -1) {
istitles.push(iipp);
}
if (iipp == 0) {
setTimeout(function(){
for (var jipp=0; jipp<istitles.length; jipp++) {
if (('' + parent.document.getElementById('i' + jipp).title) == '') {
parent.document.getElementById('i' + jipp).title+=' Right click or touch move to loop just this video';
} else {
parent.document.getElementById('i' + jipp).title+=' and right click or touch move to loop just this video';
}
}
}, 8000);
}
}
}
// rest of for loop code
}
… actioned (at the child/parent level) …
function obsessabout(evt) {
evt.stopPropagation();
var theonetokeep=('' + evt.target.id).replace('i','');
var nnum=0;
document.getElementById('c' + theonetokeep).checked=true;
while (document.getElementById('i' + nnum)) {
if (('' + nnum) != ('' + theonetokeep)) {
document.getElementById('c' + nnum).checked=false;
}
nnum++;
}
}
… in …
… especially related to the grandparent level Tabular Single Row Image Gallery web application’s “Radio Play” mode of use.
Previous relevant YouTube API Caller Phase Two Console Warning Tutorial is shown below.
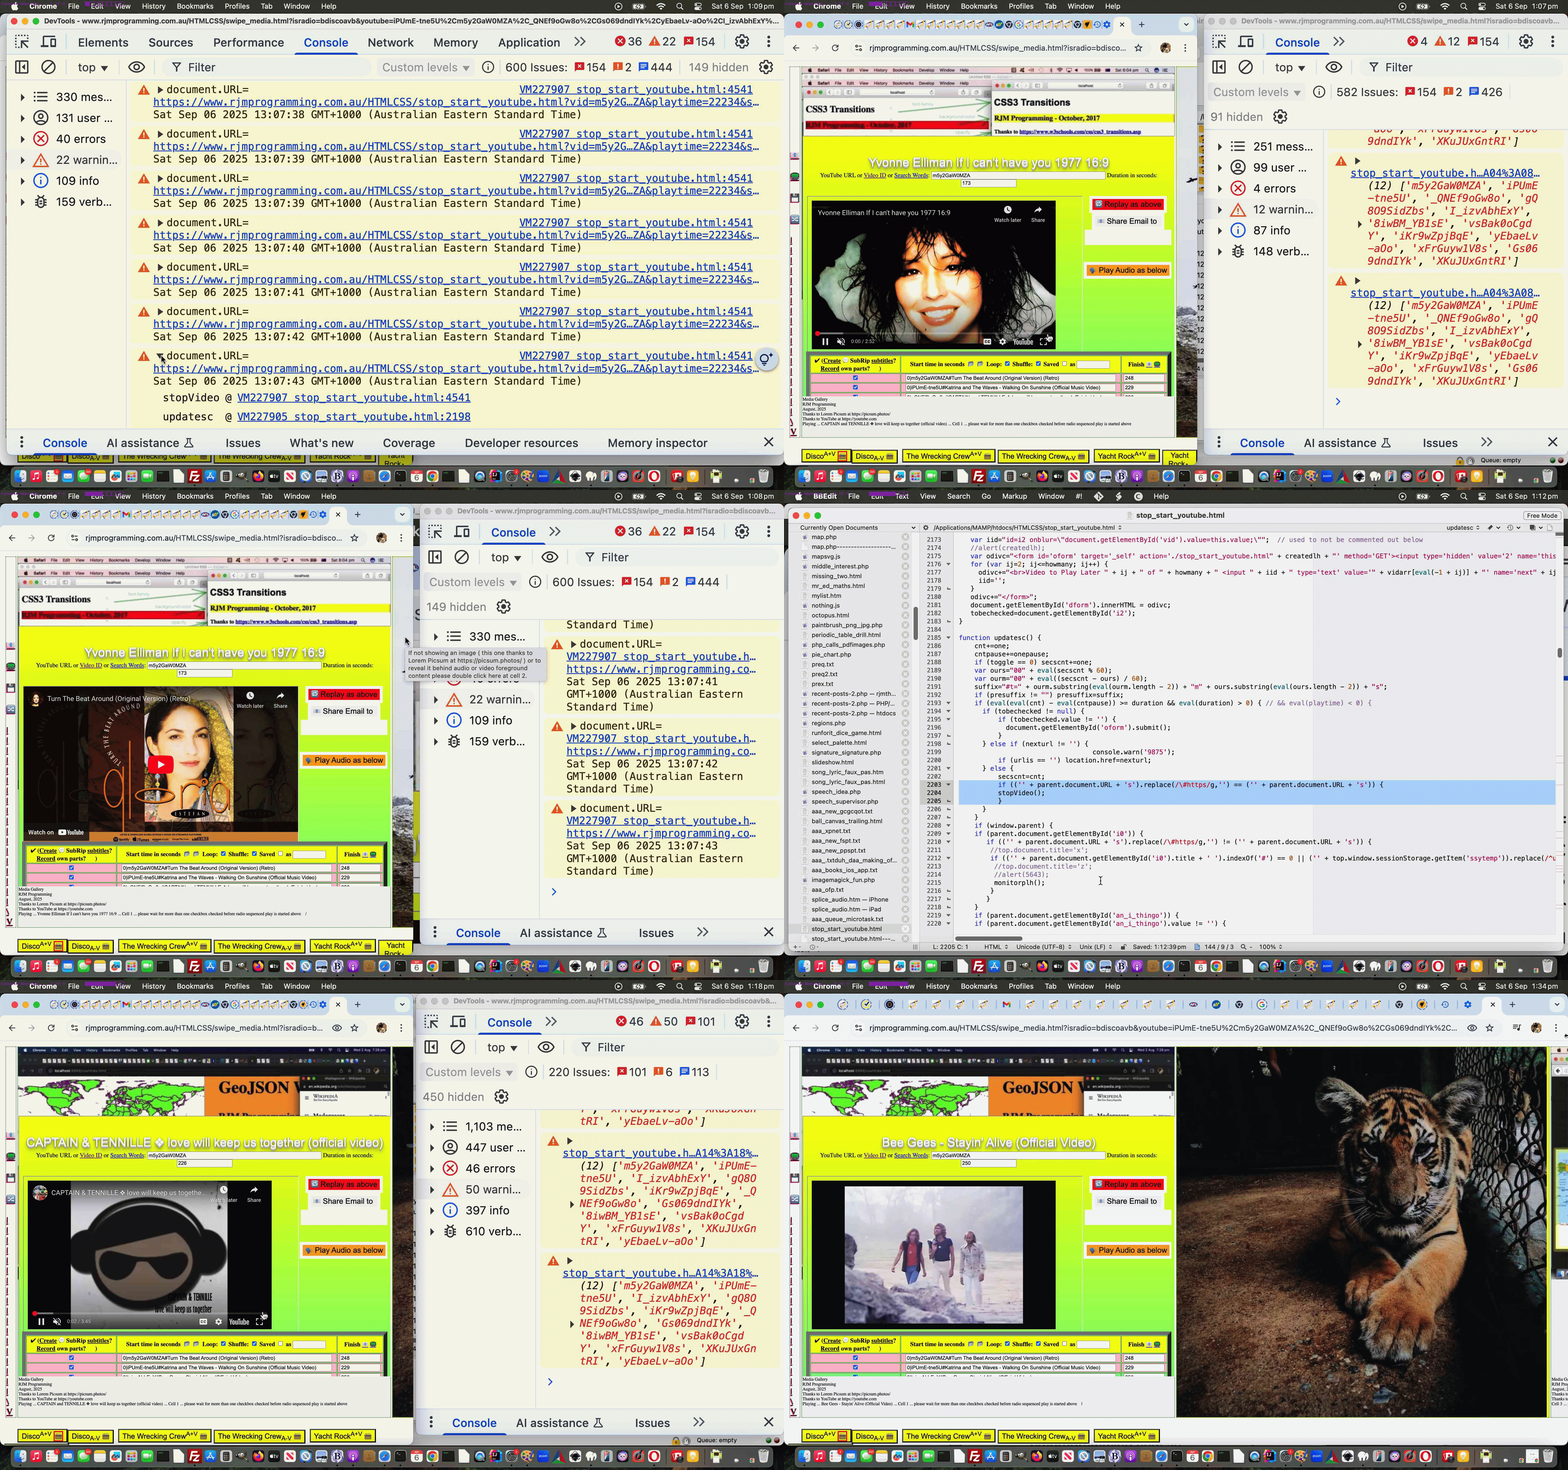
YouTube API Caller Phase Two Console Warning Tutorial
Continuing on from yesterday’s YouTube API Caller Phase Two Text Cursor Tutorial …
What the dickens is “Console Warning”?
Well, it’s a new good friend to us using the Google Chrome web browser (but other web browsers can work it too) Web Inspector‘s division of “issue or not” reporting you can get your web applications to do via Javascript to debug or inform as the web application executes. We have found …
console.warn('Any text of your interest, not just the technical sense of a warning error in http land.');
… as a useful way to sort the chaff from the rest trying to analyse issues. Tissues for issues?! Most web application get issues from the time you give birth and well into their adolescent years to when they get deprecated and sent to “the scrapheap of the online wooooorrrrrllllddddd” … shipped off to Mars we’re predicting next … oops … too many plays of this we’re suspecting … although …

… it might have passed the notice of some?!
Anyway, the day of “shoring up” our Tabular Single Row Image Gallery web application’s “Radio Play” mode of use started with an innocent question …
Why is the web application “less flaky” just after we clear the web browser cache for an hour?
Our first suspect we just launched into without proof, but really conditionally did much less of …
if (('' + parent.document.URL).replace(/\%23http$/g,'#http').replace(/\#http$/g,'') == ('' + parent.document.URL)) { // ie. "Radio Play"
if (('' + window.sessionStorage.getItem('loop_' + vid.split(',')[0])).replace(/^undefined/g,'').replace(/^null/g,'').trim() != '') {
window.sessionStorage.removeItem('loop_' + vid.split(',')[0]);
}
window.sessionStorage.setItem('loop_' + vid.split(',')[0], 'y');
}
… window.sessionStorage means by which to encourage the “single song obsessional looping” talked about below.
Our second suspect, that the thinking above leads to, was the “encouragement of single song obsessional looping” (from audio stream of video days early on in this project, even) as distinct from …
"encouragement of set of song videos looping"
… this latter mode of use asking in our “three tier hierarchical web application environment” that …
The grandchild must be set free … aka Home Alone … to work alone and unsupported.
… an idea which is anathema to other ways we’ve worked our inhouse YouTube API calling work.
In this new wooooorrrrllllddd calls to YouTube API’s …
player.stopVideo(); /// or player.pauseVideo() for that matter
… are definite nonos, as are calls from the “middle child”. But the code is full of such calls, and other uses of player.stopVideo() suit other modes of use? Right?!
You betcha!
We need to debug which codelines containing player.stopVideo() or “middle child” calls to narrow down the relevant one or two making the web application “flaky”. Well, using codelines such as …
// Middle child ...
console.warn('here at 13 ' + ('' + new Date()) + ' ' + document.getElementById('myiframe').title + ' ?vid=' + ourvid + "&playtime=" + thisd + "&start=" + document.getElementById('i' + i).value.split(';')[0] + '&ct=' + encodeURIComponent(ndt.toUTCString()) + onestodoprefix + encodeURIComponent(onestodosuffix));
// Grandchild ...
console.log('' + ('' + new Date()) + ' ViD=' + vid + ' ivid=' + ivid + ' referrer=' + document.referrer + ' uRl=' + document.URL);
… with those timestamps and “relative isolation” into the console tab’s “Warning section” helping heaps, thanks to the powers that be! It got us to where we knew when to intervene … a variable kpi became -1 (the one place possible being) …
kpi=-1;
console.log('document.URL=' + document.URL + ' ' + ('' + new Date()));
console.warn('document.URL=' + document.URL + ' ' + ('' + new Date()));
keepParentInformed();
… the debugging information of which narrowed down the contention to this fix …
function updatesc() {
cnt+=one;
cntpause+=onepause;
if (toggle == 0) secscnt+=one;
var ours="00" + eval(secscnt % 60);
var ourm="00" + eval((secscnt - ours) / 60);
suffix="#t=" + ourm.substring(eval(ourm.length - 2)) + "m" + ours.substring(eval(ours.length - 2)) + "s";
if (presuffix != "") presuffix=suffix;
if (eval(eval(cnt) - eval(cntpause)) >= duration && eval(duration) > 0) { // && eval(playtime) < 0) {
if (tobechecked != null) {
if (tobechecked.value != '') {
document.getElementById('oform').submit();
}
} else if (nexturl != '') {
console.warn('9875');
if (urlis == '') location.href=nexturl;
} else {
secscnt=cnt;
if (('' + parent.document.URL + 's').replace(/\#https/g,'') == ('' + parent.document.URL + 's')) { // but not for "Radio Play"
stopVideo();
}
}
}
if (window.parent) {
if (parent.document.getElementById('i0')) {
if (('' + parent.document.URL + 's').replace(/\#https/g,'') != ('' + parent.document.URL + 's')) {
//top.document.title='x';
if (('' + parent.document.getElementById('i0').title + ' ').indexOf('#') == 0 || ('' + top.window.sessionStorage.getItem('ssytemp')).replace(/^undefined/g,'').replace(/^null/g,'') != '') {
//top.document.title='z';
//alert(5643);
monitorplh();
}
}
}
if (parent.document.getElementById('an_i_thingo')) {
if (parent.document.getElementById('an_i_thingo').value != '') {
parent.document.getElementById('an_i_thingo').value='';
//top.document.title='w';
//alert(5643);
monitorplh();
}
}
}
}
… which further contributed to less …
❄️ – ( ☃️ – 🧍♂️ )
… via …
… especially related to the grandparent level Tabular Single Row Image Gallery web application’s “Radio Play” mode of use, where, now, if you are after some “single song obsessional looping” try unchecking all checkboxes except the one of your obsession … and good luck ending the itch!
Did you know?
But the codeline conditionally ignored goes stopVideo(); not player.stopVideo(); … so what’s the go? Well, with an OOPy class scenario with an instance of that class called player the two are equivalent. You may also see event.target.stopVideo(); which can also work within an event’s logic within the code of that class. Sorry, but we crash around the brilliance of YouTube API class purity with lots of our own ideas that cloud issues. How about the two days we spent thinking we could map player to an altplayer variable and overmap player to our non-YouTube media window object …
Non good times
… it got ditched … otherwise our thinking would have extended to Javascript functions such as stopVideo being added to the non-class Javascript to address the execution swap over! Bit crazy, thinking back, but luckily we no longer do any mapping of instances, you’ll be pleased to hear!
Previous relevant YouTube API Caller Phase Two Text Cursor Tutorial is shown below.
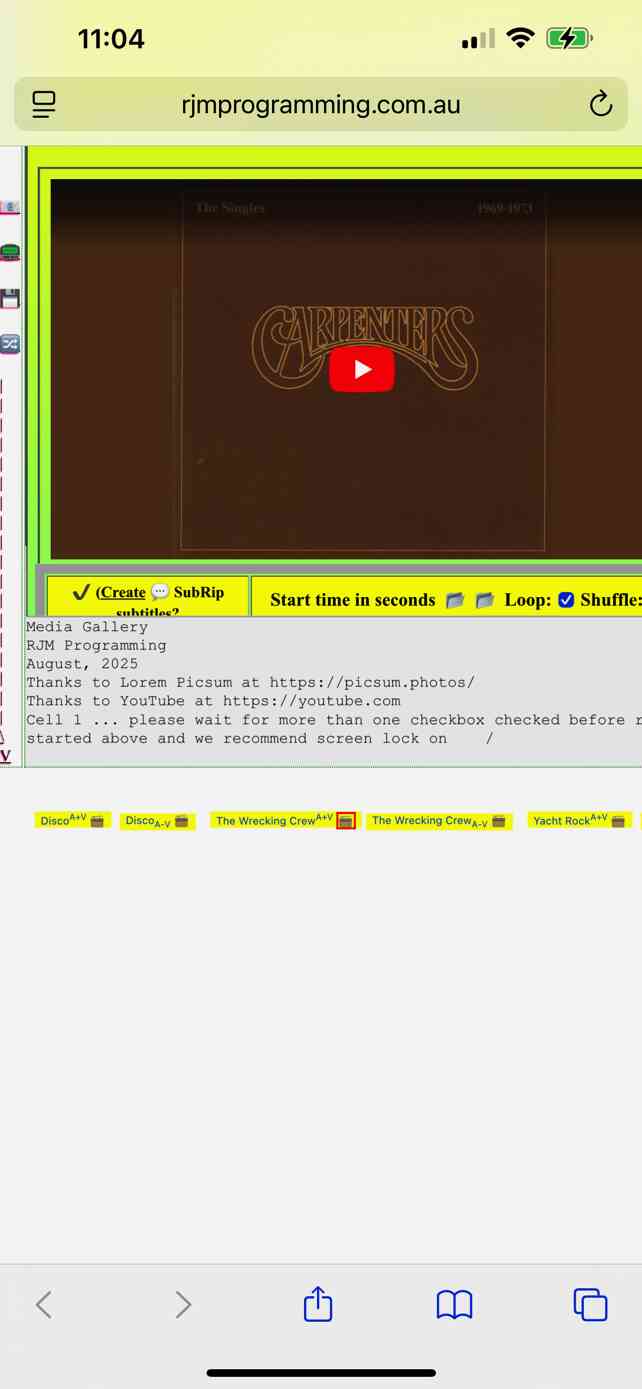
YouTube API Caller Phase Two Text Cursor Tutorial
As a bit of a sidestep away from the forward progress of yesterday’s YouTube API Caller Phase Two Other Mimetypes Sharing Tutorial …
- yes, we will get onto user data URI entries soon … but …
- let’s, today, for mobile platforms …
- lament they cannot have the joy of the cursors non-mobile can show you on the non-mobile screen … and our favourite is cursor:progress as an easy way to say to the user “hang on … for a bit” … so we looked for …
- any way with “just text” (that we animate down the bottom of the leftmost table cell) … we can indicate “things are going on”
… and yes, we’ve applied this idea everywhere because it may help indicate to a user if they lose a connection, perhaps, too, as a secondary role this …
text cursor
… could play. It consists of …
Javascript creating HTML as per …
<script type=text/javascript>
if (window.opener) {
if (document.URL.indexOf('isradio=') != -1 && document.URL.indexOf('youtube=') != -1) {
radioblurb=' ... click on start song (when emojis appear) then we suggest minimising window small but on top (next to other work windows) for radio sequenced play';
var doctt='' + document.title;
document.title=String.fromCodePoint(128251) + ' ' + (location.search.split('regarding=')[1] ? decodeURIComponent(location.search.split('regarding=')[1].split('&')[0]) : '') + ' Radio Play ... ' + doctt;
} else {
radioblurb=' ... please wait for more than one checkbox checked before radio sequenced play is started above';
}
} else if (document.URL.indexOf('isradio=') != -1) {
radioblurb=' ... please wait for more than one checkbox checked before radio sequenced play is started above';
if (document.URL.indexOf('youtube=') != -1) {
var xdoctt='' + document.title;
document.title=String.fromCodePoint(128251) + ' ' + (location.search.split('regarding=')[1] ? decodeURIComponent(location.search.split('regarding=')[1].split('&')[0]) : '') + ' Radio Play ... ' + xdoctt;
}
}
if (navigator.userAgent.match(/Android|BlackBerry|iPhone|iPad|iPod|Opera Mini|IEMobile/i)) {
radioblurb+=' and we recommend screen lock on';
}
for (var kk=1; kk<=eval(100 * numc); kk++) {
if (eval(kk % eval('' + bcol.length)) == 0) {
dw+=('<td class=loremipsum data-alt="" data-curs="' + cursanim[cntcurs] + '" alt="Cell ' + kk + radioblurb + cursanim[cntcurs] + '" title="If not showing an image ( this one thanks to Lorem Picsum at https://picsum.photos/ ) or to reveal it behind audio or video foreground content please double click here at cell ' + kk + '." ondblclick=refresh(this.id); id="td' + ('0000' + kk).slice(-4) + '" style="min-width:' + amin + 'px;min-height:' + amin + 'px;width:' + amin + 'px;height:' + amin + "px;background-color:" + bcol[eval(kk % eval('' + bcol.length))] + ";" + 'background-size:contain;background-repeat:no-repeat;">' + grabcontent(eval(-1 + kk)) + '</td>');
setTimeout(cursanimate, 600);
} else {
dw+=('<td onmousedown="checkmeout(event,false);" ontouchdown="checkmeout(event,false);" oncontextmenu="checkmeout(event,true);" class=inhouse data-alt="" alt="Cell ' + kk + radioblurb + cursanim[cntcurs] + '" title="If not showing an image ( yellow cell ones thanks to Lorem Picsum at https://picsum.photos/ ) please double click here at cell ' + kk + ' or just click to get popup window of associated WordPress Blog Posting else right click for associated Cut to the Chase." ondblclick=refresh(this.id); id="td' + ('0000' + kk).slice(-4) + '" style="min-width:' + amin + 'px;min-height:' + amin + 'px;width:' + amin + 'px;height:' + amin + "px;background-color:" + bcol[eval(kk % eval('' + bcol.length))] + ";" + 'background-size:contain;background-repeat:no-repeat;">' + grabcontent(eval(-1 + kk)) + '</td>');
}
}
document.write(dw);
</script>
… and the accompanying CSS text content creation means …
<style>
td {
border: 1px dotted green;
}
a {
text-shadow:-1px 1px 1px #ff2d95;
background-color:rgba(255,255,255,0.3);
}
.inhouse {
vertical-align: bottom;
padding-bottom: 20px;
}
.inhouse::after {
font-size: 8px;
content: 'Media Gallery \a RJM Programming \a August, 2025 \a Thanks to Lorem Picsum at https://picsum.photos/ \a Thanks to YouTube at https://youtube.com \a ' attr(data-alt) attr(alt);
white-space: pre-wrap;
}
</style>
… made to be more noticeable and animated via Javascript …
var cntcurs=0, lastcurs=0, altlen=-1;
var cursanim=[' ',' | ', ' / ', ' - ', ' \ '];
function cursanimate() {
if (altlen == -1) {
if (document.getElementById('td0001').getAttribute('alt').indexOf(' (when emojis appear) ') != -1) {
document.getElementById('td0001').setAttribute('alt', document.getElementById('td0001').getAttribute('alt').replace(' (when emojis appear) ', ' '));
}
altlen=eval(0 + eval('' + document.getElementById('td0001').getAttribute('alt').length));
}
lastcurs=cntcurs;
cntcurs++;
if (cntcurs >= eval('' + cursanim.length)) { cntcurs=1; }
document.getElementById('td0001').setAttribute('alt', document.getElementById('td0001').getAttribute('alt').substring(0,altlen) + cursanim[cntcurs]);
setTimeout(cursanimate, 600);
}
… either straight away, or when the user should expect a delay, using the changed swipe_media.html Tabular Single Row Image Gallery web application.
Previous relevant YouTube API Caller Phase Two Other Mimetypes Sharing Tutorial is shown below.

YouTube API Caller Phase Two Other Mimetypes Sharing Tutorial
We were hoping we could say “yesterday’s” but, three days later, the struggle is over regarding work after YouTube API Caller Phase Two Other Mimetypes Tutorial regarding sharing with someone when including …
- (albeit, so far, restricted) audio media mimetypes presented in an HTML audio element … and …
- (albeit, so far, restricted) video media mimetypes presented in an HTML video element … while today we’re adding support for …
- (albeit, so far, restricted) image media mimetypes presented in an HTML img element … and …
- (albeit, so far, restricted) other mimetypes presented in an HTML iframe element
… is achievable, but not for data URIs yet, just media URLs. That is an upcoming struggle, we’re predicting?!
Who‘d have thought Do You See What I See could be so involved …
…?
Previous relevant YouTube API Caller Phase Two Other Mimetypes Tutorial is shown below.
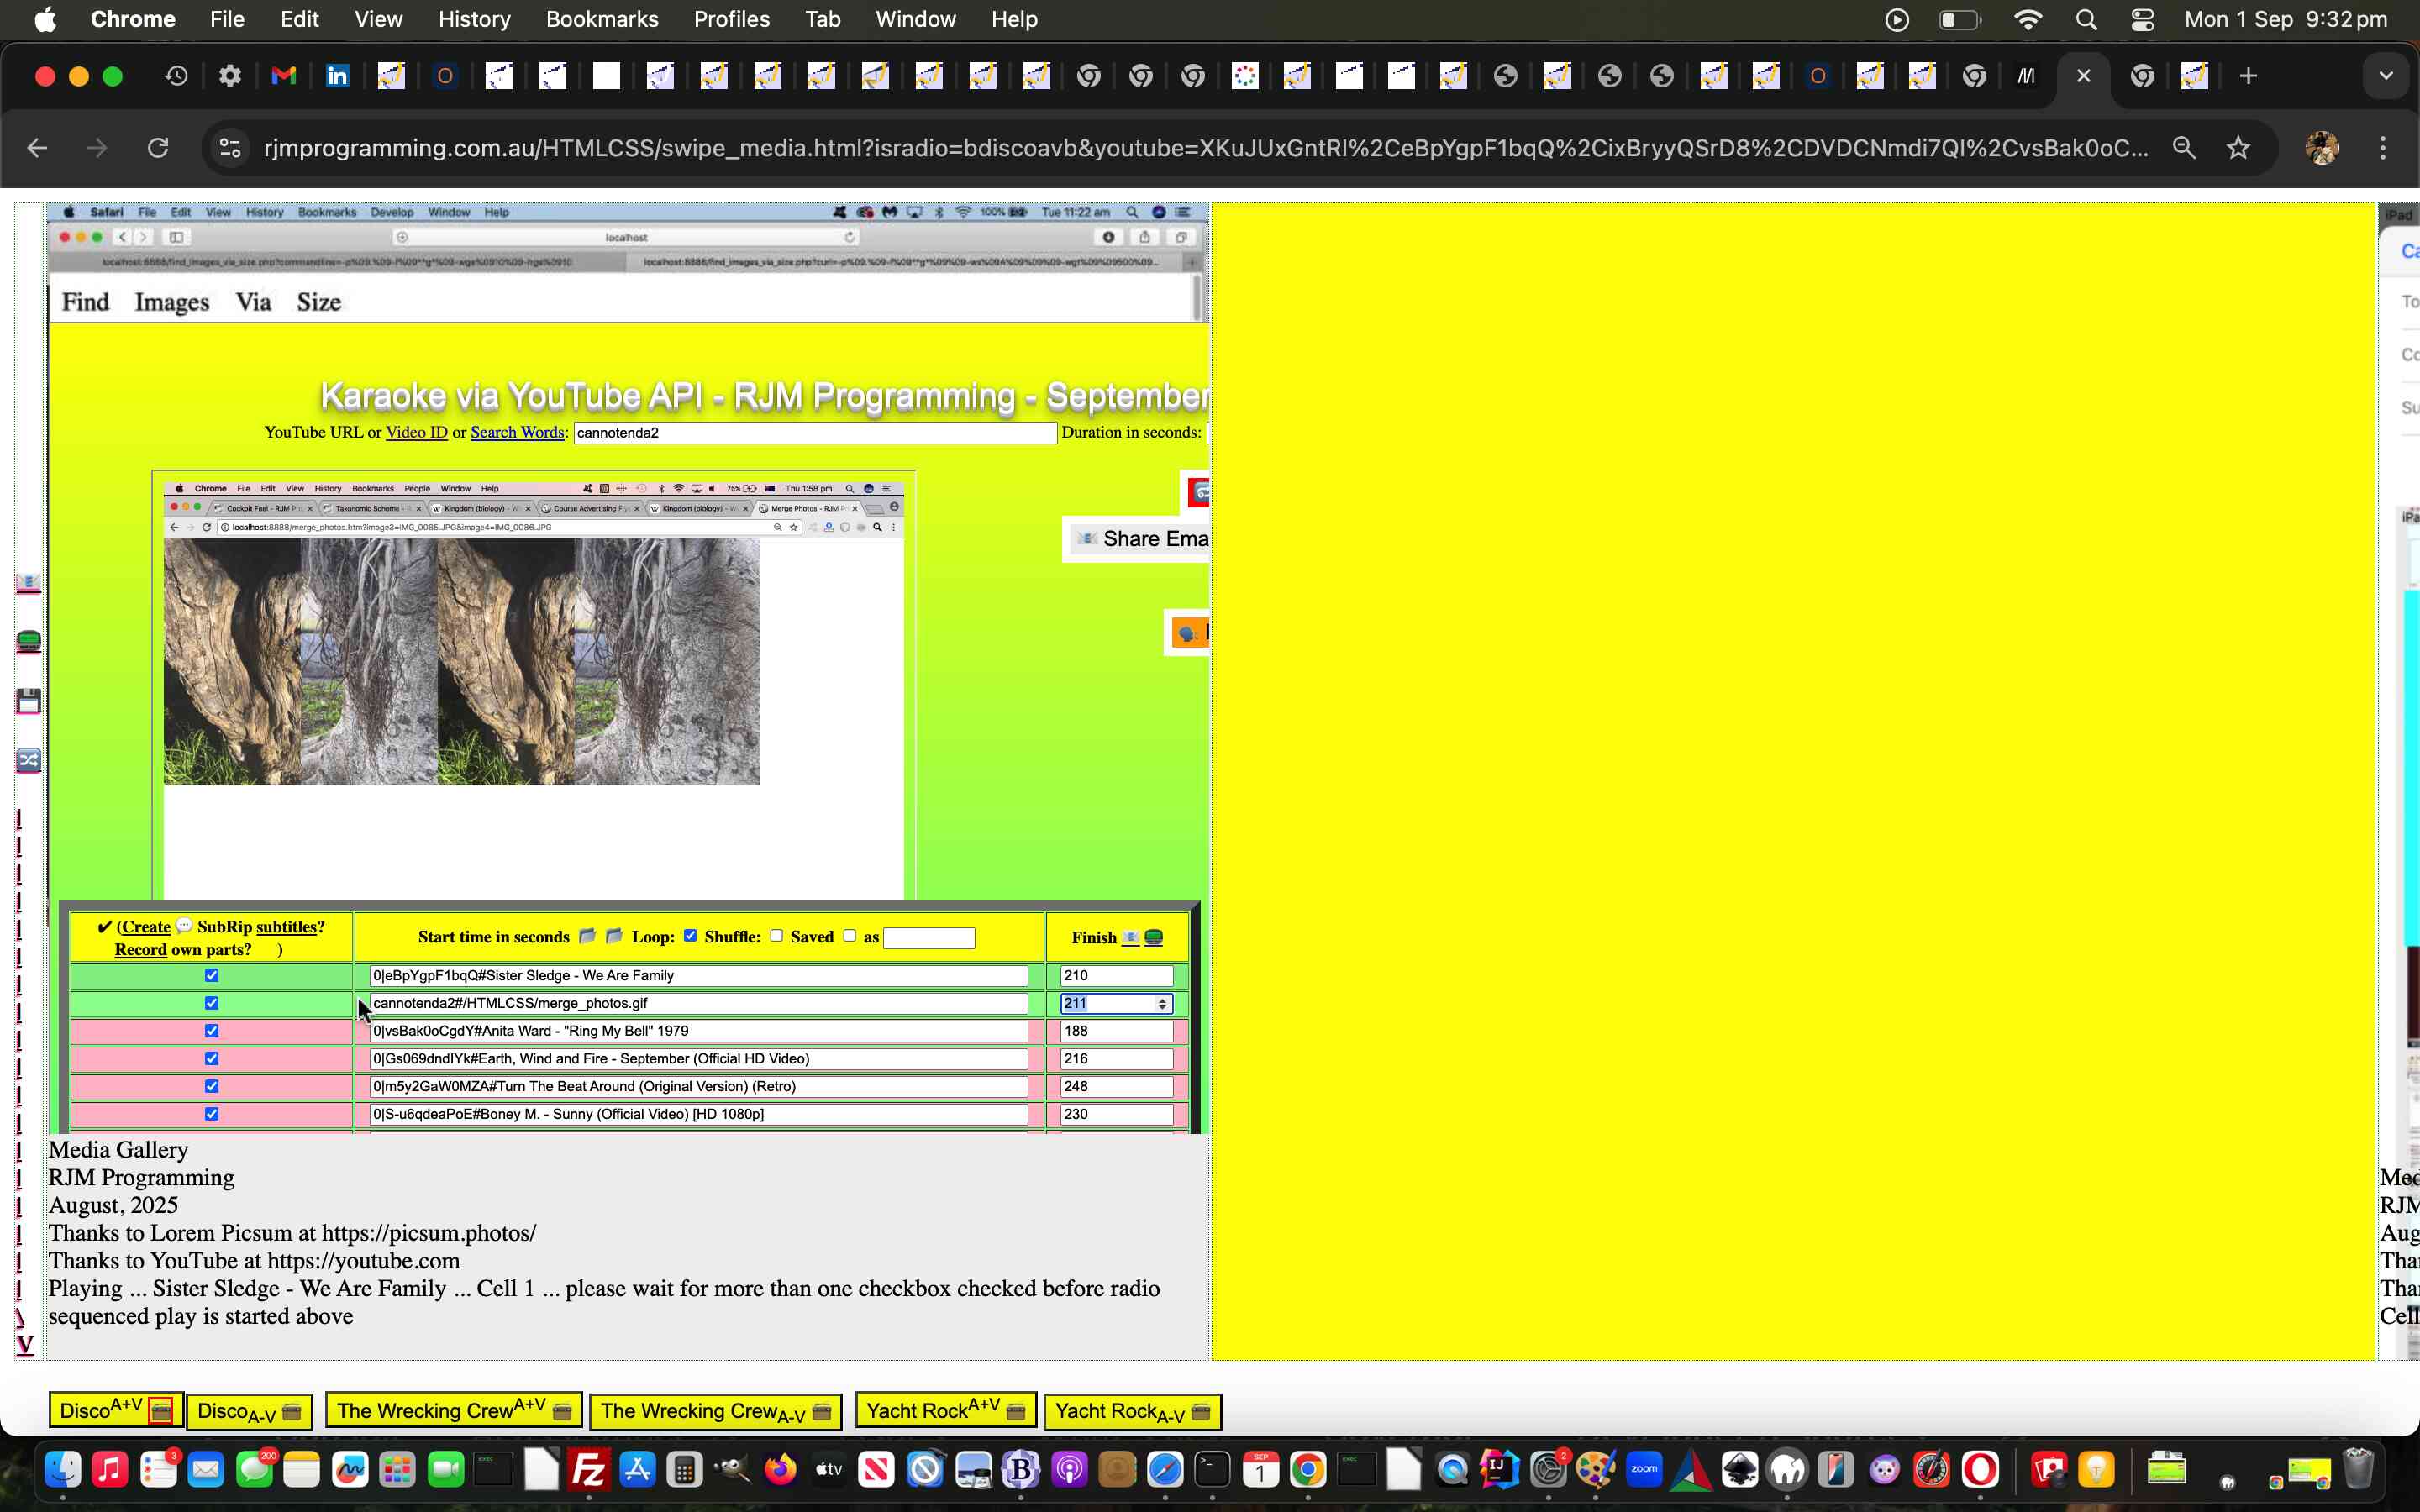
YouTube API Caller Phase Two Other Mimetypes Tutorial
Up until yesterday’s YouTube API Caller Phase Two Intermediate Buttons Tutorial phase two user media work established …
- (albeit, so far, restricted) audio media mimetypes presented in an HTML audio element … and …
- (albeit, so far, restricted) video media mimetypes presented in an HTML video element … while today we’re adding support for …
- (albeit, so far, restricted) image media mimetypes presented in an HTML img element … and …
- (albeit, so far, restricted) other mimetypes presented in an HTML iframe element
Not yet, but eventually, what we’re doing with the 3 hierarchies and hashtagging will be crucial for a sharing recipient to “see what you see”, and we needed tweaking of this to ensure the hashtagging order used corresponded to the order of user media (so far just URL) creations in those textboxes.
We were also correct worrying about if two such user media URLs appeared in a row, but fixed this within …
Previous relevant YouTube API Caller Phase Two Intermediate Buttons Tutorial is shown below.
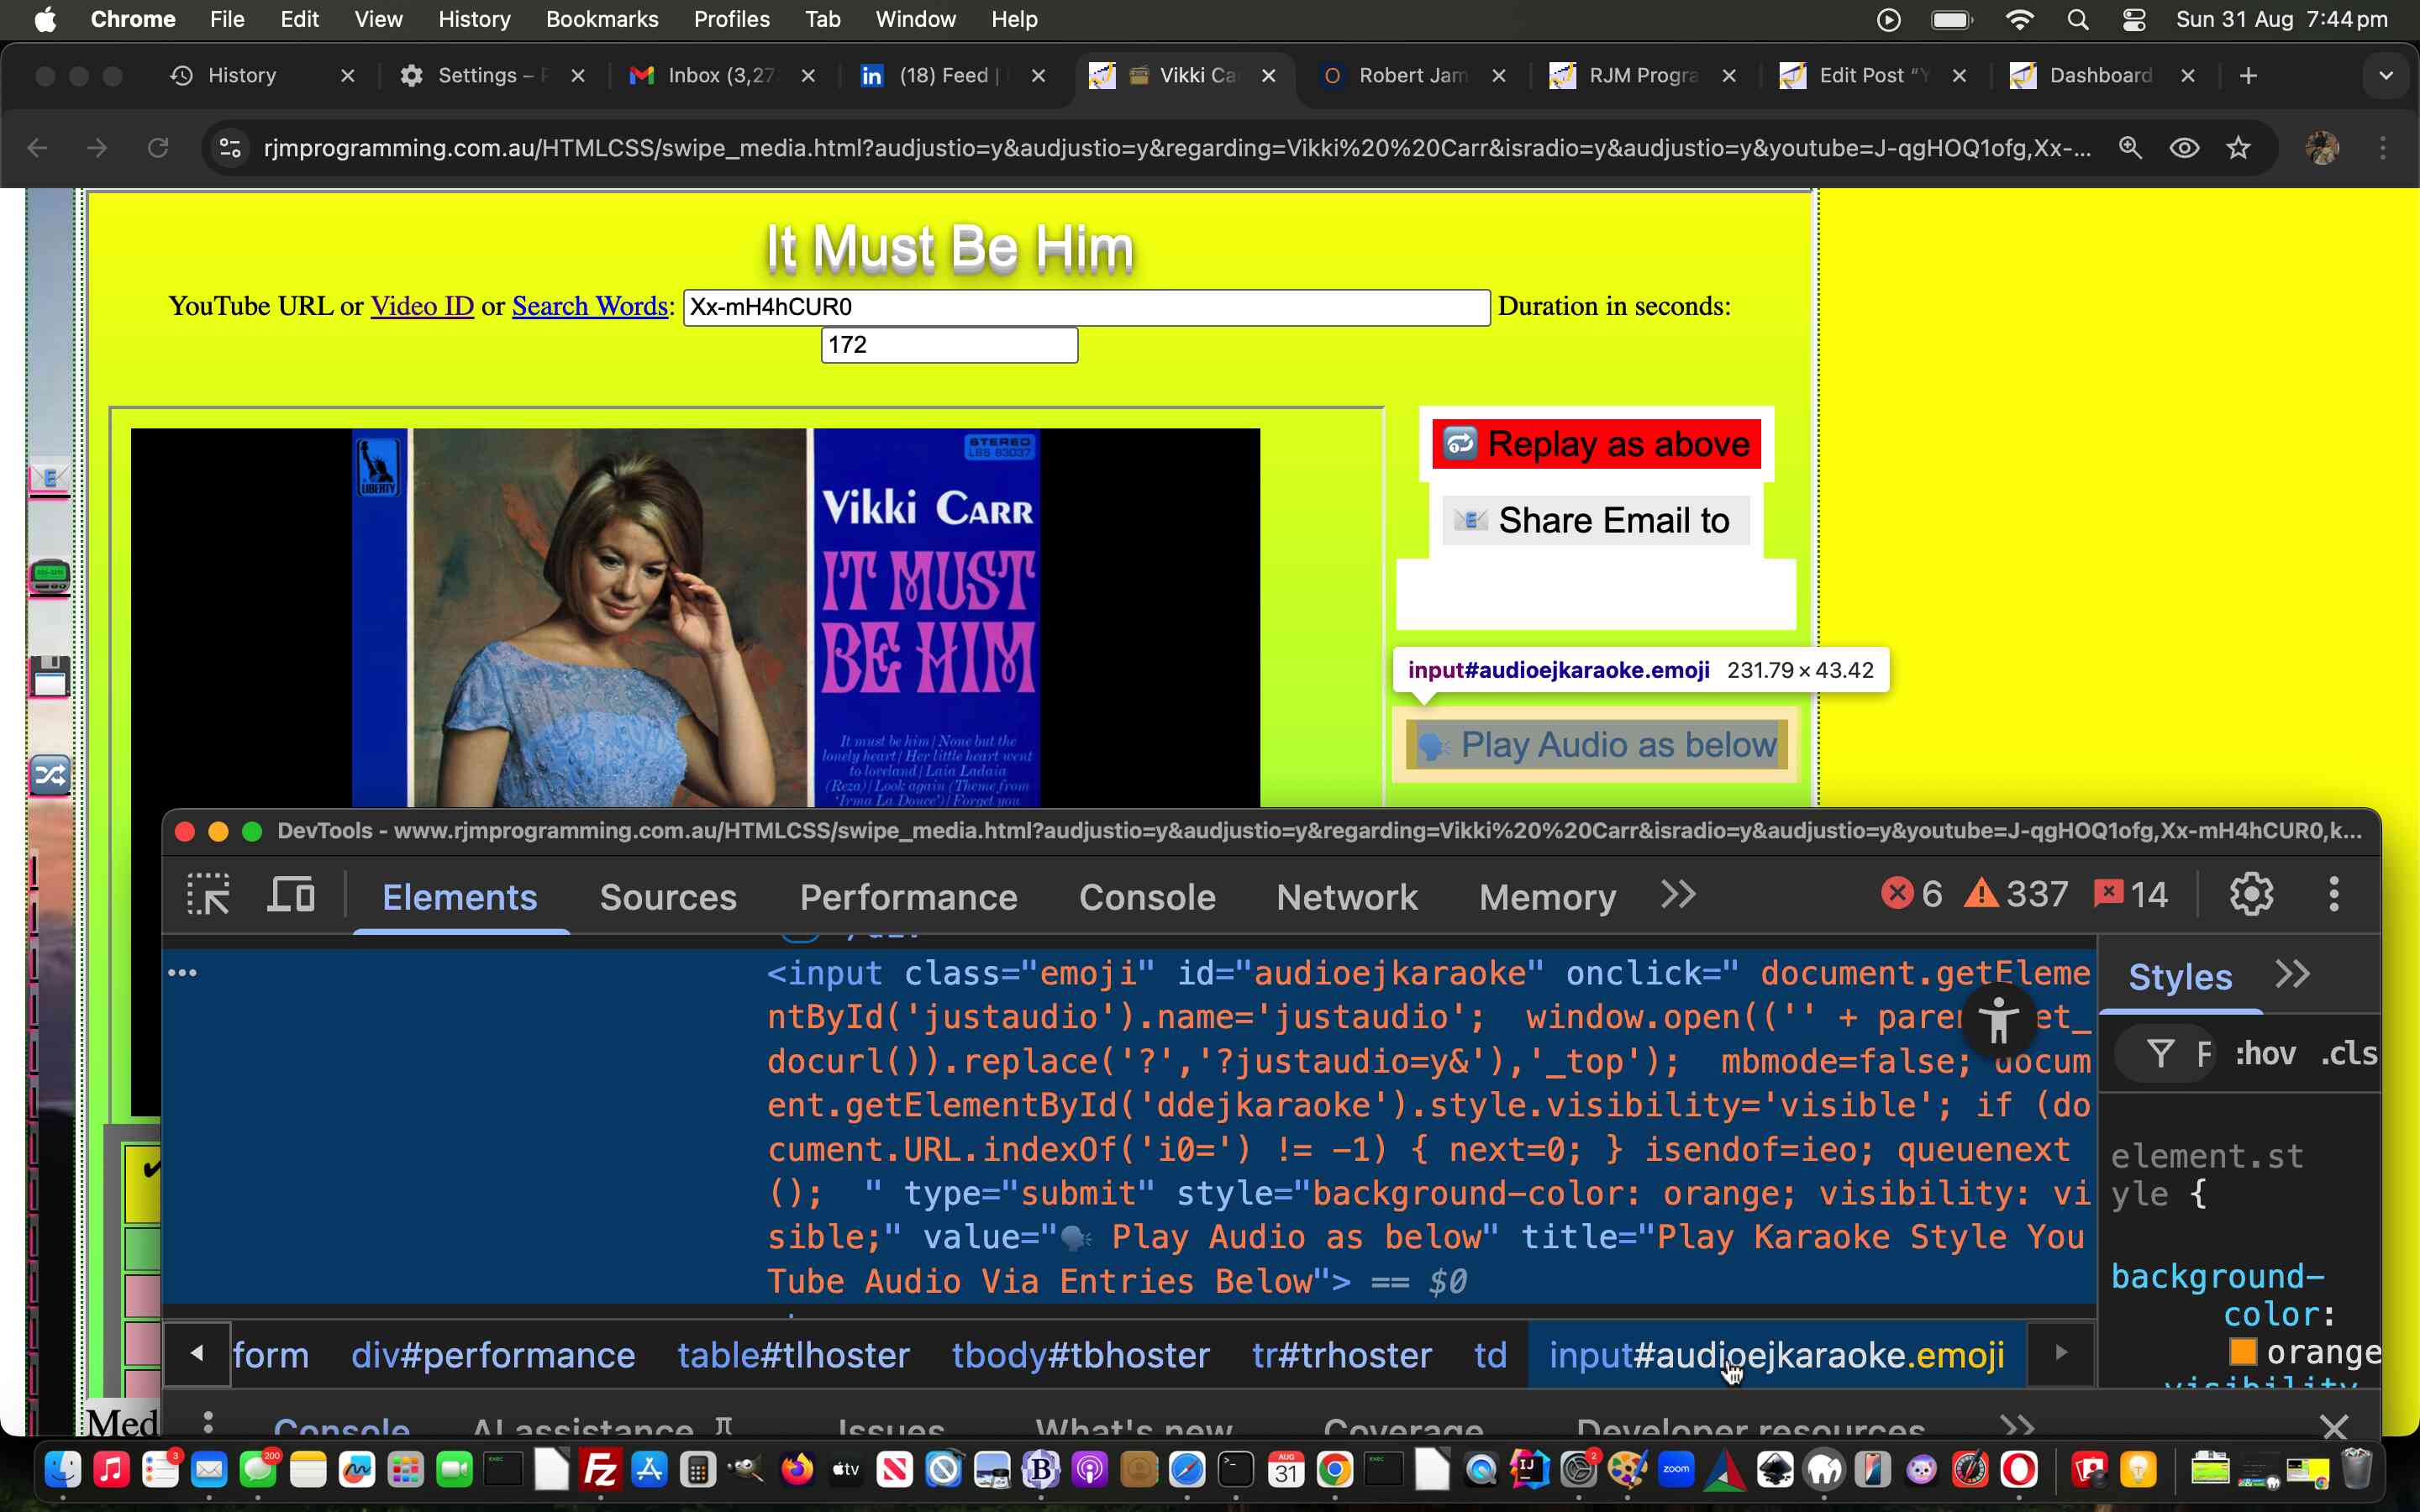
YouTube API Caller Phase Two Intermediate Buttons Tutorial
Further to yesterday’s YouTube API Caller Phase Two Absolute URL Tutorial‘s three tier Tabular Single Row Image Gallery web application design …
Had we been letting middle child syndrome develop?
We’d not attended to a lot of the buttons to the right of the changed karaoke_youtube_api.htm inhouse YouTube video interfacer‘s webpages, in any serious way during this latest push. But the fact is, it is worth the effort, even in terms of them …
- helping better email share
- shore up recovery means should connections be lost during Radio Play
- help switch between video play and audio stream of video only play and vice versa modes of Radio Play
The thing is, in the three tier design, we’ve introduced a new top tier as far as this middle tier player is concerned. But we can tailor it to use those buttons differently, and we found the onmousedown and ontouchdown events related to those buttons often useful here, depending on conditions …
var mbmode=false, mbinter='';
var cbut="<br><div style='" + defidea + "'><div id='ddkaraoke' style='display:inline; visibility: hidden; '><input onclick=\"if (document.URL.indexOf('i0=') != -1) { location.href=itd(document.URL); } \" id='repeat' type='button' style='background-color:red;' value='Replay Karaoke Style YouTube Above'></input><br><input onclick=clickto(); id=karaokeshare value='Email Share to ' type='button'></input> <input style=width:60%; onblur=doto(this.value); type=text name=email id=karaokeemail value=></input></div><div id='dkaraoke' style='display:inline; visibility: hidden; '><input id='mousej' type='button' style='background-color:#f0f0f0; display:inline; visibility: hidden;' onclick=' mousebelowj(this);' value='Fill Table Below via Mouse Video Pauses Starting with '></input> <input id='mousei' type='button' style='background-color:#f5f5f5; display:inline; visibility: hidden;' onclick=' mousebelowi(this);' value='Fill Table Starting with 0 cell'></input> <input id='karaoke' onclick=\" mbmode=false; document.getElementById('ddkaraoke').style.visibility='visible'; if (document.URL.indexOf('i0=') != -1) { next=0; } queuenext();\" type='submit' style='background-color:orange;' value='Play Karaoke Style YouTube Via Entries Below'></input></div><div id='dkaraoke' style='display:inline; visibility: hidden; '></div></div>";
var cbutl="<div style='" + defidea + " height: 60px;'><div style=' " + defidea + " height: 60px;'><div id='dkaraoke' style=' display:inline; visibility: hidden; '><div style='" + defidea + "'><div style='" + defidea + "'><input id='karaoke' onclick=\" mbmode=false; document.getElementById('ddkaraoke').style.visibility='visible'; if (document.URL.indexOf('i0=') != -1) { next=0; } queuenext();\" type='submit' style='background-color:orange;' value='Play Karaoke Style YouTube Via Entries Below'></input></div></div></div><br><div id='ddkaraoke' style='margin-top:-100px; visibility: hidden; " + defidea + " '><div style='" + defidea + "'><div style='" + defidea + "'><input onclick=\"if (document.URL.indexOf('i0=') != -1) { location.href=itd(document.URL); } \" id='repeat' type='button' style='background-color:red;' value='Replay Karaoke Style YouTube Above'></input><br><input onclick=clickto(); id=karaokeshare value='Email Share to ' type='button'></input><input onblur=doto(this.value); type=text name=email id=karaokeemail value=></input></div></div></div></div></div><br><br>✔ (<a onclick=\" prearwo=window.open(this.getAttribute('data-href'),'_blank','top=' + eval(-400 + screen.height) + ',left=' + eval(-1050 + screen.width) + ',width=500,height=400'); setInterval(arwoaudioablook, 5000); }, 1500);\" data-target=_blank id=arecord title='Thanks to https://online-voice-recorder.com/#google_vignette ... if it works for your browser. If not, you can consider using a desktop microphone recorder app such as Mac OS X QuickTime Player as an alternative perhaps.' data-href='https://online-voice-recorder.com/#google_vignette'>Record</a> own parts? <input type=hidden id=justaudio" + bsuffis + " value=''></input><input style=visibility:hidden; onchanged='dorecord=!dorecord;' type=checkbox name=recown id=recown value='Record own parts?'></input>) ";
if (window.parent) {
if (('' + parent.document.URL + '&').indexOf('#http&') != -1 || ('' + parent.document.URL + '&').indexOf('isradio=') != -1) {
mbinter=" window.open(('' + parent.get_docurl()),'_top'); ";
if (('' + parent.document.URL + '&').indexOf('justaudio=y') != -1) {
cbut="<br><div style='" + defidea + "'><div id='ddkaraoke' style='display:inline; visibility: hidden; '><input onclick=\"if (document.URL.indexOf('i0=') != -1) { location.href=itd(document.URL); } \" id='repeat' type='button' style='background-color:red;' value='Replay Karaoke Style YouTube Above'></input><br><input onclick=clickto(); id=karaokeshare value='Email Share to ' type='button'></input> <input style=width:60%; onblur=doto(this.value); type=text name=email id=karaokeemail value=></input></div><div id='dkaraoke' style='display:inline; visibility: hidden; '><input id='mousej' type='button' style='background-color:#f0f0f0; display:inline; visibility: hidden;' onclick=' mousebelowj(this);' value='Fill Table Below via Mouse Video Pauses Starting with '></input> <input id='mousei' type='button' style='background-color:#f5f5f5; display:inline; visibility: hidden;' onclick=' mousebelowi(this);' value='Fill Table Starting with 0 cell'></input> <input id='karaoke' onclick=\" " + mbinter.replace(",",".replace('justaudio','audjustio'),") + " mbmode=false; document.getElementById('ddkaraoke').style.visibility='visible'; if (document.URL.indexOf('i0=') != -1) { next=0; } queuenext();\" type='submit' style='background-color:orange;' value='Play Karaoke Style YouTube Via Entries Below'></input></div><div id='dkaraoke' style='display:inline; visibility: hidden; '></div></div>";
cbutl="<div style='" + defidea + " height: 60px;'><div style=' " + defidea + " height: 60px;'><div id='dkaraoke' style=' display:inline; visibility: hidden; '><div style='" + defidea + "'><div style='" + defidea + "'><input id='karaoke' onclick=\" " + mbinter.replace(",",".replace('justaudio','audjustio'),") + " mbmode=false; document.getElementById('ddkaraoke').style.visibility='visible'; if (document.URL.indexOf('i0=') != -1) { next=0; } queuenext();\" type='submit' style='background-color:orange;' value='Play Karaoke Style YouTube Via Entries Below'></input></div></div></div><br><div id='ddkaraoke' style='margin-top:-100px; visibility: hidden; " + defidea + " '><div style='" + defidea + "'><div style='" + defidea + "'><input onclick=\"if (document.URL.indexOf('i0=') != -1) { location.href=itd(document.URL); } \" id='repeat' type='button' style='background-color:red;' value='Replay Karaoke Style YouTube Above'></input><br><input onclick=clickto(); id=karaokeshare value='Email Share to ' type='button'></input><input onblur=doto(this.value); type=text name=email id=karaokeemail value=></input></div></div></div></div></div><br><br>✔ (<a onclick=\" prearwo=window.open(this.getAttribute('data-href'),'_blank','top=' + eval(-400 + screen.height) + ',left=' + eval(-1050 + screen.width) + ',width=500,height=400'); setInterval(arwoaudioablook, 5000); }, 1500);\" data-target=_blank id=arecord title='Thanks to https://online-voice-recorder.com/#google_vignette ... if it works for your browser. If not, you can consider using a desktop microphone recorder app such as Mac OS X QuickTime Player as an alternative perhaps.' data-href='https://online-voice-recorder.com/#google_vignette'>Record</a> own parts? <input type=hidden id=justaudio" + bsuffis + " value=''></input><input style=visibility:hidden; onchanged='dorecord=!dorecord;' type=checkbox name=recown id=recown value='Record own parts?'></input>) ";
topbuturl=('' + parent.get_docurl()).replace('justaudio','audjustio');
mbinter=""; //mbinter=mbinter.replace(",",".replace('justaudio','audjustio'),");
setTimeout(function(){
if (document.getElementById('audioejkaraoke') || document.getElementById('repeat')) {
if (document.getElementById('audioejkaraoke')) {
document.getElementById('audioejkaraoke').type='button';
document.getElementById('audioejkaraoke').onmousedown=function(){ window.open(topbuturl,'_top'); };
document.getElementById('audioejkaraoke').ontouchdown=function(){ window.open(topbuturl,'_top'); };
}
if (document.getElementById('repeat')) {
document.getElementById('repeat').onmousedown=function(){ if (document.URL.indexOf('i0=') != -1) { window.open(topbuturl,'_top'); } };
document.getElementById('repeat').ontouchdown=function(){ if (document.URL.indexOf('i0=') != -1) { window.open(topbuturl,'_top'); } };
}
}
}, 12000);
} else {
cbut="<br><div style='" + defidea + "'><div id='ddkaraoke' style='display:inline; visibility: hidden; '><input onclick=\"if (document.URL.indexOf('i0=') != -1) { location.href=itd(document.URL); } \" id='repeat' type='button' style='background-color:red;' value='Replay Karaoke Style YouTube Above'></input><br><input onclick=clickto(); id=karaokeshare value='Email Share to ' type='button'></input> <input style=width:60%; onblur=doto(this.value); type=text name=email id=karaokeemail value=></input></div><div id='dkaraoke' style='display:inline; visibility: hidden; '><input id='mousej' type='button' style='background-color:#f0f0f0; display:inline; visibility: hidden;' onclick=' mousebelowj(this);' value='Fill Table Below via Mouse Video Pauses Starting with '></input> <input id='mousei' type='button' style='background-color:#f5f5f5; display:inline; visibility: hidden;' onclick=' mousebelowi(this);' value='Fill Table Starting with 0 cell'></input> <input id='karaoke' onclick=\" " + mbinter + " mbmode=false; document.getElementById('ddkaraoke').style.visibility='visible'; if (document.URL.indexOf('i0=') != -1) { next=0; } queuenext();\" type='submit' style='background-color:orange;' value='Play Karaoke Style YouTube Via Entries Below'></input></div><div id='dkaraoke' style='display:inline; visibility: hidden; '></div></div>";
cbutl="<div style='" + defidea + " height: 60px;'><div style=' " + defidea + " height: 60px;'><div id='dkaraoke' style=' display:inline; visibility: hidden; '><div style='" + defidea + "'><div style='" + defidea + "'><input id='karaoke' onclick=\" " + mbinter + " mbmode=false; document.getElementById('ddkaraoke').style.visibility='visible'; if (document.URL.indexOf('i0=') != -1) { next=0; } queuenext();\" type='submit' style='background-color:orange;' value='Play Karaoke Style YouTube Via Entries Below'></input></div></div></div><br><div id='ddkaraoke' style='margin-top:-100px; visibility: hidden; " + defidea + " '><div style='" + defidea + "'><div style='" + defidea + "'><input onclick=\"if (document.URL.indexOf('i0=') != -1) { location.href=itd(document.URL); } \" id='repeat' type='button' style='background-color:red;' value='Replay Karaoke Style YouTube Above'></input><br><input onclick=clickto(); id=karaokeshare value='Email Share to ' type='button'></input><input onblur=doto(this.value); type=text name=email id=karaokeemail value=></input></div></div></div></div></div><br><br>✔ (<a onclick=\" prearwo=window.open(this.getAttribute('data-href'),'_blank','top=' + eval(-400 + screen.height) + ',left=' + eval(-1050 + screen.width) + ',width=500,height=400'); setInterval(arwoaudioablook, 5000); }, 1500);\" data-target=_blank id=arecord title='Thanks to https://online-voice-recorder.com/#google_vignette ... if it works for your browser. If not, you can consider using a desktop microphone recorder app such as Mac OS X QuickTime Player as an alternative perhaps.' data-href='https://online-voice-recorder.com/#google_vignette'>Record</a> own parts? <input type=hidden id=justaudio" + bsuffis + " value=''></input><input style=visibility:hidden; onchanged='dorecord=!dorecord;' type=checkbox name=recown id=recown value='Record own parts?'></input>) ";
}
} else if (('' + top.document.URL + '&').indexOf('#http&') != -1 || ('' + top.document.URL + '&').indexOf('isradio=') != -1) {
mbinter=" window.open(('' + parent.get_docurl()),'_top'); ";
if (('' + parent.document.URL + '&').indexOf('justaudio=y') != -1) {
cbut="<br><div style='" + defidea + "'><div id='ddkaraoke' style='display:inline; visibility: hidden; '><input onclick=\"if (document.URL.indexOf('i0=') != -1) { location.href=itd(document.URL); } \" id='repeat' type='button' style='background-color:red;' value='Replay Karaoke Style YouTube Above'></input><br><input onclick=clickto(); id=karaokeshare value='Email Share to ' type='button'></input> <input style=width:60%; onblur=doto(this.value); type=text name=email id=karaokeemail value=></input></div><div id='dkaraoke' style='display:inline; visibility: hidden; '><input id='mousej' type='button' style='background-color:#f0f0f0; display:inline; visibility: hidden;' onclick=' mousebelowj(this);' value='Fill Table Below via Mouse Video Pauses Starting with '></input> <input id='mousei' type='button' style='background-color:#f5f5f5; display:inline; visibility: hidden;' onclick=' mousebelowi(this);' value='Fill Table Starting with 0 cell'></input> <input id='karaoke' onclick=\" " + mbinter.replace(",",".replace('justaudio','audjustio'),") + " mbmode=false; document.getElementById('ddkaraoke').style.visibility='visible'; if (document.URL.indexOf('i0=') != -1) { next=0; } queuenext();\" type='submit' style='background-color:orange;' value='Play Karaoke Style YouTube Via Entries Below'></input></div><div id='dkaraoke' style='display:inline; visibility: hidden; '></div></div>";
cbutl="<div style='" + defidea + " height: 60px;'><div style=' " + defidea + " height: 60px;'><div id='dkaraoke' style=' display:inline; visibility: hidden; '><div style='" + defidea + "'><div style='" + defidea + "'><input id='karaoke' onclick=\" " + mbinter.replace(",",".replace('justaudio','audjustio'),") + " mbmode=false; document.getElementById('ddkaraoke').style.visibility='visible'; if (document.URL.indexOf('i0=') != -1) { next=0; } queuenext();\" type='submit' style='background-color:orange;' value='Play Karaoke Style YouTube Via Entries Below'></input></div></div></div><br><div id='ddkaraoke' style='margin-top:-100px; visibility: hidden; " + defidea + " '><div style='" + defidea + "'><div style='" + defidea + "'><input onclick=\"if (document.URL.indexOf('i0=') != -1) { location.href=itd(document.URL); } \" id='repeat' type='button' style='background-color:red;' value='Replay Karaoke Style YouTube Above'></input><br><input onclick=clickto(); id=karaokeshare value='Email Share to ' type='button'></input><input onblur=doto(this.value); type=text name=email id=karaokeemail value=></input></div></div></div></div></div><br><br>✔ (<a onclick=\" prearwo=window.open(this.getAttribute('data-href'),'_blank','top=' + eval(-400 + screen.height) + ',left=' + eval(-1050 + screen.width) + ',width=500,height=400'); setInterval(arwoaudioablook, 5000); }, 1500);\" data-target=_blank id=arecord title='Thanks to https://online-voice-recorder.com/#google_vignette ... if it works for your browser. If not, you can consider using a desktop microphone recorder app such as Mac OS X QuickTime Player as an alternative perhaps.' data-href='https://online-voice-recorder.com/#google_vignette'>Record</a> own parts? <input type=hidden id=justaudio" + bsuffis + " value=''></input><input style=visibility:hidden; onchanged='dorecord=!dorecord;' type=checkbox name=recown id=recown value='Record own parts?'></input>) ";
topbuturl=('' + parent.get_docurl()).replace('justaudio','audjustio');
mbinter=""; //mbinter=mbinter.replace(",",".replace('justaudio','audjustio'),");
setTimeout(function(){
if (document.getElementById('audioejkaraoke') || document.getElementById('repeat')) {
if (document.getElementById('audioejkaraoke')) {
document.getElementById('audioejkaraoke').type='button';
document.getElementById('audioejkaraoke').onmousedown=function(){ window.open(topbuturl,'_top'); };
document.getElementById('audioejkaraoke').ontouchdown=function(){ window.open(topbuturl,'_top'); };
}
if (document.getElementById('repeat')) {
document.getElementById('repeat').onmousedown=function(){ if (document.URL.indexOf('i0=') != -1) { window.open(topbuturl,'_top'); } };
document.getElementById('repeat').ontouchdown=function(){ if (document.URL.indexOf('i0=') != -1) { window.open(topbuturl,'_top'); } };
}
}
}, 12000);
} else {
cbut="<br><div style='" + defidea + "'><div id='ddkaraoke' style='display:inline; visibility: hidden; '><input onclick=\"if (document.URL.indexOf('i0=') != -1) { location.href=itd(document.URL); } \" id='repeat' type='button' style='background-color:red;' value='Replay Karaoke Style YouTube Above'></input><br><input onclick=clickto(); id=karaokeshare value='Email Share to ' type='button'></input> <input style=width:60%; onblur=doto(this.value); type=text name=email id=karaokeemail value=></input></div><div id='dkaraoke' style='display:inline; visibility: hidden; '><input id='mousej' type='button' style='background-color:#f0f0f0; display:inline; visibility: hidden;' onclick=' mousebelowj(this);' value='Fill Table Below via Mouse Video Pauses Starting with '></input> <input id='mousei' type='button' style='background-color:#f5f5f5; display:inline; visibility: hidden;' onclick=' mousebelowi(this);' value='Fill Table Starting with 0 cell'></input> <input id='karaoke' onclick=\" " + mbinter + " mbmode=false; document.getElementById('ddkaraoke').style.visibility='visible'; if (document.URL.indexOf('i0=') != -1) { next=0; } queuenext();\" type='submit' style='background-color:orange;' value='Play Karaoke Style YouTube Via Entries Below'></input></div><div id='dkaraoke' style='display:inline; visibility: hidden; '></div></div>";
cbutl="<div style='" + defidea + " height: 60px;'><div style=' " + defidea + " height: 60px;'><div id='dkaraoke' style=' display:inline; visibility: hidden; '><div style='" + defidea + "'><div style='" + defidea + "'><input id='karaoke' onclick=\" " + mbinter + " mbmode=false; document.getElementById('ddkaraoke').style.visibility='visible'; if (document.URL.indexOf('i0=') != -1) { next=0; } queuenext();\" type='submit' style='background-color:orange;' value='Play Karaoke Style YouTube Via Entries Below'></input></div></div></div><br><div id='ddkaraoke' style='margin-top:-100px; visibility: hidden; " + defidea + " '><div style='" + defidea + "'><div style='" + defidea + "'><input onclick=\"if (document.URL.indexOf('i0=') != -1) { location.href=itd(document.URL); } \" id='repeat' type='button' style='background-color:red;' value='Replay Karaoke Style YouTube Above'></input><br><input onclick=clickto(); id=karaokeshare value='Email Share to ' type='button'></input><input onblur=doto(this.value); type=text name=email id=karaokeemail value=></input></div></div></div></div></div><br><br>✔ (<a onclick=\" prearwo=window.open(this.getAttribute('data-href'),'_blank','top=' + eval(-400 + screen.height) + ',left=' + eval(-1050 + screen.width) + ',width=500,height=400'); setInterval(arwoaudioablook, 5000); }, 1500);\" data-target=_blank id=arecord title='Thanks to https://online-voice-recorder.com/#google_vignette ... if it works for your browser. If not, you can consider using a desktop microphone recorder app such as Mac OS X QuickTime Player as an alternative perhaps.' data-href='https://online-voice-recorder.com/#google_vignette'>Record</a> own parts? <input type=hidden id=justaudio" + bsuffis + " value=''></input><input style=visibility:hidden; onchanged='dorecord=!dorecord;' type=checkbox name=recown id=recown value='Record own parts?'></input>) ";
}
}
}
var cbutm="<div style='" + defidea + " height: 60px;'><div id='dkaraokem' style='display:inline; visibility: hidden; '><input id='mousei' type='button' style='background-color:#f5f5f5; display:inline; visibility: hidden;' onclick=' mousebelowi(this);' value='Fill Table Below via Mouse Video Pauses'></input></div></div><br>Start time in seconds <span id=nm style='display:none;'>(negative means you will be singing or Prefix by Audio file URL or YouTube ID delimited by :)</span>";
var cbutr="<div style='" + defidea + " height: 60px;'><div id='dkaraoker' style='display:inline; visibility: hidden; '> <input id='mousej' type='button' style=' background-color:#f0f0f0; display:inline; visibility: hidden;' onclick=' mousebelowj(this);' value='Fill Table Starting with '></input></div></div><br><span style=text-align:right;width:100%;>Finish</span>";
var audiobut='';
if ((mbinter != '' && ('' + parent.document.URL).indexOf('justaudio=y') != -1) || ((documentURL + '&' + asuffis).indexOf('justaudio=&') != -1 && (documentURL.indexOf('youtube_duration=&') == -1 && documentURL.indexOf('youtube_duration=') != -1) && documentURL.indexOf('youtubeid=') != -1 && documentURL.indexOf('emoji=') != -1)) {
audiobut=('<input class="emoji" id="audioejkaraoke" onclick=" ' + mbinter + ' document.getElementById(`myiframe`).style.marginTop=`0px`; document.getElementById(`myiframe`).style.opacity=`1`; document.getElementById(`myiframe`).style.filter="invert(0)"; this.style.display=`none`; " type="submit" style="background-color: orange; visibility: visible;" value="' + String.fromCodePoint(128249) + ' Play Video as below" title="Play Karaoke Style YouTube Video Via Entries Below">').replace(/\`/g,"'");
} else if (('' + parent.document.URL).indexOf('justaudio=y') != -1) {
audiobut=('<input class="emoji" id="audioejkaraoke" onclick=" document.getElementById(`justaudio`).name=`justaudio`; ' + mbinter.replace(",",".replace('?','?justaudio=y&'),") + ' mbmode=false; document.getElementById(`ddejkaraoke`).style.visibility=`visible`; if (document.URL.indexOf(`i0=`) != -1) { next=0; } isendof=ieo; queuenext(); " type="submit" style="background-color: orange; visibility: visible;" value="' + String.fromCodePoint(128483) + ' Play Video as below" title="Play Karaoke Style YouTube Video Via Entries Below">').replace(/\`/g,"'");
} else {
audiobut=('<input class="emoji" id="audioejkaraoke" onclick=" document.getElementById(`justaudio`).name=`justaudio`; ' + mbinter.replace(",",".replace('?','?justaudio=y&'),") + ' mbmode=false; document.getElementById(`ddejkaraoke`).style.visibility=`visible`; if (document.URL.indexOf(`i0=`) != -1) { next=0; } isendof=ieo; queuenext(); " type="submit" style="background-color: orange; visibility: visible;" value="' + String.fromCodePoint(128483) + ' Play Audio as below" title="Play Karaoke Style YouTube Audio Via Entries Below">').replace(/\`/g,"'");
}
… helping out in the changed swipe_media.html Tabular Single Row Image Gallery web application “Radio Play” mode of use.
Previous relevant YouTube API Caller Phase Two Absolute URL Tutorial is shown below.
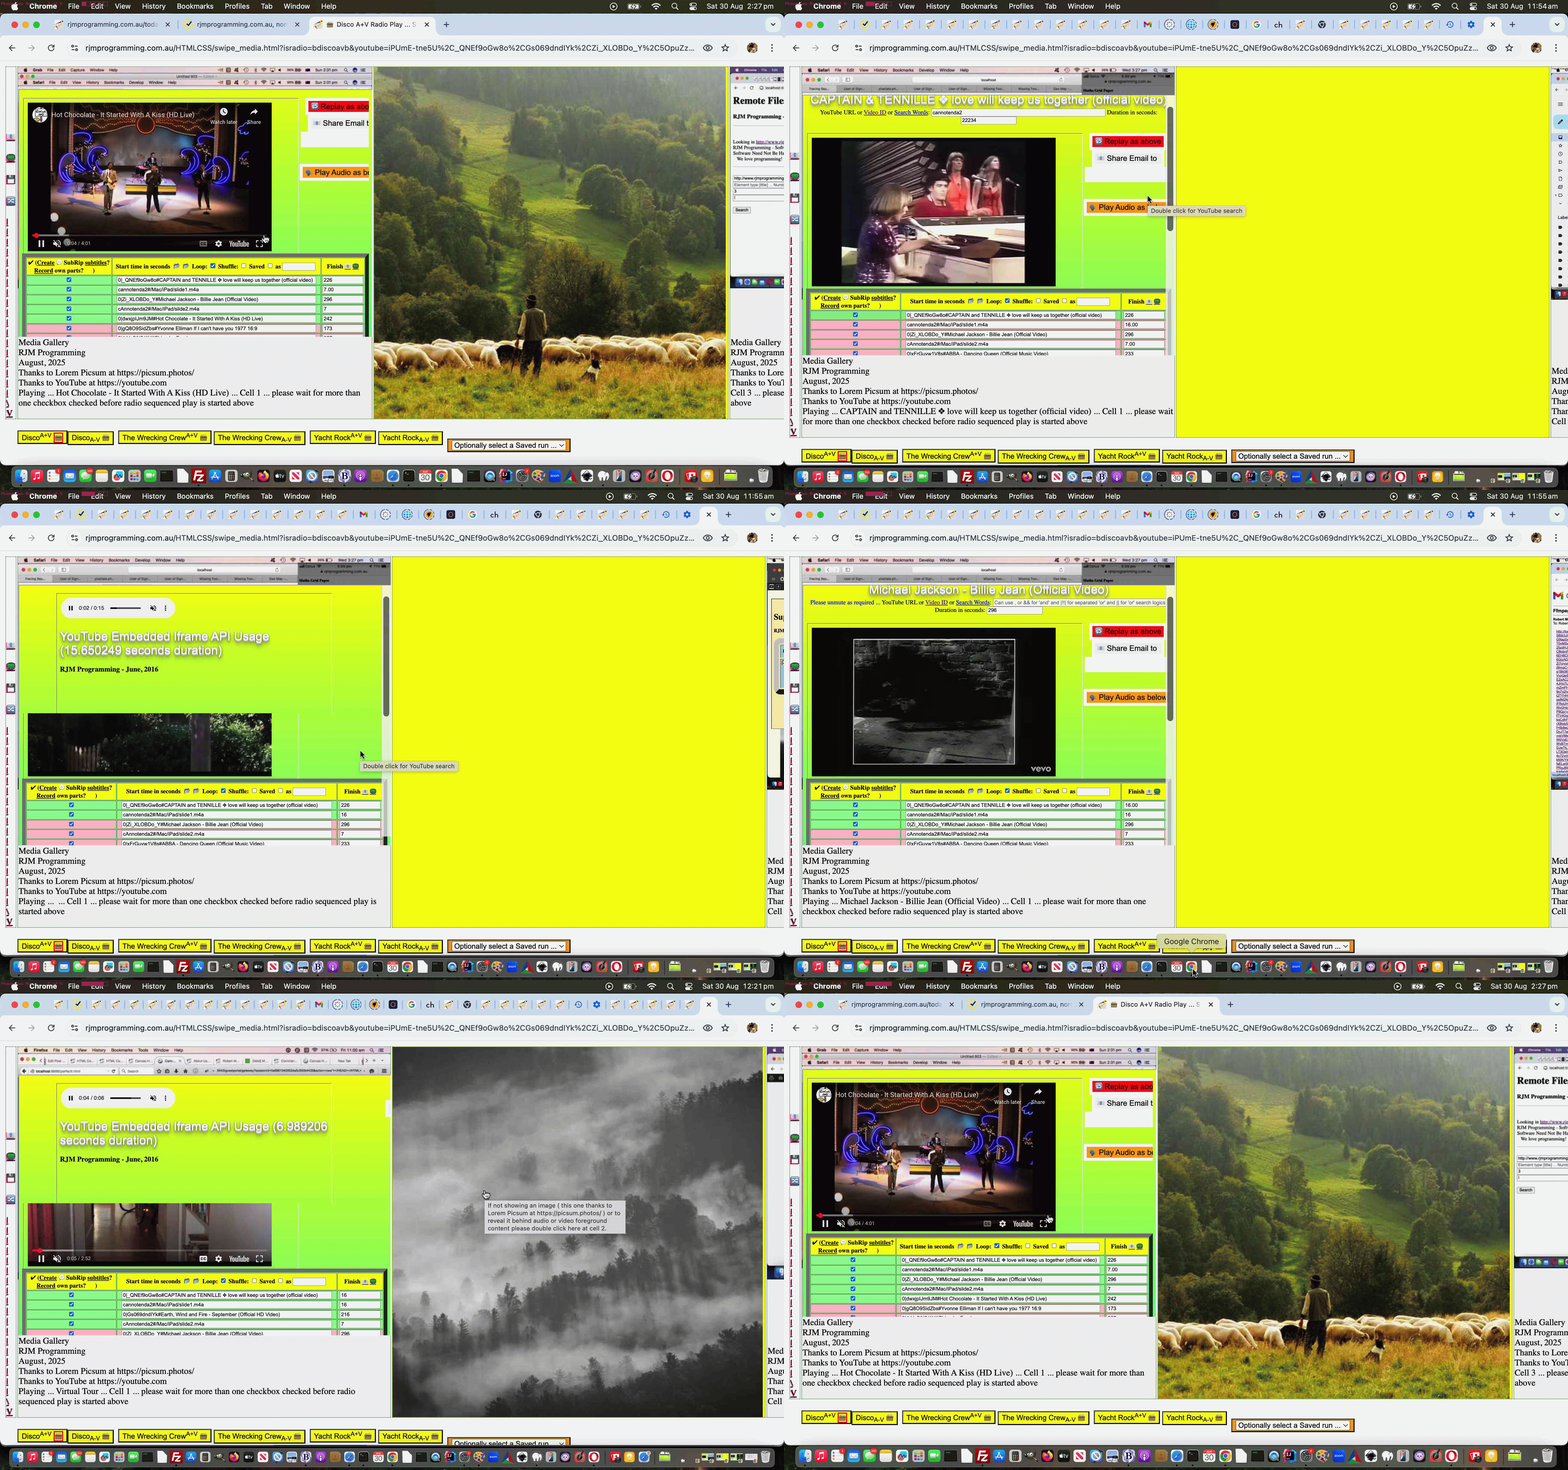
YouTube API Caller Phase Two Absolute URL Tutorial
Onto yesterday’s YouTube API Caller Other Media Playlist Regarding Tutorial it’s taken a long time, even for the conditional blurb below to crystallize, but …
- regarding testing we only did, so far, on non-mobile regarding Radio Play interspersing of YouTube media video plays with non-YouTube ones, so far …
- regarding users entering their own URLs into the textboxes next to the left hand checkboxes during Radio Play usage …
- regarding user entered absolute or relative URLs (but not data URIs yet) …
- pointing to audio or video media mimetype data (so far)
… we finally think we have a presentable web application scenario, worth putting into the mix.
This concerns the Tabular Single Row Image Gallery web application in “Radio Play” mode of use helped out by the changed karaoke_youtube_api.htm inhouse YouTube video interfacer in turn helped out by the modified stop_start_youtube.html YouTube API caller.
Pretty obviously, more to do, and more to shore up, but encouraging signs it’s all possible, this interspersing of YouTube media video plays with non-YouTube ones!
Previous relevant YouTube API Caller Other Media Playlist Regarding Tutorial is shown below.
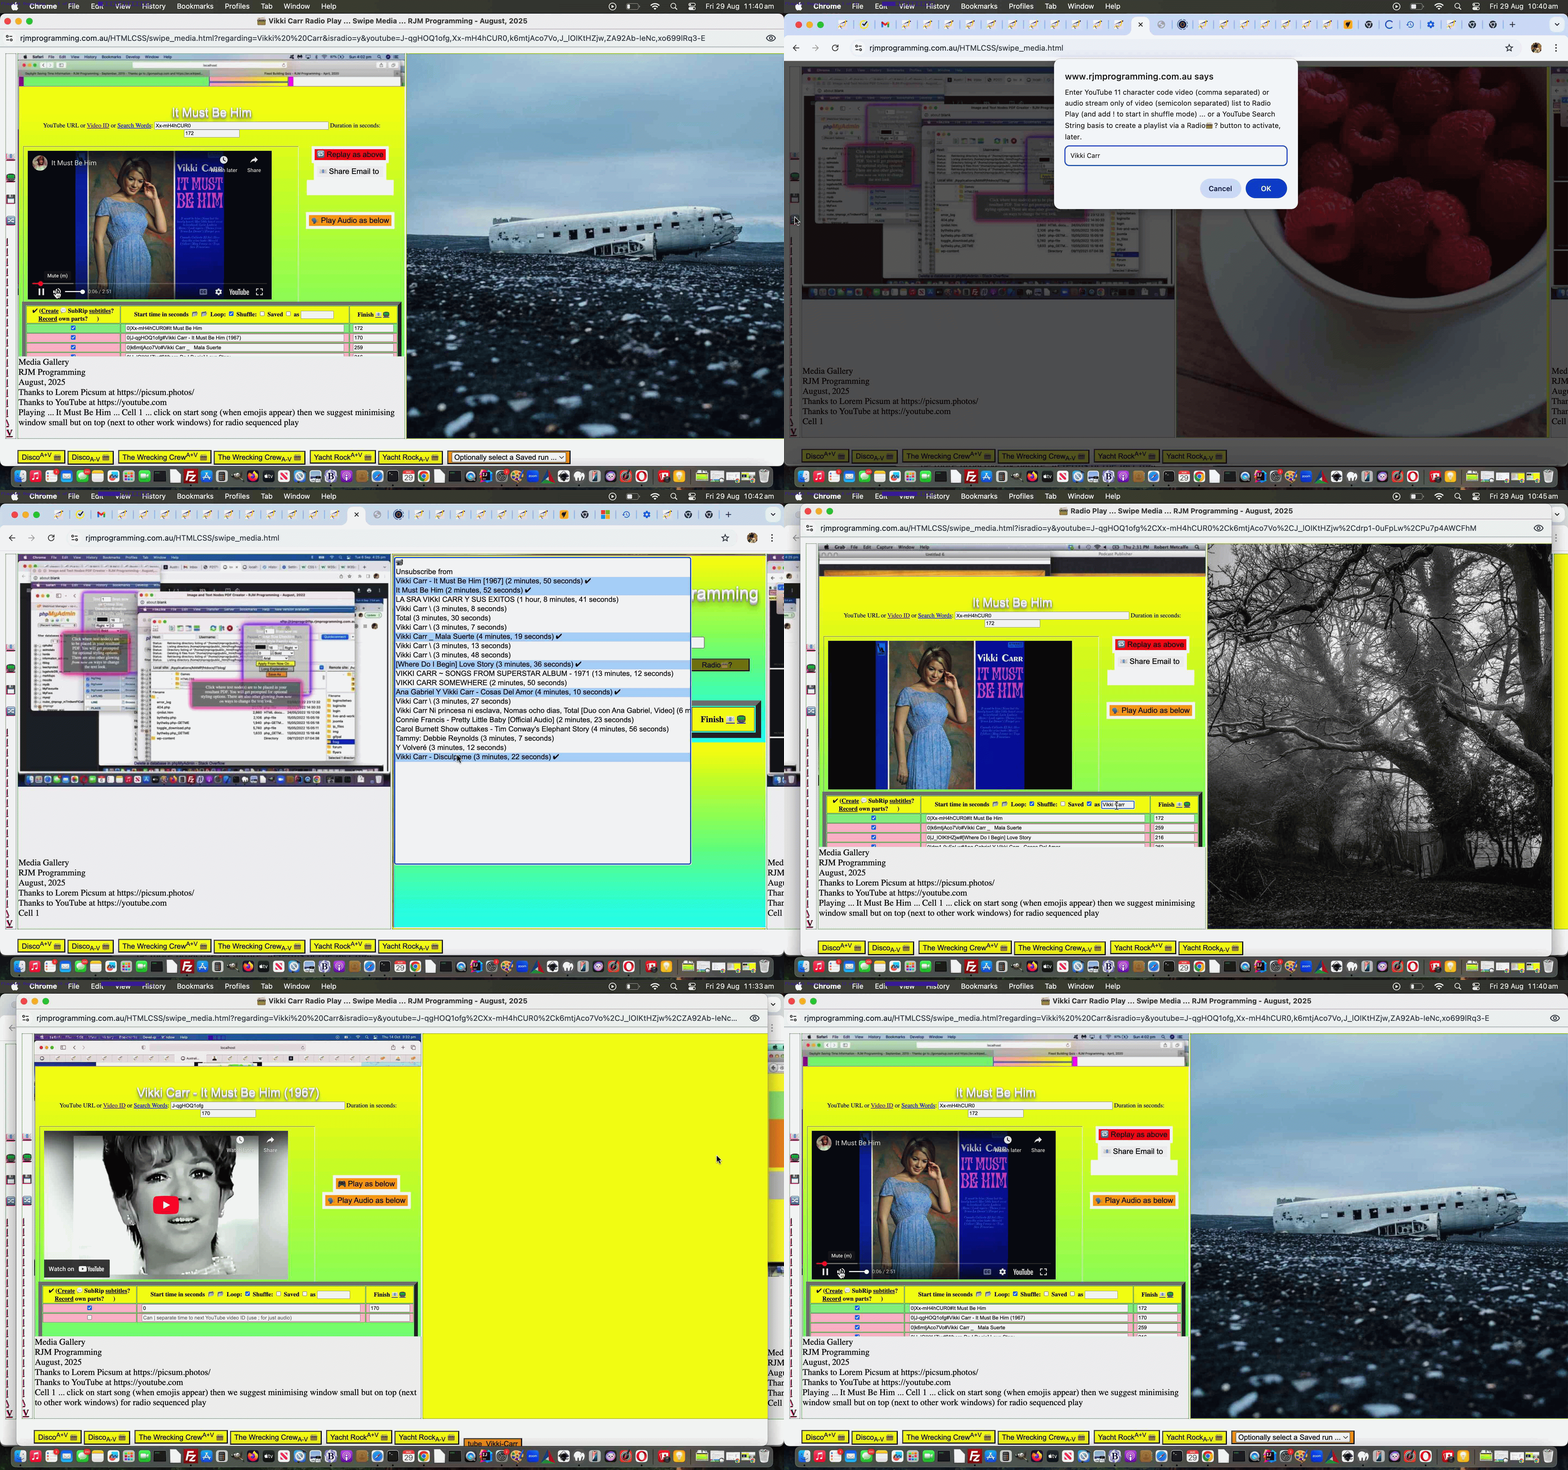
YouTube API Caller Other Media Playlist Regarding Tutorial
Further to yesterday’s YouTube API Caller Other Media Playlist Compilation Tutorial it’s not going to cut the mustard with as many users …
… if you forget to put front and center what it is the user has given you as a piece of their information …
… rather than what some of us (cough, cough) can tend to do as software developers, and bury this in the data out of sight.
What could be better than yesterday’s allowing via emoji 🔀 button for Playlist creation via 11 character YouTube video ID list, albeit “some people’s cup of tea”, than to place the whole …
Playlist Thaing
… back into a user driven chance to control matters? In other words …
function createplaylist(insvalo) {
var tdsare=[], itds=0, itdone=false;;
var oklast=['A','E','I','M','Q','U','Y','c','g','k','o','s','w','0','4','8'];
var argshuf='';
var plist=prompt('Enter YouTube 11 character code video (comma separated) or audio stream only of video (semicolon separated) list to Radio Play (and add ! to start in shuffle mode) ... or a YouTube Search String basis to create a playlist via a Radio' + String.fromCodePoint(128251) + '? button to activate, later.', '');
if (plist != null) {
if (plist.trim() != '') {
if (plist.trim().indexOf(' ') != -1 || eval('' + plist.trim().split(',')[0].split(';')[0].length) != 11 || oklast.indexOf(plist.trim().split(',')[0].split(';')[0].slice(-1)) == -1) {
tdsare=document.getElementsByTagName('td');
for (itds=0; itds<tdsare.length; itds++) {
if (!itdone && tdsare[itds].innerHTML == '' && ('' + tdsare[itds].id) != 'td0001') {
itdone=true;
tdsare[itds].innerHTML='<iframe style="width:100%;height:100%;" id=karsearch name=karsearch src="/HTMLCSS/karaoke_youtube_api.htm?youtubeid=++++++++++++' + encodeURIComponent(plist.trim()) + '&minimize=y&youtube_duration=&email=&emoji=on&clickcheck=y"></iframe>';
tdsare[itds].scrollIntoView();
}
}
} else {
if (plist.replace(/\!$/g,'') != plist) { argshuf='&shuffle=y'; }
if (plist.indexOf(';') != -1 && plist.indexOf(',') == -1) {
window.open('./swipe_media.html?isradio=y' + argshuf + '&audioyoutube=' + encodeURIComponent(extraatendmaybe(plist.replace(/\;/g,',').replace(/\!$/g,''),'isradio=y' + argshuf)),'_blank');
} else {
window.open('./swipe_media.html?isradio=y' + argshuf + '&youtube=' + encodeURIComponent(extraatendmaybe(plist.replace(/\;/g,',').replace(/\!$/g,''),'isradio=y' + argshuf)),'_blank');
}
}
}
}
}
… and should the user go on to remember that playlist, what they entered as a YouTube Search String basis gets remembered in Radio Play webpage titling (and hence, in web browser window name lists). And the user can see how the playlist was created, especially if they named their recallable playlist well, in a more transparent way in the changed swipe_media.html Tabular Single Row Image Gallery web application “Radio Play” mode of use, now allowing via emoji 🔀 button for Playlist creation via 11 character YouTube video ID lists, all helped out by the changed karaoke_youtube_api.htm inhouse YouTube video interfacer.
Some Vikki Carr magic, anyone?!
Previous relevant YouTube API Caller Other Media Playlist Compilation Tutorial is shown below.
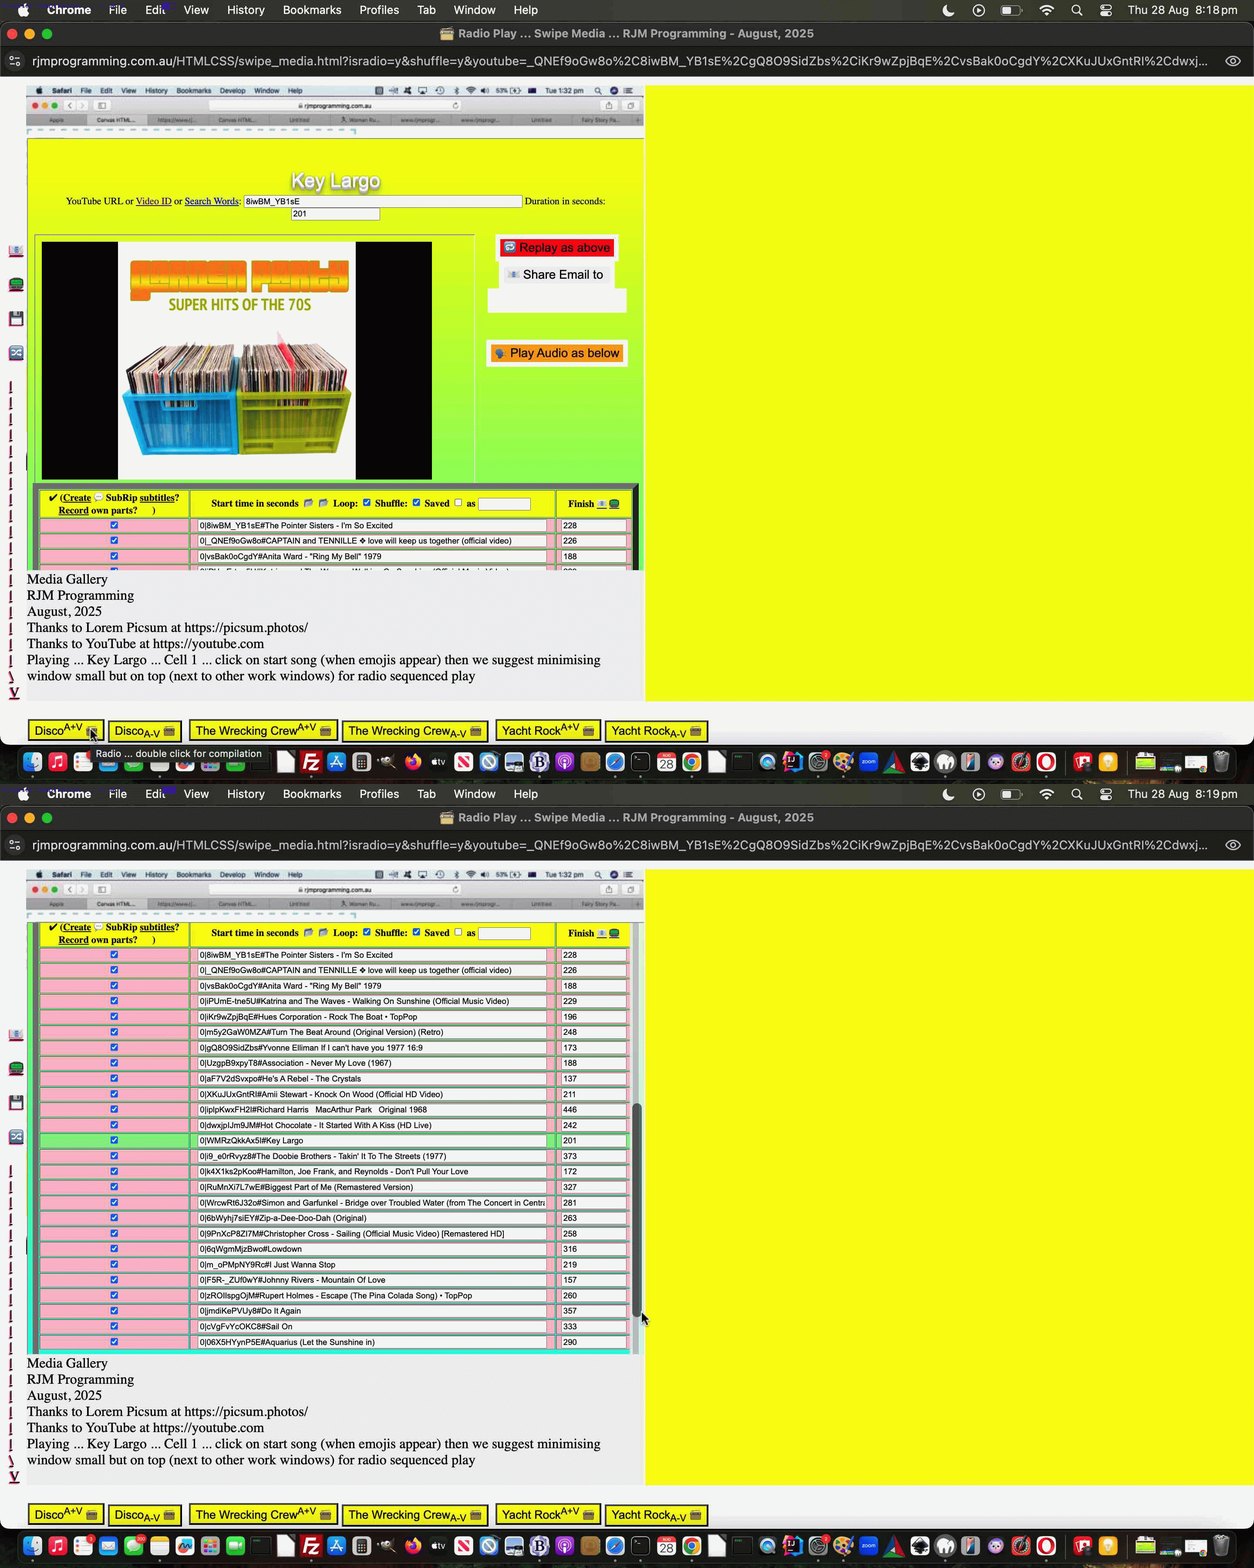
YouTube API Caller Other Media Playlist Compilation Tutorial
Onto yesterday’s YouTube API Caller Other Media Playlist Recall Tutorial …
- work has progressed on Phase Two integrations, sideways then forwards, and “getting there” … but for the meantime there are other features we want here …
- like a way to compile songs from our three featured music ideas into an immediately shuffled longer playlist …
… via double clicks on Radio Play 📻 emojis, as per …
var independent=true, didothers=false;
function triplewhammy() {
independent=false;
location.hash='#independent=false';
argshuffle='&shuffle=y';
prefix='isradio=y' + argshuffle + '&';
dodisco('ISRADIO=BDISCOAVB&');
setTimeout(function(){
prefix='isradio=y' + argshuffle + '&';
dowc('ISRADIO=BWCAVB&');
}, 3000);
setTimeout(function(){
prefix='isradio=y' + argshuffle + '&';
doyr('ISRADIO=BYRAVB&');
}, 7000);
setTimeout(function(){ independent=true; }, 37000);
}
function split_embed(iois) {
var iso=-1;
if (('' + location.hash).indexOf('independent') != -1) { independent=false; iso=0; }
var aconto = (iois.contentWindow || iois.contentDocument);
if (aconto != null) {
if (aconto.document) { aconto = aconto.document; }
if (aconto.body != null) {
var tyembeds=aconto.body.innerHTML.split('/embed/');
if (eval('' + tyembeds.length) <= 1) { setTimeout(function(){ checkiflater(document.getElementById(iois.id)); }, 6000); } else {
for (var it=1; it<tyembeds.length; it++) {
if (iso < 0 || iso < 9) {
if (iso >= 0) { iso++ }
if (ytlist.trim() == '') {
ytlist+='' + tyembeds[it].substring(0,11);
} else {
ytlist+=',' + tyembeds[it].substring(0,11);
}
}
}
if (ytlist != '') {
if (prefix.indexOf('isradio=') != -1 && !navigator.userAgent.match(/Android|BlackBerry|iPhone|iPad|iPod|Opera Mini|IEMobile/i)) {
if (ytwo) {
if (!ytwo.closed) {
ytwo.close();
ytwo=null;
}
ytwo=null;
}
if (!independent) {
prefix='isradio=y' + argshuffle + '&';
}
if (!didothers) {
ytwo=window.open(document.URL.split('?')[0].split('#')[0] + '?' + prefix + 'youtube=' + encodeURIComponent(extraatendmaybe(ytlist,prefix).trim()),'_blank','top=0,left=0,width=' + screen.width + ',height=' + screen.height);
} else {
setTimeout(function(){
ytwo=window.open(document.URL.split('?')[0].split('#')[0] + '?' + prefix + 'youtube=' + encodeURIComponent(extraatendmaybe(ytlist,prefix).trim()),'_blank','top=0,left=0,width=' + screen.width + ',height=' + screen.height);
}, 4000);
}
} else {
if (!independent) {
prefix='isradio=y' + argshuffle + '&';
}
if (!didothers) {
location.href=document.URL.split('?')[0].split('#')[0] + '?' + prefix + 'youtube=' + encodeURIComponent(extraatendmaybe(ytlist,prefix).trim());
} else {
setTimeout(function(){
location.href=document.URL.split('?')[0].split('#')[0] + '?' + prefix + 'youtube=' + encodeURIComponent(extraatendmaybe(ytlist,prefix).trim());
}, 4000);
}
//}
}
}
}
}
}
}
function split_embed_two(iois) {
//didothers=true;
var iso=-1;
if (('' + location.hash).indexOf('independent') != -1) { independent=false; iso=0; }
var aconto = (iois.contentWindow || iois.contentDocument);
if (aconto != null) {
if (aconto.document) { aconto = aconto.document; }
if (aconto.body != null) {
var tyembeds=aconto.body.innerHTML.split('/embed/');
if (eval('' + tyembeds.length) <= 1) { setTimeout(function(){ checkiflater(document.getElementById(iois.id)); }, 6000); } else {
for (var it=1; it<tyembeds.length; it++) {
if (iso < 0 || iso < 9) {
if (iso >= 0) { iso++ }
if (ytlist.trim() == '') {
ytlist+='' + tyembeds[it].substring(0,11);
} else {
ytlist+=',' + tyembeds[it].substring(0,11);
}
}
}
if (ytlist != '') {
if (prefix.indexOf('isradio=') != -1 && !navigator.userAgent.match(/Android|BlackBerry|iPhone|iPad|iPod|Opera Mini|IEMobile/i)) {
if (ytwo) {
if (!ytwo.closed) {
ytwo.close();
ytwo=null;
}
ytwo=null;
}
if (1 == 5) {
ytwo=window.open(document.URL.split('?')[0].split('#')[0] + '?' + prefix + 'youtube=' + encodeURIComponent(extraatendmaybe(ytlist,prefix).trim()),'_blank','top=0,left=0,width=' + screen.width + ',height=' + screen.height);
}
} else {
if (1 == 5) {
location.href=document.URL.split('?')[0].split('#')[0] + '?' + prefix + 'youtube=' + encodeURIComponent(extraatendmaybe(ytlist,prefix).trim());
}
}
}
}
}
}
}
function split_embed_three(iois) {
//didothers=true;
var iso=-1;
if (('' + location.hash).indexOf('independent') != -1) { independent=false; iso=0; }
var aconto = (iois.contentWindow || iois.contentDocument);
if (aconto != null) {
if (aconto.document) { aconto = aconto.document; }
if (aconto.body != null) {
var tyembeds=aconto.body.innerHTML.split('/embed/');
if (eval('' + tyembeds.length) <= 1) { setTimeout(function(){ checkiflater(document.getElementById(iois.id)); }, 6000); } else {
for (var it=1; it<tyembeds.length; it++) {
if (iso < 0 || iso < 9) {
if (iso >= 0) { iso++ }
if (ytlist.trim() == '') {
ytlist+='' + tyembeds[it].substring(0,11);
} else {
ytlist+=',' + tyembeds[it].substring(0,11);
}
}
}
if (ytlist != '') {
if (prefix.indexOf('isradio=') != -1 && !navigator.userAgent.match(/Android|BlackBerry|iPhone|iPad|iPod|Opera Mini|IEMobile/i)) {
if (ytwo) {
if (!ytwo.closed) {
ytwo.close();
ytwo=null;
}
ytwo=null;
}
if (1 == 5) {
ytwo=window.open(document.URL.split('?')[0].split('#')[0] + '?' + prefix + 'youtube=' + encodeURIComponent(extraatendmaybe(ytlist,prefix).trim()),'_blank','top=0,left=0,width=' + screen.width + ',height=' + screen.height);
}
} else {
if (1 == 5) {
location.href=document.URL.split('?')[0].split('#')[0] + '?' + prefix + 'youtube=' + encodeURIComponent(extraatendmaybe(ytlist,prefix).trim());
}
}
}
}
}
}
}
function dodisco(dwhat) {
if (independent) {
if (prefix.indexOf('shuffle=') == -1) { prefix=dwhat; }
document.getElementById('spareif').src='/HTMLCSS/disco_version.html?rand=' + Math.floor(Math.random() * 1987865);
} else if (dwhat == dwhat.toUpperCase()) {
if (ytlist == '') { ytlist=' '; }
document.getElementById('spareifthree').src='/HTMLCSS/disco_version.html?rand=' + Math.floor(Math.random() * 1987865);
//document.getElementById('spareiftwo').src='/HTMLCSS/the_wrecking_crew.html?rand=' + Math.floor(Math.random() * 1987865);
//document.getElementById('spareif').src='/HTMLCSS/yacht_rock.html?rand=' + Math.floor(Math.random() * 1987865);
}
}
function dowc(dwhat) {
if (independent) {
if (prefix.indexOf('shuffle=') == -1) { prefix=dwhat; }
document.getElementById('spareif').src='/HTMLCSS/the_wrecking_crew.html?rand=' + Math.floor(Math.random() * 1987865);
} else if (dwhat == dwhat.toUpperCase()) {
if (ytlist == '') { ytlist=' '; }
//document.getElementById('spareifthree').src='/HTMLCSS/disco_version.html?rand=' + Math.floor(Math.random() * 1987865);
document.getElementById('spareiftwo').src='/HTMLCSS/the_wrecking_crew.html?rand=' + Math.floor(Math.random() * 1987865);
//document.getElementById('spareif').src='/HTMLCSS/yacht_rock.html?rand=' + Math.floor(Math.random() * 1987865);
}
}
function doyr(dwhat) {
if (independent) {
if (prefix.indexOf('shuffle=') == -1) { prefix=dwhat; }
document.getElementById('spareif').src='/HTMLCSS/yacht_rock.html?rand=' + Math.floor(Math.random() * 1987865);
} else if (dwhat == dwhat.toUpperCase()) {
if (ytlist == '') { ytlist=' '; }
//document.getElementById('spareifthree').src='/HTMLCSS/disco_version.html?rand=' + Math.floor(Math.random() * 1987865);
//document.getElementById('spareiftwo').src='/HTMLCSS/the_wrecking_crew.html?rand=' + Math.floor(Math.random() * 1987865);
document.getElementById('spareif').src='/HTMLCSS/yacht_rock.html?rand=' + Math.floor(Math.random() * 1987865);
}
}
… in the changed swipe_media.html Tabular Single Row Image Gallery web application “Radio Play” mode of use, now allowing via emoji 🔀 button for Playlist creation via 11 character YouTube video ID lists, all helped out by the changed karaoke_youtube_api.htm inhouse YouTube video interfacer.
Previous relevant YouTube API Caller Other Media Playlist Recall Tutorial is shown below.
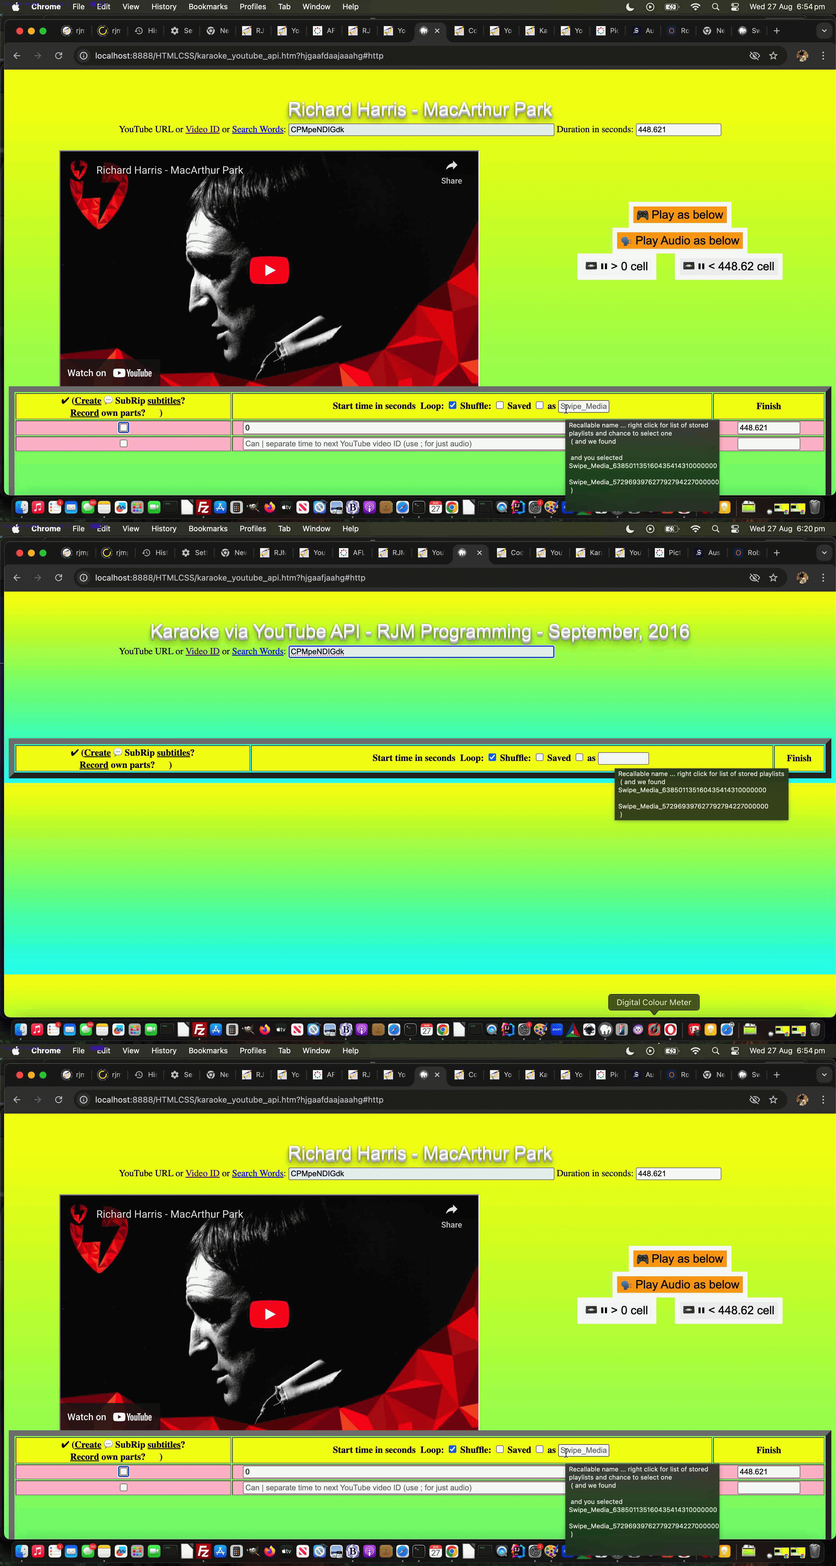
YouTube API Caller Other Media Playlist Recall Tutorial
Onto yesterday’s YouTube API Caller Other Media Playlist Creation Tutorial …
- work has progressed on Phase Two integrations, forwards, and “getting there” … but for the meantime there are other features we want here …
- like more ways to recall user determined YouTube derived playlists and we found that …
… the changed karaoke_youtube_api.htm inhouse YouTube video interfacer‘s playlist recall functionality needed this overhaul …
function hoverplaylist(tboxrelo, doprompt) {
var p_ans='';
perused_list='';
Object.keys(window.localStorage).forEach(function(key){
if (('' + key).indexOf('tube') == 0) {
if (perused_list == '') { perused_list=tboxrelo.title.split(String.fromCharCode(10))[0] + String.fromCharCode(10) + ' ( and we found )'; }
perused_list=perused_list.replace(' )', ' ' + String.fromCharCode(10) + key.replace('tube_','').replace(/\-/g,' ') + String.fromCharCode(10) + ' )');
} else if (('' + key).indexOf('karaoke_youtube_api-') == 0) {
if (perused_list == '') { perused_list=tboxrelo.title.split(String.fromCharCode(10))[0] + String.fromCharCode(10) + ' ( and we found )'; }
perused_list=perused_list.replace(' )', ' ' + String.fromCharCode(10) + key.replace('karaoke_youtube_api-','').replace(/\-/g,' ') + String.fromCharCode(10) + ' )');
}
});
if (perused_list != '') { tboxrelo.title=perused_list; p_ans=null; if (doprompt) { p_ans=prompt(perused_list,perused_list); } if (p_ans != null) { if (p_ans != perused_list) { if (document.getElementById('namethechk') && document.URL.indexOf('#http') != -1 && !document.getElementById('namechk').checked) { document.getElementById('namethechk').value=p_ans; saveplaylist(); } } } }
}
function saveplaylist() {
if (document.getElementById('namechk') && document.getElementById('namethechk') && document.URL.indexOf('#http') != -1) {
if (!document.getElementById('namechk').checked && document.getElementById('namethechk').value.trim() != '') {
if (document.getElementById('namethechk').value.indexOf('tube_') == 0 || document.getElementById('namethechk').value.indexOf('karaoke_youtube_api-') == 0) {
if (('' + window.localStorage.getItem(document.getElementById('namethechk').value.replace(/\ /g, '-'))).replace(/^null/g,'').replace(/^undefined/g,'') != '') {
window.open(decodeURIComponent(window.localStorage.getItem(document.getElementById('namethechk').value.replace(/\ /g, '-'))), '_blank', 'top=100,left=100,width=800,height=800');
document.getElementById('namethechk').placeholder=document.getElementById('namethechk').value;
document.getElementById('namethechk').title=document.getElementById('namethechk').title.replace(document.getElementById('namethechk').value, String.fromCharCode(10) + ' and you selected ' + String.fromCharCode(10) + document.getElementById('namethechk').value);
document.getElementById('namethechk').value='';
}
} else if (('' + window.localStorage.getItem('karaoke_youtube_api-' + document.getElementById('namethechk').value.replace(/\ /g, '-'))).replace(/^null/g,'').replace(/^undefined/g,'') != '') {
window.open(decodeURIComponent(window.localStorage.getItem('karaoke_youtube_api-' + document.getElementById('namethechk').value.replace(/\ /g, '-'))), '_blank', 'top=100,left=100,width=800,height=800');
document.getElementById('namethechk').placeholder=document.getElementById('namethechk').value;
document.getElementById('namethechk').title=document.getElementById('namethechk').title.replace(document.getElementById('namethechk').value, String.fromCharCode(10) + ' and you selected ' + String.fromCharCode(10) + document.getElementById('namethechk').value);
document.getElementById('namethechk').value='';
} else if (('' + window.localStorage.getItem('tube_' + document.getElementById('namethechk').value.replace(/\ /g, '-'))).replace(/^null/g,'').replace(/^undefined/g,'') != '') {
window.open(decodeURIComponent(window.localStorage.getItem('tube_' + document.getElementById('namethechk').value.replace(/\ /g, '-'))), '_blank', 'top=100,left=100,width=800,height=800');
document.getElementById('namethechk').placeholder=document.getElementById('namethechk').value;
document.getElementById('namethechk').title=document.getElementById('namethechk').title.replace(document.getElementById('namethechk').value, String.fromCharCode(10) + ' and you selected ' + String.fromCharCode(10) + document.getElementById('namethechk').value);
document.getElementById('namethechk').value='';
}
} else if (document.getElementById('namechk').checked && document.getElementById('namethechk').value.trim() != '') {
if (('' + window.localStorage.getItem('karaoke_youtube_api-' + document.getElementById('namethechk').value.replace(/\ /g, '-'))).replace(/^null/g,'').replace(/^undefined/g,'') != '') {
window.localStorage.removeItem('karaoke_youtube_api-' + document.getElementById('namethechk').value.replace(/\ /g, '-'));
}
if (('' + window.localStorage.getItem('tube_' + document.getElementById('namethechk').value.replace(/\ /g, '-'))).replace(/^null/g,'').replace(/^undefined/g,'') != '') {
window.localStorage.removeItem('tube_' + document.getElementById('namethechk').value.replace(/\ /g, '-'));
}
var wpd='';
if (window.parent) {
if (parent.document.URL.indexOf('/swipe_media.htm') != -1) {
wpd=parent.get_doc();
}
}
if (wpd != '') {
window.localStorage.setItem('tube_' + document.getElementById('namethechk').value.replace(/\ /g, '-'), encodeURIComponent(decodeURIComponent(wpd)));
} else if (docURL != document.URL || ('' + document.URL + 's').replace(/\#https/g,'') != ('' + document.URL + 's')) {
window.localStorage.setItem('karaoke_youtube_api-' + document.getElementById('namethechk').value.replace(/\ /g, '-'), encodeURIComponent(decodeURIComponent(docURL)));
} else {
window.localStorage.setItem('karaoke_youtube_api-' + document.getElementById('namethechk').value.replace(/\ /g, '-'), encodeURIComponent(decodeURIComponent(document.URL.split('#')[1]).split('&loop=')[0].split('&name=')[0] + '#' + document.URL.split('#')[1]));
}
}
}
}
… and feeding this into the workings of the changed swipe_media.html Tabular Single Row Image Gallery web application “Radio Play” mode of use.
Previous relevant YouTube API Caller Other Media Playlist Creation Tutorial is shown below.
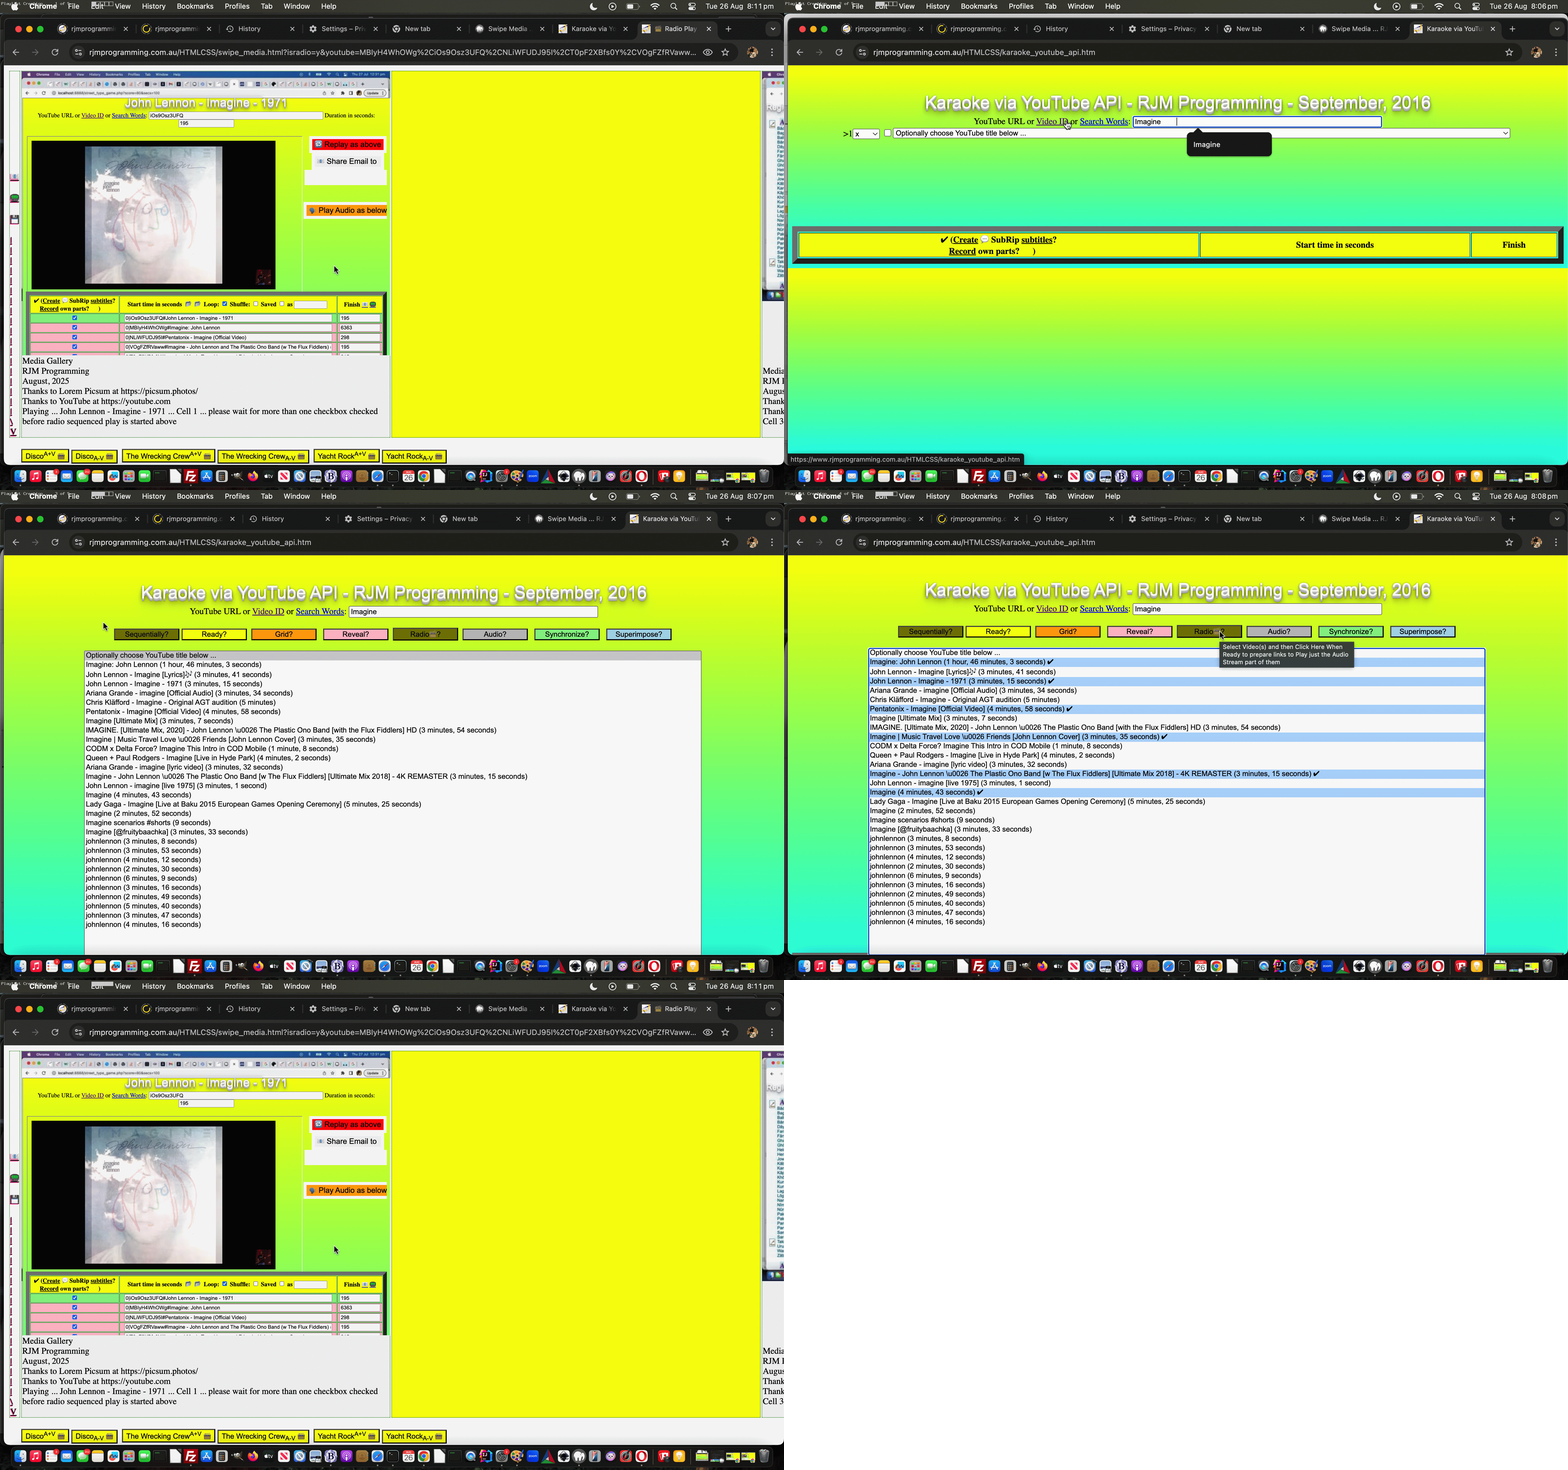
YouTube API Caller Other Media Playlist Creation Tutorial
Onto the recent YouTube API Caller Other Media Phase Two Iframe Tutorial …
- work has progressed on Phase Two integrations, forwards, and “getting there” … but for the meantime there are other features we want here …
- like more ways to create user determined YouTube derived playlists and the best place we’ve found for this is via
… the changed karaoke_youtube_api.htm inhouse YouTube video interfacer‘s YouTube Search capabilities.
These searches off that top textbox can lead to a …
- (user should select) multi-select dropdown … off which the user could select a number of YouTube videos (without having to know their 11 character IDs) … and then …
- click the new Radio📻? button … to hook in with …
- the changed swipe_media.html Tabular Single Row Image Gallery web application “Radio Play” mode of use
Stay tuned for more ways to create playlists!
Previous relevant YouTube API Caller Other Media Phase Two Iframe Tutorial is shown below.
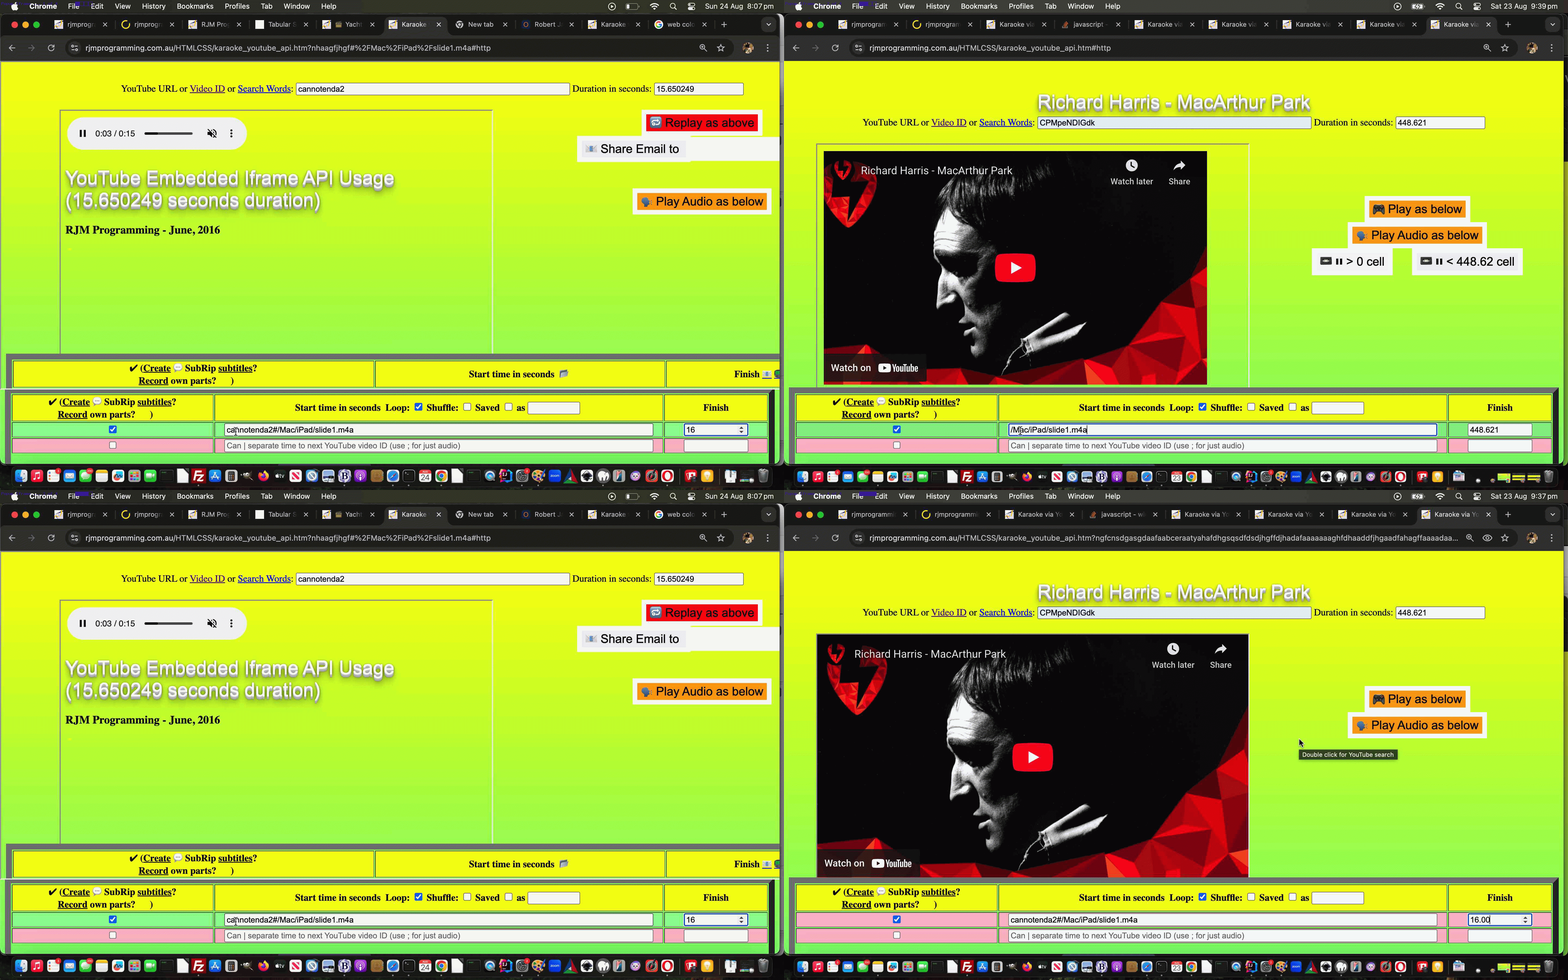
YouTube API Caller Other Media Phase Two Iframe Tutorial
Yesterday’s YouTube API Caller Other Media Phase Two Interfacing Tutorial featured the use of …
- popup windows … much maligned … so if there is a way we can transfer to the less maligned …
- iframe
… keeping the work within the one window, that would be good, yes? Happily, yes is the go, and with little bother too, with referencing code structure like …
function feedoff(intr, compduris, comptitleis) {
var iqw=0;
if (window.parent != window.self) {
if (window.parent.window.opener) {
//alert('vHere ' + ivid);
iqw=0;
while (parent.document.getElementById('i' + iqw)) {
if (parent.document.getElementById('i' + iqw).value.indexOf('cannotenda2') != -1) {
vidarrv[iqw]='cannotenda2';
}
iqw++;
}
//alert('Here ' + ivid);
window.parent.window.opener.nonytopen(ivid, compduris, comptitleis);
} else {
iqw=0;
while (parent.document.getElementById('i' + iqw)) {
if (parent.document.getElementById('i' + iqw).value.indexOf('cannotenda2') != -1) {
vidarrv[iqw]='cannotenda2';
}
iqw++;
}
//alert('gere ' + ivid);
parent.nonytopen(ivid, compduris, comptitleis);
}
//} else {
// alert('therE');
}
return intr;
}
function localended(avo) {
var iqw=0;
if (window.parent) {
if (parent.document.URL.indexOf('tbox=') != -1) {
if (window.parent.window.opener) {
iqw=0;
while (parent.document.getElementById('i' + iqw)) {
if (parent.document.getElementById('i' + iqw).value.indexOf('cannotenda2') != -1) {
vidarrv[iqw]='cannotenda2';
}
iqw++;
}
setTimeout(function() { parent.window.opener.document.getElementById('j' + parent.document.URL.split('tbox=')[1].split('&')[0]).value='' + Math.ceil(eval('' + contdurs[whichnonyt(eval(-1 + contstarts.length))])) + '.00'; parent.document.getElementById('mytopspan').innerHTML='You can close me now ... ' + parent.document.getElementById('mytopspan').innerHTML; parent.window.opener.focus(); parent.window.opener.backtobase(); parent.window.opener.focus(); duration=-1; aminytnon=false; player=altplayer; }, 1000);
//window.close();
}
} else if (parent.document.URL.indexOf('/karaoke_youtube_api.htm') != -1) {
iqw=0;
while (parent.document.getElementById('i' + iqw)) {
if (parent.document.getElementById('i' + iqw).value.indexOf('cannotenda2') != -1) {
vidarrv[iqw]='cannotenda2';
}
iqw++;
}
if (('' + parent.document.URL + 's').replace(/\#https/g,'') != ('' + parent.document.URL + 's')) {
aminytnon=false;
player=altplayer;
duration=-9999;
playingvideo(); //setTimeout(playingvideo, 800);
}
} else if ('blog' != 'blog') {
parent.document.title='Finished ' + avo.outerHTML.substring(1).split(' ')[0];
}
}
}
… essentially unaffected by the pretty dramatic change of window usage configuration. Cute, huh?! But how is this made to happen? It’s really simple, really, as the second parameter of window.open can point to an iframe name attribute …
<iframe name=radioif id=radioif data-laterclick="" data-position=relative data-top=0 data-left=0 data-width=0 data-height=0 data-z=-999 style=display:none; src='//www.rjmprogramming.com.au/HTMLCSS/karaoke_youtube_api.htm#http'></iframe>
… and then we can wrap window.open calls, in amongst very “overlay” minded Javascript code, into our new inhouse “function windowopen” …
function windowopen(w1,w2,w3) {
if (('' + document.getElementById('radioif').getAttribute('data-height')) == '0') {
document.getElementById('radioif').setAttribute('data-height', '' + document.getElementById('tablenmup').getBoundingClientRect().top);
document.getElementById('radioif').setAttribute('data-width', '' + screen.width);
document.getElementById('radioif').setAttribute('data-top', '' + document.getElementById('tablenmup').getBoundingClientRect().top);
}
if (document.getElementById('xx' + nextwoin).outerHTML.indexOf('green') != -1) {
document.getElementById('radioif').style.position='absolute';
document.getElementById('radioif').style.top='0px';
document.getElementById('radioif').style.left='0px';
document.getElementById('radioif').style.width='' + document.getElementById('radioif').getAttribute('data-width') + 'px';
document.getElementById('radioif').style.height='' + document.getElementById('radioif').getAttribute('data-height') + 'px';
document.getElementById('radioif').style.zIndex='999';
document.getElementById('radioif').style.display='block';
} else {
document.getElementById('radioif').style.zIndex='-999';
document.getElementById('radioif').style.display='none';
lastw1=w1;
lastw2=w2;
lastw3=w3;
lastnextwoin=nextwoin;
}
if (w1.indexOf('&rand=') != -1) {
w1=w1.replace('&rand=', '&rand=' + Math.floor(Math.random() * 9));
} else if (w1.indexOf('#') != -1) {
w1=w1.replace('#', '&rand=' + Math.floor(Math.random() * 129) + '#');
}
if (w1.indexOf('&tbox=') != -1) {
w1=w1.replace('&tbox=' + w1.split('&tbox=')[1].split('&')[0].split('#')[0], '&tbox=' + nextwoin);
} else if (w1.indexOf('&') != -1) {
w1=w1.replace('&', '&tbox=' + nextwoin + '&');
}
if (nextwo) {
if (!nextwo.closed) {
nextwo.close();
nextwo=null;
}
}
return window.open(w1,"radioif");
}
… happening in the changed karaoke_youtube_api.htm inhouse YouTube video interfacer in “Radio Play” mode.
And then there was “what we noted as a to do” as …
make click on checkbox after textbox entry work
… in the changed karaoke_youtube_api.htm inhouse YouTube video interfacer in “Radio Play” mode.
And so, for the rest of the day, more progress, but still not there with …
Previous relevant YouTube API Caller Other Media Phase Two Interfacing Tutorial is shown below.
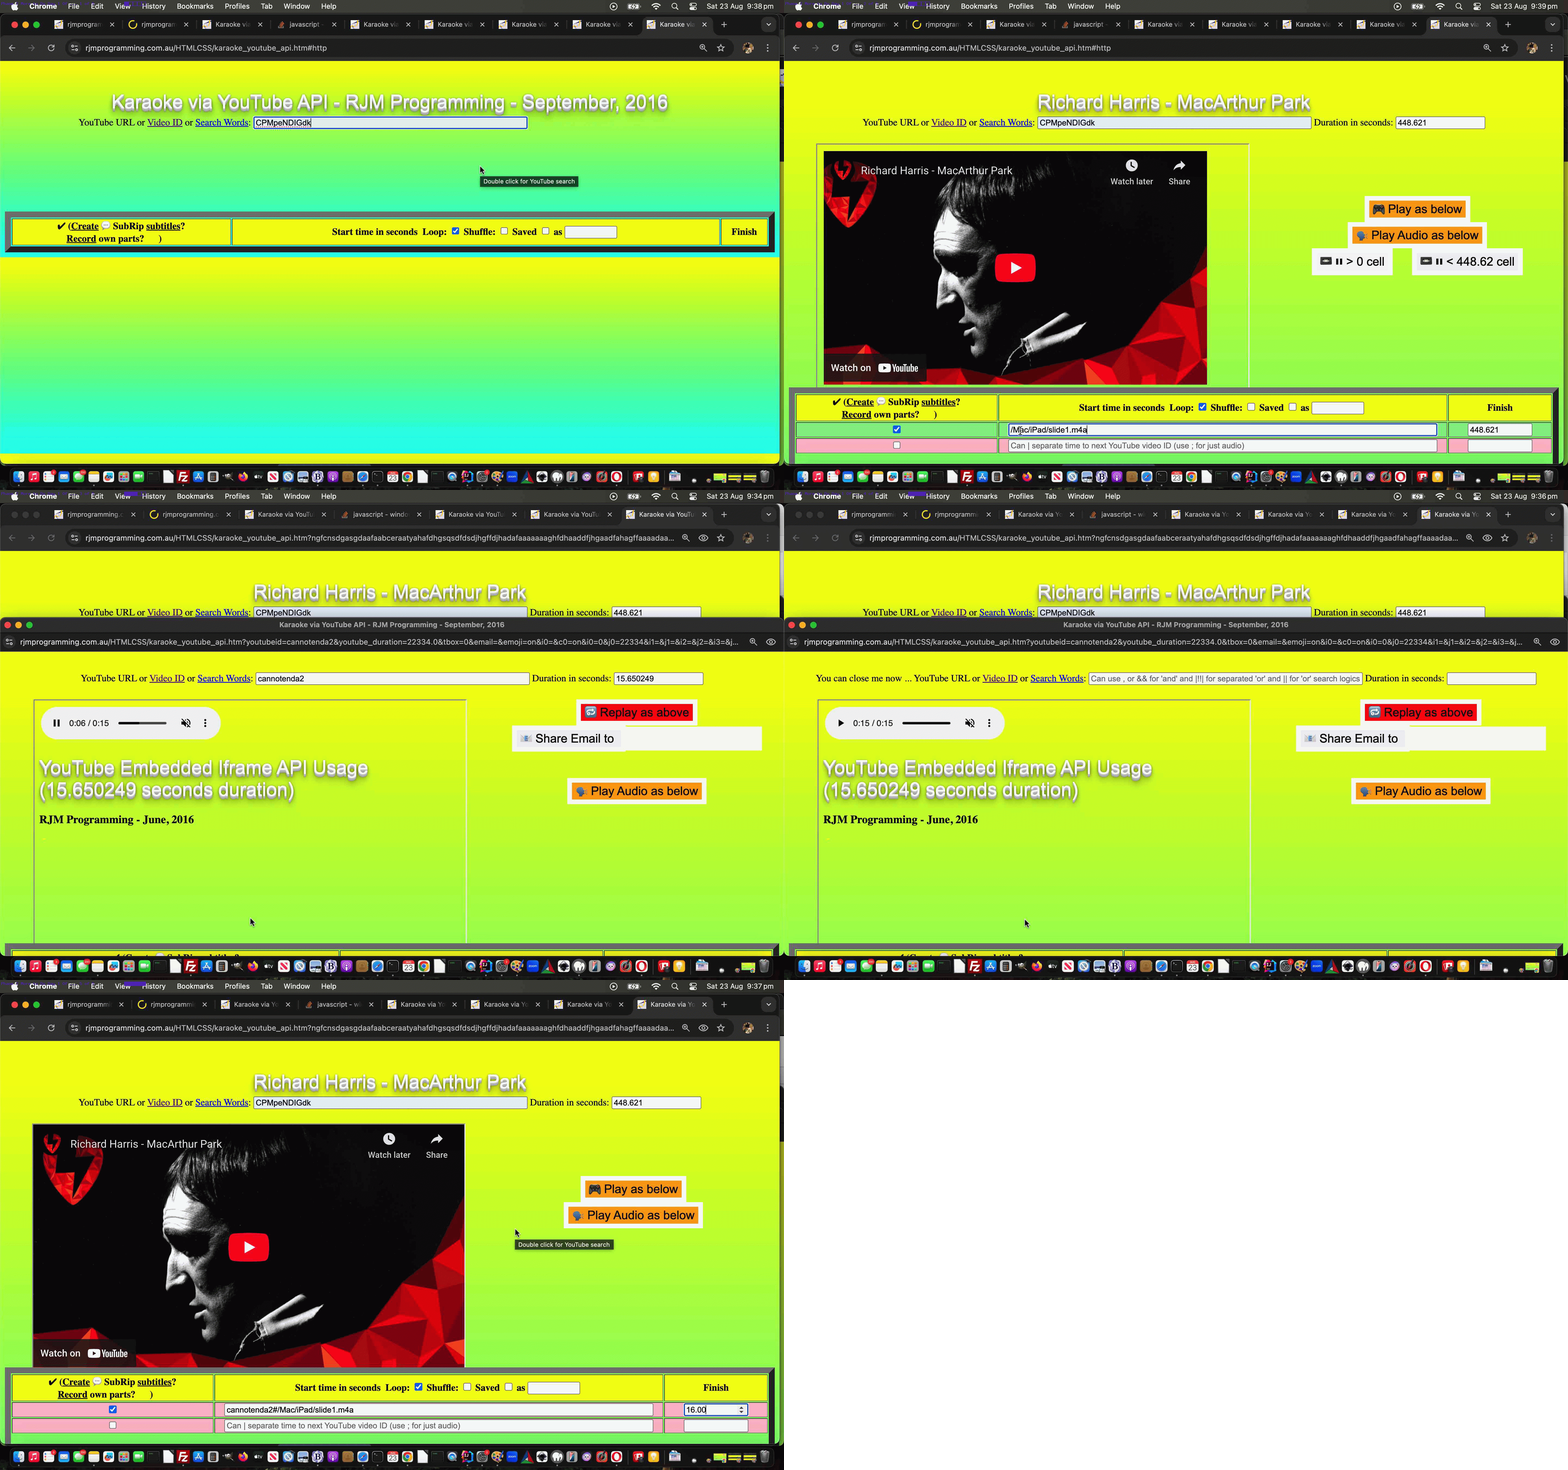
YouTube API Caller Other Media Phase Two Interfacing Tutorial
Onto the recent YouTube API Caller Other Media Interfacing Tutorial we found that …
- isolation interfacing as in our first designated phase 1 … is a doddle compared to when …
- interfacing among a number of players in this (what pans out to be day one of) phase 2
… making it work in with the supervisor of YouTube API “inhouse” web application, and all it’s usage incarnations. We did not expect otherwise. but naturally hoped for the miracle of it all happening in a day.
Never mind … but what can we say about phase 2 we got “contained” today. It’s, to our mind …
Further along, but not there yet, with …
Previous relevant YouTube API Caller Other Media Interfacing Tutorial is shown below.
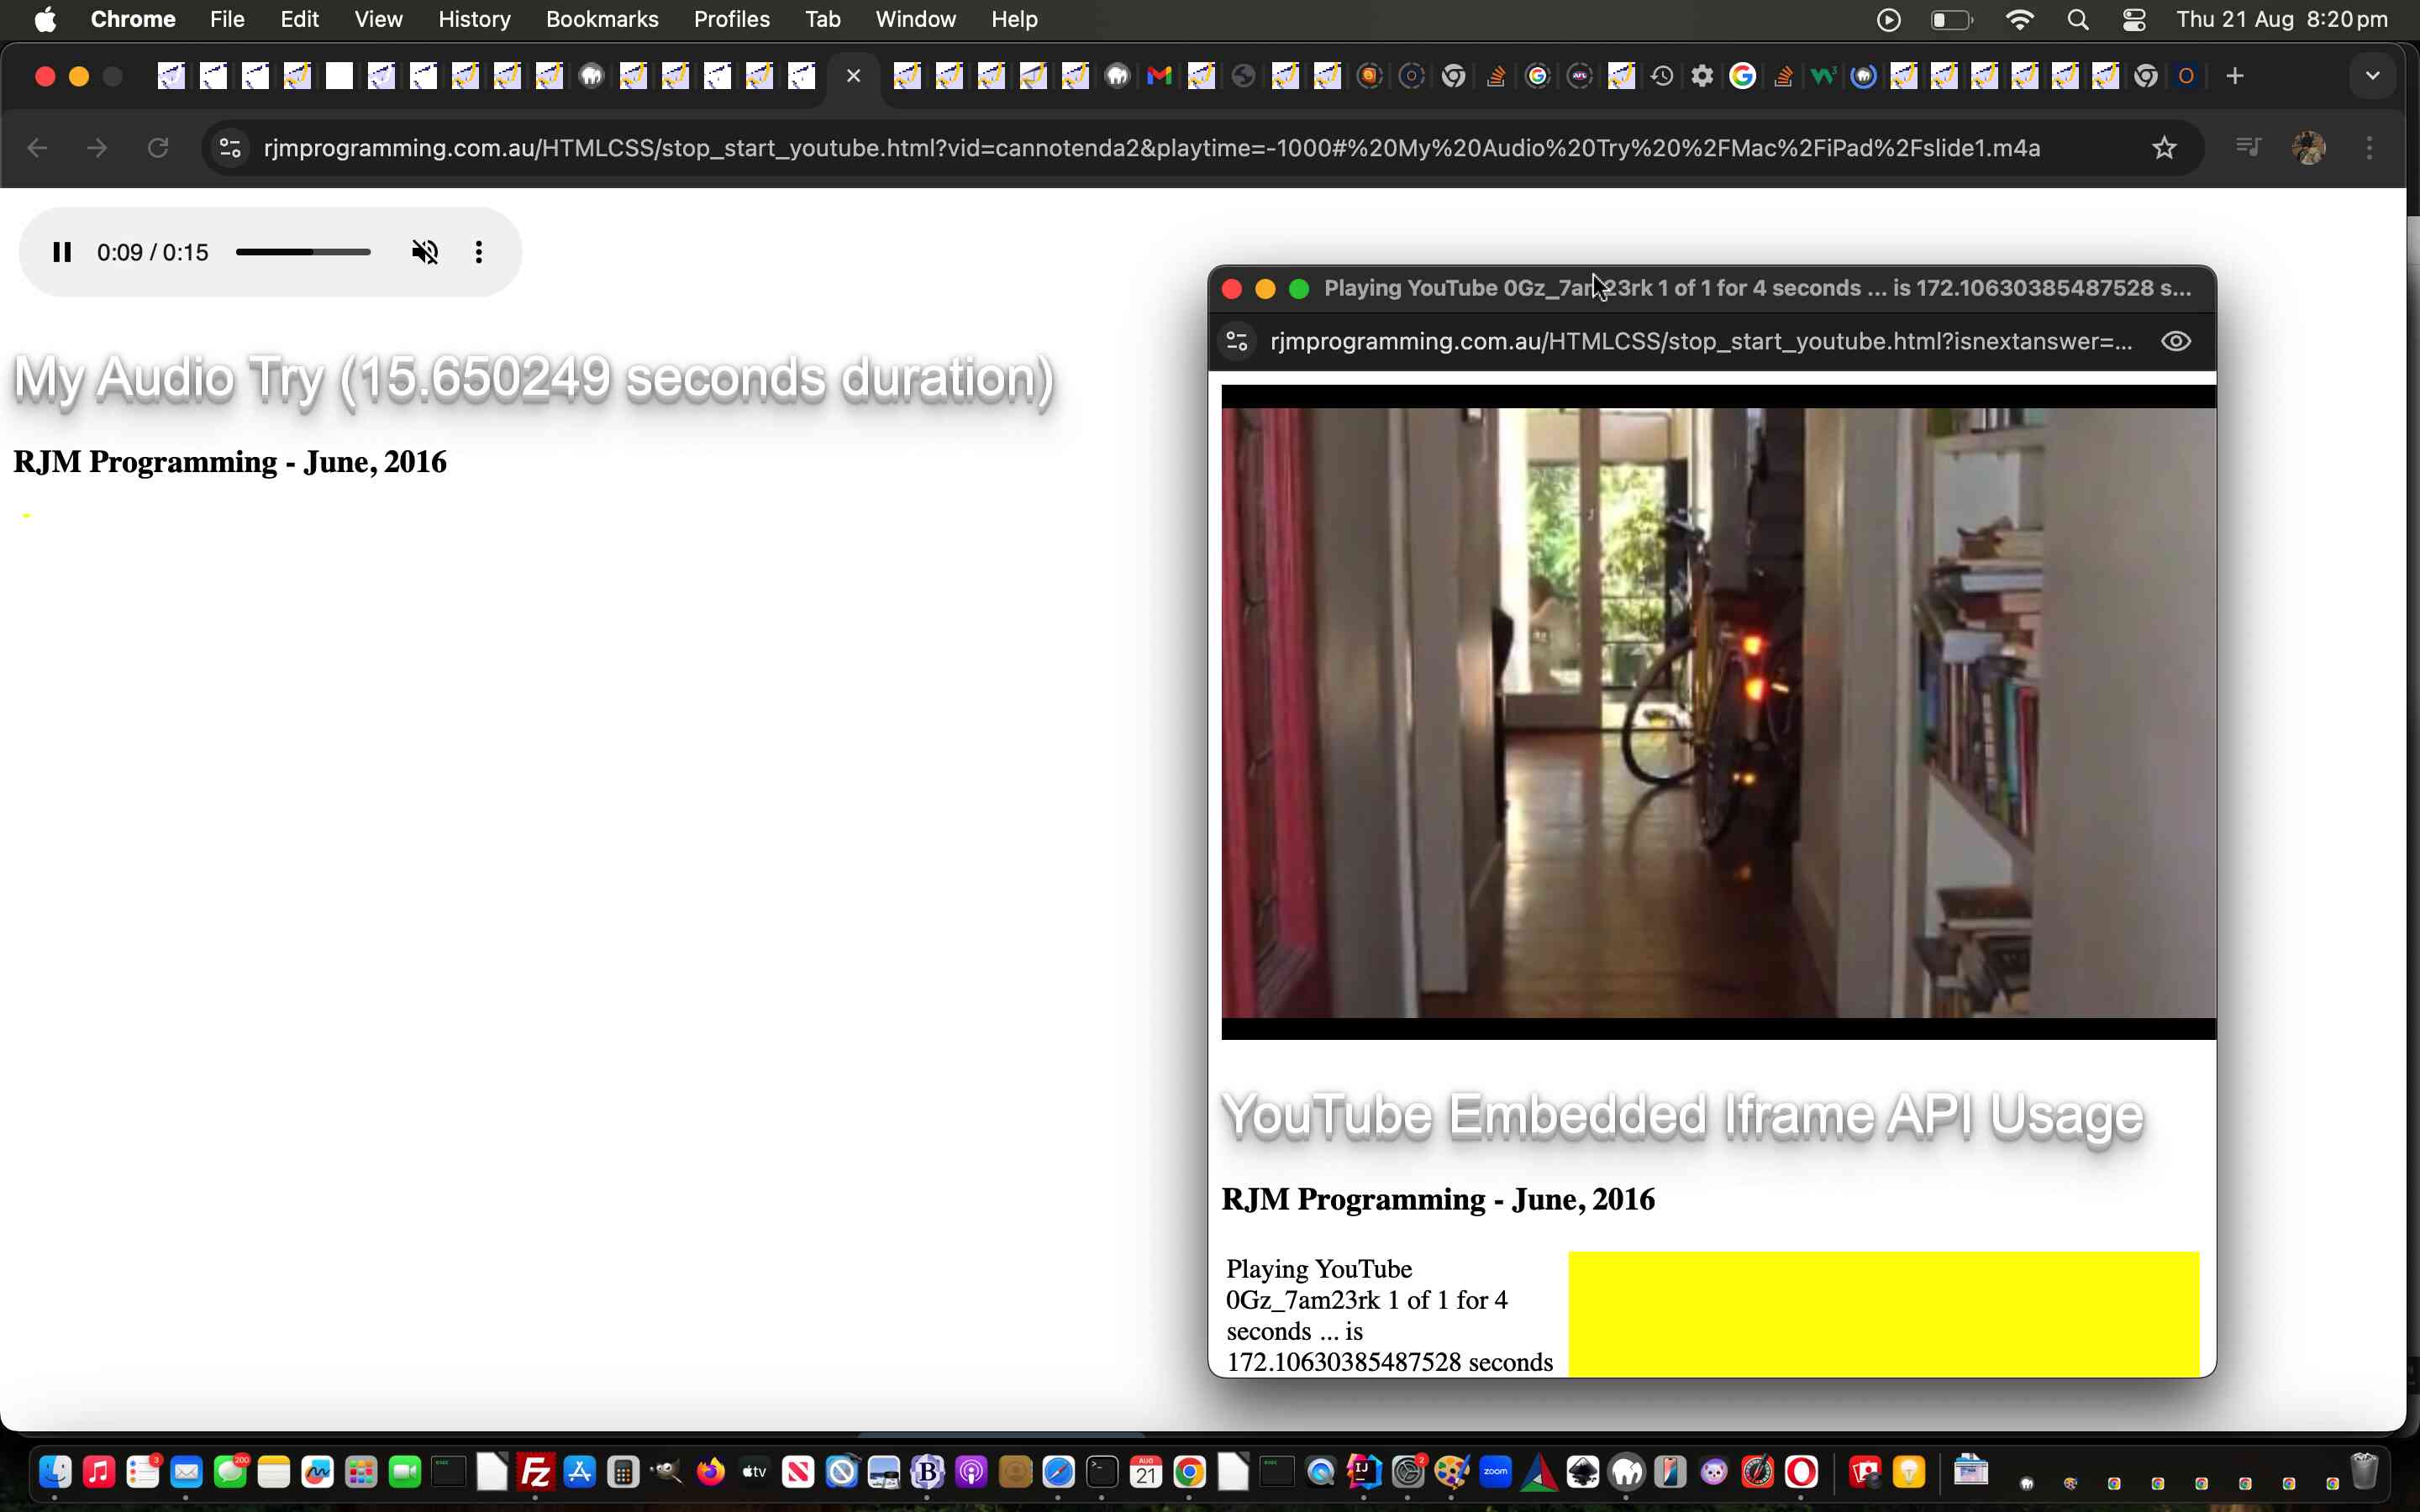
YouTube API Caller Other Media Interfacing Tutorial
Today’s work is the result of a “generic push” by us to improve on attempts in the past to use our inhouse YouTube video playing interfacing suite of web applications to mix …
- YouTube video media content … interspersed with …
- non YouTube media content
… when we presented Spliced Audio/Video YouTube Shuffle Tutorial blog posting thread. We better like this “generic push” idea of adapting our inhouse YouTube API interfacing web application to process both types of media input categories and be handled just within it’s remit, if there are non YouTube media items, within a (newly nesting) …
- table element … with …
- left hand cell handling YouTube video media content presented via YouTube API’s iframe element approach … and the …
- right hand cell handling non YouTube video media content presented via video or audio or img or iframe element depending on the data mimetype …
… and it is our inhouse YouTube API interfacing web application’s job to toggle between CSS display:none; and display:table-cell; for these two cells appropriately.
This work we see as a two part mini-project where …
- today’s phase 1 work isolates that inhouse YouTube API interfacing web application and asks it to handle new hashtag based data arguments coming in to demonstrate it, in that isolation, works both for the new paradigm and any previous scenarios … and then …
- after today we start phase 2 work interfacings, where we will rejoin the blog posting thread of yesterday’s Tabular Single Row Emoji Sharing Menu Tutorial and allow for the smarter inhouse YouTube API interfacing web application to be relatively seamless changing between YouTube and non YouTube media playing should a user enter a data URI, for example, in one of those textboxes to the right of the checkboxes
… for the modified stop_start_youtube.html YouTube API caller.
Here is a non YouTube video example …
… and here is a YouTube example …
… and here is a non YouTube audio example …
… and here is a non YouTube animated GIF example …
If this was interesting you may be interested in this too.
If this was interesting you may be interested in this too.
If this was interesting you may be interested in this too.
If this was interesting you may be interested in this too.
If this was interesting you may be interested in this too.
If this was interesting you may be interested in this too.
If this was interesting you may be interested in this too.
If this was interesting you may be interested in this too.
If this was interesting you may be interested in this too.
If this was interesting you may be interested in this too.
If this was interesting you may be interested in this too.
If this was interesting you may be interested in this too.
If this was interesting you may be interested in this too.
If this was interesting you may be interested in this too.
If this was interesting you may be interested in this too.
If this was interesting you may be interested in this too.
If this was interesting you may be interested in this too.
If this was interesting you may be interested in this too.
If this was interesting you may be interested in this too.
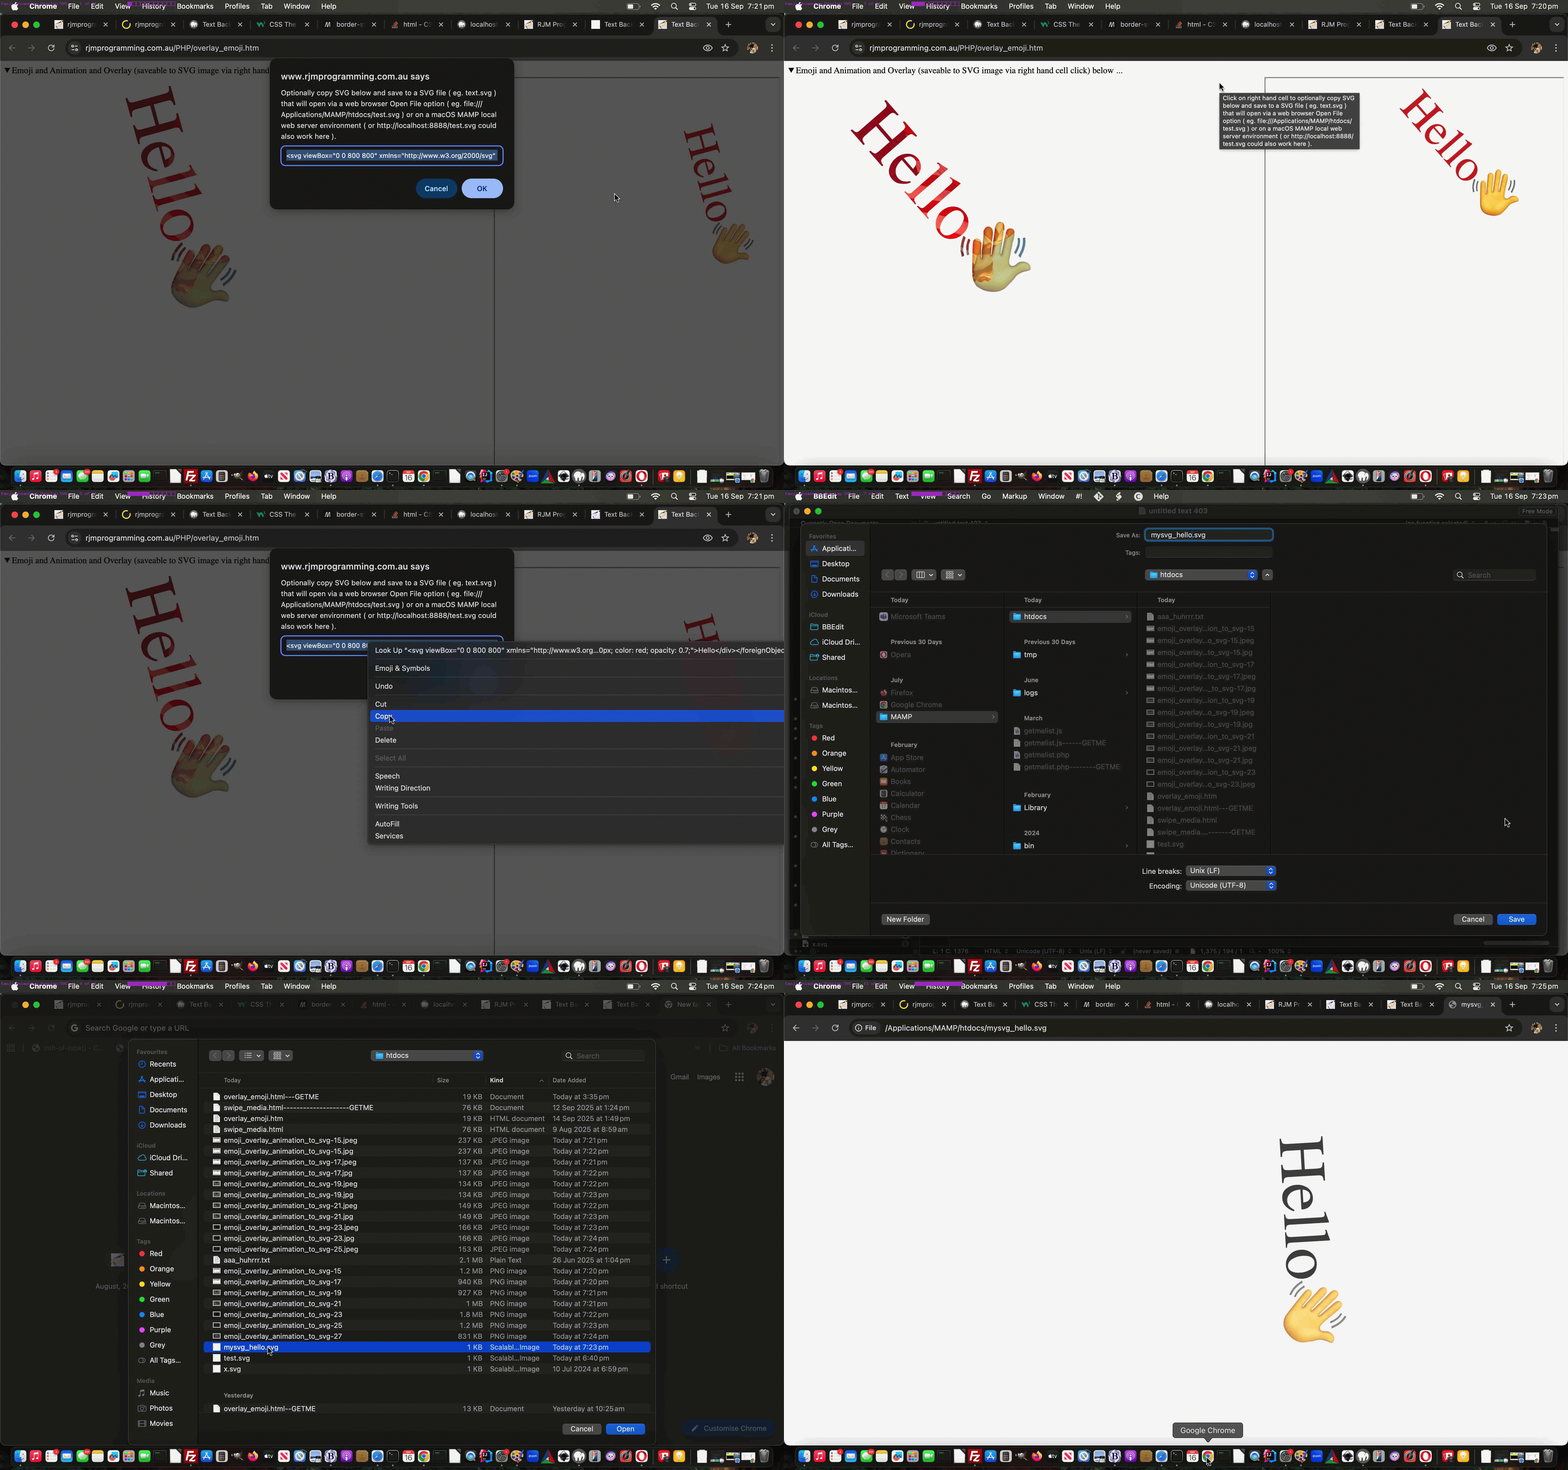


WordPress Blog Comments URL Right Click Popup Check Prevent Default Tutorial
WordPress Blog Comments URL Right Click Popup Check Prevent Default Tutorial
We’re coming back to the previous WordPress administrator Comment moderation section URL Popup Window Checker functionality last talked about with WordPress Blog Comments URL Right Click Popup Check Tutorial.
We were finding before this Javascript code fix …
<?php
	setTimeout(function(){

	  if (document.body.innerHTML.indexOf('Comments</h1>') != -1) {

	     var als=document.getElementsByTagName('a');

	     for (var ials=0; ials<als.length; ials++) {

	        if (('' + als[ials].href).indexOf('http') == 0 && ('' + als[ials].href).replace('wordpress.org','rjmprogramming.com.au').indexOf('rjmprogramming.com.au') == -1) {

	          als[ials].oncontextmenu=function(evt){  evt.stopPropagation();  evt.preventDefault(); if (woowoo) { if (!woowoo.closed) { !woowoo.close(); woowoo=null;  }  }  woowoo=window.open(evt.target.href, '_blank', 'left=' + eval(-480 + eval('' + screen.width)) + ',top=0,width=500,height=200'); setTimeout(function(){ woowoo.focus(); }, 500);  };

	          als[ials].ontouchend=function(evt){  evt.stopPropagation();  evt.preventDefault(); if (woowoo) { if (!woowoo.closed) { !woowoo.close(); woowoo=null;  }  }  woowoo=window.open(evt.target.href, '_blank', 'left=' + eval(-480 + eval('' + screen.width)) + ',top=0,width=500,height=200'); setTimeout(function(){ woowoo.focus(); }, 500);  };

	        }

	     }

	  }

	}, 6000);
?>
… in admin-header.php that popup windows were being created but immediately falling behind the main WordPress blog “admin” section Comments section webpage window, annoyingly. Our investigations tracked it down to the right click “default behaviour” forcing the popup window out of view.
The remedy being? Anyone, anyone?
.
.
.
.
No takers … how about a hint? … It starts with
.
.
.
.
p
.
.
.
… no takers … then with
.
.
.
.
r
.
.
.
… no takers … then with
.
.
.
.
e
.
.
.
… no takers … then with
.
.
.
.
v
.
.
.
… no takers … then with
.
.
.
.
e
.
.
.
.
… finally, yes Nicola … are you saying “Preve Fountain” …
.
.
.
Alas, no … and it’s not Spanish Steps or Pantheon or Colosseum or Trevi Fountain or Piazza Venezia or Saint Peter’s Square either, if that helps … Anyone else?
.
.
.
.
… yes, Audrey?
.
.
… you’re saying “The Mouth of Truth”?
.
.
… no, sorry, no doubt it was on the tip of your collective tongues, when we say it’s …
event.preventDefault();
… thank you, Sage … preventing that right click menu from appearing, and so not compromising window focus web browser rendering. We do very little WordPress administration on mobile, but just in case, we added an ontouchend event (usually happening at the finish of a gesture) mimicking of the non-mobile right click logic, for good measure.
Previous relevant WordPress Blog Comments URL Right Click Popup Check Tutorial is shown below.
WordPress Blog Comments URL Right Click Popup Check Tutorial
In the past we have only mildly changed the administration section of our TwentyTen themed WordPress.org blog (you are currently reading) here at RJM Programming, and some of that involved new WordPress plugins, as you can read a bit about with WordPress Blog Data URI in Post Plugin Tutorial.
We maintain that blog within an “admin” part of the WordPress blog, and any changes we’d put in a “des
sert island wish list” usually just absorb and move on, but we thought we’d improve on …WordPress comment moderation
… by allowing myself (well, thanks awfully, I don’t really know what to say) the chance to …
… because, even if we wanted to argue with the great Akismet (we use and are very happy with around here) calling it spam, one of the steps we’d want to investigate would be to rule out a potential “broken link”, and this is a way to check for that.
Now, what we discovered marrying “a wish” with “an action plan” was that …
… with our action plan moving to “deployment” via PHP (writes Javascript) admin-header.php modified code …
<?php
<script type="text/javascript">

	document.body.className = document.body.className.replace('no-js','js');


	setTimeout(function(){

	  if (document.body.innerHTML.indexOf('Comments</h1>') != -1) {

	     var als=document.getElementsByTagName('a');

	     for (var ials=0; ials<als.length; ials++) {

	        if (('' + als[ials].href).indexOf('http') == 0 && ('' + als[ials].href).replace('wordpress.org','rjmprogramming.com.au').indexOf('rjmprogramming.com.au') == -1) {

	          als[ials].oncontextmenu=function(evt){  window.open(evt.target.href, '_blank', 'left=' + eval(-500 + eval('' + screen.width)) + ',top=0,width=500,height=200');  };

	        }

	     }

	  }

	}, 6000);

</script>
?>
Pretty straightforward really, and perhaps of interest to some WordPress.org comment moderators out there!
Previous relevant WordPress Blog Data URI in Post Plugin Tutorial is shown below.
WordPress Blog Data URI in Post Plugin Tutorial
Today, we’ve got another WordPress plugin to suit the TwentyTen themed blog you are reading, adding onto those described at WordPress Blog Collaborative Annotated Email FormData Post Tutorial.
This plugin suits the Content Editor creating the posts in the administration end of the WordPress TwentyTen themed blog, when they desire to add a data URI, rather than an absolute URL or relative URL (which would probably involve an upload). To use data URIs will make your blog posts independent of web server file arrangements, but if you are looking for this to save (web server) diskspace, this might be a mute point. The diskspace could still be used up by the MySql database storing the data URI in its base64 encoding.
What does our PHP plugin call on to do its
thangthing?And so we have for you today rjmprogramming-data-uri-helper.php PHP source code that goes into this plugin should you want to write your own version for a theme that isn’t the WordPress TwentyTen theme (looking for those TwentyTen “id”s and “className”s as changepoints), and/or view us using it with today’s animated GIF presentation.
Previous relevant WordPress Blog Collaborative Annotated Email FormData Post Tutorial is shown below.
WordPress Blog Collaborative Annotated Email FormData Post Tutorial
Yesterday’s WordPress Blog Collaborative Annotated Email User Experience Tutorial helped with practicalities regarding user experience with this WordPress Blog highlighting of text accumulated into the body (as HTML attachment) and subject (as text) of an Annotated Email form of collaborative communication.
The “subject” extension here makes it all the more important to try to look out for long email URLs that will exceed the web server limit here. When too long, that …
… and today we do not write out any discrete HTML form element to do this (when required), but instead resort to the wonderfully powerful combination of …
… to be used by the new dynamic thinking Javascript function as below …
function iftoolongpost(prefixu, restsub, restu) {

  var prefixrest=prefixu.replace('&body=', encodeURIComponent(restsub) + '&body=') + restu;

  if ((prefixrest).length > 900) {

  // dynamic form

  var xhr = new XMLHttpRequest();

  var form=new FormData();

  form.append('to', decodeURIComponent(prefixrest.split('to=')[1].split('&')[0]));

  form.append('subject', decodeURIComponent(prefixrest.split('subject=')[1].split('&')[0]));

  form.append('body',  decodeURIComponent(prefixrest.split('body=')[1].split('&')[0]));

  xhr.open('post', '//www.rjmprogramming.com.au/HTMLCSS/emailhtml.php', true);

  xhr.send(form);

  // end of dynamic form

  location.href='#hfloater';

  } else {

  document.getElementById('aeciframe').src=prefixrest;

  }

}
… called in that different calling arrangement as per …
document.getElementById('hfloater').innerHTML+='<b>Annotated Email <a class="hlclass" style="inline-block;cursor:pointer;text-decoration:none;" onclick="iftoolongpost(this.title, encodeURIComponent((this.innerText || this.contentWindow || this.contentDocument)), encodeURIComponent(this.innerHTML.substring(this.innerHTML.indexOf(String.fromCharCode(60)))));" data-href="//www.rjmprogramming.com.au/HTMLCSS/emailhtml.php?to=&subject=Re%3a%20' + encodeURIComponent(document.title.split('|')[0]) + '%20%28' + encodeURIComponent(document.URL) + '%29%0a&body=" title="//www.rjmprogramming.com.au/HTMLCSS/emailhtml.php?to=&subject=Re%3a%20' + encodeURIComponent(document.title.split('|')[0]) + '%20%28%20' + encodeURIComponent(document.URL) + '%20%29%0a&body=" target=aeciframe onmouseover="this.title=emaileeis(this.title);" ontouchstart="this.title=emaileeis(this.title);" id=b_hfloater_annotated_email>' + aec + '</a></b><iframe id=aeciframe name=aeciframe style=display:none; src=#></iframe><br>';
… featuring in changed PHP rjmprogramming-multi-lookup.php plugin and/or changed TwentyTen theme header.php file.
Previous relevant WordPress Blog Collaborative Annotated Email User Experience Tutorial is shown below.
WordPress Blog Collaborative Annotated Email User Experience Tutorial
Did you try yesterday’s WordPress Blog Collaborative Annotated Email Tutorial highlighting of text Annotated Email functionality? If you did, you might have found a “hair trigger” timed user experience. You had a very small amount of time to decide on any amendments “by hand” to your email.
On this, did you notice how we relied on a Javascript prompt window to garner an email address off the user? There is method in this “kludginess”. We wanted the highlighting not to be destroyed by a change of focus. The downside though, is that the whole time you spend answering contributes to any setTimeout based timing we have going before we automatically make the highlighting functionality menu disappear. Today, we control that, waiting an extra 10 seconds or so after that for the user to start entering their own Annotated Email content, should they wish, and the HTML div contenteditable=true is reminded by a new onchange replenishment of the delay that the user is still writing … a bit like with SMSes and those blinking dots telling you the other SMSer is writing something (but not as cute here, looks wise, alas).
Again, into the WordPress (changed PHP rjmprogramming-multi-lookup.php) plugin or header.php the changed (header.php) code involves new Javascript (that dynamically creates HTML) as per …
var mpn='', eod='', aec='', withindiv=0;


function emaileeis(inideais) {

  var presm='', postsm='';

  if (inideais.indexOf(':') != -1) {

    presm=inideais.split(':')[0] + ':';

    postsm=inideais.replace(presm,'');

  } else if (inideais.indexOf('?to=') != -1) {

    presm=inideais.split('?to=')[0] + '?to=';

    if (inideais.indexOf('&') != -1) {

    postsm=inideais.replace(presm,'').replace(inideais.split('?to=')[1].split('&')[0],'');

    }

  } else if (inideais.indexOf('&') != -1) {

    presm=inideais.split('&')[0] + '&';

    postsm=inideais.replace(presm,'');

  } else {

    presm=inideais.split('?')[0];

    postsm=inideais.replace(presm,'');

  }

  if (eod == '') {

    if (inideais.indexOf('?to=') != -1) {

      eod=inideais.split('?to=')[1].split('&')[0];

    }

    var pwithindiv=withindiv;

    withindiv=9000;

    eod=prompt('Enter email address', eod);

    if (pwithindiv == 0) {

    withindiv=0.9999;

    } else {

    withindiv=pwithindiv;

    }

    if (eod == null) {

      eod='';

    }

  }

  return presm + encodeURIComponent(eod) + postsm;

}


function smsee(inideais) {

  var presm='', postsm='';

  if (inideais.indexOf(':') != -1) {

    presm=inideais.split(':')[0] + ':';

  }

  if (inideais.indexOf('&') != -1) {

    postsm='&' + inideais.split('&')[1];

  }

  if (mpn == '') {

    if (inideais.indexOf(':') != -1) {

      mpn=inideais.split(':')[1].split('&')[0];

    }

    var pwithindiv=withindiv;

    withindiv=9000;

    mpn=prompt('Enter phone number for SMS (or Cancel to do it at the Messager app', mpn);

    if (pwithindiv == 0) {

    withindiv=0.9999;

    } else {

    withindiv=pwithindiv;

    }

    if (mpn == null) {

      mpn='';

    }

  }

  return presm + mpn + postsm;

}


function lookforhighlight() {

  var usualdelay=2000, oRange=null, oRect=null, s_top='0px', s_left='5px', opis='', fourhundred=300, isfx='0', otit='';

  if (hight == ' ') {

    setTimeout(lfhlater, 5000);

    hight='';

    xcbackc=cookieHHVal('linktoothers');

    if (xcbackc != '') {

      oharr=xcbackc.split('|');

    }

  }

  if (('' + withindiv).indexOf('.') != -1) {

    setTimeout(lookforhighlight, eval(('' + withindiv).split('.')[1]));

    withindiv=eval(('' + withindiv).split('.')[0]);

    return;

  } else if (withindiv != 0) {

    setTimeout(lookforhighlight, withindiv);

    return;

  } else {

    setTimeout(lookforhighlight, usualdelay);

  }

  var xsel=window.getSelection().toString();

  if (xsel.length == 0) {

    try {

    xsel=document.selection.createRange().htmlText;

    xsel=xsel.replace(String.fromCharCode(10),' ').replace(String.fromCharCode(10),' ').replace(String.fromCharCode(10),' ').replace(String.fromCharCode(10),' ');

    xsel=xsel.replace(String.fromCharCode(13),' ').replace(String.fromCharCode(13),' ').replace(String.fromCharCode(13),' ').replace(String.fromCharCode(13),' ');

    } catch(ertw) {

    xsel='';

    }

  } else {

    xsel=xsel.replace(String.fromCharCode(10),' ').replace(String.fromCharCode(10),' ').replace(String.fromCharCode(10),' ').replace(String.fromCharCode(10),' ');

    xsel=xsel.replace(String.fromCharCode(13),' ').replace(String.fromCharCode(13),' ').replace(String.fromCharCode(13),' ').replace(String.fromCharCode(13),' ');

    if (xsel != hight && xsel != '') {

     oRange = window.getSelection().getRangeAt(0); //get the text range

     oRect = oRange.getBoundingClientRect();

     s_top = ('' + oRect.top).replace('px','') + 'px';

     s_left = ('' + oRect.left).replace('px','') + 'px';

     if (s_top != '0px') {

        fourhundred=eval('' + s_top.replace('px',''));

        s_top='0px';

        var dse='', dde='';

        if (document.scrollingElement) {

          if (document.scrollingElement.scrollTop) {

            dse=('' + document.scrollingElement.scrollTop);

          }

        }

        if (document.documentElement) {

          if (document.documentElement.scrollTop) {

            dde=('' + document.documentElement.scrollTop);

          }

        }

        if (dse != '') {

          fourhundred+=eval('' + dse.replace('px',''));

          isfx='0';

        } else if (dde != '') {

          fourhundred+=eval('' + dde.replace('px',''));

          isfx='0';

        } else if (('' + window.scrollY) != '') {

          fourhundred+=eval('' + ('' + window.scrollY).replace('px',''));

          isfx='0';

        } else if (('' + window.pageYOffset) != '') {

          fourhundred+=eval('' + ('' + window.pageYOffset).replace('px',''));

          isfx='0';

        } else {

          isfx=('' + document.body.scrollTop).replace('px','');

          if (isfx.replace('0','') == '') {

            isfx=('' + document.scrollingElement.scrollTop).replace('px','');

            if (isfx.replace('0','') == '') {

               isfx=('' + window.scrollY).replace('px','');

               if (isfx.replace('0','') == '') {

                  isfx=('' + window.pageYOffset).replace('px','');

               }

            }

          }

        }

        fourhundred+=100;

     }

    }

  }

  if (xsel != hight && xsel != '') {

    hight=xsel;

    if (s_top == '0px') { s_top = ('' + eval(fourhundred + eval('' + isfx))) + 'px'; }

    if (aec == '') {

          aec=' 📧 <div id=daec contenteditable=true onblur="withindiv=0;" onchange="withindiv=9000;" onclick="withindiv=9000; event.stopPropagation();">  </div>';

    } else if (document.getElementById('daec') && document.getElementById('b_hfloater_annotated_email')) {

          aec=document.getElementById('b_hfloater_annotated_email').innerHTML;

    }

    if (aec.indexOf('<mark>' + hight + '</mark>') == -1) {

          if (('              ' + aec).slice(-14).substring(0,1).replace('?','.').replace('!','.') == '.') {

           aec=aec.replace('</div>', '   <mark>' + hight + '</mark></div>');

          } else {

           aec=aec.replace('</div>', ' <mark>' + hight + '</mark></div>');

          }

    }

    if (document.getElementById('hfloater')) {

      if (document.getElementById('hfloater').innerHTML == '') {

        document.getElementById('hfloater').style.position='absolute';

        document.getElementById('hfloater').style.top=s_top;

        document.getElementById('hfloater').style.left=s_left;

        document.getElementById('hfloater').style.zIndex='87';

        document.getElementById('hfloater').style.backgroundColor='rgba(255,165,0,0.9)';

        document.getElementById('hfloater').style.border='1px solid purple';

        document.getElementById('hfloater').style.padding='2px 2px 2px 2px';

        document.getElementById('hfloater').style.display='block';

        document.getElementById('hfloater').innerHTML='<b>Wikipedia <a class="hlclass" style="inline-block;" href="//wikipedia.org/wiki/Main_Page" title="//wikipedia.org/wiki/" target=_blank onmouseover="this.href=this.title + hight.replace(/\ /g,' + "'_'" + ');" ontouchstart="this.href=this.title + hight.replace(/\ /g,' + "'_'" + ');" id=b_hfloater_wikipedia>' + hight + '</a></b><br>';

        document.getElementById('hfloater').innerHTML+='<b>Google Translate <a class="hlclass" style="inline-block;" href="//translate.google.com" title="//translate.google.com/#view=home&op=translate&sl=auto&tl=en&text=" target=_blank onmouseover="this.href=this.title + encodeURIComponent(hight);" ontouchstart="this.href=this.title + encodeURIComponent(hight);" id=b_hfloater_google_translate>' + hight + '</a></b><br>';

        document.getElementById('hfloater').innerHTML+='<b>Free Dictionary <a class="hlclass" style="inline-block;" href="//www.thefreedictionary.com/" title="//www.thefreedictionary.com/" target=_blank onmouseover="this.href=this.title + hight.replace(/\ /g,' + "'+'" + ');" ontouchstart="this.href=this.title + hight.replace(/\ /g,' + "'+'" + ');" id=b_hfloater_free_dictionary>' + hight + '</a></b><br>';

        document.getElementById('hfloater').innerHTML+='<b>Google Search <a class="hlclass" style="inline-block;" href="//www.google.com/" title="//www.google.com/search?q=" target=_blank onmouseover="this.href=this.title + hight.replace(/\ /g,' + "'+'" + ');" ontouchstart="this.href=this.title + hight.replace(/\ /g,' + "'+'" + ');" id=b_hfloater_google_search>' + hight + '</a></b><br>';

        document.getElementById('hfloater').innerHTML+='<b>Tag Search <a class="hlclass" style="inline-block;" href="//www.rjmprogramming.com.au/ITblog/" title="//www.rjmprogramming.com.au/ITblog/tag/" target=_blank onmouseover="this.href=this.title + hight.replace(/\ /g,' + "'-'" + ');" ontouchstart="this.href=this.title + hight.replace(/\ /g,' + "'-'" + ');" id=b_hfloater_tag_search>' + hight + '</a></b><br>';

        document.getElementById('hfloater').innerHTML+='<b>Category Search <a class="hlclass" style="inline-block;" href="//www.rjmprogramming.com.au/ITblog/" title="//www.rjmprogramming.com.au/ITblog/category/" target=_blank onmouseover="this.href=this.title + hight.replace(/\ /g,' + "'-'" + ');" ontouchstart="this.href=this.title + hight.replace(/\ /g,' + "'-'" + ');" id=b_hfloater_category_search>' + hight + '</a></b><br>';

        document.getElementById('hfloater').innerHTML+='<b>Tag First Word Search <a class="hlclass" style="inline-block;" href="//www.rjmprogramming.com.au/ITblog/" title="//www.rjmprogramming.com.au/ITblog/tag/" target=_blank onmouseover="this.href=this.title + hight.replace(/\ /g,' + "'-'" + ').replace(' + "'-','/?wopenall='" + ');" ontouchstart="this.href=this.title + hight.replace(/\ /g,' + "'-'" + ').replace(' + "'-','/?wopenall='" + ');" id=b_hfloater_tag_first_word_search>' + hight + '</a></b><br>';

        document.getElementById('hfloater').innerHTML+='<b>Posting Title Search <a class="hlclass" style="inline-block;" href="//www.rjmprogramming.com.au/itblog/match/mapper.php" title="//www.rjmprogramming.com.au/itblog/match/mapper.php?pm=" target=_blank onmouseover="this.href=this.title + encodeURIComponent(hight);" ontouchstart="this.href=this.title + encodeURIComponent(hight);" id=b_hfloater_posting_title_search>' + hight + '</a></b><br>';


        document.getElementById('hfloater').innerHTML+='<b>Email <a class="hlclass" style="inline-block;" href="mailto:?subject=Re%3a%20' + encodeURIComponent(thetwords) + '%20%28' + encodeURIComponent(document.URL) + '%29&body=" title="mailto:?subject=Re%3a%20' + encodeURIComponent(thetwords) + '%20%28%20' + encodeURIComponent(document.URL) + '%20%29&body=" target=_blank onmouseover="this.href=emaileeis(this.title) + encodeURIComponent(hight);" ontouchstart="this.href=emaileeis(this.title) + encodeURIComponent(hight);" id=b_hfloater_email>' + hight + '</a></b><br>';

        document.getElementById('hfloater').innerHTML+='<b>Annotated Email <a class="hlclass" style="inline-block;" href="//www.rjmprogramming.com.au/HTMLCSS/emailhtml.php?to=&subject=Re%3a%20' + encodeURIComponent(thetwords) + '%20%28' + encodeURIComponent(document.URL) + '%29%0a&body=" title="//www.rjmprogramming.com.au/HTMLCSS/emailhtml.php?to=&subject=Re%3a%20' + encodeURIComponent(thetwords) + '%20%28%20' + encodeURIComponent(document.URL) + '%20%29%0a&body=" target=aeciframe onmouseover="this.href=emaileeis(this.title).replace(this.title.slice(-6), encodeURIComponent((this.innerText || this.contentWindow || this.contentDocument)) + this.title.slice(-6)) + encodeURIComponent(this.innerHTML.substring(this.innerHTML.indexOf(String.fromCharCode(60))));" ontouchstart="this.href=emaileeis(this.title).replace(this.title.slice(-6), encodeURIComponent((this.innerText || this.contentWindow || this.contentDocument)) + this.title.slice(-6)) + encodeURIComponent(this.innerHTML.substring(this.innerHTML.indexOf(String.fromCharCode(60))));" id=b_hfloater_annotated_email>' + aec + '</a></b><iframe name=aeciframe style=display:none; src=#></iframe><br>';

        document.getElementById('hfloater').innerHTML+='<b>SMS <a class="hlclass" style="inline-block;" href="sms:&body=" title="sms:&body=" target=_blank onmouseover="this.href=smsee(this.title) + encodeURIComponent(hight);" ontouchstart="this.href=smsee(this.title) + encodeURIComponent(hight);" id=b_hfloater_sms>' + hight + '</a></b><br>';


        document.getElementById('hfloater').innerHTML+='<b>Navigate to Link About <a class="hlclass" style="inline-block;text-decoration:underline;cursor:pointer;" title=" " onclick="thisasearch(this.innerHTML,this);" onmouseover="thisasearch(this.innerHTML,this);" ontouchstart="thisasearch(this.innerHTML,this);" id=b_hfloater_posting_a_search>' + hight + '</a></b><br>';

        document.getElementById('hfloater').innerHTML+='<b>Display/Copy Link About <a class="hlclass" style="inline-block;text-decoration:underline;cursor:pointer;" title=" " onclick="thisacopysearch(this.innerHTML,this);" onmouseover="thisacopysearch(this.innerHTML,this);" ontouchstart="thisacopysearch(this.innerHTML,this);" id=b_hfloater_posting_a_copy_search>' + hight + '</a></b><br>';

        if (oharr.length >= 1) {

         for (var ioharr=0; ioharr<oharr.length; ioharr++) {

          otit='Other Link ' + eval(1 + ioharr);

          if (oharr[ioharr].indexOf('#') != -1) {

            otit=oharr[ioharr].split('#')[1].trim();

          }

          if (oharr[ioharr].split('#')[1].indexOf('  ') == 0) {

            opis=hight.replace(/\ /g,' + \"'-'\" + ');

            document.getElementById('hfloater').innerHTML+='<b>' + otit + ' <a style=\"inline-block;\" href=\"' + oharr[ioharr].split('#')[0].trim() + '\" title=\"' + oharr[ioharr].split('#')[0].trim() + '\" target=_blank onmouseover=\"this.href=this.title + hhopis(String.fromCharCode(45));\" ontouchstart=\"this.href=this.title + hhopis(String.fromCharCode(45));\" id=b_hfloater_' + xcookcnt + '>' + hight + '</a></b><br>';

          } else if (oharr[ioharr].split('#')[1].indexOf(' ') == 0) {

            opis=hight.replace(/\ /g,' + \"'+'\" + ');

            document.getElementById('hfloater').innerHTML+='<b>' + otit + ' <a style=\"inline-block;\" href=\"' + oharr[ioharr].split('#')[0].trim() + '\" title=\"' + oharr[ioharr].split('#')[0].trim() + '\" target=_blank onmouseover=\"this.href=this.title + hhopis(String.fromCharCode(43));\" ontouchstart=\"this.href=this.title + hhopis(String.fromCharCode(43));\" id=b_hfloater_' + xcookcnt + '>' + hight + '</a></b><br>';

          } else {

            document.getElementById('hfloater').innerHTML+='<b>' + otit + ' <a style=\"inline-block;\" href=\"' + oharr[ioharr].split('#')[0].trim() + '\" title=\"' + oharr[ioharr].split('#')[0].trim() + '\" target=_blank onmouseover=\"this.href=this.title + encodeURIComponent(hight);\" ontouchstart=\"this.href=this.title + encodeURIComponent(hight);\" id=b_hfloater_' + xcookcnt + '>' + hight + '</a></b><br>';

          }

          xcookcnt++;

         }

        }

        document.getElementById('hfloater').innerHTML+='<b><input title=\"Add your own into HTTP Cookies\" type=button onclick=cookiePutHHVal(xcookblank); value=+></input> <input title=\"Remove all HTTP Cookie URLs\" type=button onclick=cookiePutHHVal(xcookblank.trim()); value=-></input></b><br>';

      } else {

        document.getElementById('b_hfloater_wikipedia').innerHTML=hight;

        document.getElementById('b_hfloater_google_translate').innerHTML=hight;

        document.getElementById('b_hfloater_free_dictionary').innerHTML=hight;

        document.getElementById('b_hfloater_google_search').innerHTML=hight;

        document.getElementById('b_hfloater_tag_search').innerHTML=hight;

        document.getElementById('b_hfloater_category_search').innerHTML=hight;

        document.getElementById('b_hfloater_tag_first_word_search').innerHTML=hight;

        document.getElementById('b_hfloater_posting_title_search').innerHTML=hight;


        document.getElementById('b_hfloater_email').innerHTML=hight;

        document.getElementById('b_hfloater_annotated_email').innerHTML=aec;

        document.getElementById('b_hfloater_sms').innerHTML=hight;


        document.getElementById('b_hfloater_posting_a_search').innerHTML=hight;

        document.getElementById('b_hfloater_posting_a_copy_search').innerHTML=hight;


        if (xcookcnt > 0) {

          for (var icook=0; icook<xcookcnt; icook++) {

            document.getElementById('b_hfloater_' + icook).innerHTML=hight;

          }

        }

        document.getElementById('hfloater').style.top=s_top;

        document.getElementById('hfloater').style.left=s_left;

        document.getElementById('hfloater').style.display='block';

      }

    }

  } else if (xsel == '') {

    if (document.getElementById('hfloater')) {

      document.getElementById('hfloater').style.display='none';

    }

    hight='';

  }

}
Some email clients baulk at downloading HTML attachments, so the other change today is to append the wording of the email’s inherent HTML to the email subject, so if an emailee is unlucky in this way, they can still get “second prize” … but no cigar!
Previous relevant WordPress Blog Collaborative Annotated Email Tutorial is shown below.
WordPress Blog Collaborative Annotated Email Tutorial
Further to WordPress Plugin Primer Tutorial of recent times, we’re adding to that “highlighting of blog text” (dynamic menu) the options …
… and we think the last of these has good scope for collaborative thoughts and usages. Want to try it out? You’re here, ready. Just highlight some text to get started.
Into the WordPress (changed PHP rjmprogramming-multi-lookup.php) plugin or header.php the changed (header.php) code involves new Javascript (that dynamically creates HTML) as per …
var mpn='', eod='', aec='', withindiv=false;


function emaileeis(inideais) {

  var presm='', postsm='';

  if (inideais.indexOf(':') != -1) {

    presm=inideais.split(':')[0] + ':';

    postsm=inideais.replace(presm,'');

  } else if (inideais.indexOf('?to=') != -1) {

    presm=inideais.split('?to=')[0] + '?to=';

    if (inideais.indexOf('&') != -1) {

    postsm=inideais.replace(presm,'').replace(inideais.split('?to=')[1].split('&')[0],'');

    }

  } else if (inideais.indexOf('&') != -1) {

    presm=inideais.split('&')[0] + '&';

    postsm=inideais.replace(presm,'');

  } else {

    presm=inideais.split('?')[0];

    postsm=inideais.replace(presm,'');

  }

  if (eod == '') {

    if (inideais.indexOf('?to=') != -1) {

      eod=inideais.split('?to=')[1].split('&')[0];

    }

    eod=prompt('Enter email address', eod);

    if (eod == null) {

      eod='';

    }

  }

  return presm + encodeURIComponent(eod) + postsm;

}


function smsee(inideais) {

  var presm='', postsm='';

  if (inideais.indexOf(':') != -1) {

    presm=inideais.split(':')[0] + ':';

  }

  if (inideais.indexOf('&') != -1) {

    postsm='&' + inideais.split('&')[1];

  }

  if (mpn == '') {

    if (inideais.indexOf(':') != -1) {

      mpn=inideais.split(':')[1].split('&')[0];

    }

    mpn=prompt('Enter phone number for SMS (or Cancel to do it at the Messager app', mpn);

    if (mpn == null) {

      mpn='';

    }

  }

  return presm + mpn + postsm;

}


function lookforhighlight() {

  var usualdelay=2000, oRange=null, oRect=null, s_top='0px', s_left='5px', opis='', fourhundred=300, isfx='0', otit='';

  if (hight == ' ') {

    setTimeout(lfhlater, 5000);

    hight='';

    xcbackc=cookieHHVal('linktoothers');

    if (xcbackc != '') {

      oharr=xcbackc.split('|');

    }

  }

  setTimeout(lookforhighlight, usualdelay);

  if (withindiv) { return;  }

  var xsel=window.getSelection().toString();

  if (xsel.length == 0) {

    try {

    xsel=document.selection.createRange().htmlText;

    xsel=xsel.replace(String.fromCharCode(10),' ').replace(String.fromCharCode(10),' ').replace(String.fromCharCode(10),' ').replace(String.fromCharCode(10),' ');

    xsel=xsel.replace(String.fromCharCode(13),' ').replace(String.fromCharCode(13),' ').replace(String.fromCharCode(13),' ').replace(String.fromCharCode(13),' ');

    } catch(ertw) {

    xsel='';

    }

  } else {

    xsel=xsel.replace(String.fromCharCode(10),' ').replace(String.fromCharCode(10),' ').replace(String.fromCharCode(10),' ').replace(String.fromCharCode(10),' ');

    xsel=xsel.replace(String.fromCharCode(13),' ').replace(String.fromCharCode(13),' ').replace(String.fromCharCode(13),' ').replace(String.fromCharCode(13),' ');

    if (xsel != hight && xsel != '') {

     oRange = window.getSelection().getRangeAt(0); //get the text range

     oRect = oRange.getBoundingClientRect();

     s_top = ('' + oRect.top).replace('px','') + 'px';

     s_left = ('' + oRect.left).replace('px','') + 'px';

     if (s_top != '0px') {

        fourhundred=eval('' + s_top.replace('px',''));

        s_top='0px';

        var dse='', dde='';

        if (document.scrollingElement) {

          if (document.scrollingElement.scrollTop) {

            dse=('' + document.scrollingElement.scrollTop);

          }

        }

        if (document.documentElement) {

          if (document.documentElement.scrollTop) {

            dde=('' + document.documentElement.scrollTop);

          }

        }

        if (dse != '') {

          fourhundred+=eval('' + dse.replace('px',''));

          isfx='0';

        } else if (dde != '') {

          fourhundred+=eval('' + dde.replace('px',''));

          isfx='0';

        } else if (('' + window.scrollY) != '') {

          fourhundred+=eval('' + ('' + window.scrollY).replace('px',''));

          isfx='0';

        } else if (('' + window.pageYOffset) != '') {

          fourhundred+=eval('' + ('' + window.pageYOffset).replace('px',''));

          isfx='0';

        } else {

          isfx=('' + document.body.scrollTop).replace('px','');

          if (isfx.replace('0','') == '') {

            isfx=('' + document.scrollingElement.scrollTop).replace('px','');

            if (isfx.replace('0','') == '') {

               isfx=('' + window.scrollY).replace('px','');

               if (isfx.replace('0','') == '') {

                  isfx=('' + window.pageYOffset).replace('px','');

               }

            }

          }

        }

        fourhundred+=100;

     }

    }

  }

  if (xsel != hight && xsel != '') {

    hight=xsel;

    if (s_top == '0px') { s_top = ('' + eval(fourhundred + eval('' + isfx))) + 'px'; }

    if (aec == '') {

          aec=' 📧 <div id=daec contenteditable=true onblur="withindiv=false;" onclick="withindiv=true; event.stopPropagation();">  </div>';

    } else if (document.getElementById('daec') && document.getElementById('b_hfloater_annotated_email')) {

          aec=document.getElementById('b_hfloater_annotated_email').innerHTML;

    }

    if (aec.indexOf('<mark>' + hight + '</mark>') == -1) {

          if (('              ' + aec).slice(-14).substring(0,1).replace('?','.').replace('!','.') == '.') {

           aec=aec.replace('</div>', '   <mark>' + hight + '</mark></div>');

          } else {

           aec=aec.replace('</div>', ' <mark>' + hight + '</mark></div>');

          }

    }

    if (document.getElementById('hfloater')) {

      if (document.getElementById('hfloater').innerHTML == '') {

        document.getElementById('hfloater').style.position='absolute';

        document.getElementById('hfloater').style.top=s_top;

        document.getElementById('hfloater').style.left=s_left;

        document.getElementById('hfloater').style.zIndex='87';

        document.getElementById('hfloater').style.backgroundColor='rgba(255,165,0,0.9)';

        document.getElementById('hfloater').style.border='1px solid purple';

        document.getElementById('hfloater').style.padding='2px 2px 2px 2px';

        document.getElementById('hfloater').style.display='block';

        document.getElementById('hfloater').innerHTML='<b>Wikipedia <a class="hlclass" style="inline-block;" href="//wikipedia.org/wiki/Main_Page" title="//wikipedia.org/wiki/" target=_blank onmouseover="this.href=this.title + hight.replace(/\ /g,' + "'_'" + ');" ontouchstart="this.href=this.title + hight.replace(/\ /g,' + "'_'" + ');" id=b_hfloater_wikipedia>' + hight + '</a></b><br>';

        document.getElementById('hfloater').innerHTML+='<b>Google Translate <a class="hlclass" style="inline-block;" href="//translate.google.com" title="//translate.google.com/#view=home&op=translate&sl=auto&tl=en&text=" target=_blank onmouseover="this.href=this.title + encodeURIComponent(hight);" ontouchstart="this.href=this.title + encodeURIComponent(hight);" id=b_hfloater_google_translate>' + hight + '</a></b><br>';

        document.getElementById('hfloater').innerHTML+='<b>Free Dictionary <a class="hlclass" style="inline-block;" href="//www.thefreedictionary.com/" title="//www.thefreedictionary.com/" target=_blank onmouseover="this.href=this.title + hight.replace(/\ /g,' + "'+'" + ');" ontouchstart="this.href=this.title + hight.replace(/\ /g,' + "'+'" + ');" id=b_hfloater_free_dictionary>' + hight + '</a></b><br>';

        document.getElementById('hfloater').innerHTML+='<b>Google Search <a class="hlclass" style="inline-block;" href="//www.google.com/" title="//www.google.com/search?q=" target=_blank onmouseover="this.href=this.title + hight.replace(/\ /g,' + "'+'" + ');" ontouchstart="this.href=this.title + hight.replace(/\ /g,' + "'+'" + ');" id=b_hfloater_google_search>' + hight + '</a></b><br>';

        document.getElementById('hfloater').innerHTML+='<b>Tag Search <a class="hlclass" style="inline-block;" href="//www.rjmprogramming.com.au/ITblog/" title="//www.rjmprogramming.com.au/ITblog/tag/" target=_blank onmouseover="this.href=this.title + hight.replace(/\ /g,' + "'-'" + ');" ontouchstart="this.href=this.title + hight.replace(/\ /g,' + "'-'" + ');" id=b_hfloater_tag_search>' + hight + '</a></b><br>';

        document.getElementById('hfloater').innerHTML+='<b>Category Search <a class="hlclass" style="inline-block;" href="//www.rjmprogramming.com.au/ITblog/" title="//www.rjmprogramming.com.au/ITblog/category/" target=_blank onmouseover="this.href=this.title + hight.replace(/\ /g,' + "'-'" + ');" ontouchstart="this.href=this.title + hight.replace(/\ /g,' + "'-'" + ');" id=b_hfloater_category_search>' + hight + '</a></b><br>';

        document.getElementById('hfloater').innerHTML+='<b>Tag First Word Search <a class="hlclass" style="inline-block;" href="//www.rjmprogramming.com.au/ITblog/" title="//www.rjmprogramming.com.au/ITblog/tag/" target=_blank onmouseover="this.href=this.title + hight.replace(/\ /g,' + "'-'" + ').replace(' + "'-','/?wopenall='" + ');" ontouchstart="this.href=this.title + hight.replace(/\ /g,' + "'-'" + ').replace(' + "'-','/?wopenall='" + ');" id=b_hfloater_tag_first_word_search>' + hight + '</a></b><br>';

        document.getElementById('hfloater').innerHTML+='<b>Posting Title Search <a class="hlclass" style="inline-block;" href="//www.rjmprogramming.com.au/itblog/match/mapper.php" title="//www.rjmprogramming.com.au/itblog/match/mapper.php?pm=" target=_blank onmouseover="this.href=this.title + encodeURIComponent(hight);" ontouchstart="this.href=this.title + encodeURIComponent(hight);" id=b_hfloater_posting_title_search>' + hight + '</a></b><br>';


        document.getElementById('hfloater').innerHTML+='<b>Email <a class="hlclass" style="inline-block;" href="mailto:?subject=Re%3a%20' + encodeURIComponent(thetwords) + '%20%28' + encodeURIComponent(document.URL) + '%29&body=" title="mailto:?subject=Re%3a%20' + encodeURIComponent(thetwords) + '%20%28%20' + encodeURIComponent(document.URL) + '%20%29&body=" target=_blank onmouseover="this.href=emaileeis(this.title) + encodeURIComponent(hight);" ontouchstart="this.href=emaileeis(this.title) + encodeURIComponent(hight);" id=b_hfloater_email>' + hight + '</a></b><br>';

        document.getElementById('hfloater').innerHTML+='<b>Annotated Email <a class="hlclass" style="inline-block;" href="//www.rjmprogramming.com.au/HTMLCSS/emailhtml.php?to=&subject=Re%3a%20' + encodeURIComponent(thetwords) + '%20%28' + encodeURIComponent(document.URL) + '%29&body=" title="//www.rjmprogramming.com.au/HTMLCSS/emailhtml.php?to=&subject=Re%3a%20' + encodeURIComponent(thetwords) + '%20%28%20' + encodeURIComponent(document.URL) + '%20%29&body=" target=aeciframe onmouseover="this.href=emaileeis(this.title) + encodeURIComponent(this.innerHTML.substring(this.innerHTML.indexOf(String.fromCharCode(60))));" ontouchstart="this.href=emaileeis(this.title) + encodeURIComponent(this.innerHTML.substring(this.innerHTML.indexOf(String.fromCharCode(60))));" id=b_hfloater_annotated_email>' + aec + '</a></b><iframe name=aeciframe style=display:none; src=#></iframe><br>';        document.getElementById('hfloater').innerHTML+='<b>SMS <a class="hlclass" style="inline-block;" href="sms:&body=" title="sms:&body=" target=_blank onmouseover="this.href=smsee(this.title) + encodeURIComponent(hight);" ontouchstart="this.href=smsee(this.title) + encodeURIComponent(hight);" id=b_hfloater_sms>' + hight + '</a></b><br>';


        document.getElementById('hfloater').innerHTML+='<b>Navigate to Link About <a class="hlclass" style="inline-block;text-decoration:underline;cursor:pointer;" title=" " onclick="thisasearch(this.innerHTML,this);" onmouseover="thisasearch(this.innerHTML,this);" ontouchstart="thisasearch(this.innerHTML,this);" id=b_hfloater_posting_a_search>' + hight + '</a></b><br>';

        document.getElementById('hfloater').innerHTML+='<b>Display/Copy Link About <a class="hlclass" style="inline-block;text-decoration:underline;cursor:pointer;" title=" " onclick="thisacopysearch(this.innerHTML,this);" onmouseover="thisacopysearch(this.innerHTML,this);" ontouchstart="thisacopysearch(this.innerHTML,this);" id=b_hfloater_posting_a_copy_search>' + hight + '</a></b><br>';

        if (oharr.length >= 1) {

         for (var ioharr=0; ioharr<oharr.length; ioharr++) {

          otit='Other Link ' + eval(1 + ioharr);

          if (oharr[ioharr].indexOf('#') != -1) {

            otit=oharr[ioharr].split('#')[1].trim();

          }

          if (oharr[ioharr].split('#')[1].indexOf('  ') == 0) {

            opis=hight.replace(/\ /g,' + \"'-'\" + ');

            document.getElementById('hfloater').innerHTML+='<b>' + otit + ' <a style=\"inline-block;\" href=\"' + oharr[ioharr].split('#')[0].trim() + '\" title=\"' + oharr[ioharr].split('#')[0].trim() + '\" target=_blank onmouseover=\"this.href=this.title + hhopis(String.fromCharCode(45));\" ontouchstart=\"this.href=this.title + hhopis(String.fromCharCode(45));\" id=b_hfloater_' + xcookcnt + '>' + hight + '</a></b><br>';

          } else if (oharr[ioharr].split('#')[1].indexOf(' ') == 0) {

            opis=hight.replace(/\ /g,' + \"'+'\" + ');

            document.getElementById('hfloater').innerHTML+='<b>' + otit + ' <a style=\"inline-block;\" href=\"' + oharr[ioharr].split('#')[0].trim() + '\" title=\"' + oharr[ioharr].split('#')[0].trim() + '\" target=_blank onmouseover=\"this.href=this.title + hhopis(String.fromCharCode(43));\" ontouchstart=\"this.href=this.title + hhopis(String.fromCharCode(43));\" id=b_hfloater_' + xcookcnt + '>' + hight + '</a></b><br>';

          } else {

            document.getElementById('hfloater').innerHTML+='<b>' + otit + ' <a style=\"inline-block;\" href=\"' + oharr[ioharr].split('#')[0].trim() + '\" title=\"' + oharr[ioharr].split('#')[0].trim() + '\" target=_blank onmouseover=\"this.href=this.title + encodeURIComponent(hight);\" ontouchstart=\"this.href=this.title + encodeURIComponent(hight);\" id=b_hfloater_' + xcookcnt + '>' + hight + '</a></b><br>';

          }

          xcookcnt++;

         }

        }

        document.getElementById('hfloater').innerHTML+='<b><input title=\"Add your own into HTTP Cookies\" type=button onclick=cookiePutHHVal(xcookblank); value=+></input> <input title=\"Remove all HTTP Cookie URLs\" type=button onclick=cookiePutHHVal(xcookblank.trim()); value=-></input></b><br>';

      } else {

        document.getElementById('b_hfloater_wikipedia').innerHTML=hight;

        document.getElementById('b_hfloater_google_translate').innerHTML=hight;

        document.getElementById('b_hfloater_free_dictionary').innerHTML=hight;

        document.getElementById('b_hfloater_google_search').innerHTML=hight;

        document.getElementById('b_hfloater_tag_search').innerHTML=hight;

        document.getElementById('b_hfloater_category_search').innerHTML=hight;

        document.getElementById('b_hfloater_tag_first_word_search').innerHTML=hight;

        document.getElementById('b_hfloater_posting_title_search').innerHTML=hight;


        document.getElementById('b_hfloater_email').innerHTML=hight;

        document.getElementById('b_hfloater_annotated_email').innerHTML=aec;

        document.getElementById('b_hfloater_sms').innerHTML=hight;


        document.getElementById('b_hfloater_posting_a_search').innerHTML=hight;

        document.getElementById('b_hfloater_posting_a_copy_search').innerHTML=hight;


        if (xcookcnt > 0) {

          for (var icook=0; icook<xcookcnt; icook++) {

            document.getElementById('b_hfloater_' + icook).innerHTML=hight;

          }

        }

        document.getElementById('hfloater').style.top=s_top;

        document.getElementById('hfloater').style.left=s_left;

        document.getElementById('hfloater').style.display='block';

      }

    }

  } else if (xsel == '') {

    if (document.getElementById('hfloater')) {

      document.getElementById('hfloater').style.display='none';

    }

    hight='';

  }

}
Previous relevant WordPress Plugin Primer Tutorial is shown below.
WordPress Plugin Primer Tutorial
Normally we make changes to this TwentyTen themed WordPress blog by changing that theme’s wp-content/themes/twentyten/header.php file. But today we show you how to write the PHP code needed to write a WordPress.org admin login plugin to create a hyperlink to a Wikipedia page regarding any text you have highlighted on your WordPress admin area webpage.
We thank …
… and we think you should read …
For us, with our very simple rjmprogramming-wikipedia-lookup.php plugin, we only needed the one piece of PHP to sit in the current WordPress wp-content/plugins directory, and then immediately be accessible to the WordPress blog admin area’s Plugins -> Activate option …
<?php

/**

 * @package Rjmprogramming_Wikipedia_Lookup

 * @version 1.6

 */

/*

Plugin Name: Rjmprogramming Wikipedia Lookup

Description: Float a Wikipedia lookup link for highlighted text of an admin webpage.

Author: Robert James Metcalfe

Version: 1.6

Author URI: http://www.rjmprogramming.com.au/

*/


// This creates the Wikipedia lookup hyperlink

function rjmprogramming_wikipedia_lookup() {

	$wikipedia_page = "Wikipedia Main Page";

	echo '<a target="_blank" title="Wikipedia lookup of ..." onmouseover="var xsel=' .

	  "''" . '; xsel=window.getSelection().toString(); if (xsel.length == 0) {' .

	  ' xsel=document.selection.createRange().htmlText;' .

	  ' } if (xsel.length != 0) { this.innerHTML=xsel; this.href=' . "'" . '//wikipedia.org/wiki/' .

	  "'" . ' + xsel.replace(/\ /g,' . "'" . '_' . "'" . '); } " ontouchstart="var xsel=' .

	  '; xsel=window.getSelection().toString(); if (xsel.length == 0) {' .

	  ' xsel=document.selection.createRange().htmlText; }' .

	  ' if (xsel.length != 0) { this.innerHTML=xsel; this.href=' . "'" . '//wikipedia.org/wiki/' . "'" .

	  ' + xsel.replace(/\ /g,' . "'" . '_' . "'" . '); } " id="rjmprogramming_wikipedia_lookup"' .

	  ' href="//wikipedia.org/wiki/Main_Page">' . $wikipedia_page . '</a>';

}


// Now we set that function up to execute when the admin_notices action is called

add_action( 'admin_notices', 'rjmprogramming_wikipedia_lookup' );


// We need some CSS to position the hyperlink

function rjmprogramming_wikipedia_css() {

	// This makes sure that the positioning is also good for right-to-left languages

	$x = is_rtl() ? 'left' : 'right';


	echo "

	<style type='text/css'>

	#rjmprogramming_wikipedia_lookup {

		float: $x;

		padding-$x: 15px;

		padding-top: 5px;

		margin: 0;

		font-size: 11px;

	}

	</style>

	";

}


add_action( 'admin_footer', 'rjmprogramming_wikipedia_css' );


?>
We hope this is of interest to you.
If this was interesting you may be interested in this too.
If this was interesting you may be interested in this too.
If this was interesting you may be interested in this too.
If this was interesting you may be interested in this too.
If this was interesting you may be interested in this too.
If this was interesting you may be interested in this too.
If this was interesting you may be interested in this too.