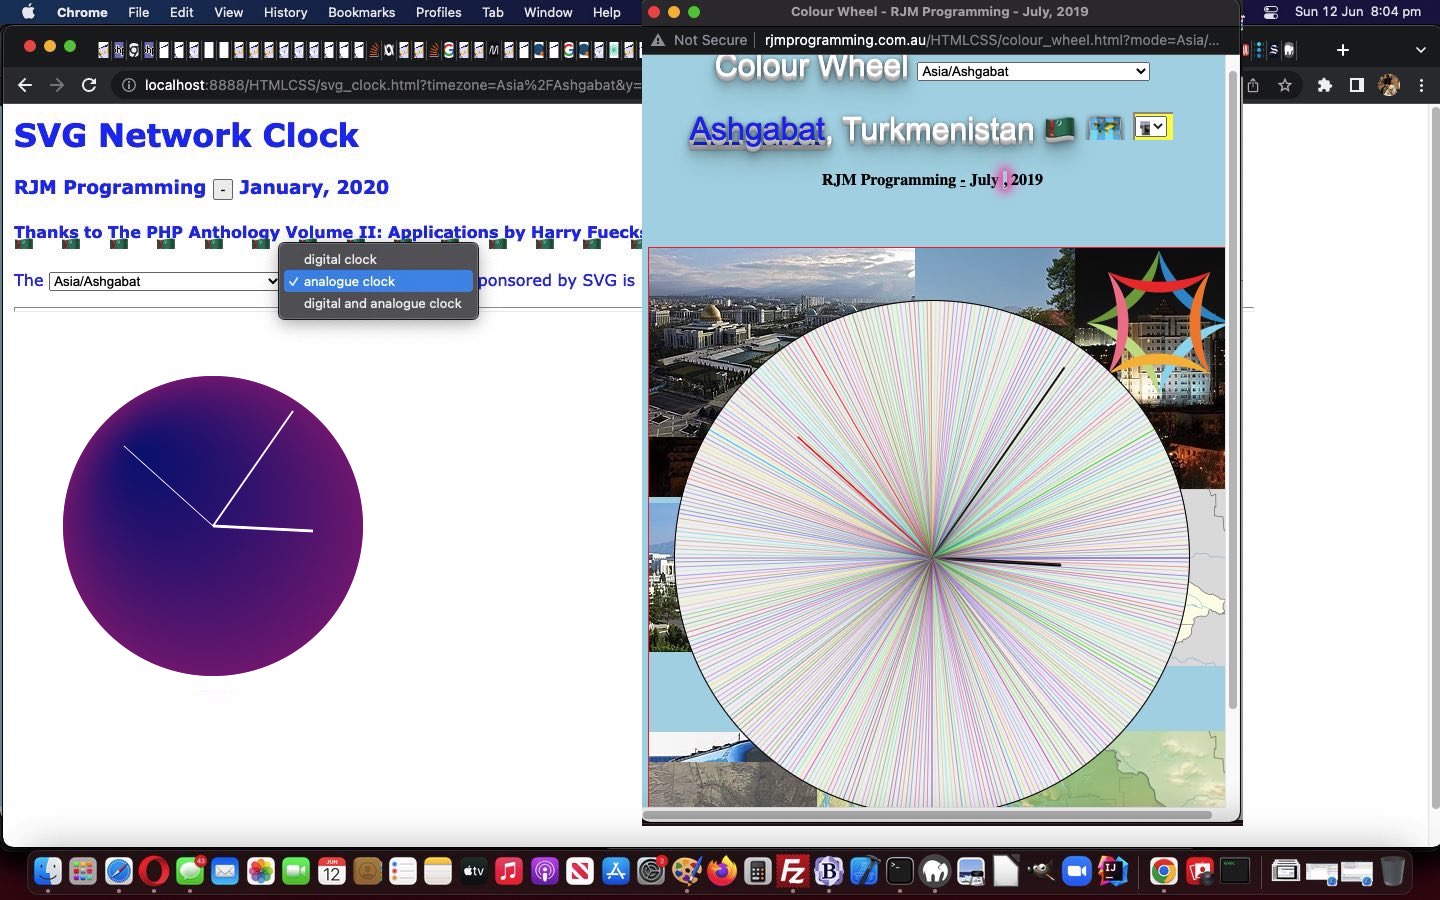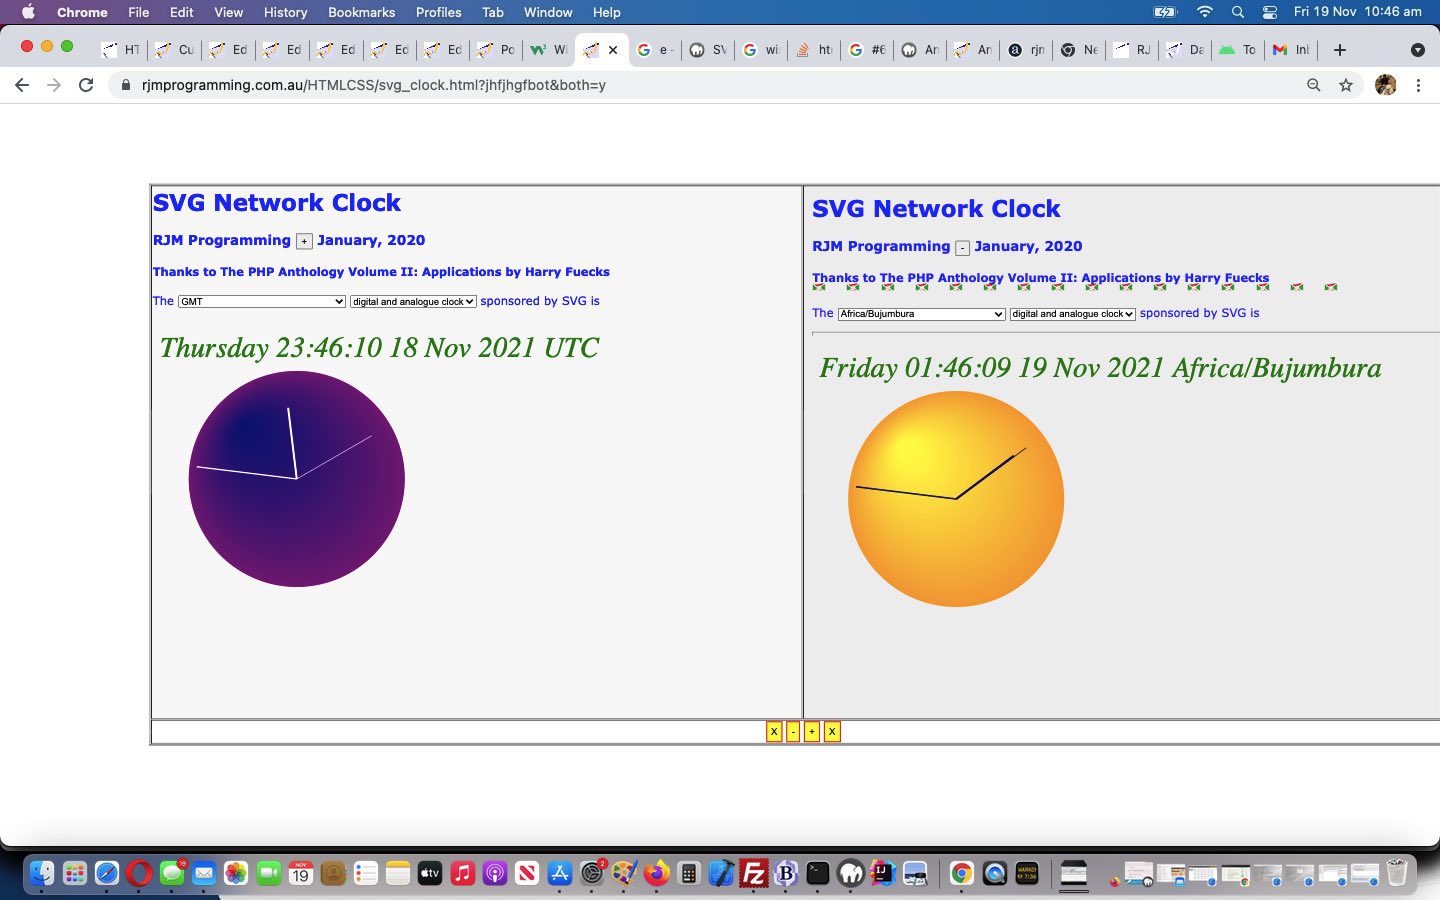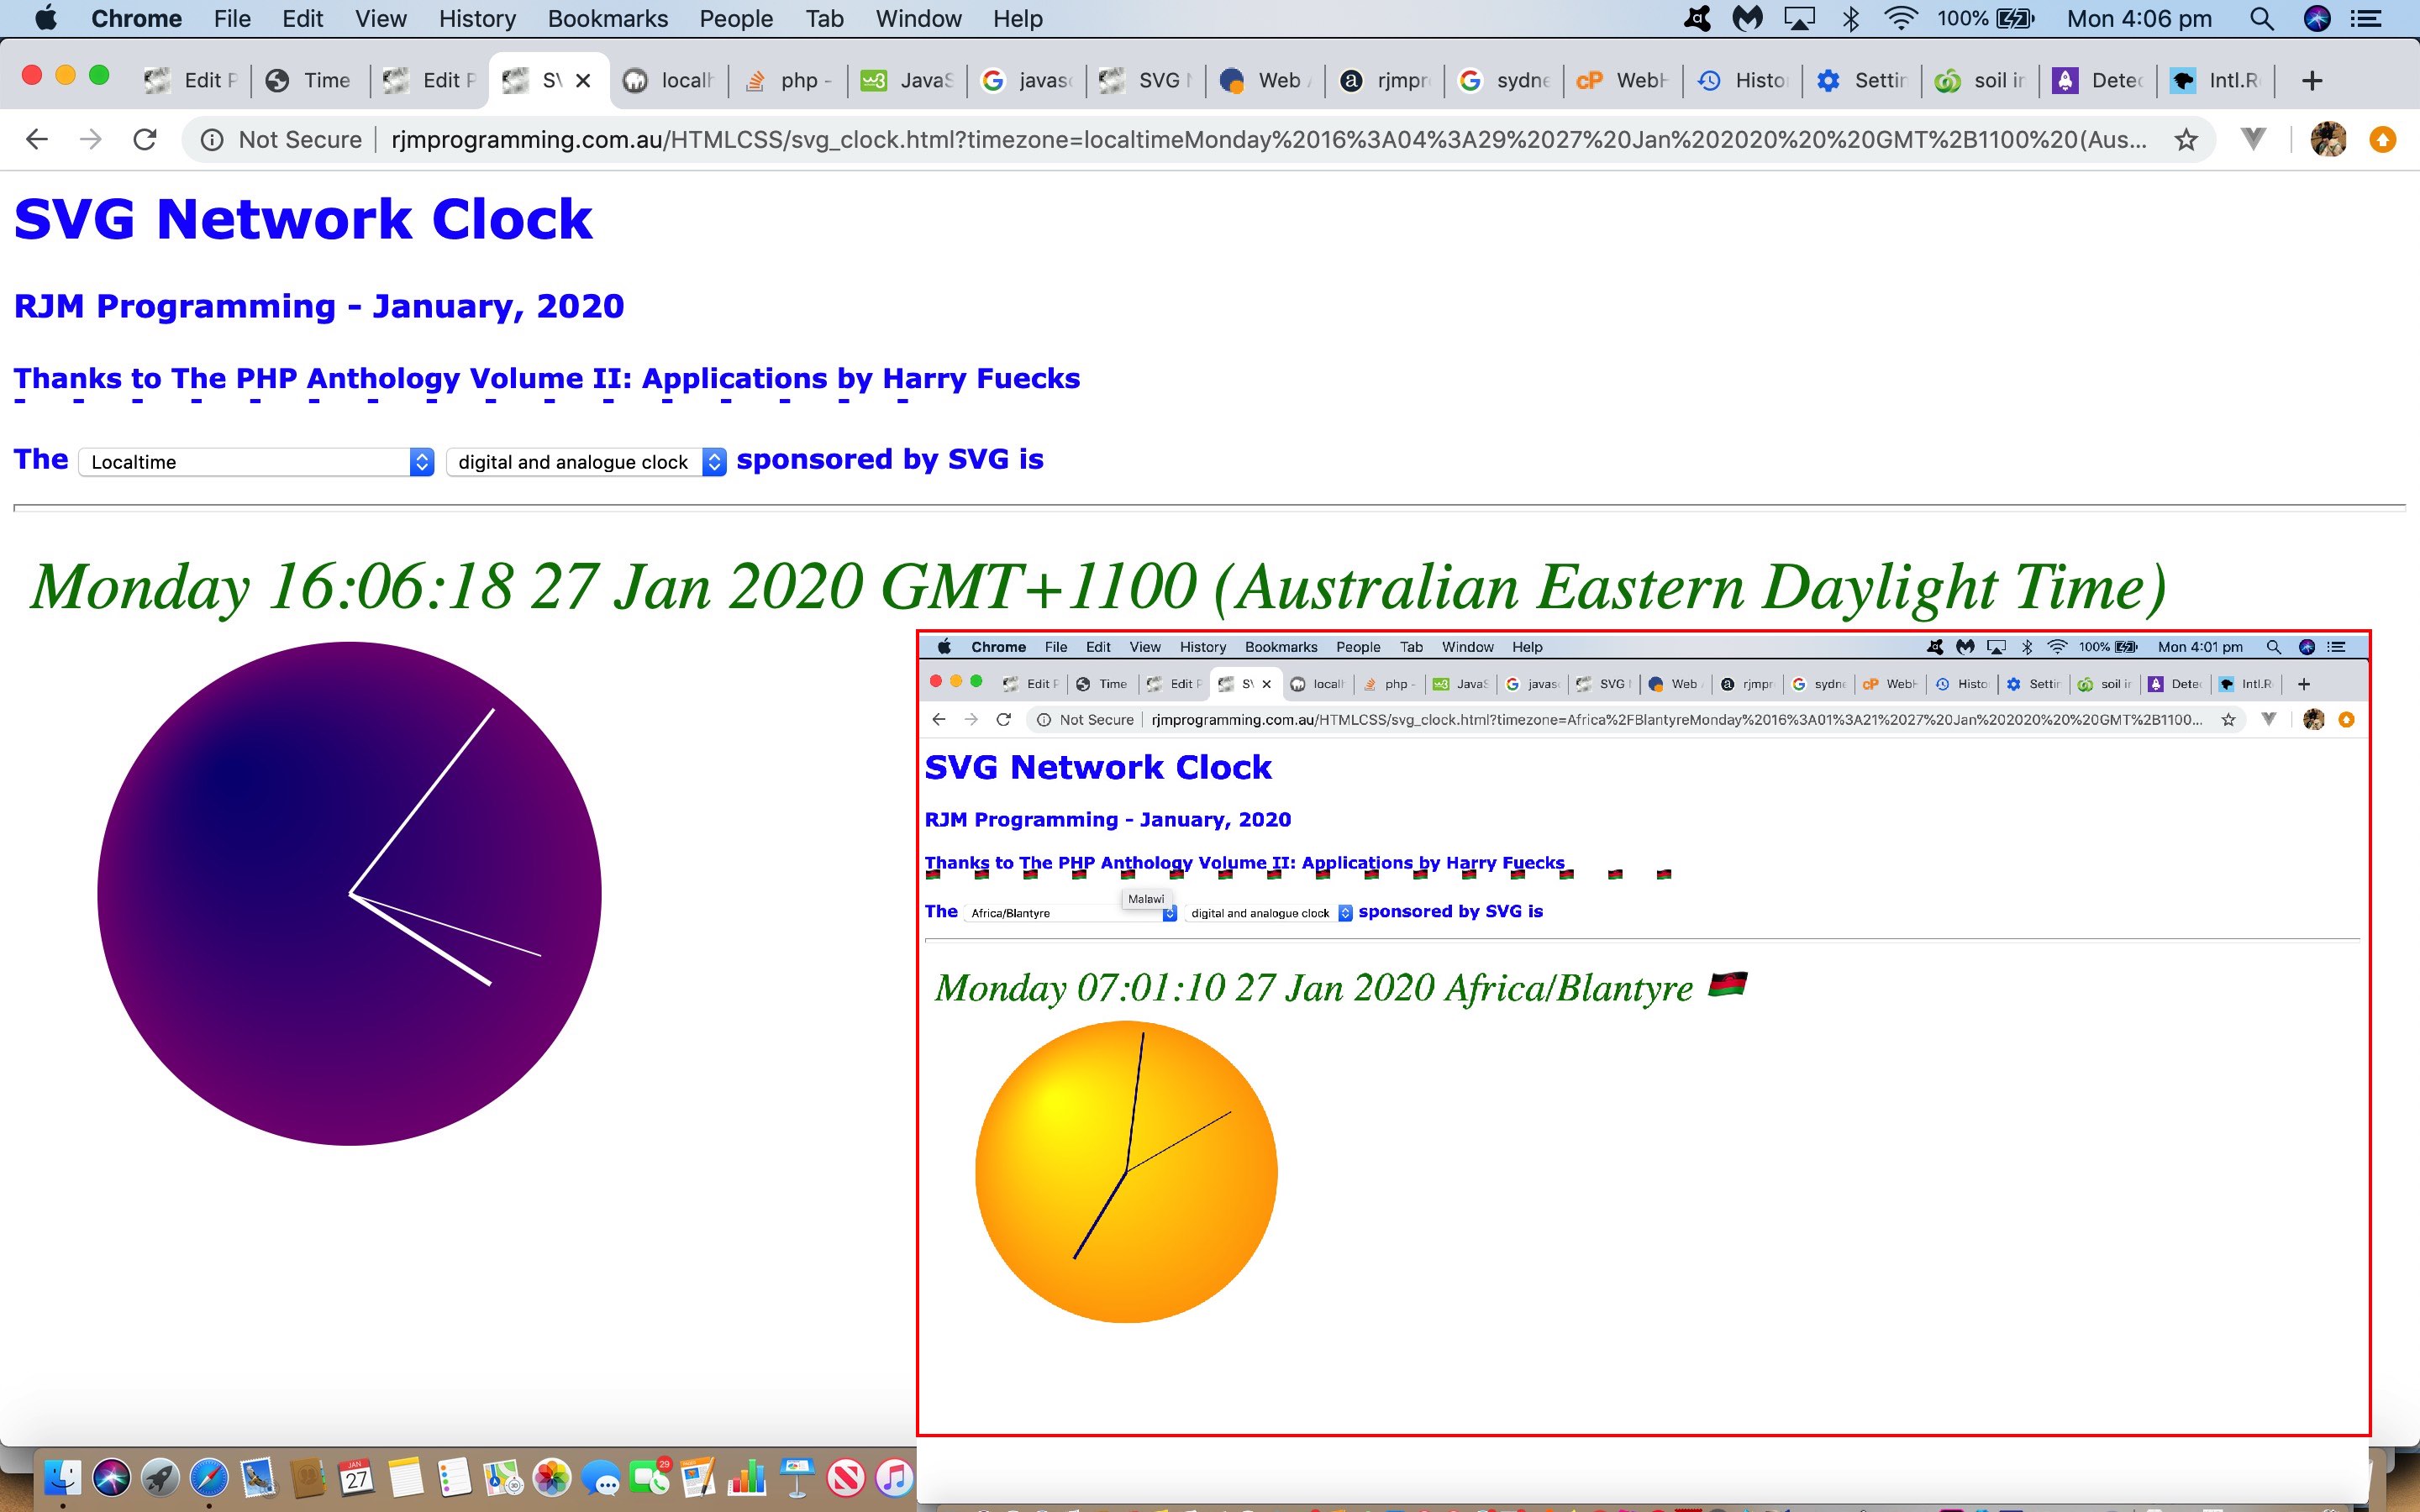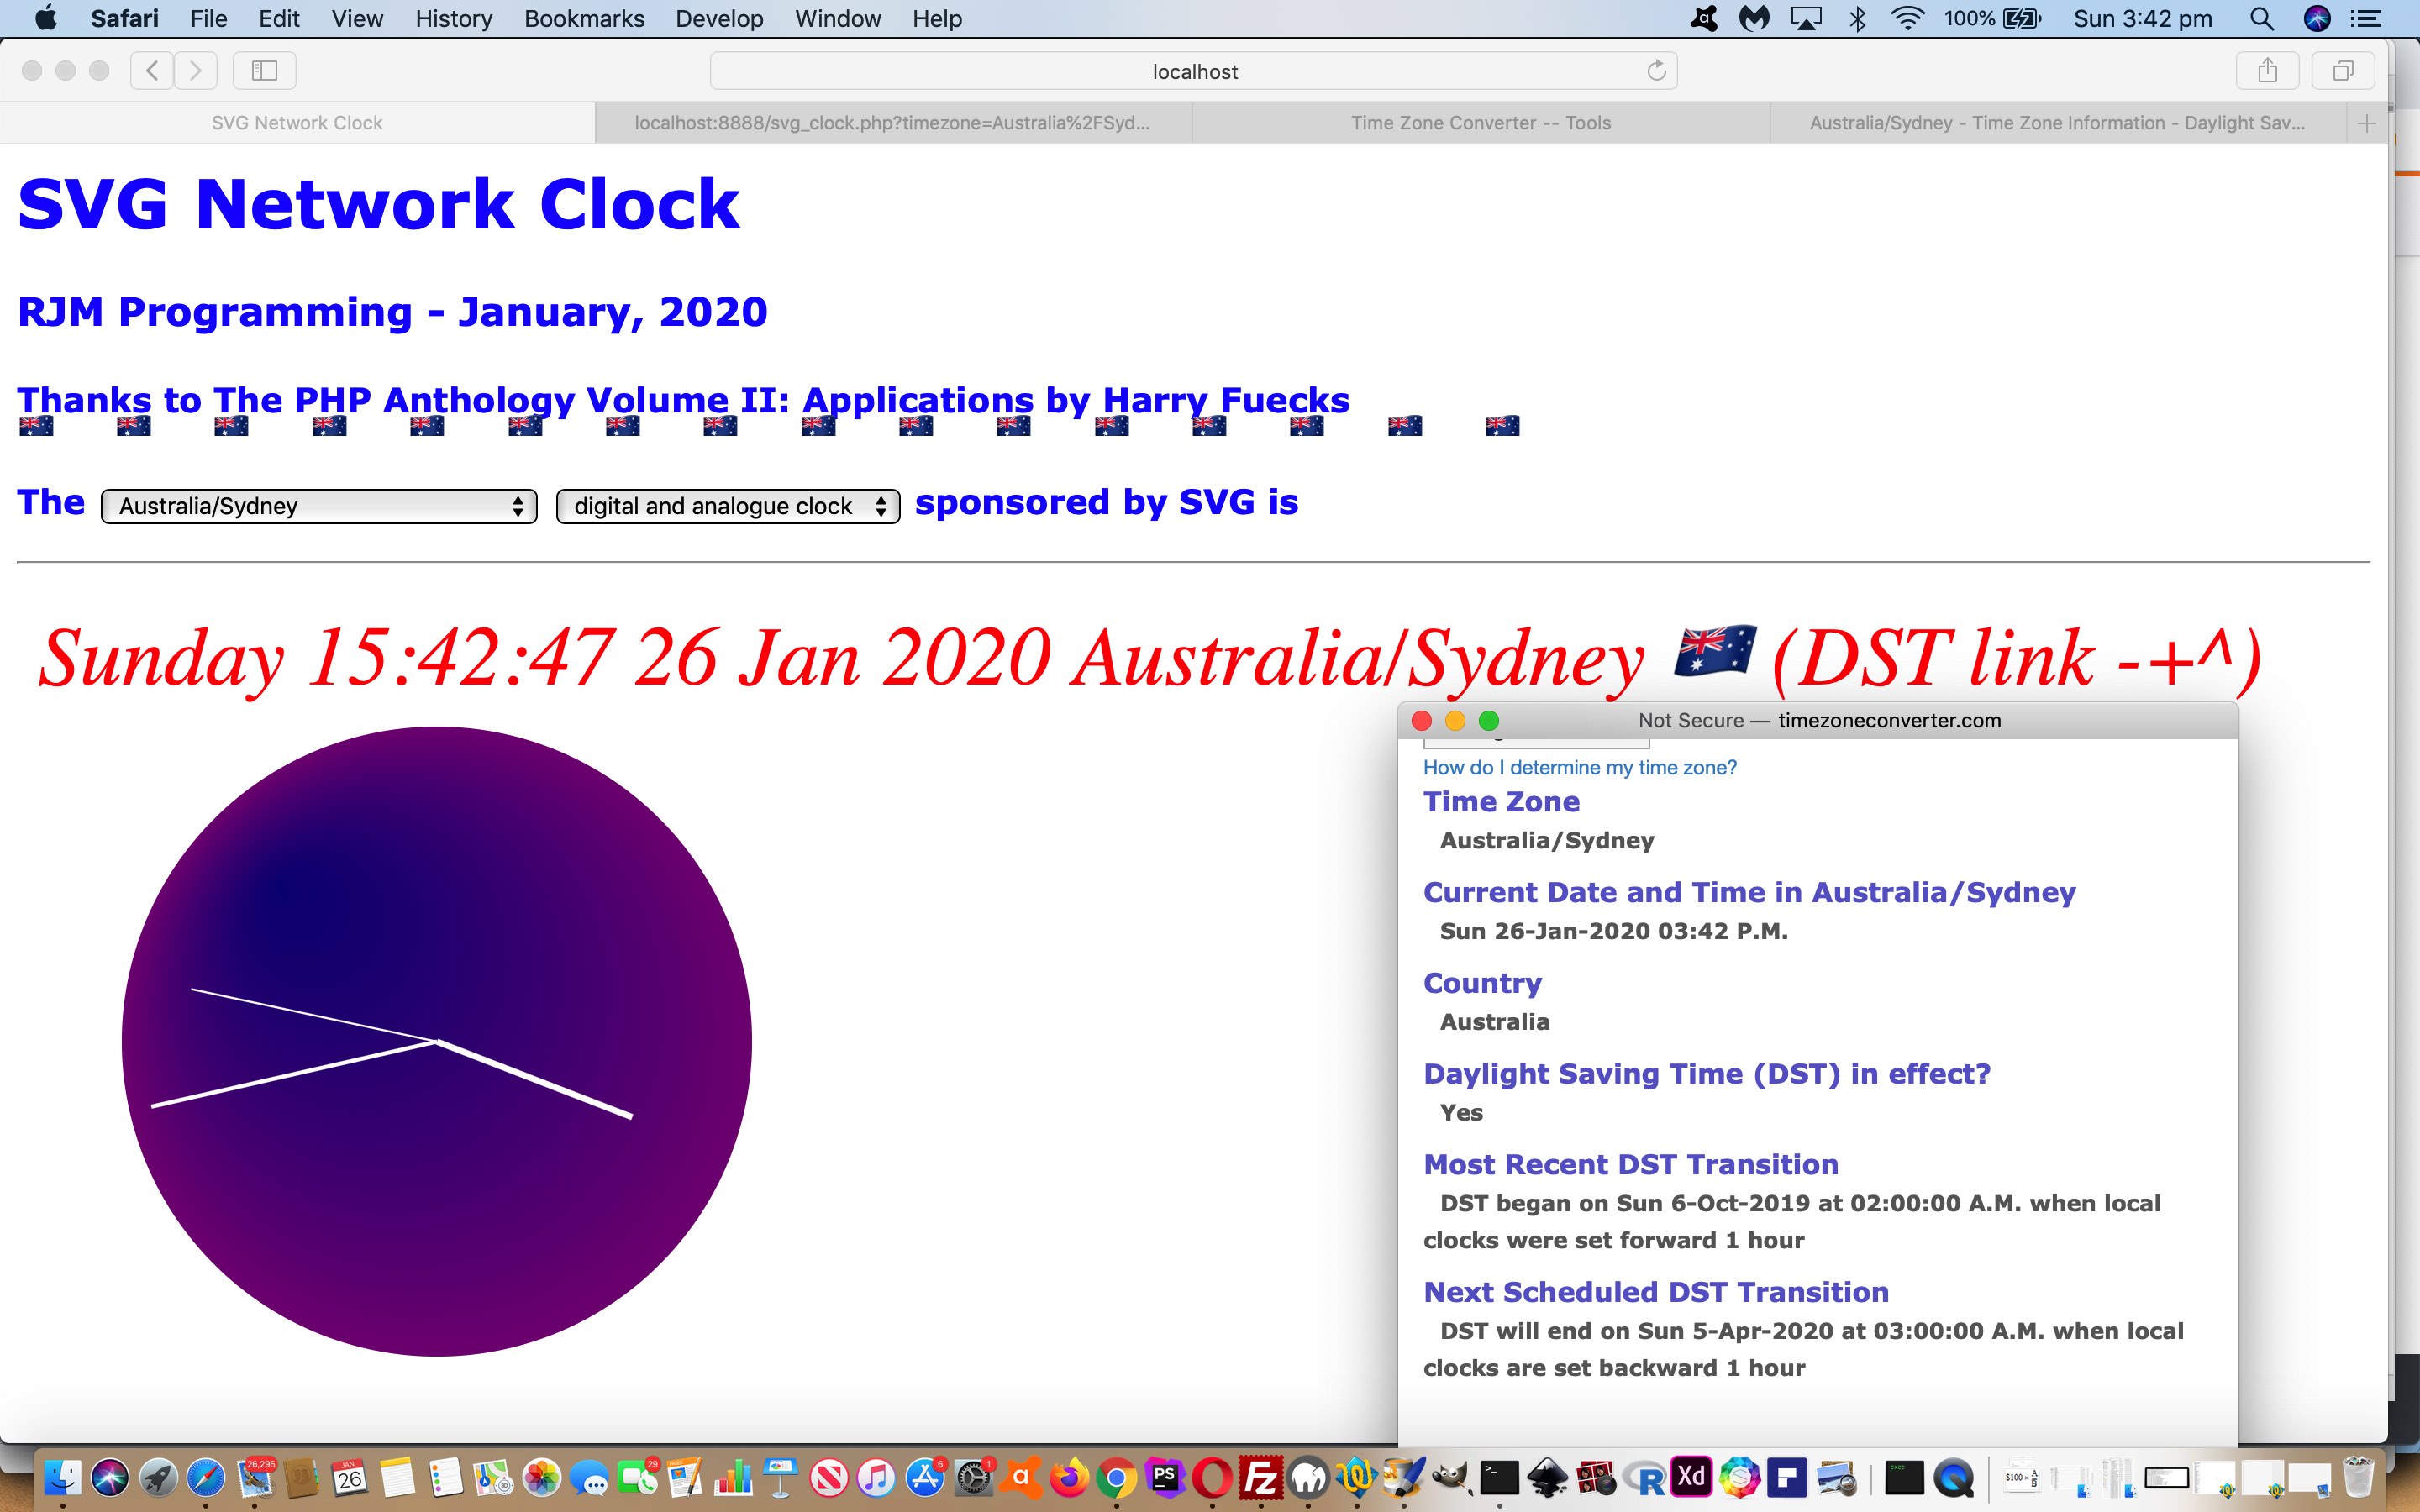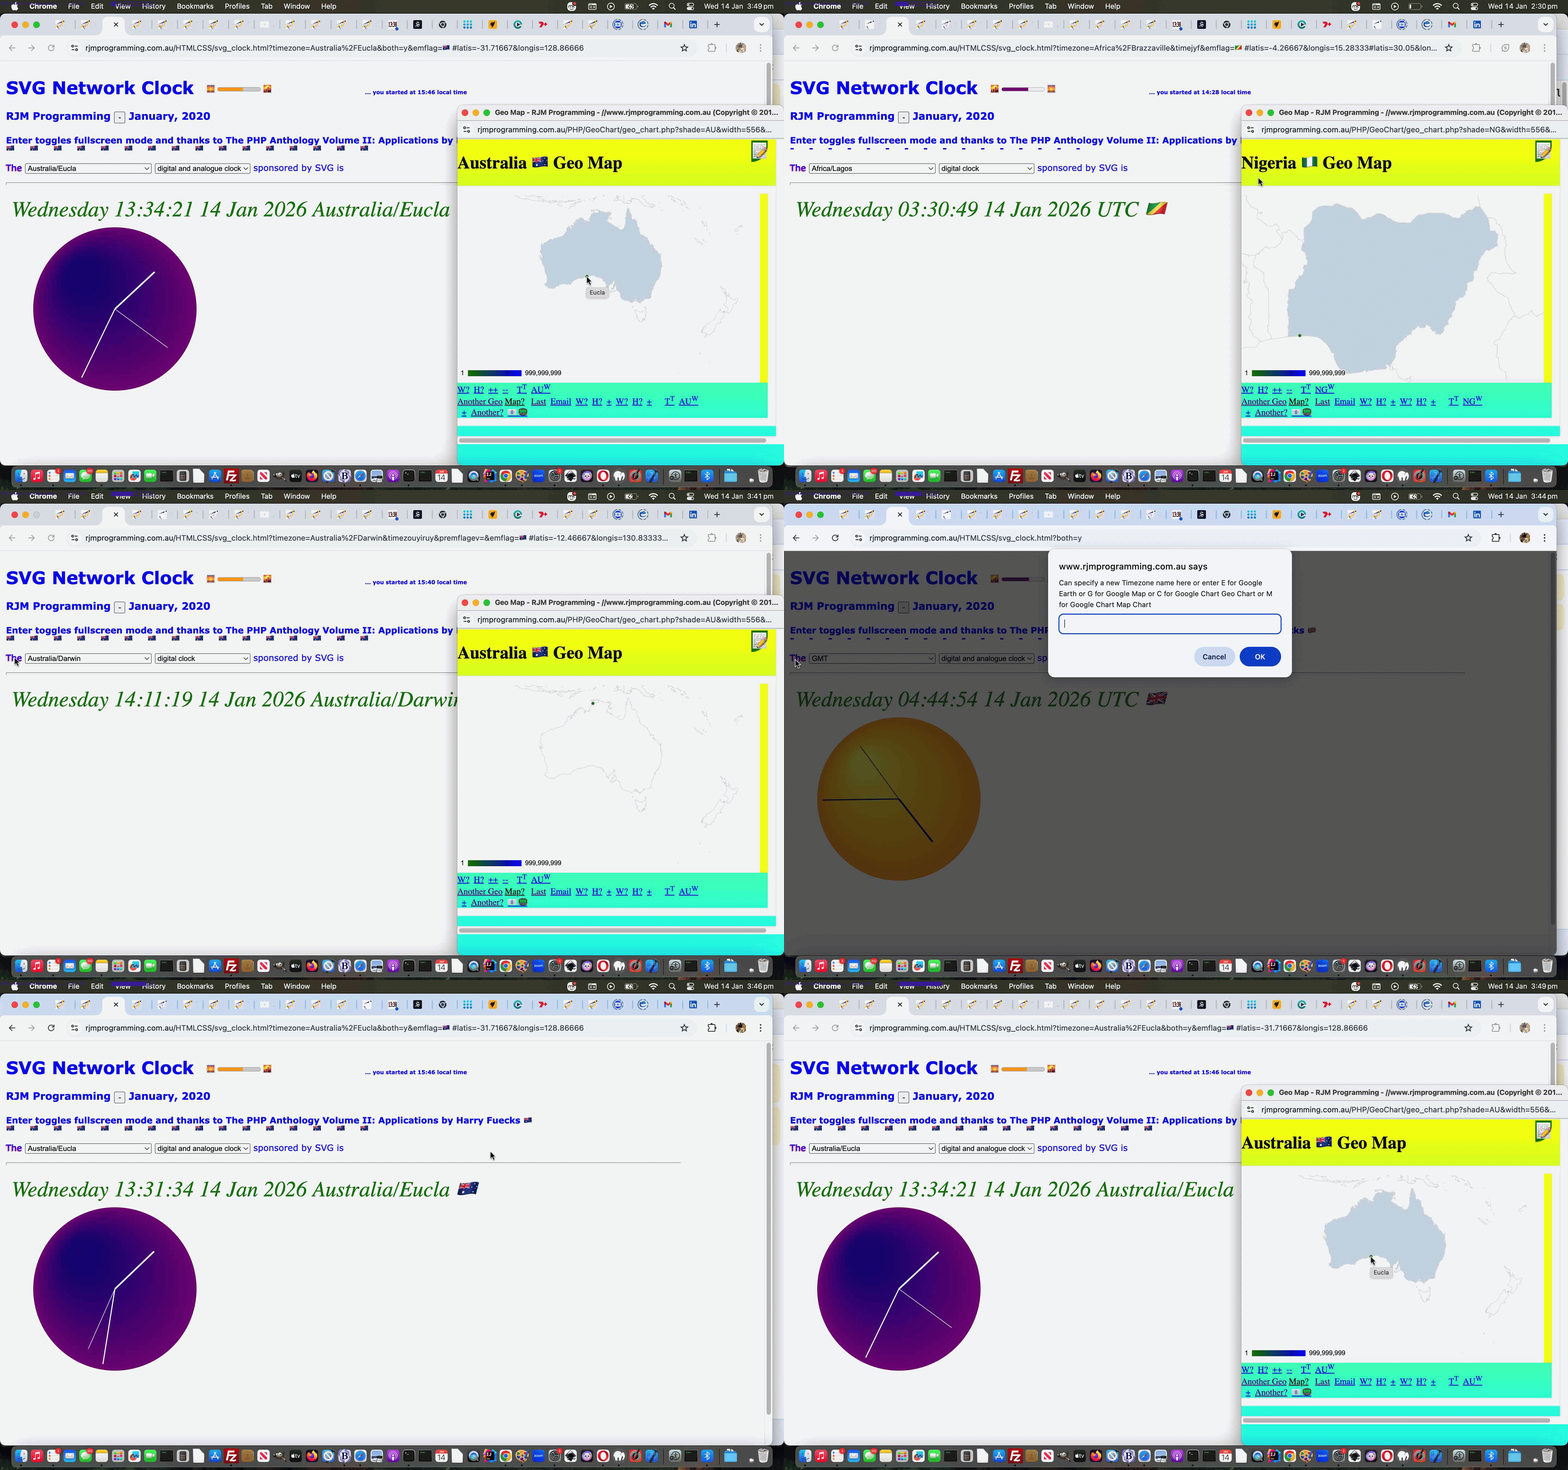
… shows the content as an HTML webpage, whereas we’re used to seeing this display the HTML code contained within that file.
Our code difference reporting system worked that way, ideally. Other extensions like *.php* based ones act the same way between CentOS and AlmaLinux, but we’ve decided to live with this “new woooorrrrllldddd order”, and turn it, in a mild way, to our advantage, offering code difference report readers of *.html* code the chance now to …
see the content as the HTML text within … now that we intervene with PHP code such as …
It took us a long time, but we now feel we’re better across, writing web applications, and dealing with URLs, that …
not mentioning protocols http: nor https: specifically is preferable …
As time goes on, more and more we see the benefits of URLs that start with “/” (but not HTTP:// nor HTTPS:// absolute URL designations), especially when it comes to pointing at a “tool” (eg. external Javascript). It has
the benefits of …
is programmer controlled, so they can place the tool in Document Root folder (in the case of an Apache web server) … and, in so doing …
it’s irrelevant where the “parent” (calling) web application is placed … and …
mixed content issues are avoided by not using an absolute URL, though it kind of, is!
… both ideals above related to Mixed Content (ie. involving “competing protocols” within a webpage).
… and we suspect either of these two URLs might have caused this upper and lower HTML iframes issue up until today. How did we approach the remedy? We could have …
detected the Mixed Content potential of the incoming URL and in the PHP reissued the address bar call, effectively, via a header(‘Location: [newUrlFixedForNiMixedContent]’); style of recall … or, what we ended up doing, being (some readers may find the following “a little bit kludgy , this kludgy inside 🎵, am not one of those, who easily 🎶 kludgifies (at least in public)“) …
stayed on the same PHP execution call via …
<?php
if (isset($_GET['one'])) { // && !isset($_GET['two'])) {
if (strpos(('' .$_SERVER['SERVER_PORT']), '443') !== false && strpos(strtoupper($_GET['one']), 'HTTP') !== false && strpos(strtoupper($_GET['one']), 'HTTPS') === false) {
$_GET['one']='HTTPS' . substr($_GET['one'], 4);
} else if (strpos(('' .$_SERVER['SERVER_PORT']), '443') === false && strpos(strtoupper($_GET['one']), 'HTTPS') !== false) {
$_GET['one']='HTTP' . substr($_GET['one'], 5);
}
if (isset($_GET['two'])) {
if (strpos(('' .$_SERVER['SERVER_PORT']), '443') !== false && strpos(strtoupper($_GET['two']), 'HTTP') !== false && strpos(strtoupper($_GET['two']), 'HTTPS') === false) {
$_GET['two']='HTTPS' . substr($_GET['two'], 4);
} else if (strpos(('' .$_SERVER['SERVER_PORT']), '443') === false && strpos(strtoupper($_GET['two']), 'HTTPS') !== false) {
$_GET['two']='HTTP' . substr($_GET['two'], 5);
}
}
// more PHP
}
?>
… to not mix any of the apples with any of the pears!
Code Difference Highlighting User Interface Tutorial
Unless a piece of your web application functionality is categorized as “internal use only” you, as a programmer, will want to offer functionality that does not ask the user to remember some arcane URL (GET ? and &) arrangement at the address bar of a web browser. And so, onto yesterday’s Code Difference Highlighting Tutorial, talking about our inhouse PHP Code Difference Reporting functionality, we wanted to offer …
The PHP diff.php code got changed so that a user entered comma separated list will be scrutinised for whether it represents a single string to find, or if highlighting should happen for each list member in the comma separated list.
also useful, here, could be a highlighting functionality making use of the HTML mark element, that we gave a sneak peek to regarding, yesterday, with Ants Up a Wall Game Mobile Tutorial if you were one of those readers to click the …
It meant, in that scenario yesterday, when a single variable usage “tells a story” in the code, this code difference highlighting might be more effective at explaining the issues rather than showing the code in a code element (even with inhouse colour coding), because there is also the “before” and “after” scenarios there on the screen for the reader to contextualize. See the newly changed PHP diff.php code or try it yourself here.
the server side file and database and operating system smarts of the great serverside language PHP is … all while …
PHP writing out HTML (with its CSS and Javascript) has a web application able to access all that clientside intelligence
… and with this in mind, we allow for saved CSS styling user settings, as of today, with our Difference Report web application arrangements.
Don’t we need a database for this? Well, that is possible, and with serverside PHP, could be done, but we opt for clientside window.localStorage usage to …
Save user CSS styling settings
Recall user CSS styling settings
… so that a user might opt to “set and forget” their preferred set of …
New additional
Changed single line
New block of lines
Deleted lines
Changed multiple lines
… (CSS Selector) sensitive “categories” of Difference Report data type settings.
<?php
$style="<style> font { text-shadow: -1px 1px 1px #ff2d95; } </style>";
$legend="";
$mx="";
$onecommand=" function nocaret(invx) { var outvx=decodeURIComponent(invx); while (outvx.indexOf('<') > outvx.indexOf('>')) { outvx=outvx.replace('>' + outvx.split('>')[1].split('<')[0] + '<',''); } return encodeURIComponent(outvx); } function onb(event) { var othis=event.target, cih=''; if (('' + othis.id + ' ').substring(0,1) == 'f') { cih=('' + window.localStorage.getItem('diff_' + othis.id)).replace(/^undefined$/g,''.replace(/^null$/g,'')); if (('' + othis.innerHTML.replace(/\ \;/g,' ') + '~~').indexOf(' ~~') != -1) { if (cih == '') { window.localStorage.setItem('diff_' + othis.id, encodeURIComponent('14 >' + othis.innerText + '<')); } else { window.localStorage.removeItem('diff_' + othis.id); window.localStorage.setItem('diff_' + othis.id, nocaret(cih) + encodeURIComponent(' >' + othis.innerText + '<')); } } } } function blurize(othis) { if (1 == 2) { othis.onblur=function(event) { onb(event); }; } return othis; } function perhapsih(insg,ofo) { if (insg.indexOf('<') > insg.indexOf('<') && insg.indexOf('<') != -1) { ofo.innerHTML=insg.split('>')[1].split('>')[0]; ofo.setAttribute('data-ih', insg.split('>')[1].split('>')[0]); return insg.replace('>' + insg.split('>')[1].split('>')[0] + '<', ''); } } function givef(idn,cssis) { if (('' + document.getElementById('f' + idn).title).indexOf(' ' + decodeURIComponent(cssis) + ' ') == -1) { document.getElementById('f' + idn).title=document.getElementById('lspan').title + ' You have user CSS styling friendly one off setting of ' + decodeURIComponent(cssis) + ' for this category of Difference Reporting'; } } function getmaybe(foin,defis) { var mgs=document.URL.split(foin.id + '='); thatget=('' + window.localStorage.getItem('diff_' + foin.id)).replace(/^undefined$/g,'').replace(/^null$/g,''); if (thatget != '') { if (eval('' + mgs.length) == 1) { return decodeURIComponent(thatget); } else if (mgs[1].split('&')[0].split('#')[0] == '') { return decodeURIComponent(thatget); } } if (eval('' + mgs.length) > 1) { if (mgs[1].split('&')[0].split('#')[0] != '') { return decodeURIComponent(mgs[1].split('&')[0].split('#')[0]); } } return defis; } function getany() { var mgs=[],addget='',thisget=''; if (document.URL.replace('?','&').indexOf('&f') == -1 || 1 == 1) { for (var iig=0; iig<=6; iig++) { mgs=document.URL.split('f' + iig + '='); thisget=('' + window.localStorage.getItem('diff_f' + iig)).replace(/^undefined$/g,'').replace(/^null$/g,''); if (thisget != '') { document.getElementById('f' + iig).title=document.getElementById('lspan').title + ' You have user CSS styling friendly setting of ' + decodeURIComponent(thisget) + ' for this category of Difference Reporting'; } if (eval('' + mgs.length) > 1) { if (mgs[1].split('&')[0].split('#')[0] != '') { document.getElementById('f' + iig).title=document.getElementById('lspan').title + ' You have user CSS styling friendly setting of ' + decodeURIComponent(mgs[1].split('&')[0].split('#')[0]) + ' for this category of Difference Reporting'; } } if (document.URL.replace('?','&').indexOf('&f' + iig + '=') == -1) { addget+='&f' + iig + '=' + thisget; } } } if (addget != '') { location.href=(document.URL.split('#')[0] + addget).replace('.php&','.php?'); } } setTimeout(getany,2000); function removeany(newfo) { window.localStorage.removeItem('diff_' + newfo.id); } function addany(newishfo,newwhat) { removeany(newishfo); window.localStorage.setItem('diff_' + newishfo.id, newwhat); } function askabout(fo) { var defd='14', ccol='black', ccols=fo.outerHTML.split(' color=' + String.fromCharCode(34)), psizes=fo.outerHTML.split('px'); if (eval('' + ccols.length) > 1) { ccol=ccols[1].split(String.fromCharCode(34))[0]; } if (eval('' + psizes.length) > 1) { defd=psizes[0].split(':')[eval(-1 + psizes[0].split(':').length)].trim(); } var numis=prompt('How many px (ie. pixels) do you want for the font size of these ' + fo.innerHTML + ' parts of report? Optionally append after a space a colour that is not the default colour ' + ccol + ' for this category of difference report. Optionally append after a space any other styling you want ( eg. text-shadow: -1px 1px 1px #ff2d95; ). Append spaces to save for other Coding Difference Report sessions into the future. Prefix with minus ( ie. - ) to forget any remembered setting. An entry can be > followed by a new wording for this category followed by <', getmaybe(fo,defd)); if (numis != null) { if ((perhapsih(numis,fo) + 'x').trim().substring(0,1) == '-') { removeany(fo); numis=numis.replace('-',''); } if (('' + numis).trim() != '') { if (numis.replace(/\ $/g,'') != numis) { addany(fo,encodeURIComponent(numis.trim())); } location.href=(document.URL.split('#')[0] + '&' + fo.id + '=' + encodeURIComponent(numis.trim())).replace('.php&','.php?'); } } } ";
if (isset($_GET['f0']) || isset($_GET['f1']) || isset($_GET['f2']) || isset($_GET['f3']) || isset($_GET['f4']) || isset($_GET['f5']) || isset($_GET['f6'])) {
$onecommand.=" function sizefonts() { } setTimeout(sizefonts, 3000); ";
for ($ij=0; $ij<=6; $ij++) {
if (isset($_GET['f' . $ij])) {
$ihbit="";
$words=str_replace('+',' ',urldecode($_GET['f' . $ij]));
if (strpos($words, '<') !== false && strpos($words, '>') !== false) {
if (strpos($words, '<') > strpos($words, '>')) {
$ihbit=" document.getElementById('f" . $ij . "').innerHTML='" . str_replace("'", "' + String.fromCharCode(39) + '", explode('<',explode('>',$words)[1])[0]) . "'; ";
}
}
if (trim($words) != '') { $onecommand=str_replace("} ", " givef(" . $ij . ",'" . $_GET['f' . $ij] . "'); } ", $onecommand); }
$wordsa=explode(' ', trim($words));
if (sizeof($wordsa) > 1) {
$words=substr($words,(1 + strlen($wordsa[0])));
for ($ijj=1; $ijj<sizeof($wordsa); $ijj++) {
if (strpos($wordsa[$ijj], ':') === false && $ijj == 1) {
$words=trim(substr($words,(0 + strlen($wordsa[$ijj]))));
$style.='<style> .f' . $ij . " { font-color: " . trim($wordsa[$ijj]) . '; } </style>';
$onecommand=str_replace("} ", " document.getElementById('f" . $ij . "').color='' + '" . trim($wordsa[$ijj]) . "'; document.getElementById('f" . $ij . "').style.fontColor='' + '" . trim($wordsa[$ijj]) . "'; } ", $onecommand);
}
}
if (trim($words) != '') {
if (strpos($words, "{") !== false && strpos($words, "}") !== false) {
$style.='<style> ' . $words . ' </style>';
$onecommand=str_replace("} ", " document.getElementById('dstyle').innerHTML+='<style> ' + '" . $words . " </style>'; } ", $onecommand);
} else {
$style.='<style> .f' . $ij . " { " . $words . ' } </style>';
$onecommand=str_replace("} ", " document.getElementById('dstyle').innerHTML+='<style> .f" . $ij . " { ' + '" . $words . " } </style>'; } ", $onecommand);
}
}
}
$onecommand=str_replace("} ", $ihbit . " document.getElementById('f" . $ij . "').style.fontSize='' + '" . trim($wordsa[0]) . "px'; } ", $onecommand);
$style.='<style> .f' . $ij . " { font-size: " . trim($wordsa[0]) . 'px; } </style>';
}
}
}
?>
… to start making this happen (including being able to change our “inhouse category” names, if you like) in our changeddiff.php‘s more colourful Code Differences helper.
Yesterday’s Code Difference Privacy Tutorial represented too much of an echo chamber for our liking. Where possible, we prefer functionality that the users out there can tweak themselves.
In thinking about this, those 5 categories (involving 2 subcategories) …
New additional
Changed single line
New block of lines
Deleted lines
Changed multiple lines
… were what occurred to us could be the CSS Selector basis for us to improve the Code Difference reporting via CSS styling functionality.
Up to today the deployment of that CSS selector logic would have had to be more complex than necessary, but today’s …
giving new id and class attributes to the “legend” span id=lspan elements … and …
equivalent class attribute to report matching element data
… makes the deployment of CSS selector logic really easy, in PHP, as per …
<?php
$style="<style> font { text-shadow: -1px 1px 1px #ff2d95; } </style>";
$legend="";
$mx="";
$onecommand=" function askabout(fo) { var defd='14', ccol='black', ccols=fo.outerHTML.split(' color=' + String.fromCharCode(34)), psizes=fo.outerHTML.split('px'); if (eval('' + ccols.length) > 1) { ccol=ccols[1].split(String.fromCharCode(34))[0]; } if (eval('' + psizes.length) > 1) { defd=psizes[0].split(':')[eval(-1 + psizes[0].split(':').length)].trim(); } var numis=prompt('How many px (ie. pixels) do you want for the font size of these ' + fo.innerHTML + ' parts of report? Optionally append after a space a colour that is not the default colour ' + ccol + ' for this category of difference report. Optionally append after a space any other styling you want ( eg. text-shadow: -1px 1px 1px #ff2d95; )', defd); if (numis != null) { if (('' + numis).trim() != '') { location.href=(document.URL.split('#')[0] + '&' + fo.id + '=' + encodeURIComponent(numis.trim())).replace('.php&','.php?'); } } } ";
if (isset($_GET['f0']) || isset($_GET['f1']) || isset($_GET['f2']) || isset($_GET['f3']) || isset($_GET['f4']) || isset($_GET['f5']) || isset($_GET['f6'])) {
$onecommand.=" function sizefonts() { } setTimeout(sizefonts, 3000); ";
for ($ij=0; $ij<=6; $ij++) {
if (isset($_GET['f' . $ij])) {
$words=str_replace('+',' ',urldecode($_GET['f' . $ij]));
$wordsa=explode(' ', trim($words));
if (sizeof($wordsa) > 1) {
$words=substr($words,(1 + strlen($wordsa[0])));
for ($ijj=1; $ijj<sizeof($wordsa); $ijj++) {
if (strpos($wordsa[$ijj], ':') === false && $ijj == 1) {
$words=trim(substr($words,(0 + strlen($wordsa[$ijj]))));
$style.='<style> .f' . $ij . " { font-color: " . trim($wordsa[$ijj]) . '; } </style>';
$onecommand=str_replace("} ", " document.getElementById('f" . $ij . "').color='' + '" . trim($wordsa[$ijj]) . "'; document.getElementById('f" . $ij . "').style.fontColor='' + '" . trim($wordsa[$ijj]) . "'; } ", $onecommand);
}
}
if (trim($words) != '') {
if (strpos($words, "{") !== false && strpos($words, "}") !== false) {
$style.='<style> ' . $words . ' </style>';
$onecommand=str_replace("} ", " document.getElementById('dstyle').innerHTML+='<style> ' + '" . $words . " </style>'; } ", $onecommand);
} else {
$style.='<style> .f' . $ij . " { " . $words . ' } </style>';
$onecommand=str_replace("} ", " document.getElementById('dstyle').innerHTML+='<style> .f" . $ij . " { ' + '" . $words . " } </style>'; } ", $onecommand);
}
}
}
$onecommand=str_replace("} ", " document.getElementById('f" . $ij . "').style.fontSize='' + '" . trim($wordsa[0]) . "px'; } ", $onecommand);
$style.='<style> .f' . $ij . " { font-size: " . trim($wordsa[0]) . 'px; } </style>';
}
}
}
it was possible, but unlikely, for users to see other user generated reports, if they happened to be asking for reports at exactly the same time … because …
we had not catered for busy traffic here … but, today …
we cater, better, for busy online traffic … and at the same time …
improve the privacy of the reporting on an IP address basis
The downside, at least for us managing this, is that we do not want a build up of files belonging to difference reports long gone. We arrange it, then, that as soon as the report is created, a window.open scenario is coded for …
It’s coming up to a few years now, since we looked at the code differences reporting we offer the reader, as a way to scrutinize code changes, around here, when we presented Code Download Table Difference Functional Hover Tutorial. Well, we thought we might try some colour coding to perhaps lift the fog on the cryptic nature of Linux diff (difference) command based reports. They can be cryptic because they can feed into the automation feeding of the report into other Linux commands to facilitate ongoing editing endeavours, but we do not want to go into that here, at least today.
But on examining the reports we came up with the following difference report “categories” if you will …
New additional
Changed single line
New block of lines
Deleted lines
Changed multiple lines
… the header (of a block of interest) the dead give away, depending on the existence of “a” or “c” or “d” and/or “,” for a common sense reinterpretation by us not visiting “man diff” ourselves, yet, regarding this work.
Is it worth adding “onmouseover” event logic onto yesterday’s Code Download Table Difference Functional Linking Tutorial? You bet it is! Just because “onmouseover” has no relevance to mobile platforms, so, obversely, developing software with version control systems is irrelevant to mobile platforms.
… we figure. But this is of relevance to the programmer. Sometimes, rather than cater for all the platforms, settling on a subset (of those platforms) can be apt because …
one of mobile or non-mobile subsets of platforms is irrelevant to the scenario … as for today … or …
you try to reinvent the wheel on the pretext that you are waiting for a particular web browser or platform to allow the functionality in, into the future … you could be waiting a while, with the complexity of app arrangements going on around the net these days
Anyway, back to the “onmouseover” event on non-mobile platforms … it was the case that this event was a favourite for the conduit towards Ajax (client) functionality. And thinking on what we do today to nuance our Code Differences PHP web application, we were thinking …
What would Ajax (like to) do?
… and we decided Ajax would really like to …
populate a “div” style=display:inline-block; element adjacent to the functional detail to inform about … but this was not possible … so, instead, we …
populate a popup window near to the functional detail to inform about
… for a non-mobile “hover” (ie. “onmouseover”) event.
Along the way we add some more hashtag navigations and set up more colour coding to the output of (the optional) “functional links” Code Difference reporting.
So take a look at our changeddiff.php Code Differences helper applied to itself below …
“Report” button shows to its right …
function domrows() {
document.getElementById('dawrc').innerHTML='<input style=inline-block; type=button onclick=treportdo(); value=Report></input>';
var trsis=document.getElementsByTagName('tr');
for (var itrsis=0; itrsis<trsis.length; itrsis++) {
trsis[itrsis].onclick = function(e) { if (e.target.innerHTML != '') { var trs=document.getElementsByTagName('tr'); for (var itrs=0; itrs<trs.length; itrs++) { if (trs[itrs].outerHTML.indexOf(e.target.innerHTML) != -1) { trs[itrs].style.border='2px dotted red'; } } } };
}
}
… and table row onclick logic is dynamically applied to those “tr” elements
User clicks somewhere within rows they are interested in seeing be included in a report (which is a snippet of the whole Code Download Table, perhaps to do with a project of interest, or a learning topic of interest)
User optionally clicks the “Report” button …
function treportdo() {
var trsis=document.getElementsByTagName('tr');
webc='<html><head><script type="text/javascript"> function emailto(eto) { window.opener.parentemailto(eto); } function xemailto(eto) { if (eto.indexOf("@") != -1) { var zhr=new XMLHttpRequest(); var zform=new FormData(); zform.append("inline",""); zform.append("to",eto); zform.append("subj","Code Download Table part"); zform.append("body",document.getElementById("mytable").outerHTML); zhr.open("post", "//www.rjmprogramming.com.au/HTMLCSS/emailhtml.php", true); zhr.send(zform); alert("Email sent to " + eto); } } </script></head><body><table id=mytable></table><br><br><br><input onblur=emailto(this.value); placeholder="Email to" type=email></input></body></html>';
for (var itrsis=0; itrsis<trsis.length; itrsis++) {
if (itrsis == 0) {
webc=webc.replace('</table>', trsis[itrsis].outerHTML + '</table>');
}
if (trsis[itrsis].outerHTML.indexOf('>') > trsis[itrsis].outerHTML.indexOf('border:')) {
if (trsis[itrsis].outerHTML.indexOf('dotted') > trsis[itrsis].outerHTML.indexOf('border:')) {
webc=webc.replace('</table>', trsis[itrsis].outerHTML + '</table>');
}
}
}
var woois=window.open('','_blank','top=20,left=20,width=600,height=600');
woois.document.write(webc);
}
… which causes a …
New popup window opens showing the relevant snippet of Code Download Table of interest to the user … including …
Textbox for an optional emailee entry that can be filled in … to …
Set off Ajax/FormData methodology means …
function parentemailto(eto) {
if (eto.indexOf("@") != -1) {
var zhr=new XMLHttpRequest();
var zform=new FormData();
zform.append("inline","");
zform.append("to",eto);
zform.append("subj","RJM Programming Code Download Table part");
zform.append("body", reltoabs('<table' + webc.split('</table>')[0].split('<table')[1] + '</table>'));
zhr.open("post", "//www.rjmprogramming.com.au/HTMLCSS/emailhtml.php", true);
zhr.send(zform);
alert("Email sent to " + eto);
}
}
… to send off an Inline HTML Email report to the emailee … including …
Links of email can be clicked to get back to source code and other links back at the RJM Programming domain web server
… and … lo and behold … we saw a good use for the idea of …
download from “the net” to a Downloads folder on your computer or device … and more often than not …
you, the user, copies or renames this data to another location on your computer or device with command line or with operating system GUI
… and allowing for that second step above be programmatical with the most apt functionality that had ever passed our cotton pickin’ mind … our Code Download Table … wi’ all tho’ GETME’s!
But we don’t want to interfere too much with the Code Download Table “flow” here, so create up the top left 20 seconds worth of time (extendable by their actions) available to the user to create “download” attributes on all …
“a” links … with …
“href” attribute containing “GETME” …
but not “diff.php” … and …
“download” attribute (the attribute necessary to “download” rather than our default displaying of source code in a new webpage)
… plus no href attribute containing “?s=” either, for today’s purposes with a changedgetmelist.js external Javascript code file (that you can try out for yourself at this live run link) … via its new …
var dnprefix=decodeURIComponent(('' + localStorage.getItem('download_copy_to_folder')).replace(/^null$/g,'')); //.replace(/\+/g,' ').replace(/\\\\/g, '_').replace(/\//g, '_').replace(/\:/g, '_');
var delaymore=0;
var prefixask='<div id=firstask style="position:absolute;top:0px;left:0px;"> Download GETME? <input id=dpccb style=inline-block; type=checkbox onchange="dogetmes(document.getElementById(' + "'" + 'dpcis' + "'" + ').value);"></input> <input style=inline-block;width:300px; onclick="delaymore+=20000;" onblur="if (document.getElementById(' + "'" + 'dpccb' + "'" + ').checked) { dogetmes(document.getElementById(this.value); }" type=text id=dpcis placeholder="Optional Download Folder Later Copy to Place via Listener" value="' + dnprefix + '"></input></div>';
function dogetmes(dpprefix) {
delaymore+=20000;
var asis=document.getElementsByTagName('a');
if (dpprefix != dnprefix && 1 == 7) {
localStorage.setItem('download_copy_to_folder', dpprefix);
}
for (var iasis=0; iasis<asis.length; iasis++) {
if (asis[iasis].href.indexOf('diff.php') == -1 && asis[iasis].href.indexOf('?s=') == -1 && asis[iasis].href.indexOf('GETME') != -1) {
asis[iasis].download=dpprefix.replace(/\//g,'_').replace(/\\\\/g,'_').replace(/\:/g,'_') + asis[iasis].href.split('/')[eval(-1 + asis[iasis].href.split('/').length)];
}
}
}
function nomorepa() {
if (eval('' + delaymore) == 0) {
if (document.getElementById('firstask')) {
document.getElementById('firstask').innerHTML='';
}
} else {
setTimeout(nomorepa, eval('' + delaymore));
delaymore=0;
}
}
function lastdivpop() {
var wasih='';
if (document.getElementById('lastdiv')) {
if (document.getElementById('lastdiv').innerHTML == '') {
wasih=wasih;
setTimeout(lastdivpop, 3000);
} else if (document.getElementById('lastdiv').innerHTML.indexOf('firstask') == -1) {
wasih=document.getElementById('lastdiv').innerHTML;
document.getElementById('lastdiv').innerHTML=prefixask + wasih;
prefixask='';
setTimeout(nomorepa, 20000);
} else {
setTimeout(lastdivpop, 3000);
}
}
}
… and we’ve just “tweaked” (albeit, very importantly, in our books (… but the pamphlettes are still not playing ball)) to ensure no “file clobbering” takes place so that the Korn Shell now does …
suf=""
isuf=-1
while [ -f "${dpath}/${brest}${suf}" ]; do
((isuf=isuf+1))
suf="_${isuf}"
done
if [ ! -z "$suf" ]; then
echo "mv ${dpath}/${brest} ${dpath}/${brest}${suf} # `date`" >> download_to_place.out
mv ${dpath}/${brest} ${dpath}/${brest}${suf} >> download_to_place.out 2>> download_to_place.err
fi
But today is mainly about filling in the missing bits on the “server” side. This (need for a) “conduit” we referred to yesterday is because we accept no folder paths can be mentioned at the “server” end. Suppose, though, that the “non-pathed” filename we supply to an “a” link’s “download” attribute can be prefixed by a mildly mashed up version of that path we copy to from the Downloads folder of your “client” computer or device, as you perform a “download” via the clicking of an “a” link.
Well, at this blog we’d already started functionality to toggle the use or not of …
“a” links … with …
“href” attribute containing “GETME” …
but not “diff.php” … and …
“download” attribute (the attribute necessary to “download” rather than our default displaying of source code in a new webpage)
displaying of source code in a new webpage for GETME “a” links … versus …
use the changed PHPtoggle_download.php in conjunction with a changed good ‘ol TwentyTen Theme header.php as below …
<?php
if (outs == null) {
var dnprefix=decodeURIComponent(('' + localStorage.getItem('download_copy_to_folder')).replace(/^null$/g,'')).replace(/\+/g,' ').replace(/\\\\/g, '_').replace(/\//g, '_').replace(/\:/g, '_');
for (idmjk=0; idmjk<admjk.length; idmjk++) {
if (admjk[idmjk].href.indexOf('GETME') != -1 && admjk[idmjk].href.indexOf('diff.php') == -1) {
big = '----------------------GETME';
stuffs = newaspare.split('/');
if (dnprefix != '') {
admjk[idmjk].download = dnprefix + prestuffs[stuffs.length - 1];
} else {
admjk[idmjk].download = dnprefix + stuffs[stuffs.length - 1];
}
admjk[idmjk].title = "(Really download) " + admjk[idmjk].title + ' ... welcome to the long hover functionality that shows allows for a Download Mode for the blog that can be toggled';
admjk[idmjk].onmouseover = " getDownloadMode(); ";
admjk[idmjk].onmouseout = " yehBut(); ";
admjk[idmjk].ontouchstart = " getDownloadMode(); ";
admjk[idmjk].ontouchend = " yehBut(); ";
}
} else if (admjk[idmjk].href.indexOf('GETME') != -1 && origcafd < 0) { //!cafd) {
xp=admjk[idmjk].href.split("GETME");
prexp=xp[0].split("/");
postprexp=prexp[-1 + prexp.length].split(".");
extis = postprexp[-1 + postprexp.length].replace(/_/g,"").replace(/-/g,"").replace(/GETME/g,"");
outs="//www.rjmprogramming.com.au/getmelist.htm?topoff=150&tsp=" + (Math.floor(Math.random() * 1999900) + 100) + "#" + postprexp[0] + "." + postprexp[-1 + postprexp.length].replace(extis,"").replace(extis,"").replace(extis,"") + "GETME" + extis;
aorig=admjk[idmjk].innerHTML;
selbitis=allthecombos((admjk[idmjk].href + '=').split('=')[1].split('&')[0]);
admjk[idmjk].innerHTML=admjk[idmjk].innerHTML.replace(".","<span data-alt='" + outs + "' id='spn" + cafd + "' title=\" + Code Download Table\" onclick=\"if (cafd == cafd) { cafd=" + cafd + "; changeasfordownload(); } else { window.open('" + outs + "','_blank','top=100,left=100,width=500,height=500'); } return false; \"><select onchange=\" if (this.value.length > 0) { window.open(this.value,'_blank'); } return false; \" style='margin-bottom:0px;width:40px;' id='sel" + cafd + "'><option value=>⚫</option>" + selbitis + "</select></span>");
if (aorig == admjk[idmjk].innerHTML && admjk[idmjk].innerHTML.indexOf('er posts') == -1) admjk[idmjk].innerHTML=admjk[idmjk].innerHTML.replace(" ","<span data-alt='" + outs + "' id='spn" + cafd + "' title=\" + Code Download Table\" onclick=\"if (cafd == cafd) { cafd=" + cafd + "; changeasfordownload(); } else { window.open('" + outs + "','_blank','top=100,left=100,width=500,height=500'); } return false; \"><select onchange=\" if (this.value.length > 0) { window.open(this.value,'_blank'); } return false; \" style='margin-bottom:0px;width:40px;' id='sel" + cafd + "'><option value=>⚪</option>" + selbitis + "</select></span>");
cafd++;
} else if ((admjk[idmjk].innerHTML.indexOf('live run') != -1 || admjk[idmjk].title.toLowerCase().indexOf('click picture') != -1) && origcafd < 0) { //!cafd) {
outs="//www.rjmprogramming.com.au/slideshow.html#tuts";
admjk[idmjk].innerHTML=admjk[idmjk].innerHTML.replace(" ","<span data-alt='" + outs + "' id='spn" + cafd + "' title=\" + Cut to the Chase ... see the blog post list related to live runs and slideshows ... ie. the main point of the blog posting\" onclick=\"if (cafd == cafd) { cafd=" + cafd + "; changeasfordownload(); } else { window.open('" + outs + "','_blank','top=100,left=100,width=650,height=100'); } return false; \">✂</span>");
cafd++;
}
}
}
?>
… to, depending on whether the user specifies in the “All Posts” toggling’s Javascript prompt window presented, specifies a new comma separated “client folder of interest to copy to” place (stored in window.localStorage), will …
download with the GETME to the Downloads folder and copy off to the specified folder of interest (backing up as necessary) … versus …
the default download mode downloads to the Downloads folder without the GETME parts
See these changes in action below, contextualizing “server” and “client” codes in the full picture of assisted Downloads (copied on to a folder of the user’s interest) …
Downloading from “the net” (“server land”) to your computer or device (“client land”) is a big part of the online experience and the sharing of data over the world wide web. But have you ever wondered about the two step design of …
download from “the net” to a Downloads folder on your computer or device … and more often than not …
you, the user, copies or renames this data to another location on your computer or device with command line or with operating system GUI
… ? Why not allow the “server” side define where it can download to on the “client”? Well, that would be a security nightmare, allowing a highjacking of mission critical files on your computer or device. So, I get it, that is a “no no”. But could we have a controlled “arrangement” between …
… ? We think that sounds reasonable and so, today, we start our (two parts or more) mini-project (making step 2 above be considered to be programmatically handled, sometimes) designing a Korn Shell (“client” side) listener to suit our macOS “client” computer, executed as a background process via …
But what is the conduit, if the “server” web applications/pages cannot define a destination folder other than the macOS Downloads folder for the user involved? Well, that is where we need either …
Korn Shell interactive input (via read command) … or …
… to define a “client land” folder to copy to (from the user’s Download folder (receiving the downloaded data).
That first Korn Shell read command interactive input was interesting to us for a command backgrounded via the “&” command suffix. But if stdin and stdout are not mentioned in the command you can answer this interactive input and then the processing the Korn Shell performs proceeds in the background. Exactly what we were hoping for, but weren’t sure that this was the case!
The picture is filled in better tomorrow as we discuss the conduit in more detail tomorrow.
If this was interesting you may be interested in this too.
HTML5 Web Audio Piano Keyboard Highlighting Tutorial
The “difference word” in today’s blog posting title is “highlighting”. Whether it be …
the highlighting of text … perhaps ahead of a Copy operation with modern GUIs … or …
the highlighting of some HTML element
… a lot of the time, we tend to think of it as on “overlay” operation. Something that takes place on top ofin addition to something that has already occurred. We see this so often we have these twin concepts going regarding “the getting towards coding innards of” web design. We pare lots of the issues down to being one of …
“reveal” … and for “reveal”, ever since the advent of the HTML5 details/summary “dynamic duo” … well … what else do you need?!
But with “overlay” one there are such a myriad of uses and ways to go about it, we’ve forgotten to say the word “overlay”, often, for the manner in which we solve clientside issues. Think “CSS meets Javascript DOM” ideas of …
position: absolute;
left: [x]px; top: [y]px;
opacity: [0 to 1 see throughness];
z-index: [coming out of the page towards you factor];
… and these can all/some be part of an “overlay” solution of some sort. Today’s uses all but the opacity option above to add some colourful Piano Key Animation goings on, optionally (as much as anything because it can slow the piano down too much with its extra processing, at times) user chosen for our revisited Piano Playing web application, best used with the Web Audio clientside API, which, we’re hoping, improves on the version we had with HTML5 Web Audio Piano Keyboard Tutorial some time ago now.
To get this going, we wrote some (document.body onload event called) Javascript to overlay (underlay, arriba) inhouse HTML div elements, initially directly under ( ie. z-index: -1; ), imagemap HTML area element counterparts via …
… and then intervene in two places in the Javascript “play” function to use dynamic Javascript DOM ways to change the relevant [newDivElement].style.zIndex=’12’ ( for a little less than a second before reverting back to -1 ) in code like …
The user interface allows the user to choose an (optional to change) “overlay colour” via a colour picker tool, and, we’re not sure why, but somehow, we get a kick out of occasionally revisiting a means by which, in Javascript, you can create “opposing colours”, as per …
function recolour(tothiscol) {
var cthings='01234567890abcdef';
var ivorycol=tothiscol.toLowerCase();
var ebonycol='', ij;
for (var ii=0; ii<ivorycol.length; ii++) {
if (ivorycol.substring(ii).substring(0,1) == '#') {
ebonycol+=ivorycol.substring(ii).substring(0,1);
} else {
ij=eval(eval(eval('' + cthings.split(ivorycol.substring(ii).substring(0,1))[0].length) + 8) % 16);
ebonycol+=cthings.substring(ij).substring(0,1);
}
}
var dvs=document.getElementsByTagName('div');
for (var ijkh=0; ijkh<dvs.length; ijkh++) {
if (('' + dvs[ijkh].className) == 'ivory') {
dvs[ijkh].style.backgroundColor='' + ivorycol;
} else if (('' + dvs[ijkh].className) == 'ebony') {
dvs[ijkh].style.backgroundColor='' + ebonycol;
}
}
}
… web application to, for our non-mobile platform users, introduce a keyboard set of ways to play chords on the fly based on the chromatic scale idea that …
an octave up is represented by “12” (in our (base36 ie. 0-9,a-z) interfacing, “c”) …
an octave down is represented by ctrl/control key “12” (in our interfacing, ctrl/control key “c”)
var areas=[];
var KEYDN_space = false;
var KEYDN_shift = false;
var KEYDN_ctrl = false;
var notediff=[0];
var inoted=0;
var stsarr=[];
var istsarr=0;
var cist='';
var whatx='';
Setting up the “onkeydown” event and readying “onload” event logic change …
The changedpiano.htm‘s live run link can be used to try this out, albeit the changes only work for non-mobile and not on all the web browsers out there, but stay tuned for some alternative ideas in this line of thinking, in days to come.
Next stop “Work out a Protocol to Compose Chords”, maybe, into the future …
… we’re back to the future (tee hee) today. And in the spirit of “I never promised you a Rose Garden” we had to settle for “near to music chords” with today’s endeavours. But look at it this way … you may have dodged a rose thorn bullet here!?
It is a personal favourite programming choice of ours to look for cute “delimitation” solutions, an example being PHP Geo Map Google Chart Offset Tutorial. And one of our favourites is to add complexity by turning what used to be an integer data “type” into a float (ie. real number with decimal (fractional) parts called the “mantissa”) data “type” (eg. starting with 60 as Middle C, and turning that into 60.048 for Middle C and an Octave C lower, or 60.048072 for Middle C and an Octave C lower and higher). Extra joy comes if that resultant “number” (covering both of those data types in scope) when “rounded” would result in the original “integer” number anyway. Today we have such joy (because the highest note number of our piano is only 108 … much less than 499 even) as we allow the user to, within their textarea “composing pallette” now say that a …
normal number is a note (and mantissa sets of 3 characters (zero left padded) play notes close behind, like chords)
In order to make this happen we intervene where a composition takes Javascript variable form and encase that into a Javascript function return value “mapping” as per …
function insong(sheetmusic) { // assumes comma separators
if (sheetmusic != "") {
// add a suffix of + if two hands are playing together
// normal word is a speed descriptor
// normal number is a note (and mantissa sets of 3 characters (zero left padded) play notes close behind, like chords)
// -1 is crotchet, -2 is minum, -0.5 is quaver, -0.25 is semi-quaver etcetera
// 0 (alone) is for a rest of the duration above
// 0127 is normal loudness, etcetera
var done="", offset=0.0, offset2=0.0, planbit="", isrest=false, delaydelim='', notedelim='', curnote=-1, curvelocity=127, curdelay=-1, jk, ijk, prevvelocity=-1, prefix="", curval=1, kji=0, allhhh, bitshhbefore, notes, curnotes="", delays, curdelays="";
var plan=" MIDI.loadPlugin({ \n";
// etcetera etcetera etcetera
for non-mobile platforms (where the keyboard is that independent thaing, whereas on mobile, it interferes with web application workflows) … because it facilitates …
the chance to play multiple notes (almost) at the same time … as per a musical chord
… for all practical purposes, an important thing you’d want to be able to do with a piano playing web application (sadly only for non-mobile platforms).
And so, we’re using characters from the Ascii table …
the numbers 1 through to 7 … and …
the letters A through to W uppercase … and …
the letters a through to w lowercase … for the piano ivory (white) keys …
ahead of corresponding key above for an associated sharp click the Ctrl or Control key … for the piano ebony (black) keys
… to cover the needs for a keyboard method of reaching all 87 piano keys of interest on our (online digital) piano, as per …
var kqueue=[], ikqueue=-1;
var eioisaltKey=false;
var eioisctrlKey=false;
var okn='';
HTML5 Web Audio Mudcube Piano Integration Mobile Debug Tutorial
Yesterday’s HTML5 Web Audio Mudcube Piano Integration Tutorial was tested on non-mobile platforms, but with mobile (iOS) work we sometimes reach different parts of the Javascript client code, the reason being that the non-mobile platforms do not require that “button touch event” intervention, and they can just go ahead and load any Web Audio functionality parts during the webpage onload period, and use it or not, at leisure. We noticed yesterday, “no go” for an iPad, which almost certainly means “no go” for iPhone as well. What to do? Similar to HTML5 Web Audio Piano Mobile Safari Web Inspector Debug Tutorial as per …
Did you notice the use of … anyone, anyone? … yes, Augusta Ada King … console.log([message]) calls all over the place. Could it be that “alert” calls would be too disruptive? That’s right. Do you remember, perhaps, in science at school, how we learnt that looking at a photon was difficult because we would be interfering in how that photon would be in nature, and so we can not conclude anything categorically because of our interference. Well, “timing issues” are a bit the same, but console.log([message]) calls will not interfere and yet pass on information to … anyone, anyone? … yes, Grace Brewster Murray Hopper … a web inspector. Like Safari’s we think, given we’re working with …
an iPhone to test on
a MacBook Pro to facilitate the testing … connected via …
(the ubiquitous Apple white) lead … hardware wise … and …
the Safari web browser (on both devices, running our “piano web application” on the iPhone Safari web browser) … software wise … and within that browser’s …
Developer menu can get us to (the iPhone incarnation of the) Web Inspector … within which the …
Console tab can show us errors and warnings and information (which we can augment ourselves via our console.log[message]) Javascript DOM calls in the HTML/Javascript/CSS code of our “piano web application” and its “web audio interfacing” friend
… but if you’ve not done this in the past … yes we have thanks …
… except, today, “an iPhone and iPad to test on”. We found a few problems that the fixes for, allowed the Web Audio option for the piano web application to start working on the iPad and iPhone, for the “composing” parts as well.
… basis. But this integration to an older “piano application” incarnation, that used MIDI interfacing, has additional “composing” functionality we’re keen to “lassoo” into the integrations, because the integration of Web Audio will mean we can compose music on mobile platforms (we hope by tomorrow), if that’s your preference. On this front, do you remember us working out the haunting and beautiful theme to the music to Merry Christmas, Mr Lawrence when we presented HTML/Javascript/PHP Compose Music Makeover Tutorial … as per …
? Well, we’ve used that tune to test run our integration, where it wasn’t just the case of plugging in the same logic of the integration of HTML5 Web Audio Piano Mobile Safari Web Inspector Debug Tutorial, alas. The MIDI plugin of the mudcube incarnation does some clever client “sleeping” to do its thaing, so we have to work out quite a bit of setTimeout (timer) rearranging to simulate those “smarts”.
… for transcribed music or brand new compositions like …
… with which we hope you might now be able to work music compositions (at least on non-mobile for today), via the Web Audio API that came in with HTML5.
HTML5 Web Audio Piano Mobile Safari Web Inspector Debug Tutorial
There were problems peculiar to mobile platforms involved in the work of yesterday’s HTML5 Web Audio Piano Mobile Tutorial. But just how did we arrive at a solution? We can tell you now a placement of Javascript “alert” popup windows is inadequate for such an involved issue that cannot be simulated on our usual MacBook Pro laptop “home base” computer. So what to do?
There’s a big clue in the difference reports of yesterday …
Did you notice the use of … anyone, anyone? … yes, Augusta Ada King … console.log([message]) calls all over the place. Could it be that “alert” calls would be too disruptive? That’s right. Do you remember, perhaps, in science at school, how we learnt that looking at a photon was difficult because we would be interfering in how that photon would be in nature, and so we can not conclude anything categorically because of our interference. Well, “timing issues” are a bit the same, but console.log([message]) calls will not interfere and yet pass on information to … anyone, anyone? … yes, Grace Brewster Murray Hopper … a web inspector. Like Safari’s we think, given we’re working with …
an iPhone to test on
a MacBook Pro to facilitate the testing … connected via …
(the ubiquitous Apple white) lead … hardware wise … and …
the Safari web browser (on both devices, running our “piano web application” on the iPhone Safari web browser) … software wise … and within that browser’s …
Developer menu can get us to (the iPhone incarnation of the) Web Inspector … within which the …
Console tab can show us errors and warnings and information (which we can augment ourselves via our console.log[message]) Javascript DOM calls in the HTML/Javascript/CSS code of our “piano web application” and its “web audio interfacing” friend
… but if you’ve not done this in the past, there is a fair bit to do to get up and running doing this. In setting this up, we were stuck for a while with connections but blank console tab screens. Why? Well, you need both iPhone and MacBook Pro to have any outstanding operating system updates attended to. Then, given that, we’d recommend following the excellent advice of How to Activate the iPhone Debug Console, thanks …
On the iPhone (setting up wise) …
Tap the Settings icon on the iPhone Home screen.
Scroll down until you reach Safari and tap on it to open the screen that contains everything related to the Safari web browser on your iPhone, iPad, or iPod touch.
Scroll to the bottom of the screen and tap Advanced menu.
Toggle the slider next to Web Inspector to the On position.
On the MacBook Pro (setting up wise) …
Click Safari in the menu bar and choose Preferences.
Click the Advanced tab
Select the box next to Show Develop menu in menu bar.
Exit the settings window.
Click Develop in the Safari menu bar and select Show Web Inspector.
… and we’ve got for you some screenshots of our “goings on” sorting out our “piano web application” problems on mobile (at least iOS) platforms with today’s PDF “stream of consciousness” presentation. We hope it helps you out, or gets you down the road of digging into an issue you have with an HTML web application on an iOS device.
You guessed it! The software integrations of yesterday’s HTML5 Web Audio Piano Tutorial had issues with the mobile platforms. Do fish swim? Do axolotl have two L’s and two O’s? Yes, yes and yes.
With our iPad and iPhone testing (and we’ll go more into that tomorrow) we found timing issues as to when exactly to call that window onload init function. Which beggars the question, being that window and document are two different objects of a webpage “is window onload the same as document body onload?” We’d always assumed so, and trying “not to be in that bubble of our own existence”, did read at least the first link of that previous Google search to feel appeased. It seems so … but we digress.
Why is this timing important? As we’ve said many times, Apple‘s iOS (mobile operating system) and audio are super sensitive to trying to eradicate “sounds on (webpage) load”, we take it, and want to only allow for audio easily via a “touch” event off a button (made by a human … and, we hope, all axolotls), that’s why. Get the timing wrong, and we weren’t, on mobile platforms, creating the buttons needed to touch in order to make the 87 different notes on our piano.
… in these early days, before we give up on the mobile platform issue compromises we have so far, is no exception.
In broad brush terms we …
call from the changedpiano.htm‘s piano web applicationthe changedweb_audio.htm (Web Audio API interfacer) in an iframe as per (the HTML) …
<iframe class=ask title='versus Audio Web' frameborder=0 scrolling='no' style='overflow:hidden;background-color:orange;display:inline-block;width:500px;height:28px;max-height:28px;' width=500 height=28 src='web_audio.htm?vscaseyrule=y'></iframe>
Expecting a sound tonality difference between the methods? No, a computer creates the sound the same way via the same sound frequency, and if the response time is reasonable we couldn’t hear big rhythm changes that you might expect with the parent/child “chatter” required for all this.
Feel free to try your piano playing scales and arpeggios and chords with today’s more integrated live run link.
There is another two pronged improvement approach again today building on HTML5 Web Audio Overlay Tutorial‘s two pronged approach to the previous two pronged approach … which makes for a great fork for spaghetti but we digress … the prongs today being …
first, and like yesterday, allow for clientside HTML to do what serverside PHP usually does for us … handle large amounts of data as PHP can do using its $_POST[] approach … we’re still calling “Overlay Iframe Remembering” … and add to …
child iframe src= mode of use … but also with, new to today …
… because (am not absolutely sure why as yet but) it solves the problem with …
… non-mobile/Safari/fill in “Audio Content” form/including a Duration/click “Web Audio Run” button …
… didn’t automatically start any audio, though other non-mobile web browsers do …
… and as you may imagine this needs some delimitation explanations that show below …
function takealook(fo) {
var noneed=true;
var htmlis='';
var nsuffix='';
if (document.getElementById('url1').value.length > 500) { noneed=false; }
if (document.getElementById('url2').value.length > 500) { noneed=false; }
if (document.getElementById('url3').value.length > 500) { noneed=false; }
if (document.getElementById('url4').value.length > 500) { noneed=false; }
if (document.getElementById('durationget').value.length > 0) { nsuffix='¬oka=secret'; noneed=false; } else { isrc=' src='; }
if (source_valid()) {
if (noneed) { return true; }
if (isrc == ' srcdoc=') {
if (navigator.userAgent.match(/Android|BlackBerry|iPhone|iPad|iPod|Opera Mini|IEMobile/i)) {
document.getElementById('huhb').style.display='inline-block';
document.getElementById('diframe').innerHTML="<iframe id=myi style='opacity:1.0;position:absolute;top:0px;left:0px;z-index:-" + eval(1 + eval('0' + zi)) + ";width:100%;height:100vh;' srcdoc=></iframe>";
} else {
document.getElementById('diframe').innerHTML="<iframe id=myi style='opacity:1.0;position:absolute;top:0px;left:0px;z-index:-" + eval(1 + eval('0' + zi)) + ";width:100%;height:100vh;' srcdoc=></iframe>";
}
if (documentURL.indexOf('#') == -1) { document.getElementById('divbody').style.opacity='1.0'; } document.getElementById('myi').srcdoc='<!doctype html><html><head>' + document.head.innerHTML.replace(/document\.URL/g,"'" + documentURL.split('#')[0].split('?')[0] + "?zi=" + eval(1 + eval('0' + zi)) + nsuffix + "¬oka=" + encodeURIComponent(notoka.trim()) + "'").replace(/\'0\.2\'/g,"'1.0'") + '</head><body>' + document.body.innerHTML.replace(/document\.URL/g,"'" + documentURL.split('#')[0].split('?')[0] + "?zi=" + eval(1 + eval('0' + zi)) + nsuffix + "¬oka=" + encodeURIComponent(notoka.trim()) + "'").replace(/\'0\.2\'/g,"'1.0'") + '</body></html>';
} else {
if (documentURL.indexOf('#') == -1) { document.getElementById('divbody').style.opacity='0.2'; }
document.getElementById('diframe').innerHTML="<iframe style='position:absolute;top:0px;left:0px;z-index:" + eval(1 + eval('0' + zi)) + ";width:100%;height:100vh;' src='" + documentURL.split('#')[0].split('?')[0] + "?zi=" + eval(1 + eval('0' + zi)) + nsuffix + "'></iframe>";
}
} else {
if (notoka.trim().toLowerCase() == 'secret') { noneed=false; }
if (noneed) { return true; }
if (isrc == ' srcdoc=') {
if (navigator.userAgent.match(/Android|BlackBerry|iPhone|iPad|iPod|Opera Mini|IEMobile/i)) {
document.getElementById('huhb').style.display='inline-block';
document.getElementById('diframe').innerHTML="<iframe id=myi style='opacity:1.0;position:absolute;top:0px;left:0px;z-index:-" + eval(1 + eval('0' + zi)) + ";width:100%;height:100vh;' srcdoc=></iframe>";
} else {
document.getElementById('diframe').innerHTML="<iframe id=myi style='opacity:1.0;position:absolute;top:0px;left:0px;z-index:-" + eval(1 + eval('0' + zi)) + ";width:100%;height:100vh;' srcdoc=></iframe>";
}
if (documentURL.indexOf('#') == -1) { document.getElementById('divbody').style.opacity='1.0'; } document.getElementById('myi').srcdoc='<!doctype html><html><head>' + document.head.innerHTML.replace(/document\.URL/g,"'" + documentURL.split('#')[0].split('?')[0] + "?zi=" + eval(1 + eval('0' + zi)) + "¬oka=" + encodeURIComponent(notoka.trim()) + "'").replace(/\'0\.2\'/g,"'1.0'") + '</head><body>' + document.body.innerHTML.replace(/document\.URL/g,"'" + documentURL.split('#')[0].split('?')[0] + "?zi=" + eval(1 + eval('0' + zi)) + "¬oka=" + encodeURIComponent(notoka.trim()) + "'").replace(/\'0\.2\'/g,"'1.0'") + '</body></html>';
} else {
if (documentURL.indexOf('#') == -1) { document.getElementById('divbody').style.opacity='0.2'; }
document.getElementById('diframe').innerHTML="<iframe style='position:absolute;top:0px;left:0px;z-index:" + eval(1 + eval('0' + zi)) + ";width:100%;height:100vh;' src='" + documentURL.split('#')[0].split('?')[0] + "?zi=" + eval(1 + eval('0' + zi)) + "¬oka=" + encodeURIComponent(notoka.trim()) + "'></iframe>";
}
}
return false;
}
… adding another option to “Overlay Iframe Remembering” types of solutions, we figure … cute in the sense that all this is clientside HTML/Javascript/CSS
mobile platform considerations (in our tests of iOS iPad and iPhone) …
allowing for a button press “touch” event (“touchstart” for us, but read somewhere that they liked “touchend”) to trigger the AudioContext setup
taking away the “capture” property of our browser buttons so that the mobile platform user can browse for an existant media file or capture that media
we try to allow video media to be played in that video element should the user choose a video media file as their audio media choice which tends to be the way for the “capture” property of a mobile user input type=file browser button
Did you get from the code snippets how this “Overlay Iframe Remembering” works by storing the large amounts of data in an overlayed “layer” of webpage, both webpage layers “clientside” by nature and available datawise to each other in a parent/child (layer1WebpageParent/layer2OverlayedIframeWebpageChild) arrangement, that iframe being populated via a src= scenario getting the “overlay” to populate itself or help that “overlay” along (perhaps it’s that period after lunch digesting the caviar?!) by supplying its content via srcdoc= usage? Again, perhaps it is easier to see it in action at this live run link.
Again, in building on yesterday’s HTML5 Web Audio Duration Tutorial two pronged approach, we have another one today, those approaches involving …
first allow for clientside HTML to do what serverside PHP usually does for us … handle large amounts of data as PHP can do using its $_POST[] approach … we’re going to call “Overlay Iframe Remembering” … whereby the
navigational form gets a new id=waform onsubmit=’return takealook(this);’ …
function takealook(fo) {
var noneed=true;
var nsuffix='';
if (document.getElementById('url1').value.length > 500) { noneed=false; }
if (document.getElementById('url2').value.length > 500) { noneed=false; }
if (document.getElementById('url3').value.length > 500) { noneed=false; }
if (document.getElementById('url4').value.length > 500) { noneed=false; }
if (document.getElementById('durationget').value.length > 0) { nsuffix='¬oka=secret'; noneed=false; }
if (source_valid()) {
if (noneed) { return true; }
document.getElementById('divbody').style.opacity='0.2';
document.getElementById('diframe').innerHTML="<iframe style='position:absolute;top:0px;left:0px;z-index:" + eval(1 + eval('0' + zi)) + ";width:100%;height:100vh;' src='" + document.URL.split('#')[0].split('?')[0] + "?zi=" + eval(1 + eval('0' + zi)) + nsuffix + "'></iframe>";
} else {
if (notoka.trim().toLowerCase() == 'secret') { noneed=false; }
if (noneed) { return true; }
document.getElementById('divbody').style.opacity='0.2';
document.getElementById('diframe').innerHTML="<iframe style='position:absolute;top:0px;left:0px;z-index:" + eval(1 + eval('0' + zi)) + ";width:100%;height:100vh;' src='" + document.URL.split('#')[0].split('?')[0] + "?zi=" + eval(1 + eval('0' + zi)) + "¬oka=" + encodeURIComponent(notoka.trim()) + "'></iframe>";
}
return false;
}
… where if noneed ends up as false we perform some overlay favourites … building on …
textbox HTML design changes from …
<input style='display:inline-block;background-color:#f0f0f0;' type=text name=url2 title='Audio URL 2' value='./one_to_fiftynine.m4a'></input>
… we see for web applications, two primary source “partitions”, those being …
around the “net” (in the server wooooooorrrrrlllllld, in the public areas of the Internet, which are not in “the dark web”, that is) via an absolute URL (to the same domain or beyond) and/or relative URL (in relation to the URL “home” place on the web server of the same domain as where you launched it … which we catered for yesterday, though quietly we’d have allowed absolute URLs too, it’s just that cross-domain restrictions make us shy about publicizing that) … versus …
on the client computer (or device)
… and, yes, for all those who guessed we’d try to cater for image and/or video data coming from this client source, you are correct …
Did you get from the code snippets how this “Overlay Iframe Remembering” works by storing the large amounts of data in an overlayed “layer” of webpage, both webpage layers “clientside” by nature and available datawise to each other in a parent/child (layer1WebpageParent/layer2OverlayedIframeWebpageChild) arrangement? Perhaps it is easier to see it in action at this live run link.
first allow for the reduction of use of Javascript eval involving statements that assign values (ie. eval statement contains an “=” sign) (but will continue on with it helping out with some mathematics) … in favour of using arrays instead …
var source=[];
var sourcep=[];
var notoka=location.search.split('notoka=')[1] ? (" " + decodeURIComponent(location.search.split('notoka=')[1]).split('&')[0]) : "";
if (notoka == "") {
for (var iii=1; iii<=4; iii++) {
source.push(null);
sourcep.push(false);
}
}
schedule an execution run of button presses to play Audio ahead of time … because with a duration we can piggy back the audios (so be able to synchronize our efforts better) … and we also …
open the Audio content up to the “server” woooorrrrlllld (via the “reveal” friendly HTML details/summary element combination) by allowing the user to specify their own 4 audio URLs (and one synchronized video one) along with 4 button labels presented in an HTML form method=GET to renavigate with this user supplied content back to the body onload scenario
If you’ve completed a successful “proof of concept” stage to a project, it can be tempting at this early stage, even before applying it to the specific intended software integration target, to consider ways to “genericize” that application, and so it is for us, here, with yesterday’s Spliced Audio Number Announcements Tutorial, as shown below, that we feel this could come along to be applied for other purposes. We have no doubt the exercise of doing this serves at least three good purposes …
slow it down a bit before rushing to “software integrate”, as patience can be good here
learn more about what’s possible, and what isn’t, to do with the scope of your planning and thinking
other application may, too, benefit from this “early days” “genericization” of a potential plugin component piece of HTML and Javascript code
In this early stage of “genericization” thoughts, we think that with our project we want to keep intact these ideas …
there’ll be up to 3 “columns” of ideas to piece together an audio message from its constituent parts, like with those Sydney train platform announcements we’ve talked about before
there’ll be 3 soundfiles mapped to most of the usage regarding these 3 “columns”
there’ll be the possibility for silence to be an option in each “column”
there’ll be the mechanism by which the user can define their own “Title” and “Subtitle” and 3 “column” headings themselves
there’ll be 2 leftmost “columns” that define counting numbers whose ranges can be defined by the user, where, for now, the timing of sounds goes that sounds start at [number].4 seconds and plays for 1.5 seconds
there’ll be minimum and maximum special case entries available for user definition in the leftmost “column” that calls on the fourth soundfile, where, for now, the timing of sounds goes that sounds start at 0 seconds and 2 seconds respectively and plays for 2 seconds
there’ll be a minimum special case entry available for user definition in the middle “column” that calls on a sound from the third soundfile, where, for now, the timing of sounds goes that sounds start at 3.1 seconds and plays for 1.8 seconds
there’ll be 1 rightmost “column” that can have three entries defined
And that is as far as we go with “genericizations”, at this stage, with our project.
In our experience, what Javascript function is a big friend of “genericization”? We’d say Javascript eval function is our favourite here.
It’s funny to think that our HTML and Javascript and CSS audio_1_59.htm, vastly changed from yesterday as per this link, functions exactly the same in its default form, and you can continue to enjoy its accompanying default live run link, but it can, through the use of complex URLs (only, just at this early stage) be made to look quite different, with the same code, as you can see with this complex live run.
So, in summary, this leaves us with many more “live run” options, those being …
We’ve got a “proof of concept” tutorial for you today, because we’ve got an idea for something, as we said some time back at Splicing Audio Primer Tutorial …
The first was a simulation of those Sydney train public announcements where the timbre of the voice differs a bit between when they say “Platform” and the “6” (or whatever platform it is) that follows. This is pretty obviously computer audio “bits” strung together … and wanted to get somewhere towards that capability.
… that will probably be blimmin’ obvious to you should you be a regular recent reader at this blog.
… because you can work Cortana without the voice recognition part, if you like, or if you have the urge to run for the nearest cupboard before being caught talking into a computer (microphone)
? Well, today, we’d like you to be patient about the lack of audio quality with our home made audio (see excuse 2 above) bit we are mainly interested in “proof of concept” issues (see excuse 1 above).
… we do again today. On doing this we realized the recordings were not loud enough, so started down the road of R&D on this and got to the very useful Increase Audio Volume website tool that helped a little, and this manifests itself if/when you run our live run today, that if you pick “minute” numbers less than or equal to “30” they are a better better in volume than others, with the “Trial Version” of this software helping you out with “half file” enhancements. “Proof of concept”, remember? And so the aspects you’d change for your own purposes, are …
the content (and more than likely, names) of audio files mentioned below …
arrays of audio files …
var audiomedia=["one_to_fiftynine.m4a","past_quarterto.m4a","am_pm.m4a"];
var midmedia=["midnight_midday.m4a"];
… and it should be noted here, that a separate file for each unique sound, could be a good alternative design, and would stop failures to do with the slow loading speed of the home web server causing audio misfiring … and would mean, below, that “astart” is always “0” and “delay” should be set to the audio object’s duration parameter
variables “astart” and “delay” as per example …
} else if (thingis.toLowerCase().indexOf('clock') != -1) {
oaudio.src=audiomedia[i]; astart=eval("3.1");
delay=1.8;
… where “astart” reflects a start of play value and “delay” represents a length of play scenario in seconds, as we got going in the past when we presented Spliced Audio/Video Overlay Position Tutorial as shown below, where you can read more about the HTML5 Audio objects we used with this “proof of concept” project
Please note with the recording of “one_to_fiftynine.m4a”, that records numbers from 1 to 59, via QuickTime Player, we relied on the recording timer, to time our number recording with a second of duration to make the HTML and Javascript coding a lot easier!
So, as you can see, this is “proof of concept” preparation, and of you want to try it yourself, perhaps you’d like to start with a skeleton of today’s HTML and Javascript audio_1_59.html as a starting point?!
Today we’ve written a third draft of an HTML and Javascript web application that splices up to nine bits of audio or video or image input together, building on the previous Spliced Audio/Video/Image Overlay Tutorial as shown below, here, and that can take any of the forms …
audio file … and less user friendly is …
text that gets turned into speech via Google Translate (and user induced Text to Speech functionality), but needs your button presses
video
image … and background image for webpage
… for either of the modes of use, that being …
discrete … or “Optional”
synchronized … or “Overlay”
… all like yesterday, but this time we allow you to “seek” or position yourself within the audio and/or video media. We still all “fit” this into GET parameter usage. Are you thinking we are a tad lazy with this approach? Well, perhaps a little, but it also means you can do this job just using clientside HTML and Javascript, without having to involve any serverside code like PHP, and in this day and age, people are much keener on this “just clientside” or “just client looking, plus, perhaps, Javascript serverside code” (ala Node.js) or perhaps “Javascript clientside client code, plus Ajax methodologies”. In any case, it does simplify design to not have to involve a serverside language like PHP … but please don’t think we do not encourage you to learn a serverside language like PHP.
While we are at it here, we continue to think about the mobile device unfriendliness with our current web application, it being, these days, that the setting of the autoplay property for a media object is frowned upon regarding these mobile devices … for reasons of “runaway” unknown charge issues as you can read at this useful link … thanks … and where they quote from Apple …
“Apple has made the decision to disable the automatic playing of video on iOS devices, through both script and attribute implementations.
In Safari, on iOS (for all devices, including iPad), where the user may be on a cellular network and be charged per data unit, preload and auto-play are disabled. No data is loaded until the user initiates it.” – Apple documentation.
A link we’d like to thank regarding the new “seek” or media positioning functionality is this one … thanks.
Also, today, for that sense of symmetry, we start to create the Audio objects from now on using …
document.createElement("AUDIO");
… as this acts the same as new Audio() to the best of our testing.
For your own testing purposes, if you know of some media URLs to try, please feel free to try the “overlay” of media ideas inherent in today’s splice_audio.htmlive run. For today’s cake “prepared before the program” we’ve again channelled the GoToMeeting Primer Tutorial which had separate audio (albeit very short … sorry … but you get the gist) and video … well, below, you can click on the image to hear the presentation with audio and video synchronized, but only seconds 23 through to 47 of the video should play, and the presentation ending with the image below …
We think, though, that we will be back regarding this interesting topic, and hope we can improve mobile device functionality.
Today we’ve written a second draft of an HTML and Javascript web application that splices up to nine bits of audio or video or image input together, building on the previous Splicing Audio Primer Tutorial as shown below, here, and that can take any of the forms …
audio file … and less user friendly is …
text that gets turned into speech via Google Translate (and user induced Text to Speech functionality), but needs your button presses
video
image … and background image for webpage
… for either of the modes of use, that being …
discrete … or “Optional”
synchronized … or “Overlay”
The major new change here, apart from the ability to play two media files at once in our synchronized (or “overlayed”) way, is the additional functionality for Video, and we proceeded thinking there’d be an Javascript DOM OOPy method like … var xv = new Video(); … to allow for this, but found out from this useful link … thanks … that an alternative approach for Video object creation, on the fly, is …
var xv = document.createElement("VIDEO");
… curiously. And it took us a while to tweak to the idea that to have a “display home” for the video on the webpage we needed to …
document.body.appendChild(xv);
… which means you need to take care of any HTML form data already filled in, that isn’t that form’s default, when you effectively “refresh” the webpage like this. Essentially though, media on the fly is a modern approach possible fairly easily with just clientside code. Cute, huh?!
Of course, what we still miss here, is the upload from a local place onto the web server, here at RJM Programming, capability, which we may consider in future, and that some of those other synchronization of media themed blog postings of the past, which you may want to read more, for this type of approach.
In the meantime, if you know of some media URLs to try, please feel free to try the “overlay” of media ideas inherent in today’s splice_audio.htmlive run. We’ve thought of this one. Do you remember how the GoToMeeting Primer Tutorial had separate audio (albeit very short … sorry … but you get the gist) and video … well, below, you can click on the image to hear the presentation with audio and video synchronized, and the presentation ending with the image below …
We think, though, that we will be back regarding this interesting topic.
Today we’ve written a first draft of an HTML and Javascript web application that splices up to nine bits of audio input together that can take either of the forms …
audio file … and less user friendly is …
text that gets turned into speech via Google Translate (and user induced Text to Speech functionality), but needs your button presses
Do you remember, perhaps, when we did a series of blog posts regarding the YouTube API, that finished, so far, with YouTube API Iframe Synchronicity Resizing Tutorial? Well, a lot of what we do today is doing similar sorts of functionalities but just for Audio objects in HTML5. For help on this we’d like to thank this great link. So rather than have HTML audio elements in our HTML, as we first shaped to do, we’ve taken the great advice from this link, and gone all Javascript DOM OOPy on the task, to splice audio media together.
There were three thought patterns going on here for me.
The first was a simulation of those Sydney train public announcements where the timbre of the voice differs a bit between when they say “Platform” and the “6” (or whatever platform it is) that follows. This is pretty obviously computer audio “bits” strung together … and wanted to get somewhere towards that capability.
The second one relates to presentation ideas following up on that “onmouseover” Siri audio enhanced presentation we did at Apple iOS Siri Audio Commentary Tutorial. Well, we think we can do something related to that here, and we’ve prepared this cake audio presentation here, for us, in advance … really, there’s no need for thanks.
The third concerns our eternal media file synchronization quests here at this blog that you may find of interest we hope, here.
Also of interest over time has been the Google Translate Text to Speech functionality that used to be very open, and we now only use around here in an interactive “user clicks” way … but we still use it, because it is very useful, so, thanks. But trying to get this method working for “Platform” and “6” without a yawning gap in between ruins the spontaneity and fun somehow, but there’s nothing stopping you making your own audio files yourself as we did in that Siri tutorial called Apple iOS Siri Audio Commentary Tutorial and take the HTML and Javascript code you could call splice_audio.html from today, and go and make your own web application? Now, is there? Huh?
Another day, another use for (in our case Google Chrome web browser) web inspector functionality. Yes, even if the source of the issue is PHP (which we moved on from a CentOS starting with 5 version to an AlmaLinux version starting with an 8) we’re yet to see an issue that could not be resolved with the help of a clientside web inspector debugging arrangement. Of course, the simpler the PHP the more likely this is to happen, but we can’t emphasise enough how useful these web inspectors are.
Today’s case in point revisits the use_time.htm clientside web application we talked about at HTML5 Time Tag Timeline Tutorial. Moving to AlmaLinux, and revisiting it on trying …
examining Apache Status log every now and then … via (now AlmaLinux cPanel but used to also be on CentOS cPanel) Apache Status report we talked about at CentOS Web Server cPanel Apache Status Tutorial
… as a “what the users are trying” resource available for AlmaLinux (cPanel using) web masters to keep in touch with goings on … was fun.
The fix, again, was to do with our “assumptive” PHP5 associative array logics … will Nala ever learn?!
The recent HTML5 Time Tag Primer Tutorial introduced the time tag, an HTML5 initiative, into our frame of reference here at this blog. As soon as date and/or time come into the picture the “when” of life comes into focus, and the use of the fourth dimension. As such, this HTML time tag can be the launching pad for interfacing to other “when” based web applications we’ve developed here.
take the opportunity, while the HTML is so separated from the Javascript (and CSS) in this project to move the Javascript to an external Javascript use_time.js (causing the HTML and CSS to shrink in this way)
With changes like this it can be important to leave the door open for people to not access this new Timeline (in an HTML iframe element), in terms of backward compatibility “friendliness”, and we allow for that via either/both bold (part of) ways below …
HTML and CSS parent use_time.htm calling supervised Javascript use_time.js via …
<script type='text/javascript' src='use_time.js?notimeline=y'></script>
But we are of the view that interfacing to other web applications with synergies is generally a good thing to do, and can inspire other ideas to develop regarding improvements to functionality.
You might be forgiven reading this webpage about the time tag introduced with HTML5 that it is not of much use, because it doesn’t show any distinguishing feature yet, in any of the web browsers.
But you can tailor the use of it yourself, and to show this we took the HTML lacking a <head></head> section and not change this HTML at all, but add our own CSS and Javascript (DOM) <head></head> section to embellish its functionality considerably.
document.body.innerHTML+=styles; // Javascript where styles variable contains dynamically constructed <body></body> section CSS <style></style> (an important thing to remember you can do (at a document.body onload event Javascript function, for example)) … and for this we used …
dynamically classed HTML time elements and moving on the onclick event (for mobile device use) as per …
times[iw].onclick = function() { };
times[iw].className+=' atime' + iw; // the times array which is derived via
var times=document.getElementsByTagName('time');
to be able to dynamically populate that styles variable as per codelines like …
styles=styles.replace("</style>"," .atime" + iw + ":hover::after { content: ' is " + sin(yyyy2,4) + "/" + sin(mm2,2) + "/" + sin(dd2,2) + " " + sin(hh2,2) + ":" + sin(minm2,2) + ":" + sin(ss2,2) + "'; } </style>");
Here is a link to some downloadable HTML programming source code which you may want to rename to use_time.html for this live run link.
Stop Press
If you were an “early bird” reading the early editions of this blog post, sorry, but you will have missed this, perhaps, and then again, maybe I am wasting my time pointing this out, but, since those early editions we’ve added a couple of iw links that harness some new functionality we have in our “highlighting” armoury (shall we say) making use of the new HTML5 mark tag, which we’ll be detailing more about in tomorrow’s blog posting. Clicking these links effectively does a web browser “View Page Source” type of functionality, but also highlights and positions (to first find), in situations like the “iw” one, where it is just a counter, but is unexplained, so we leave it up to curious users to find out something about its context.
If this was interesting you may be interested in this too.
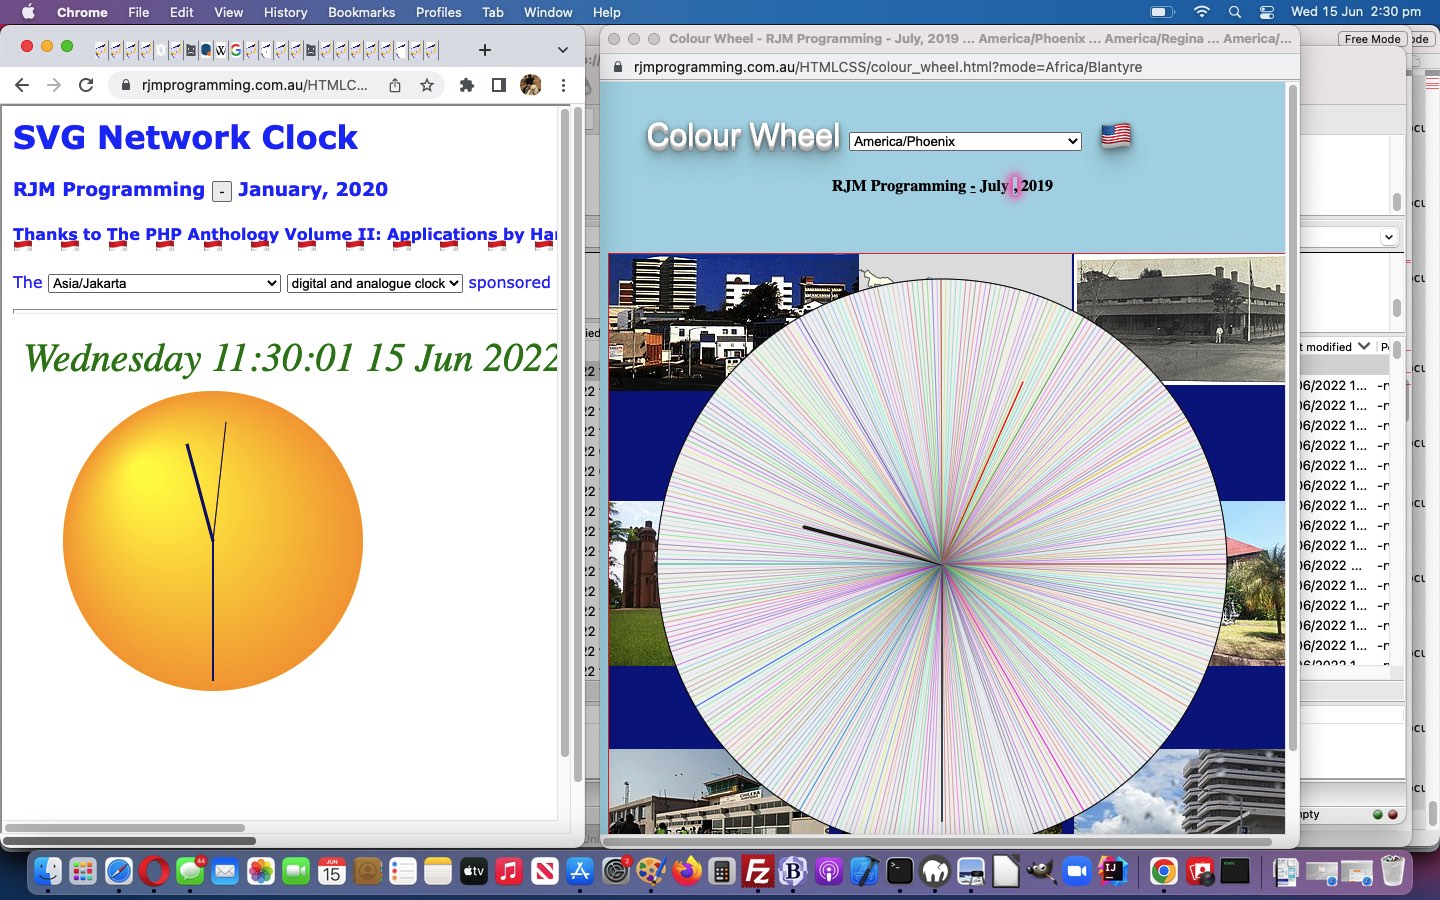
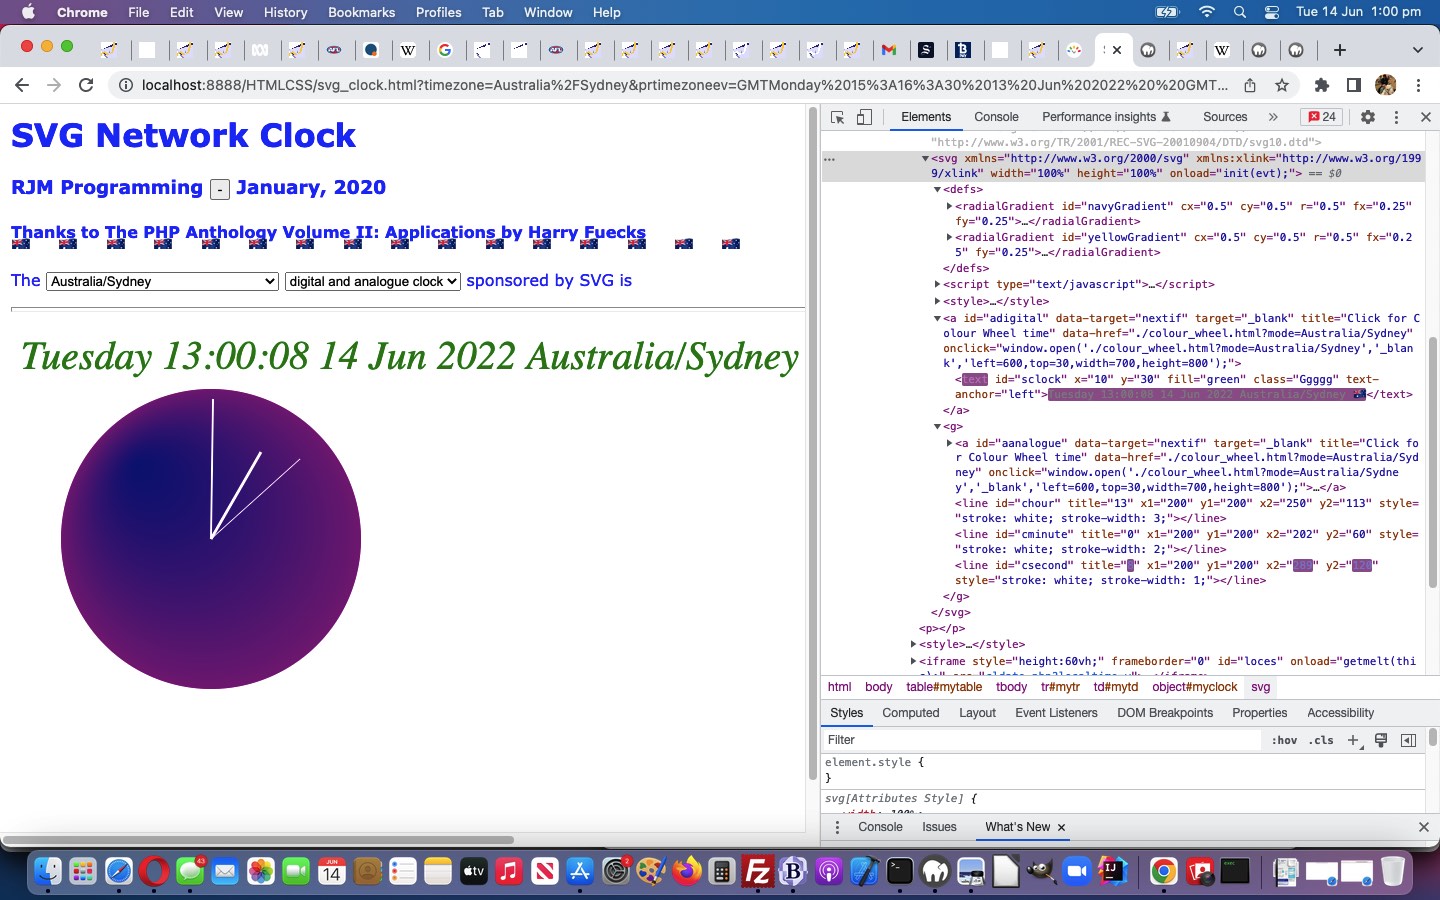
resharing … is happening today, offering other users you can email or SMS to, that same opportunity
In order to make this happen, yes, hashtag methodologies do make a contribution, just in case there is too much data regarding (PHP $_GET[]) argument URL length limitations. So with an email body link such as …
… because it involved more work. Perhaps if you used those links you will have noticed it navigates you to a very long (PHP $_GET[] argument) URL containing the Dot code of relevance to that “recreation” into the inhouse (tweakedvenn_diagram_basis.php) GraphViz Based Venn Diagram Editor PHP web application, and yet, if you are a regular reader you may have noticed that previous incarnations of the GraphViz Based Venn Diagram Editor PHP web application were exclusively based on HTML form method=POST scenarios. Well, a tweakedmake_graphviz_peers.php PHP “require_once” helper, here, now includes into all the PHP GraphViz family the new “near the top” codeline …
… which pleases us in it’s brevity for quite a useful result. Also it feels like we’re completing a cycle of functionality, returning to the GraphViz Venn Diagram work of a couple of days ago, within a workflow (and we have formalized this at the (tweakedimage_venn.html) Graph Creator web application end of things, via two new right hand table cell links). This means a big URL argument call of a PHP GraphViz family web application may be equivalent to as if the textarea and other elements had been filled in by an actual user and submitted. Maybe we’ll run into length issues down the line, and if so, or sooner, we’ll allow for hashtag usage here, but wonder whether the make_graphviz_peers.php can help out enough here, generically … we’ll see!
But in following through on this new arrangement, we found ourselves confronting “skew if” PNG images when the GraphViz produced PNG’s behind the scenes Dot coding mentioned no width or height parameterization. So we researched the issue and came upon this excellent link, thanks, to start using …
… with much more success! What’s with 5.7 and 3.6 here? Well, 5.7 (inches) x 96 is approximately 550 (pixels) and 3.6 (inches) x 96 is approximately 350 (pixels) to mean that the GraphViz interfacing more suits our pre-existing image size ideals.
The “dpi” stands for “dots per inch” and it’s value here affects the resolution and size of the PNG file created.
This Venn Diagram Chart arrangement seems limited when you know it is limited to three Venn Diagram Chart circles, until you get to the followup annotation menu that appears to the right of the web application screen, where open or filled in circles (or rectangles) and user added texts can augment your user entered parameters from a Javascript prompt window answer (where ~~ stands in for line feed and xlabel attributes are there available for the user to change the gist of their Venn Diagram Chart text).
<?php
function qcpc($inuis) {
$outuis=$inuis;
$sometext='';
// ?chs=550x350&cht=p&chd=t:1,2,3,4&chdl=January|February|March|April&chtt=My%20Pie%20Chart&chco=ff0000,00ff00,0000ff,ff00ff&ufr=_6992072
// to something like
// https://quickchart.io/chart?c={type:'pie',data:{labels:['January','February','March','April','May'], datasets:[{data:[50,60,70,180,190]}]}}#cht=b
// ?chs=550x350&cht=gv&chl=graph{C_0--H_0[type=s];C_0--H_1[type=s];C_0--H_2[type=s];C_0--C_1[type=s];C_1--H_3[type=s];C_1--H_4[type=s];C_1--H_5[type=s]}&chtt=My%20GraphViz%20Chart&chco=&ufr=_5020598
// to something like
// https://quickchart.io/graphviz?format=png&width=100&height=150&graph=graph{a--b}
// ?chs=550x350&cht=gom&chd=t:20,40,60&chdl=A|B|C&chtt=My%20Google-O-Meter%20Chart&chco=ff0000,00ff00,0000ff&ufr=_13133851
// to something like
// ?c={type:'gauge',data:{datasets:[{value:50,data:[20,40,60],backgroundColor:['green','orange','red'],borderWidth:2}]},options:{valueLabel:{fontSize:22,backgroundColor:'transparent',color:'#000',formatter:function(value,context){returnvalue+'mph';},bottomMarginPercentage:10}}}
// ?chs=550x350&cht=v&chd=t:100,80,60,30,30,30,10&chdl=A|B|C&chtt=My%20Venn%20Diagram&chco=ff0000,00ff00,0000ff&ufr=_18142737
// Thanks to https://www.infosol.com/venn-diagrams-in-xcelsius/ for
// chd=t:66,100,-1,33,-1,-1,-1
// These numbers specify the size and overlaps for all groups.
// The ordering is as follows:
// Group 1 size,
// Group 2 size,
// Group 3 size,
// Group 1 & 2 overlap amount,
// Group 1 & 3 overlap amount,
// Group 2 & 3 overlap amount,
// Group 1 & 2 & 3 overlap amount. In this case, we only had two groups to display, so all of the parameter slots reserved for the third group were set to “-1”. If you have a third group, then those “-1” values would be replaced with actual amounts. The Google Chart API provides for a maximum of 3 groups in Venn diagrams.
the recent, alas now deprecated, Google ChartsImage Charts GraphViz option means of drawing SVG graphics within an HTML image … we’ve known about before about yesterday …
today’s interest, that being PHP Image GraphViz via Pear on AlmaLinux install, via the AlmaLinux cPanel “Module Installers” Pear installer page, means by which we can use GraphViz calls in PHP code … and, for the future …
GraphViz installs for Python via pip
GraphViz via Dot language via command line
GraphViz via QuickChart product interfacing, we interface to, thanks
But, it’s not just the very interesting (curl https: posted JSON data based) QuickChart GraphViz interfacing that we add to our inhouse Image Based Graphs web application, we now have, in a first review, “splashpage aspect” improvements to all of …
Bar Chart
Line Chart
Venn Chart
Scatter Chart
GraphViz Chart
Google-O-Meter Chart
Radar Chart
Pie Chart
… the most work left with this interfacing, in all likelihood, will go to the “missing from the list above” Map Chart, and some Venn Chart user entered parameter logics, where any Map Chart replacement logic will never match the Google means by which region boundaries were defined and, hence, able to be allocated a shaded colour, though we think we’ll be able to show region place name text, in position, moving forward, using Google ChartGeo Chart and/or Map Chart and Wikipedia, thanks.
So, if this is an HTML web application, why the “PHP” mention in the blog posting title? Well, it is good ol’ WordPress Blog TwentyTen theme’s 404.php that remaps URLs from Google Chart Image Chart friendly ones to QuickChart friendly (so far only “splashpage” wise) ones via PHP code snippets …
<?php
function qcpc($inuis) {
$outuis=$inuis;
$sometext='';
// ?chs=550x350&cht=p&chd=t:1,2,3,4&chdl=January|February|March|April&chtt=My%20Pie%20Chart&chco=ff0000,00ff00,0000ff,ff00ff&ufr=_6992072
// to something like
// https://quickchart.io/chart?c={type:'pie',data:{labels:['January','February','March','April','May'], datasets:[{data:[50,60,70,180,190]}]}}#cht=b
// ?chs=550x350&cht=gv&chl=graph{C_0--H_0[type=s];C_0--H_1[type=s];C_0--H_2[type=s];C_0--C_1[type=s];C_1--H_3[type=s];C_1--H_4[type=s];C_1--H_5[type=s]}&chtt=My%20GraphViz%20Chart&chco=&ufr=_5020598
// to something like
// https://quickchart.io/graphviz?format=png&width=100&height=150&graph=graph{a--b}
// ?chs=550x350&cht=gom&chd=t:20,40,60&chdl=A|B|C&chtt=My%20Google-O-Meter%20Chart&chco=ff0000,00ff00,0000ff&ufr=_13133851
// to something like
// ?c={type:'gauge',data:{datasets:[{value:50,data:[20,40,60],backgroundColor:['green','orange','red'],borderWidth:2}]},options:{valueLabel:{fontSize:22,backgroundColor:'transparent',color:'#000',formatter:function(value,context){returnvalue+'mph';},bottomMarginPercentage:10}}}
// ?chs=550x350&cht=v&chd=t:100,80,60,30,30,30,10&chdl=A|B|C&chtt=My%20Venn%20Diagram&chco=ff0000,00ff00,0000ff&ufr=_18142737
// Thanks to https://www.infosol.com/venn-diagrams-in-xcelsius/ for
// chd=t:66,100,-1,33,-1,-1,-1
// These numbers specify the size and overlaps for all groups.
// The ordering is as follows:
// Group 1 size,
// Group 2 size,
// Group 3 size,
// Group 1 & 2 overlap amount,
// Group 1 & 3 overlap amount,
// Group 2 & 3 overlap amount,
// Group 1 & 2 & 3 overlap amount. In this case, we only had two groups to display, so all of the parameter slots reserved for the third group were set to “-1”. If you have a third group, then those “-1” values would be replaced with actual amounts. The Google Chart API provides for a maximum of 3 groups in Venn diagrams.
GraphViz via PHP on AlmaLinux Dot HTML Table Tutorial
In the GraphViz Dot command line world, there are a variety of (what we think of as) “verbs” supplied along with Dot installs for various purposes … think neat -n that helped with the Venn Diagrams of day before yesterday’s … but today we’re back to using “verb dot” again, thanks to QuickChart Graph API, thanks, with …
In so doing we were able to test the integrity of yesterday’s GraphViz via PHP on AlmaLinux Require Once Tutorial … spoiler alert … all okay (but we still have to remember to make our crontab arrangements for each new such web application)! And remind ourselves to revisit the excellent QuickChart product, which can help us get over the demise of Google ChartsImage Charts … somewhat.
The include (or require) statement takes all the text/code/markup that exists in the specified file and copies it into the file that uses the include statement.
Including files is very useful when you want to include the same PHP, HTML, or text on multiple pages of a website.
By peer to peer arrangements, we’re referring to those programming occasions where you’ve written a series of web applications, in today’s case, a series of server side PHP ones, further to the work of yesterday’s GraphViz via PHP on AlmaLinux Dot Circular Layout Tutorial, and want each to have means by which they can link to the others. In external Javascript client side land, that would involve an arrangement like …
visit each HTML code and add the link to the external Javascript … and …
within that external Javascript a dropdown (or some other HTML) element would be dynamically added to the webpage via DOM methodologies … based on …
essentially a hardcoded list (which, likely, needs to be rewritten when something new in the peer list happens) the programmer knows about
… into twopi_vs_circo_example.php PHP hosting Dot second go Circular Layout web application, is all the “code visiting” needed (as long as somebody … anybody … executes it once in a while … more on that later) in this server side methodology. The reason server side works so well is that server side can read and adjust web server code files, where PHP writes PHP here in this solution, whereas external Javascript client side approaches cannot do this.
user can control the Venn (or, it’s getting towards other uses) Diagram fill colour and opacity …
circles can be ellipses also …
the dot (or neat -n) shape option Box is coded for as far as diagram editing is concerned … which means some other Polygon shapes work too, except that changes (via two discrete click/taps) followed through on, turns Polygons without 4 sides into a Box with 4 sides
user can add dot (or neat -n) generic node attributes via the Font Size textbox ( eg. 14 fontcolor=blue margin=0 )
Those Javascript functions of yesterday now look like …
GraphViz via PHP on AlmaLinux Dot Venn Diagram Editing Functionality Tutorial
Yes, further to yesterday’s GraphViz via PHP on AlmaLinux Dot Venn Diagram Editing Design Tutorial we have some SVG data based Venn Diagram editing functionality to offer the user today. In amongst “editing” is new functionality (via a “+” prefix to the Javascript prompt window answer a user gives) to be able to create new circles or text in SVG and Dot formats. As alluded to yesterday, these Javascript onmousedown and ontouchdown event instigated functions look like …
And along the way, here, we determined by starting down that road, that the effort was not worth the reward to also allow HTML output format also work this Venn Diagram editing functionality. No problems, because in any case, the PNG and JPEG formats are not capable either. It is a case of “horses for courses”!
Similarly for the shape dropdown we’ve opened up again. Only the shape=circle scenario works SVG format output for Venn Diagram editing functionality.
… applied to all the SVG “g” elements, and we can use for the “whole shebang” of our solution to this piece of functionality. We’ll be showing you a more settled upon “function clickreg” (hopefully before the day of rest).
You’ll see playing with Venn Diagrams that we’ll need some time to think on whether we can improve positioning of the circles, a matter critical to Venn Diagram “drawing”.
… “forewarning work” into a “more than one day” scenario, it looks like, from today’s …
get the user, via onmousemove event Javascript logic (“szero” referring to the SVG topmost element object of the SVG (no HTML imagemap thoughts yet) within the id=myif iframe element of the parent window) …
szero.addEventListener('mousemove', function(){
if (event.touches) {
//if (event.touches[0].screenX) { pos3 = event.touches[0].screenX; pos4 = event.touches[0].screenY; } else
if (event.touches[0].pageX) {
pos3 = event.touches[0].pageX;
pos4 = event.touches[0].pageY;
} else {
pos3 = event.touches[0].clientX;
pos4 = event.touches[0].clientY;
}
console.log('pos3 = ' + pos3 + ',pos4 = ' + pos4);
//} else if (event.screenX) { pos3 = event.screenX; pos4 = event.screenY;
} else if (event.clientX || event.clientY) {
pos3 = event.clientX;
pos4 = event.clientY;
console.log('pos3 = ' + pos3 + ' ,pos4 = ' + pos4);
} else {
pos3 = event.pageX;
pos4 = event.pageY;
console.log('pos3 = ' + pos3 + ', pos4 = ' + pos4);
}
if (event.target.outerHTML.indexOf('<body') == 0) {
if (dbt == '') { dbt=document.body.title; }
}
pos4+=140; pos3-=40;
parent.document.getElementById('pos').innerHTML=' ... ' + pos3 + ',' + pos4 + ' ... inches ... ' + eval(pos3 / 96).toPrecision(5) + ',' + eval(eval(288 - pos4) / 96).toPrecision(5) + ' ... points ... <span id=pointsx>' + eval(pos3 * 3.0 / 4.0).toPrecision(5) + '</span>,<span id=pointsy>' + eval(288 - eval(pos4 * 3.0 / 4.0)).toPrecision(5) + '</span>';
});
… a display of useful set of co-ordinate sets to base their element movements via … day one progress … and then …
add more event driven Javascript clientside SVG or HTML imagemap clicking logic to both …
show the user a display showing what would happen should they click/tap the “Draw” button … as well as …
modify the top textarea user entries to reflect these proposed changes
… ideas (turned into a day’s worth of reality), as day two’s job (and hopefully not into day three).
Guess today’s work can be thought of as “a unit’s day”. When you talk of co-ordinates, it’s all relative, right?! With this work, for the first time we can remember, “real world” units such as “inches” (as well as “points” and the pixel “px” webpage units yours truly is most familiar with) make an appearance, of some importance. We’re not going to delve into why dot“neato -n” refers to “inches”, but learn a bit trying to fit in with dot“neato -n”‘s wooooooorrrrrrrllllllddddd. Our research and development here led to this link for px to inches thoughts, thanks, and this link for px to points thoughts, thanks. We suspect we might need to reference some/all of the three co-ordinate system ideas tomorrow, including the way in Javascript client land Y co-ordinates start at the top with zero and go down the webpage with ever increasing Y’s, but in dot“neato -n” land the Y co-ordinate increases as you go up the webpage, as most good graph systems we’ve ever known, would do, too!
You might see with the whole Dot file presented to the user as an “up for grabs” we have some fillcolor attributes such as …
fillcolor="#90806090"
… which is Dot’s equivalent to rgba(146,130,96,0.9) ( ie. rgb(146,130,96) with opacity 0.9 ) … on 12/10/2024 realized ((9 x 16) + (0 x 1)) / 256 = 0.5625 … rgba(146,130,96,0.5625) ( ie. rgb(146,130,96) with opacity 0.5625 ) … but, please, stick to the “Dot way” because some other ways just cause black filled in circles. Because Venn Diagrams are often about overlapping, you’d expect opacity to be a feature of use here.
You’ll see playing with Venn Diagrams that we’ll need some time to think on whether we can improve positioning of the circles, a matter critical to Venn Diagram “drawing”.
PDF … (via the dot switch -Tpdf) but, today, we open it up for …
PNG … (via the dot switch -Tpng) and …
JPEG … (via the dot switch -Tjpg) and …
HTML … made up of …
body element … consisting of …
img element as the imagemap part … (via the dot switch -Tpng) as well as …
map element as the imagemap part … (via the dot switch -Tcmapx)
… that last imagemap based one taking up most of the work day, but worth it, we think. And thanks to this excellent advice regarding this.
With the PNG and JPEG (and HTML, we belatedly realized) outputs we initialize the canvas editor with that Colour Wheel image contents, and with SVG and HTML clicks can shape the colour picking for the canvas editor, while PDF is just for … well … PDF.
GraphViz via PHP on AlmaLinux Dot Colour Wheel Tutorial
We’ve discovered another item to add to our list of GraphViz guises, adding …
the recent, alas now deprecated, Google ChartsImage Charts GraphViz option means of drawing SVG graphics within an HTML image … we’ve known about before about yesterday …
today’s interest, that being PHP Image GraphViz via Pear on AlmaLinux install, via the AlmaLinux cPanel “Module Installers” Pear installer page, means by which we can use GraphViz calls in PHP code … and, for the future …
GraphViz installs for Python via pip
GraphViz via Dot language via command line
… and we host that in PHP, starting, today, down this road, taking the Colour Wheel of https://graphviz.org/Gallery/neato/color_wheel.html as an example of “Dot” language GraphViz code (we’ve called colour_wheel.dot, thanks), made use of, after user supplied amendments as required, on the AlmaLinux command line, such as …
?>
… (in an SVG version with no – “minuses” in it’s file name) … so that …
storing in window.localStorage is a simple matter of name=value association where value is a simple RJM Programming domain absolute SVG URL (with the “minuses”, but they are taken out in the first argument of the window.open first argument …
<?php echo ”
function gotothis(inu) {
if (inu.trim() != '') {
if (inu.indexOf('HttP') == 0) {
var toe=null;
if (document.getElementById('sells').innerHTML.indexOf(inu + '\">') != -1) {
toe=prompt('Please enter email address or SMS number to share ' + document.getElementById('sells').innerHTML.split(inu + '\">')[1].split('<')[0].replace('Email or SMS ','') + ' with.', '');
} else {
toe=prompt('Please enter email address or SMS number to share with.', '');
}
if (toe == null) { toe=''; }
if (toe.indexOf('@') != -1) {
if (document.getElementById('sells').innerHTML.indexOf(inu + '\">') != -1) {
document.getElementById('myaemailsms').href='mailto:' + toe.trim() + '?subject=' + encodeURIComponent(document.getElementById('sells').innerHTML.split(inu + '\">')[1].split('<')[0].replace('Email or SMS ','')) + '&body=' + encodeURIComponent(inu.replace('HttP','http').split('#')[0].replace(/\-/g,'').replace('doctestoutput','doctest-output'));
document.getElementById('myaemailsms').click();
} else {
document.getElementById('myaemailsms').href='mailto:' + toe.trim() + '?subject=' + encodeURIComponent('Family Tree') + '&body=' + encodeURIComponent(inu.replace('HttP','http').split('#')[0].replace(/\-/g,'').replace('doctestoutput','doctest-output'));
document.getElementById('myaemailsms').click();
}
} else if (toe.trim() != '') {
if (toe.trim().replace(/0/g,'').replace(/1/g,'').replace(/2/g,'').replace(/3/g,'').replace(/4/g,'').replace(/5/g,'').replace(/6/g,'').replace(/7/g,'').replace(/8/g,'').replace(/9/g,'') == '') {
document.getElementById('myaemailsms').href='sms:' + toe.trim() + '&body=' + encodeURIComponent(inu.replace('HttP','http').split('#')[0].replace(/\-/g,'').replace('doctestoutput','doctest-output'));
document.getElementById('myaemailsms').click();
}
}
document.getElementById('sells').value='';
} else if (inu.indexOf('HTTP') == 0) {
if (inu.indexOf('#saved_family_tree_') != -1) {
deleteAVal(inu.split('#')[eval(-1 + inu.split('#').length)], encodeURIComponent(inu.replace('#' + inu.split('#')[eval(-1 + inu.split('#').length)], '').replace('HTTP','http')));
cookieAVal('saved_family_tree_', true);
}
} else {
woo=window.open(inu.replace(/\-/g,'').replace('doctestoutput','doctest-output').replace('http:','').replace('https:',''), '_blank', 'top=50,left=50,width=800,height=800');
}
}
}
“; ?>
) … to open GraphViz SVGs in a new window or email or SMS them and an option to stop their recall in that intersessional and intrasessional (also via a right hand cell double click) way
As well, onto the progress cursor (which is of no use on mobile platforms) method of flagging to the user they should wait, we add an animated “Draw” button border animation Javascript function …
<?php echo ”
function animbord() {
var bcolsare=['green','#F0F8FF','#F0FFFF','#F0F0E0','#F0FFF0','#FFFFF0','#FFF0E0','#FFFFE0','#F0FFF0','#FFFFFF','#F0F0F0','#F0F7FF','#FFF8F0','#FFF0F0','#E0FFFF','#FFFFE0'];
document.getElementById('mysub').style.border='3px dotted ' + bcolsare[lastj];
lastj++;
if (lastj >= eval('' + bcolsare.length)) { lastj=0; }
setTimeout(animbord, 200);
}
“; ?>
As the user enters in any image URL, we allow a hash delimiting user answer idea whereby they can use an opacity that is not the 0.6 default value in the changed PHP family_tree.phpFamily Tree creation.
Python GraphViz via PHP on AlmaLinux Family Tree Image Tutorial
So far with our GraphViz usages, there have been no images, within any SVG output created. Today, at least with the Family Tree functionality, we want to allow image URL user entered imagery to overlay SVG node elements, using that node’s positioning to guide where this overlayed image should be placed, further to yesterday’s Python GraphViz via PHP on AlmaLinux Family Tree Tutorial.
Is it Javascript DOM helping with this? Yes, we host SVG GraphViz output within HTML iframe elements, where (in the spirit of “Client Pre-Emptive Iframe” thinking), which have an onload event Javascript function looking like …
<?php echo ”
function checksvg(iois) {
var gs=[];
if (iois != null) { // check out window.svgDocument
var aconto = (iois.contentWindow || iois.contentDocument);
if (aconto != null) {
//alert(1);
if (aconto.document) {
aconto = aconto.document;
gs=aconto.getElementsByTagName('g');
if (eval('' + gs.length) > 0) {
gzero=gs[0];
for (var sd=0; sd<gs.length; sd++) {
gs[sd].onclick=function(event){ parent.svgit(event.target, ''); };
gs[sd].ondblclick=function(event){ parent.svgit(event.target, 'ask'); };
}
}
gs=aconto.getElementsByTagName('svg');
if (eval('' + gs.length) > 0) {
szero=gs[0];
for (var sd=0; sd<gs.length; sd++) {
gs[sd].onclick=function(event){ parent.svghost(event.target, ''); };
}
}
console.log(gs.length);
console.log(aconto);
}
//alert(11);
if (aconto.body != null) {
iois=iois;
//alert('yay!');
}
}
if (gzero) {
gzero=gzero;
" . (strlen($addimg) == 0 ? $addimg : ' gzero.innerHTML+="' . $addimg . '"') . "
if (aimg != '') { eval(' gzero.innerHTML+=\"' + aimg + '\"'); }
}
}
}
“; ?>
… relying on iois.contentDocument (as our reading said would help) before any of our aconto.body thinking which suits (our usual) HTML content with the relevant iframe hosting element. From there on, Javascript DOM principles can help modify and scour SVG content, and make use of new Javascript functions, as per …
<?php echo ”
function svghost(svgheo, imgc) {
if (9 == 8) {
if (gzero) {
gzero.innerHTML+=\"<image x='0' y='0' href='/camel.png'></image>\";
} else {
svgheo.innerHTML+=\"<image x='0' y='0' href='/camel.png'></image>\";
}
}
}
If you examine this how we got there link, you will see by how little has changed, how there is so much in common as we build on previous GraphViz work, rather than worrying about the differences … they soon become apparent as you test the https://forum.graphviz.org/t/emojis-not-working/1935/2 inspired family_tree.py Python code inspiration, thanks.
That last link’s Python code made us ditch the inhouse | and ; and . delimitation ideas in favour of the Python structure syntax, it being as self explanatory (or more, we daresay) as the inhouse delimiter ideas, and easier to implement …
<?php
// family_tree.php
// RJM Programming
// September, 2024
// Trying out Python GraphViz package ... thanks to https://forum.graphviz.org/t/emojis-not-working/1935/2
It also served to remind us that users might want to embed emojis into their Family Tree names, so to leave SVG as our default output format would be advantageous, again. All the Stop Press ideas yesterday were relevant too, for the PHP family_tree.phpFamily Tree creation …
Emoji … as we decided upon (as much as anything, because non-ascii characters for other non-English language requirements, might now be possible within the content of the GraphViz entity, as a result) … or …
Format … or …
Sharing … or …
Encoding … or …
Delimitation
We wanted to look back at yesterday to it’s “code architecture”, if you will, as a “lead in” to where we are coming at here. Yesterday, in the user definable textarea elements …
| … “edge” linkage record set delimiter
; … parent from rest delimiter
, … rest child name(s) delimiter
… this user usage delimiter characters “inhouse rules” architecture contributes to making it all the more crucial in the coding, to nail down how the + character is handled …
… which, as you can see with our HTML form onsubmit event fired Javascript function above, amounts to mapping real content + characters to horizontal tab to differentiate this mode of use from the use HTML form encoding uses for it to represent an encoded space character. Are you now getting a bit of an idea with today’s “tidying up” and “nuancing” feel?!
What about if any “edge” names contain one of those delimiters, as above? Well, we try …
<?php echo ”
function various(indi) {
var outdi=indi;
outdi=outdi.replace(/\|\;/g, encodeURIComponent('|') + ';');
outdi=outdi.replace(/\,\;/g, encodeURIComponent(',') + ';');
outdi=outdi.replace(/\;\;/g, encodeURIComponent(';') + ';');
… in that regard, and “double decode” (with a bit of nuance in between) on the other side, to try to account for this. We’ll see!
But the day started thinking about Emojis. What would happen in our PDF default output with Emoji content being introduced by the user within input textarea elements, as they go to Draw their Hierarchical Organization chart? Well, not so good. But, thanks to Graphviz not supporting UTF-8 encoding webpage, we got put onto the idea that an alternative, and now the default, format of output could be SVG … and trying it worked … thanks!
And then it occurred to us that there is also the GraphViz graph mode ( default Digraph versus Graph ), and it’s “edge” element background colour and shape and font size, as well as a resizing mechanism, that could be up for grabs, via user input in the tweakedhierarchy_organization.phpHierarchy Organization diagram “drawer”.
Python GraphViz via PHP on AlmaLinux Organization Hierarchy Tutorial
Calling cab (6754 – 6756 + 4).
Huh?!
Calling the second cab off the rank.
Yes, now that we understand a bit more about file permission issues, after yesterday’s Python GraphViz via PHP on AlmaLinux Permissions Tutorial, having PHP hosting Python with GraphViz calls, let’s turn our attention to the issue of “lots of data”, today, with our …
We thought we’d move the Python, via PHP processing, totally into the purview of the web server administration owner, by involving a …
Korn Shell *.ksh … supervised by …
crontab … pointing to …
ksh -c 'for i in `find /home/rjmprogr/public_html/ -name "subgraph_example_*.ksh"`; do ksh -c `echo $i`; done'
… very regularly
… arrangement, but even that failed, in a first incarnation using /tmp/ placement of the Korn Shell file. “Permission denied”, again. Running a Korn Shell from /tmp/ on AlmaLinux must be a no-no, so moved the place to be AlmaLinux web server’s Document Root place, and then things started happening, in the changedsubgraph_example.phpPython GraphViz using web application.
the recent, alas now deprecated, Google ChartsImage Charts GraphViz option means of drawing SVG graphics within an HTML image … we’ve known about before about yesterday …
today’s interest, that being PHP Image GraphViz via Pear on AlmaLinux install, via the AlmaLinux cPanel “Module Installers” Pear installer page, means by which we can use GraphViz calls in PHP code … and, for the future …
GraphViz installs for Python via pip
…? Well, today, we start down the road of …
installing Python GraphViz package via …
pip install graphviz
On non-mobile focus goes to the address bar on many web browsers unless there is a (nominally) visible input type=text or textarea next in line.
It’s hard to keep in mind except as it “rears up” in an annoying way, but if we’d thought back, yes, we allow in the linked list feel of revealing textboxes (or textareas) only as they are needed scenarios we allow for two blank ones to be (nominally) visible at any given time … not one … but two, presumably because there is a tiny Javascript DOM “refresh period” not short enough to stop the web browser “desperation measure” (of placing focus in the address bar) happening?!
Why the non-mobile mention? Well, on mobile, a user programming [HTMLelement].focus(); call has no affect, as the touch operating systems need control of focus arrangements, presumably?!
How can we forget? My liege, please accept my humble apologies?!
Why the (nominally) mentions? Well, we have, successfully, in the past, just arranged a (statically HTML placed) textbox (ie. input type=text) that sits outside the viewing screen but not (nominally) invisible (eg. style=’position:absolute;top:-200px;left:-200px;’) can help you avoid the focus going up to the web browser address bar.
So that’s that, and other progress today is to allow the emailing or SMS of a recalled URL Step arrangement via more options on that “Recall Dropdown” we started allowing for yesterday.
inhouse intersessional sharing via window.localStorage (ie. like HTTP Cookies)
… over yesterday’s and today’s blog posting timings. Simply put, for us, we …
take a deep breath before starting intersessional window.localStorage work, as it is not to be sneezed at, as any sort of doddle (at least for us) … as well as …
since last intersessional window.localStorage work we’ve started using email and SMS sharing hashtagging arrangements that fit in, like a glove, with this intersessional window.localStorage work … so that …
even though, we write the code here in PHP, all this functionality is client based … which we like because …
get the idea correct, with careful forward planning and implementation, we’ll be able to apply similar such thinking into the future, whether that be for clientside only web applications and/or ones that call on serverside code (like PHP) … and …
if we can keep things just clientside more readers can be involved, we figure
If you’re wondering about the worry of any of this, it is to do with large title and/or URL link and/or ingredient type data whose data length could be huge, where most of our concern lies, and …
hashtagging (where data limits are so much longer) can help it remain as a clientside only solution environment (rather than relying on some form method=POST to a serverside (eg. PHP) receiver solution) …
window.localStorage is a step up from the HTTP Cookie style of intersessional (personal) storage as far as amounts that can be stored is concerned
What are we aiming for here, then, with our improvements?
extend the existant email and SMS functionality …
<?php echo ”
function emailit(insg) {
var em='', ccok='';
if (estitle == '') {
if (cookb.split(' Or hash delimited appended string can ')[0] != '') {
cookb=cookb.replace(cookb.split(' Or hash delimited appended string can ')[0], '');
}
}
if (('' + insg).replace(/^null/g,'').replace(/^undefined/g,'').trim() != '') {
em='' + insg;
} else {
em=prompt('Please enter Email address to share with. ' + cookb, '');
}
if (em != null) {
if (em.trim() == '' && estitle != '') {
em='#' + estitle;
} else if (em == estitle && estitle != '') {
em='#' + estitle;
}
}
if (em.indexOf('#') != -1) {
cook=em.substring(eval(1 + eval('' + em.indexOf('#'))));
em=em.split('#')[0].trim();
if (cook.trim() != '') {
deleteAVal('steps_' + cook.replace(/\ /g,'-'),'');
setAVal('steps_' + cook.replace(/\ /g,'-'), \"" . $hashurl . $hashurld . "\" + anyhashes);
}
}
if (em == null) { em=''; }
if (em.trim() != '') {
if (em.trim().indexOf('@') != -1) {
em+='?subject=Steps&body=' + encodeURIComponent(\"" . $hashurl . $hashurld . "\" + anyhashes);
document.getElementById('dimap').innerHTML=\"<a style=display:none; id=theaemail target=_blank href='mailto:\" + em + \"'>Email</a>\";
document.getElementById('theaemail').click();
} else if (em.trim().replace(/0/g,'').replace(/1/g,'').replace(/2/g,'').replace(/3/g,'').replace(/4/g,'').replace(/5/g,'').replace(/6/g,'').replace(/7/g,'').replace(/8/g,'').replace(/9/g,'') == '') {
em+='&body=' + encodeURIComponent(\"" . $hashurl . $hashurld . "\" + anyhashes);
document.getElementById('dimap').innerHTML=\"<a style=display:none; id=theasms target=_blank href='sms:\" + em + \"'>SMS</a>\";
document.getElementById('theasms').click();
}
}
return false;
}
function smsit(insg) {
var em='', cook='';
if (estitle == '') {
if (cookb.split(' Or hash delimited appended string can ')[0] != '') {
cookb=cookb.replace(cookb.split(' Or hash delimited appended string can ')[0], '');
}
}
if (('' + insg).replace(/^null/g,'').replace(/^undefined/g,'').trim() != '') {
em='' + insg;
} else {
em=prompt('Please enter SMS number to share with. ' + cookb, '');
}
if (em != null) {
if (em.trim() == '' && estitle != '') {
em='#' + estitle;
} else if (em == estitle && estitle != '') {
em='#' + estitle;
}
}
if (em.indexOf('#') != -1) {
cook=em.substring(eval(1 + eval('' + em.indexOf('#'))));
em=em.split('#')[0].trim();
if (cook.trim() != '') {
deleteAVal('steps_' + cook.replace(/\ /g,'-'),'');
setAVal('steps_' + cook.replace(/\ /g,'-'), \"" . $hashurl . $hashurld . "\" + anyhashes);
}
}
if (em == null) { em=''; }
if (em.trim() != '') {
if (em.trim().replace(/0/g,'').replace(/1/g,'').replace(/2/g,'').replace(/3/g,'').replace(/4/g,'').replace(/5/g,'').replace(/6/g,'').replace(/7/g,'').replace(/8/g,'').replace(/9/g,'') == '') {
em+='&body=' + encodeURIComponent(\"" . $hashurl . $hashurld . "\" + anyhashes);
document.getElementById('dimap').innerHTML=\"<a style=display:none; id=theasms target=_blank href='sms:\" + em + \"'>SMS</a>\";
document.getElementById('theasms').click();
} else if (em.trim().indexOf('@') != -1) {
em+='?subject=Steps&body=' + encodeURIComponent(\"" . $hashurl . $hashurld . "\" + anyhashes);
document.getElementById('dimap').innerHTML=\"<a style=display:none; id=theaemail target=_blank href='mailto:\" + em + \"'>Email</a>\";
document.getElementById('theaemail').click();
}
}
return false;
}
“; ?>
… to cater for additional personalized Title (of steps) and Content of steps (using the hashtagging email and SMS URL methods set up yesterday)
<?php echo ”
var estitle=\"" . $estitle . "\";
var cookb=\"" . $cookblurb . "\";
var lssel='';
var woo=null;
function deleteAVal(goodname, aparticularvalue) {
if (window.localStorage && goodname.indexOf('steps_') == 0) {
if (('' + localStorage.getItem(goodname)).replace(/^undefined/g,'').replace(/^null/g,'') != '') {
if (aparticularvalue == '') {
localStorage.removeItem(goodname);
} else {
if (aparticularvalue.replace('HTTP','http').toLowerCase() == ('' + localStorage.getItem(goodname)).toLowerCase()) {
localStorage.removeItem(goodname);
}
}
}
}
}
function setAVal(cName, cVal) {
if (cName.indexOf('steps_') == 0) {
if (window.localStorage) {
localStorage.setItem(cName, encodeURIComponent(cVal));
cookieAVal('steps_', true);
return ' ';
}
return '';
}
return '';
}
add a new …
<a id=pcookie title='Recall this' class=share onclick="return emailit(estitle);" style='display:none;text-decoration:none;cursor:pointer;'>🍪</a>
… emoji link for intersessional window.localStorage work that calls the email functionality modified Javascript function …
allowing a window.localStorage.setItem([Title (of steps)], encodeURIComponent([Content of steps])) to add a personalized and recallable record be kept on the web browser of use … recallable via …
new dropdown populated with existant such records, as well as a dropdown option allowing the user to remove said records, too … which …
can navigate the user to this recallable Steps idea in a new webpage incarnation …
a dropdown arrangement which is intersessional as well as intrasessional by nature, and personalized to that user’s use of the web browser on that device in question
on many mobile devices the horizontally spreading right cell arrangements has been improved by laying out these textarea elements vertically now …
hashtagged URL mailto: and/or sms: “a” links to email and/or SMS communication conduits, respectively …
<?php echo ”
var anyhashes='';
var aone=1;
var tdc=0;
Graphviz (short for Graph Visualization Software) is a package of open-source tools initiated by AT&T Labs Research for drawing graphs (as in nodes and edges, not as in bar charts) specified in DOT language scripts having the file name extension “gv”. It also provides libraries for software applications to use the tools. Graphviz is free software licensed under the Eclipse Public License.
… we’ve learnt recently, means a lot of things, differently (nuanced) for a range of users, three that we’ve so far become aware of being …
the recent, alas now deprecated, Google ChartsImage Charts GraphViz option means of drawing SVG graphics within an HTML image … we’ve known about before about yesterday …
today’s interest, that being PHP Image GraphViz via Pear on AlmaLinux install, via the AlmaLinux cPanel “Module Installers” Pear installer page, means by which we can use GraphViz calls in PHP code … and, for the future …
GraphViz installs for Python via pip
… in amongst many others we’ve seen programmers using … totally cute, totally useful!
It seems with our PHP Image GraphViz via Pear on AlmaLinux as what looks like a very much “pared down” version of the last mode of use above, that we add constructed graph node or edge or cluster objects, and form them into SVG based HTML image elements. It’s look got me thinking “Steps”, then “Recipe Steps”, and back, quietly, to “Any Old Steps” as the day got more generic.
At first we got, as far as Recipes go (and here we thank Italian Wedding Soup for today’s inspiration), to …
cooking steps showing as Image GraphViz edge graphic components (having arrows connect ellipses containing text, a bit like Speech Bubbles) … and then trying to face the “real world” a user interested in recipes might want to see happen …
an Image GraphViz node graphic component whose wording could be a user supplied recipe Title along with a “URL” attribute link, optionally user supplied (via our HTML div SVG hosting ondblclick event allowing its contenteditable=true attribute and onblur event means by which these optional additional data items can enter the “mix”, if you’ll pardon the pun), probably pointing back to the original recipe information saucesource … and …
this title and/or “URL” and/or ingredient list (for example) can all be expressed as the “on hover” title attribute of the tailored user PHP webpage (yes, here we have PHP writing PHP) … and …
at least on Safari, given a recipe Title defined, we can arrange any browser context menu (ie. right click) over the HTML iframe hosted recipe content “Save Iframe As” option being able to download to a reasonably self explanatory download filename … and/or …
any web browser’s Add Bookmark functionality can be harnessed to help the user out in such a way that our PHP codedMy Recipe Steps web application could end up being your one stop shop “Recipe Organizer” online?!
Better to be king for a night than schmuck for a lifetime. Well, at least it’s not a question. … the thing is, silly us, it turns out that angled text issue was not a problem with [element].getBoundingClientRect() but how the PHP GDimagettftext text placement emanated from the bottom left of the text always, Mr De Niro sir.
Never rat on your friends and always keep your mouth shut. Really wish we could! Yes, Mr De Niro, sir, but, you see this means the rats are completely out of the picture, just leaving us with our money spinner. Right, Mr De Niro … sir.
There are three ways of doing things around here: the right way, the wrong way and the way that I do it. [Exeunt: Stage right] Well, that’s odd? Mr De Niro wasn’t interested in the quadrant nature to our problem solution …
… that temporary div element text border drawing, being the crucial way to find out what was happening, and showing us, at least on Google Chrome web browser, not to worry so much about [element].getBoundingClientRect() results for transformed HTML elements. And that is a huge relief in itself.
Also taking up a lot of today, we shored up Image Map Event Editing results bubbling through to an email or SMS recipient. The size of this data, and an analysis of …
… when it comes to complex and sizeable data such as “Javascript scripting” is, we should start swinging towards Ajax thinking, even pinching it off a client pre-emptive iframe onload event logic thought/start sometimes …
var myxhr=null, rawhtml='';
var zhr=null, zform=null;
function stateChanged() {
if (myxhr.readyState == 4) {
if (myxhr.status == 200) {
console.log('myxhr=' + myxhr);
rawhtml = myxhr.responseText.replace(/\\"/g, '"').replace(/\\'/g, "'");
if (document.getElementById('jdiv')) {
//alert('1:' + rawhtml);
//alert('21111 ' + rawhtml.split('<scr')[1]);
document.getElementById('jdiv').innerHTML=rawhtml.split('<scr')[0]; //xaconto.body.innerHTML;
//alert(31111);
if (document.getElementById('talkimg')) {
document.getElementById('talkimg').useMap='#mymap';
} else {
document.getElementById('myvenn').useMap='#mymap';
}
//alert(41111);
} else {
document.body.innerHTML+=rawhtml.split('<scr')[0]; //xaconto.body.innerHTML;
if (document.getElementById('talkimg')) {
document.getElementById('talkimg').useMap='#mymap';
} else {
document.getElementById('myvenn').useMap='#mymap';
}
}
if (rawhtml.indexOf('<scr') != -1) {
if (1 == 1) {
var tag = document.createElement('script');
var nextsep=rawhtml.split('<scr')[1].split('>')[0] + '>';
//var qw=prompt(rawhtml.split('<scr')[1].split(nextsep)[1].split('</scri')[0],rawhtml.split('<scr')[1].split(nextsep)[1].split('</scri')[0]);
//alert('2:' + rawhtml.split('<scr')[1].split(nextsep)[1].split('</scri')[0]);
tag.innerHTML = rawhtml.split('<scr')[1].split(nextsep)[1].split('</scri')[0];
var firstScriptTag = document.getElementsByTagName('script')[eval(-1 + document.getElementsByTagName('script').length)];
firstScriptTag.insertAdjacentElement("afterend", tag);
}
… in the changedlatest draft image_venn.html Google Chart Image Chart Venn Chart or Scatter Chart or GraphViz Chart or Pie Chart or Line Chart or Bar Chart or Candlestick/Box Chart or Google-O-Meter Chart or Radar Chart or Map Chart interfacing web application you can also try below.
that if yesterday we presented some programmer defined image map event logic … then, today, we’d want to …
offer the user the chance to change that default programmer defined image map event logic, to that of their own design
… in the form of
user defined Javascript .. editable in a …
HTML textarea element
… and then the coding latching onto a document.createElement(‘script’) paradigm, to add Javascript clientside logic, on the fly.
There’s a first time we can remember aspect to how we present these possibilities to the user. We present it in …
amongst the inhouse annotation options … as a …
“reveal” pairing of HTML5 details/summary element combination look … the first time we can remember aspect to that being …
only initially displaying within the details element innerHTML is a summary element nesting a single “icon like” image (like the other “inhouse annotation” icon images) … but if clicked …
the details innerHTML has added to it a textarea element …
function fillindetsed(odet) {
if (odet.innerHTML.split('</summary>')[1] == '') {
document.getElementById('tdleft').style.verticalAlign='top';
var onls=thescript.split('<scr' + 'ipt type="text/javascript">');
var onlstuff=onls[1].split('</sc' + 'ript>')[0];
odet.innerHTML+='<scr' + 'ipt type="text/javascript">' + "<br><textarea onblur=tproc(this); id=tscript rows=100 cols=80 value=''>" + onlstuff + "</textarea><br></script>";
//odet.innerHTML+='<scr' + 'ipt type="text/javascript">' + "<br><textarea onblur=tproc(this); id=tscript rows=100 cols=80 value=''>" + encodeURIComponent(onlstuff) + "</textarea><br></script>";
//document.getElementById('tscript').value=decodeURIComponent(document.getElementById('tscript').innerHTML);
}
}
… from which document.createElement(‘script’) code onblur event logic emanates …
… in the changedlatest draft image_venn.html Google Chart Image Chart Venn Chart or Scatter Chart or GraphViz Chart or Pie Chart or Line Chart or Bar Chart or Candlestick/Box Chart or Google-O-Meter Chart or Radar Chart or Map Chart interfacing web application you can also try below.
Google Chart Image Chart Image Map Events Tutorial
We really like HTML image maps, and it occurred to us with yesterday’s Google Chart Image Chart Image Map Tutorial we were hiding its light under some bushel somewhere, because …
yesterday we introduced with only the onclick event coded for in the HTML area subelements to the map parent element … linked to an …
associated img element … via an …
attribute called usemap … and two aspects, at the very least, to stuff under the bushel are …
many more events than onclick can be defined as you define the area subelements … and here’s the kicker …
you can add area subelement event logic that, on paper, would cause interference with other event logic (ie. the same event type in an event bubbling through scenario) but it won’t if you, as a programmer, turn that use of the usemap attribute on and off like a tap
… which, to our mind, represents the bee’s knees of event management. So useful!
To tip our toes into this woooorrrrrlllllddd we’ll show you some newly added area subelement event logics in a Google Chart Image Chart Radar Chart example below …
… with new relevant event code snippet to help add intelligence to the event logic of our Google Chart Image Chart interfacing web application …
function defclick(evt) {
switch ('' + evt.type) {
case 'click':
alert('Welcome to RJM Programming interfacing to Google Charts Image Chart ' + cname);
break;
case 'touch':
document.getElementById('myh3').innerHTML='RJM Programming - November, 2023 ... mobile touch event ' + evt.type + ' called by ' + ('' + evt.target.id);
break;
default:
alert(evt.type);
break;
}
break;
}
}
Interesting, huh?!
Feel free to try this out in the changedlatest draft image_venn.html Google Chart Image Chart Venn Chart or Scatter Chart or GraphViz Chart or Pie Chart or Line Chart or Bar Chart or Candlestick/Box Chart or Google-O-Meter Chart or Radar Chart or Map Chart interfacing web application you can also try below.
Do you like to come at explaining things in layers? Sort of like the analogy …
you start a project thinking of it in terms of “2D” … and then to move forward …
you spend a day making it work for “3D” (and keep the “2D” working as well)
… or …
you start a web application project thinking of only working via a URL entered on the web browser address bar … and then to move forward …
you spend a day making it work for serving the same purpose and/or a difference purpose called within an HTML iframe (and keep it working for the address bar way as well)
And so we look at a “picturesque” but “kinda dumb” (as far as “action items” go) image we have coming off the interfacing to Google Charts Image Chart. Where can we go here? Well, it would be kind of you to take it to the beach, but that’s not always a possibility now, is it?! Were you pulling my leg?! Tee hee. No, we were thinking … oh no … we have a bad feeling about this … let’s open it up to the class … anyone, anyone? Yes, Louis, would you and Auguste like to share with the class what is so amusing to you?
.
.
.
.
.
.
.
.
.
.
.
.
.
.
.
Okay, thank you for your thoughts on this, and yes, you could take the “picture” to “a picture show”. Yes, very droll, indeed. Any other ideas? Okay, Johann, you say the idea just “clicked” with you. This sounds promising. Go on …
.
.
.
.
.
.
.
.
.
.
.
.
.
.
.
Indeed, a young “picturesque” might like to go tap dancing, that is true. Sheeeeesh! But given the lesson is a Computing one, rather than Drama or Dance or Music or the Arts, maybe we would be looking for a way to use the picture in an enhanced way. Okay Kevin, we’ll try you. What do you think?
Frankly, we are flabbergasted! It’s as if you invented HTML image maps (as a way to add position based event logic), or something … 93/4 points to Gryffindor!
helping keep the image mapping going, even if the Image Chart is …
shared via email or SMS … and/or …
forms the basis of a Broadcast Talk demonstration session
We could use Ajax techniques for the Javascript client ways an emailee’s link’s webpage invocation can use this new resource, but we kind of like “client pre-emptive iframe” onload event thinking, for both sides of the ledger, to get this going, as per …
function htmlDecode(input) { // thanks to https://stackoverflow.com/questions/1912501/unescape-html-entities-in-javascript
var e = document.createElement('textarea');
e.innerHTML = input;
// handle case of empty input
return e.childNodes.length === 0 ? "" : e.childNodes[0].nodeValue;
}
Think of Dynamic Icons as a way to decorate one or more data points displayed in one of …
Line Chart
Bar Chart
Map Chart
Radar Chart
We had that certain “Wow!“ factor going as we remembered our state’s motto from some years back, and we tried out the Map Chart to see whether we could embellish the map with a Dynamic Icon relevant to New South Wales, as you can see with today’s tutorial picture.
We’ll show you the most recent snapshot of Javascript parameters a little later, but the change for this is an optional one up to the user to work out, with prompts such as the Map Chart one updated …
Enter vertical bar separated country ISO Country and/or Region Code list. Please note that optional Dynamic Icons are available via a suffixing string example applied to the second data point such as &chem=y;s=bubble_icon_text_small;d=ski,bb,NSW%20State%20of%20Wow!,FFFFFF;dp=1;ds=0 eg. AU-NT|AU-NSW|AU-SA|NZ|IN’
And here is its relevance in a new snapshot of parameterizations …
var prechtt=(ctype == 'v' ? chdt + prenchtt + chdl + preachtt : (ctype == 's' ? chdt + prenchtt + chdl + preachtt + '&chxt=x,y' : (ctype == 'gv' ? chdt + prenchtt :
(ctype.substring(0,1) == 'p' ? chdt + prenchtt + chdl + preachtt :
((ctype + ' ').substring(0,2).substring(0,1) == 'bv'.substring(0,1) ? chdt + prenchtt + chdl + preachtt : (ctype.substring(0,1) == 'l' ? chdt + prenchtt + chdl + preachtt :
(ctype == 'map' ? '' :
(ctype == 'gom' ? chdt + prenchtt + chdl + preachtt :
(ctype == 'r' ? chdt + prenchtt + chdl + preachtt :
'')))))))));
var promptone=(ctype == 'v' ? "Enter delimited values string for Venn Diagram such that ... " + String.fromCharCode(10) + "The first three values specify the sizes of three circles: A, B, & C. For chart with only two circles, specify zero for the third value." + String.fromCharCode(10) + "The fourth value specifies the size of the intersection of A and B." + String.fromCharCode(10) + "The fifth value specifies the size of the intersection of A and C. For a chart with only two circles, do not specify a value here." + String.fromCharCode(10) + "The sixth value specifies the size of the intersection of B and C. For a chart with only two circles, do not specify a value here." + String.fromCharCode(10) + "The seventh value specifies the size of the common intersection of A, B, and C. For a chart with only two circles, do not specify a value here." + String.fromCharCode(10) + String.fromCharCode(10) + "" : (ctype == 's' ? "Enter delimited values string for Scatter Chart" : (ctype == 'gv' ? "Enter delimited values string for GraphViz Chart" :
(ctype.substring(0,1) == 'p' ? "Enter delimited values string for Pie Chart" :
((ctype + ' ').substring(0,2).substring(0,1) == 'bv'.substring(0,1) ? "Enter v for Vertical or h for Horizontal then one of g for Group or s for Stacked or o for Overlapped Bar Chart look then a space and then enter delimited values string for Bar Chart. Here is a Candlestick and horizontal Bar Chart idea eg. hg 1:20,10,15,25,17,30|0,5,10,7,12,6|35,25,45,47,24,46|15,40,30,27,39,54|70,55,63,59,80,6 Here is a vertical Bar Chart and Box Chart idea vs 1:-1,5,10,7,12,-1|-1,25,30,27,24,-1|-1,40,45,47,39,-1|-1,55,63,59,80,-1|-1,30,40,35,30,-1|-1,-1,5,70,90,-1|-1,-1,-1,80,5,-1&chm=F,FF9900,0,1:4,40|H,0CBF0B,0,1:4,1:20|H,000000,4,1:4,1:40|H,0000FF,3,1:4,1:20|o,FF0000,5,-1,7|o,FF0000,6,-1,7 Prefix just the delimited string you enter by 1: to additionally display Candlestick/Box Charts or by 0: to only display Candlestick/Box Chart" :
(ctype.substring(0,1) == 'l' ? "Enter c for Even or s for Sparklines or xy for Just XY Line Chart look then a space and then enter delimited values string for Line Chart. Here is a Candlestick and Line Chart idea eg. c 1:20,10,15,25,17,30|0,5,10,7,12,6|35,25,45,47,24,46|15,40,30,27,39,54|70,55,63,59,80,6 Here is a Line Chart and Box Chart idea s 1:-1,5,10,7,12,-1|-1,25,30,27,24,-1|-1,40,45,47,39,-1|-1,55,63,59,80,-1|-1,30,40,35,30,-1|-1,-1,5,70,90,-1|-1,-1,-1,80,5,-1&chm=F,FF9900,0,1:4,40|H,0CBF0B,0,1:4,1:20|H,000000,4,1:4,1:40|H,0000FF,3,1:4,1:20|o,FF0000,5,-1,7|o,FF0000,6,-1,7 Prefix just the delimited string you enter by 1: to additionally display Candlestick/Box Charts or by 0: to only display Candlestick/Box Chart" :
(ctype == 'map' ? "" :
(ctype == 'gom' ? "Enter delimited values string for Google-O-Meter Chart" :
(ctype == 'r' ? "Enter delimited values string for Radar Chart but prefix with an s for smooth lines" :
"")))))))));
var oneprompt=(ctype == 'v' ? "Enter delimited values string for your Venn Diagram collaborations, optionally, such that ... " + String.fromCharCode(10) + "The first three values specify the sizes of three circles: A, B, & C. For chart with only two circles, specify zero for the third value." + String.fromCharCode(10) + "The fourth value specifies the size of the intersection of A and B." + String.fromCharCode(10) + "The fifth value specifies the size of the intersection of A and C. For a chart with only two circles, do not specify a value here." + String.fromCharCode(10) + "The sixth value specifies the size of the intersection of B and C. For a chart with only two circles, do not specify a value here." + String.fromCharCode(10) + "The seventh value specifies the size of the common intersection of A, B, and C. For a chart with only two circles, do not specify a value here." + String.fromCharCode(10) + String.fromCharCode(10) + "" : (ctype == 's' ? "Enter delimited values string for Scatter Chart" : (ctype == 'gv' ? "Enter delimited values string for GraphViz Chart" :
(ctype.substring(0,1) == 'p' ? "Enter delimited values string for Pie Chart" :
((ctype + ' ').substring(0,2).substring(0,1) == 'bv'.substring(0,1) ? "Enter g for Grouped or s for Stacked or o for Overlapped Bar Chart look then a space and then enter delimited values string for Bar Chart. Here is a Candlestick and Bar Chart idea eg. g 1:20,10,15,25,17,30|0,5,10,7,12,6|35,25,45,47,24,46|15,40,30,27,39,54|70,55,63,59,80,6 Here is a vertical Bar Chart and Box Chart idea vs 1:-1,5,10,7,12,-1|-1,25,30,27,24,-1|-1,40,45,47,39,-1|-1,55,63,59,80,-1|-1,30,40,35,30,-1|-1,-1,5,70,90,-1|-1,-1,-1,80,5,-1&chm=F,FF9900,0,1:4,40|H,0CBF0B,0,1:4,1:20|H,000000,4,1:4,1:40|H,0000FF,3,1:4,1:20|o,FF0000,5,-1,7|o,FF0000,6,-1,7 Prefix just the delimited string you enter by 1: to additionally display Candlestick/Box Charts or by 0: to only display Candlestick/Box Chart" :
(ctype.substring(0,1) == 'l' ? "Enter c for Even or s for Sparklines or xy for Just XY Line Chart look then a space and then enter delimited values string for Line Chart. Here is a Candlestick and Line Chart idea eg. c 1:20,10,15,25,17,30|0,5,10,7,12,6|35,25,45,47,24,46|15,40,30,27,39,54|70,55,63,59,80,6 Here is a Line Chart and Box Chart idea s 1:-1,5,10,7,12,-1|-1,25,30,27,24,-1|-1,40,45,47,39,-1|-1,55,63,59,80,-1|-1,30,40,35,30,-1|-1,-1,5,70,90,-1|-1,-1,-1,80,5,-1&chm=F,FF9900,0,1:4,40|H,0CBF0B,0,1:4,1:20|H,000000,4,1:4,1:40|H,0000FF,3,1:4,1:20|o,FF0000,5,-1,7|o,FF0000,6,-1,7 Prefix just the delimited string you enter by 1: to additionally display Candlestick/Box Charts or by 0: to only display Candlestick/Box Chart" :
(ctype == 'map' ? "" :
(ctype == 'gom' ? "Enter delimited values string for Google-O-Meter Chart" :
(ctype == 'r' ? "Enter delimited values string for Radar Chart but prefix with an s for smooth lines" :
"")))))))));
var asktwo=(ctype == 'v' ? true : (ctype == 's' ? true : (ctype == 'gv' ? false :
(ctype.substring(0,1) == 'p' ? true :
((ctype + ' ').substring(0,2).substring(0,1) == 'bv'.substring(0,1) ? true : (ctype.substring(0,1) == 'l' ? true :
(ctype == 'map' ? false :
(ctype == 'gom' ? true :
(ctype == 'r' ? true :
false)))))))));
var answersuffix=(ctype.substring(0,1).replace('m','l').replace('b','l').replace('r','l') == 'l' ? '. Please note that optional Dynamic Icons are available via a suffixing string example applied to the second data point such as &chem=y;s=bubble_icon_text_small;d=ski,bb,Wheeee!,FFFFFF;dp=1;ds=0 ' : '');
var twopb=(ctype.substring(0,1) == 'p' ? 'Any optional legend or title argument snippets? Optionally prefix by 3 for 3d Pie Chart or by c for Concentric Pie Chart. Eg. 3' + chdl + preachtt + '&chtt=My%20' + cencodename + '&chco=' + defchco : 'Any optional legend or title argument snippets? Eg. ' + chdl + preachtt + '&chtt=My%20' + cencodename + '&chco=' + defchco);
var beforeanswer=(ctype.substring(0,1) == 'l' ? 'c ' : ((ctype + ' ').substring(0,2).substring(0,1) == 'bv'.substring(0,1) ? 'vg ' : ''));
… even though it is only visual by nature, presented as an update image still presented and updated periodically. Go figure?!
… and offer a way to help the “Broadcast Talk” demonstrator “speak” during their demonstration, effectively. In so doing, we are going to add to …
the demonstrator’s visual inputs coming from that canvas annotator helper … with, today …
the demonstrator’s commentary, collected via an HTML textarea element (to optionally supplement the visuals) from that canvas annotator helper’s originator window (ie. the Google ChartsImage Chart interfacing supervisor) … presented …
… animated GIF (PHP 404.php helping) means of display in the viewer windows (off email invitation links they receive via the demonstrator) in the changed …
function newfunction() {
if (document.getElementById('bshare')) {
document.getElementById('sbshare').innerHTML='<iframe id=ifco style=display:none; src=></iframe><br><br><textarea rows=2 cols=80 id=bcommentary placeholder="Commentary to Viewers can go here ... start with or end with ... for ongoing ..." onblur="askaway(this);" value=""></textarea><br><br>';
}
}
… latest draft image_venn.html Google Chart Image Chart Venn Chart or Scatter Chart or GraphViz Chart or Pie Chart or Line Chart or Bar Chart or Candlestick/Box Chart or Google-O-Meter Chart or Radar Chart or Map Chart interfacing web application you can also try below.
first tentative steps towards, on non-mobile platforms, allowing for text placement rubber banding
Why the trepidation? Well, so far, when the text is angled we can’t understand what results we are getting back from a call to [element].getBoundingClientRect() just yet.
Why is this needed? Again, with the questions! Well, Mr De Niro, you see, well, somebody might want to go onto that more complex annotating.
And why would they do that? Sheesh. Well, Mr De Niro, sir, you see, sometimes things happen in life, and well, fingers slip on keyboards, and mice get awfullllly nervous around screens these days.
Yeh, well, show us the money, wiseguy. Who’s is that question? And what’s with the questions? Well, you see, Mr De Niro, the money is if we can get PHP text placement for text at an angle, where it rotates from the middle of the text, to get a similar positioning to good ol’ … pardon, Mr De Niro … good and well respected Javascript transform rotations … not with a triple pike, Mr De Niro, but you’re awfulllllly close, Mr De Niro, sir … rather, we throw in a couple of translations … no, not Latin, Mr De Niro … of co-ordinates, Mr De Niro.
And that will bring in how much by next Tuesday? Back to the questions? Why so many questions? We think it’s a pretty big money spinner, Mr De Niro, sir, and we think you should come back next Tuesday, and we can show you the ropes. Sweat, oozing from the brow, as Mr De Niro exits stage left.
And just while we have a few minutes, here’s the updated Javascript parameterization …
var prechtt=(ctype == 'v' ? chdt + prenchtt + chdl + preachtt : (ctype == 's' ? chdt + prenchtt + chdl + preachtt + '&chxt=x,y' : (ctype == 'gv' ? chdt + prenchtt :
(ctype.substring(0,1) == 'p' ? chdt + prenchtt + chdl + preachtt :
((ctype + ' ').substring(0,2).substring(0,1) == 'bv'.substring(0,1) ? chdt + prenchtt + chdl + preachtt : (ctype.substring(0,1) == 'l' ? chdt + prenchtt + chdl + preachtt :
(ctype == 'map' ? '' :
(ctype == 'gom' ? chdt + prenchtt + chdl + preachtt :
(ctype == 'r' ? chdt + prenchtt + chdl + preachtt :
'')))))))));
var promptone=(ctype == 'v' ? "Enter delimited values string for Venn Diagram such that ... " + String.fromCharCode(10) + "The first three values specify the sizes of three circles: A, B, & C. For chart with only two circles, specify zero for the third value." + String.fromCharCode(10) + "The fourth value specifies the size of the intersection of A and B." + String.fromCharCode(10) + "The fifth value specifies the size of the intersection of A and C. For a chart with only two circles, do not specify a value here." + String.fromCharCode(10) + "The sixth value specifies the size of the intersection of B and C. For a chart with only two circles, do not specify a value here." + String.fromCharCode(10) + "The seventh value specifies the size of the common intersection of A, B, and C. For a chart with only two circles, do not specify a value here." + String.fromCharCode(10) + String.fromCharCode(10) + "" : (ctype == 's' ? "Enter delimited values string for Scatter Chart" : (ctype == 'gv' ? "Enter delimited values string for GraphViz Chart" :
(ctype.substring(0,1) == 'p' ? "Enter delimited values string for Pie Chart" :
((ctype + ' ').substring(0,2).substring(0,1) == 'bv'.substring(0,1) ? "Enter v for Vertical or h for Horizontal then one of g for Group or s for Stacked or o for Overlapped Bar Chart look then a space and then enter delimited values string for Bar Chart. Here is a Candlestick and horizontal Bar Chart idea eg. hg 1:20,10,15,25,17,30|0,5,10,7,12,6|35,25,45,47,24,46|15,40,30,27,39,54|70,55,63,59,80,6 Here is a vertical Bar Chart and Box Chart idea vs 1:-1,5,10,7,12,-1|-1,25,30,27,24,-1|-1,40,45,47,39,-1|-1,55,63,59,80,-1|-1,30,40,35,30,-1|-1,-1,5,70,90,-1|-1,-1,-1,80,5,-1&chm=F,FF9900,0,1:4,40|H,0CBF0B,0,1:4,1:20|H,000000,4,1:4,1:40|H,0000FF,3,1:4,1:20|o,FF0000,5,-1,7|o,FF0000,6,-1,7 Prefix just the delimited string you enter by 1: to additionally display Candlestick/Box Charts or by 0: to only display Candlestick/Box Chart" :
(ctype.substring(0,1) == 'l' ? "Enter c for Even or s for Sparklines or xy for Just XY Line Chart look then a space and then enter delimited values string for Line Chart. Here is a Candlestick and Line Chart idea eg. c 1:20,10,15,25,17,30|0,5,10,7,12,6|35,25,45,47,24,46|15,40,30,27,39,54|70,55,63,59,80,6 Here is a Line Chart and Box Chart idea s 1:-1,5,10,7,12,-1|-1,25,30,27,24,-1|-1,40,45,47,39,-1|-1,55,63,59,80,-1|-1,30,40,35,30,-1|-1,-1,5,70,90,-1|-1,-1,-1,80,5,-1&chm=F,FF9900,0,1:4,40|H,0CBF0B,0,1:4,1:20|H,000000,4,1:4,1:40|H,0000FF,3,1:4,1:20|o,FF0000,5,-1,7|o,FF0000,6,-1,7 Prefix just the delimited string you enter by 1: to additionally display Candlestick/Box Charts or by 0: to only display Candlestick/Box Chart" :
(ctype == 'map' ? "" :
(ctype == 'gom' ? "Enter delimited values string for Google-O-Meter Chart" :
(ctype == 'r' ? "Enter delimited values string for Radar Chart but prefix with an s for smooth lines" :
"")))))))));
var oneprompt=(ctype == 'v' ? "Enter delimited values string for your Venn Diagram collaborations, optionally, such that ... " + String.fromCharCode(10) + "The first three values specify the sizes of three circles: A, B, & C. For chart with only two circles, specify zero for the third value." + String.fromCharCode(10) + "The fourth value specifies the size of the intersection of A and B." + String.fromCharCode(10) + "The fifth value specifies the size of the intersection of A and C. For a chart with only two circles, do not specify a value here." + String.fromCharCode(10) + "The sixth value specifies the size of the intersection of B and C. For a chart with only two circles, do not specify a value here." + String.fromCharCode(10) + "The seventh value specifies the size of the common intersection of A, B, and C. For a chart with only two circles, do not specify a value here." + String.fromCharCode(10) + String.fromCharCode(10) + "" : (ctype == 's' ? "Enter delimited values string for Scatter Chart" : (ctype == 'gv' ? "Enter delimited values string for GraphViz Chart" :
(ctype.substring(0,1) == 'p' ? "Enter delimited values string for Pie Chart" :
((ctype + ' ').substring(0,2).substring(0,1) == 'bv'.substring(0,1) ? "Enter g for Grouped or s for Stacked or o for Overlapped Bar Chart look then a space and then enter delimited values string for Bar Chart. Here is a Candlestick and Bar Chart idea eg. g 1:20,10,15,25,17,30|0,5,10,7,12,6|35,25,45,47,24,46|15,40,30,27,39,54|70,55,63,59,80,6 Here is a vertical Bar Chart and Box Chart idea vs 1:-1,5,10,7,12,-1|-1,25,30,27,24,-1|-1,40,45,47,39,-1|-1,55,63,59,80,-1|-1,30,40,35,30,-1|-1,-1,5,70,90,-1|-1,-1,-1,80,5,-1&chm=F,FF9900,0,1:4,40|H,0CBF0B,0,1:4,1:20|H,000000,4,1:4,1:40|H,0000FF,3,1:4,1:20|o,FF0000,5,-1,7|o,FF0000,6,-1,7 Prefix just the delimited string you enter by 1: to additionally display Candlestick/Box Charts or by 0: to only display Candlestick/Box Chart" :
(ctype.substring(0,1) == 'l' ? "Enter c for Even or s for Sparklines or xy for Just XY Line Chart look then a space and then enter delimited values string for Line Chart. Here is a Candlestick and Line Chart idea eg. c 1:20,10,15,25,17,30|0,5,10,7,12,6|35,25,45,47,24,46|15,40,30,27,39,54|70,55,63,59,80,6 Here is a Line Chart and Box Chart idea s 1:-1,5,10,7,12,-1|-1,25,30,27,24,-1|-1,40,45,47,39,-1|-1,55,63,59,80,-1|-1,30,40,35,30,-1|-1,-1,5,70,90,-1|-1,-1,-1,80,5,-1&chm=F,FF9900,0,1:4,40|H,0CBF0B,0,1:4,1:20|H,000000,4,1:4,1:40|H,0000FF,3,1:4,1:20|o,FF0000,5,-1,7|o,FF0000,6,-1,7 Prefix just the delimited string you enter by 1: to additionally display Candlestick/Box Charts or by 0: to only display Candlestick/Box Chart" :
(ctype == 'map' ? "" :
(ctype == 'gom' ? "Enter delimited values string for Google-O-Meter Chart" :
(ctype == 'r' ? "Enter delimited values string for Radar Chart but prefix with an s for smooth lines" :
"")))))))));
var asktwo=(ctype == 'v' ? true : (ctype == 's' ? true : (ctype == 'gv' ? false :
(ctype.substring(0,1) == 'p' ? true :
((ctype + ' ').substring(0,2).substring(0,1) == 'bv'.substring(0,1) ? true : (ctype.substring(0,1) == 'l' ? true :
(ctype == 'map' ? false :
(ctype == 'gom' ? true :
(ctype == 'r' ? true :
false)))))))));
var twopb=(ctype.substring(0,1) == 'p' ? 'Any optional legend or title argument snippets? Optionally prefix by 3 for 3d Pie Chart or by c for Concentric Pie Chart. Eg. 3' + chdl + preachtt + '&chtt=My%20' + cencodename + '&chco=' + defchco : 'Any optional legend or title argument snippets? Eg. ' + chdl + preachtt + '&chtt=My%20' + cencodename + '&chco=' + defchco);
var beforeanswer=(ctype.substring(0,1) == 'l' ? 'c ' : ((ctype + ' ').substring(0,2).substring(0,1) == 'bv'.substring(0,1) ? 'vg ' : ''));
var emsmlist='';
… that goes into helping make the changedlatest draft image_venn.html Google Chart Image Chart Venn Chart or Scatter Chart or GraphViz Chart or Pie Chart or Line Chart or Bar Chart or Candlestick/Box Chart or Google-O-Meter Chart or Radar Chart or Map Chart interfacing web application you can also try below, have regular sleepovers on cloud nine.
? It styles an input type=number textbox where a placeholder is not really an option to explain a textbox’s purpose, and we do dislike set aside labels, these days. It’s also a way to explain the textbox for mobile users who do not get a hovering message to help. It’s also got an internationalization feel to it, using the degree sign emoji ° (ie. ° or that \u0080 UTF-16 Encoding style of definition suitable for CSS styling usage) to both associate the units we’d want, as well as that we are asking for an angle. Clockwise or anticlockwise, alas, comes down to user experience!
var prechtt=(ctype == 'v' ? chdt + prenchtt + chdl + preachtt : (ctype == 's' ? chdt + prenchtt + chdl + preachtt + '&chxt=x,y' : (ctype == 'gv' ? chdt + prenchtt :
(ctype.substring(0,1) == 'p' ? chdt + prenchtt + chdl + preachtt :
((ctype + ' ').substring(0,2).substring(0,1) == 'bv'.substring(0,1) ? chdt + prenchtt + chdl + preachtt : (ctype.substring(0,1) == 'l' ? chdt + prenchtt + chdl + preachtt :
(ctype == 'map' ? '' :
(ctype == 'gom' ? chdt + prenchtt + chdl + preachtt :
''))))))));
var promptone=(ctype == 'v' ? "Enter delimited values string for Venn Diagram such that ... " + String.fromCharCode(10) + "The first three values specify the sizes of three circles: A, B, & C. For chart with only two circles, specify zero for the third value." + String.fromCharCode(10) + "The fourth value specifies the size of the intersection of A and B." + String.fromCharCode(10) + "The fifth value specifies the size of the intersection of A and C. For a chart with only two circles, do not specify a value here." + String.fromCharCode(10) + "The sixth value specifies the size of the intersection of B and C. For a chart with only two circles, do not specify a value here." + String.fromCharCode(10) + "The seventh value specifies the size of the common intersection of A, B, and C. For a chart with only two circles, do not specify a value here." + String.fromCharCode(10) + String.fromCharCode(10) + "" : (ctype == 's' ? "Enter delimited values string for Scatter Chart" : (ctype == 'gv' ? "Enter delimited values string for GraphViz Chart" :
(ctype.substring(0,1) == 'p' ? "Enter delimited values string for Pie Chart" :
((ctype + ' ').substring(0,2).substring(0,1) == 'bv'.substring(0,1) ? "Enter v for Vertical or h for Horizontal then one of g for Group or s for Stacked or o for Overlapped Bar Chart look then a space and then enter delimited values string for Bar Chart. Here is a Candlestick and horizontal Bar Chart idea eg. hg 1:20,10,15,25,17,30|0,5,10,7,12,6|35,25,45,47,24,46|15,40,30,27,39,54|70,55,63,59,80,6 Here is a vertical Bar Chart and Box Chart idea vs 1:-1,5,10,7,12,-1|-1,25,30,27,24,-1|-1,40,45,47,39,-1|-1,55,63,59,80,-1|-1,30,40,35,30,-1|-1,-1,5,70,90,-1|-1,-1,-1,80,5,-1&chm=F,FF9900,0,1:4,40|H,0CBF0B,0,1:4,1:20|H,000000,4,1:4,1:40|H,0000FF,3,1:4,1:20|o,FF0000,5,-1,7|o,FF0000,6,-1,7 Prefix just the delimited string you enter by 1: to additionally display Candlestick/Box Charts or by 0: to only display Candlestick/Box Chart" :
(ctype.substring(0,1) == 'l' ? "Enter c for Even or s for Sparklines or xy for Just XY Line Chart look then a space and then enter delimited values string for Line Chart. Here is a Candlestick and Line Chart idea eg. c 1:20,10,15,25,17,30|0,5,10,7,12,6|35,25,45,47,24,46|15,40,30,27,39,54|70,55,63,59,80,6 Here is a Line Chart and Box Chart idea s 1:-1,5,10,7,12,-1|-1,25,30,27,24,-1|-1,40,45,47,39,-1|-1,55,63,59,80,-1|-1,30,40,35,30,-1|-1,-1,5,70,90,-1|-1,-1,-1,80,5,-1&chm=F,FF9900,0,1:4,40|H,0CBF0B,0,1:4,1:20|H,000000,4,1:4,1:40|H,0000FF,3,1:4,1:20|o,FF0000,5,-1,7|o,FF0000,6,-1,7 Prefix just the delimited string you enter by 1: to additionally display Candlestick/Box Charts or by 0: to only display Candlestick/Box Chart" :
(ctype == 'map' ? "" :
(ctype == 'gom' ? "Enter delimited values string for Google-O-Meter Chart" :
""))))))));
var oneprompt=(ctype == 'v' ? "Enter delimited values string for your Venn Diagram collaborations, optionally, such that ... " + String.fromCharCode(10) + "The first three values specify the sizes of three circles: A, B, & C. For chart with only two circles, specify zero for the third value." + String.fromCharCode(10) + "The fourth value specifies the size of the intersection of A and B." + String.fromCharCode(10) + "The fifth value specifies the size of the intersection of A and C. For a chart with only two circles, do not specify a value here." + String.fromCharCode(10) + "The sixth value specifies the size of the intersection of B and C. For a chart with only two circles, do not specify a value here." + String.fromCharCode(10) + "The seventh value specifies the size of the common intersection of A, B, and C. For a chart with only two circles, do not specify a value here." + String.fromCharCode(10) + String.fromCharCode(10) + "" : (ctype == 's' ? "Enter delimited values string for Scatter Chart" : (ctype == 'gv' ? "Enter delimited values string for GraphViz Chart" :
(ctype.substring(0,1) == 'p' ? "Enter delimited values string for Pie Chart" :
((ctype + ' ').substring(0,2).substring(0,1) == 'bv'.substring(0,1) ? "Enter g for Grouped or s for Stacked or o for Overlapped Bar Chart look then a space and then enter delimited values string for Bar Chart. Here is a Candlestick and Bar Chart idea eg. g 1:20,10,15,25,17,30|0,5,10,7,12,6|35,25,45,47,24,46|15,40,30,27,39,54|70,55,63,59,80,6 Here is a vertical Bar Chart and Box Chart idea vs 1:-1,5,10,7,12,-1|-1,25,30,27,24,-1|-1,40,45,47,39,-1|-1,55,63,59,80,-1|-1,30,40,35,30,-1|-1,-1,5,70,90,-1|-1,-1,-1,80,5,-1&chm=F,FF9900,0,1:4,40|H,0CBF0B,0,1:4,1:20|H,000000,4,1:4,1:40|H,0000FF,3,1:4,1:20|o,FF0000,5,-1,7|o,FF0000,6,-1,7 Prefix just the delimited string you enter by 1: to additionally display Candlestick/Box Charts or by 0: to only display Candlestick/Box Chart" :
(ctype.substring(0,1) == 'l' ? "Enter c for Even or s for Sparklines or xy for Just XY Line Chart look then a space and then enter delimited values string for Line Chart. Here is a Candlestick and Line Chart idea eg. c 1:20,10,15,25,17,30|0,5,10,7,12,6|35,25,45,47,24,46|15,40,30,27,39,54|70,55,63,59,80,6 Here is a Line Chart and Box Chart idea s 1:-1,5,10,7,12,-1|-1,25,30,27,24,-1|-1,40,45,47,39,-1|-1,55,63,59,80,-1|-1,30,40,35,30,-1|-1,-1,5,70,90,-1|-1,-1,-1,80,5,-1&chm=F,FF9900,0,1:4,40|H,0CBF0B,0,1:4,1:20|H,000000,4,1:4,1:40|H,0000FF,3,1:4,1:20|o,FF0000,5,-1,7|o,FF0000,6,-1,7 Prefix just the delimited string you enter by 1: to additionally display Candlestick/Box Charts or by 0: to only display Candlestick/Box Chart" :
(ctype == 'map' ? "" :
(ctype == 'gom' ? "Enter delimited values string for Google-O-Meter Chart" :
""))))))));
var asktwo=(ctype == 'v' ? true : (ctype == 's' ? true : (ctype == 'gv' ? false :
(ctype.substring(0,1) == 'p' ? true :
((ctype + ' ').substring(0,2).substring(0,1) == 'bv'.substring(0,1) ? true : (ctype.substring(0,1) == 'l' ? true :
(ctype == 'map' ? false :
(ctype == 'gom' ? true :
false))))))));
var twopb=(ctype.substring(0,1) == 'p' ? 'Any optional legend or title argument snippets? Optionally prefix by 3 for 3d Pie Chart or by c for Concentric Pie Chart. Eg. 3' + chdl + preachtt + '&chtt=My%20' + cencodename + '&chco=' + defchco : 'Any optional legend or title argument snippets? Eg. ' + chdl + preachtt + '&chtt=My%20' + cencodename + '&chco=' + defchco);
var beforeanswer=(ctype.substring(0,1) == 'l' ? 'c ' : ((ctype + ' ').substring(0,2).substring(0,1) == 'bv'.substring(0,1) ? 'vg ' : ''));
var emsmlist='';
… that goes into helping make the changedlatest draft image_venn.html Google Chart Image Chart Venn Chart or Scatter Chart or GraphViz Chart or Pie Chart or Line Chart or Bar Chart or Candlestick/Box Chart or Google-O-Meter Chart or Map Chart interfacing web application you can also try below, one of the happiest little vegemites we know.
Restricting you creatives to “inhouse annotations” of the “gray variety” might be seen as a bit boooorrrriiiinnnngggg! And so, onto the progress up to yesterday’s Google Chart Image Chart Rubber Banding Tutorial, today we’ve added a …
colour picker … way user can define an “inhouse annotations” colour … and while we were at it …
as far as text “inhouse annotations” go we’ve added a counterclockwise from the horizon, in degrees, way to define an angle the text should be placed at … and …
we’ve stopped closing off the text font size dropdown too early, allowing the user to mix it up with their annotations, and so …
We now recommend, for those users pushing the boundaries of functionality, to gather all their “inhouse annotations” together before any “graphical canvas annotations” are thought about.
Both colour and degree counterclockwise angle became “Mantissa Madness Monday” tragics, a bit like moi, really?
How did we express these two measures?
colour can be derived at the 404.php end via mantissae that are 9 or more long where a number of the form rrrgggbbb is numerical and passed across to 404.php in the y co-ordinate mantissa … while … kind of crazily …
angle can be a set of zeros in the x co-ordinate mantissa represented by zero characters to the length of the angle from 1 to 359 in front of a pre-existant font size (in px) usage, from last “Mantissa Madness Monday” (us getting away with this because no font size should start with a zero)
Oh! We have such fun around here?! Below is PHP WordPress blog 404.php code …
Rubber banding is a popular technique of drawing geometric primitives such as line, polylines, rectangle, circle and ellipse on the computer screen.
… really appeals to our “inner programmer” … damn! … come, thou, out into the open, reveal thyself! … the sunshine is wonderful down here, and we’ve done away with death duties! … mostly! … but it is …
only really a non-mobile prospect …
function checkforaction(rubberbanding,nx,ny) {
var bcbit='background-color:rgba(127,127,127,0.5);';
var zeroes='';
var classbit='';
var brbit='';
var ourdist=0;
var ioff=(rubberbanding == true ? 1 : 0);
var mone=1;
But there’s more! Despite how long out of the day it takes to barrack for Hairtie United, there was a mobile matter we resolved. A slide in today’s animated GIF presentation shows the issue. On mobile platforms, with these inhouse annotations, it would immediately show a tiny annotation. There panned out to be two event programming related issues we needed to fix related to this problem …
change looking for a “touchstart” event, and instead look for a “touchdown” event for a document.body scope (else we might have restricted the “scope” to just document.getEleementById(‘myvenn’) as another approach (and you should note our event.stopPropagation() statements in lots of places as another research point for you)) because we are talking “discrete click” user behaviour we are targeting … as well as …
start checking that the co-ordinates calculated fall into the range of the Google Charts Image Chart image dimensions … doh!
if (evt.touches) {
if (evt.touches[0].pageX) {
//alert('here');
x = evt.touches[0].pageX + document.body.scrollLeft - elemLeft;
y = evt.touches[0].pageY + document.body.scrollTop - elemTop;
if (x >= 0 && x <= eval(('' + document.getElementById('myvenn').width).replace('px','')) && y >= 0 && y <= eval(('' + document.getElementById('myvenn').height).replace('px',''))) {
if (curno >= 0 && (lastx != x || lasty != y)) {
xneeds.push(x);
yneeds.push(y);
checkforaction(false,-1,-1);
}
lastx=x;
lasty=y;
}
//alert('x:' + x + ' and y:' + y);
} else {
//alert('Here');
x = evt.touches[0].clientX + document.body.scrollLeft - elemLeft;
y = evt.touches[0].clientY + document.body.scrollTop - elemTop;
if (x >= 0 && x <= eval(('' + document.getElementById('myvenn').width).replace('px','')) && y >= 0 && y <= eval(('' + document.getElementById('myvenn').height).replace('px',''))) {
if (curno >= 0 && (lastx != x || lasty != y)) {
xneeds.push(x);
yneeds.push(y);
checkforaction(false,-1,-1);
}
lastx=x;
lasty=y;
}
//alert('x:' + x + ' and y:' + y);
}
} else if (evt.clientX || ev.clientY) {
//alert('HERE');
x = evt.clientX + document.body.scrollLeft - elemLeft;
y = evt.clientY + document.body.scrollTop - elemTop;
if (x >= 0 && x <= eval(('' + document.getElementById('myvenn').width).replace('px','')) && y >= 0 && y <= eval(('' + document.getElementById('myvenn').height).replace('px',''))) {
if (curno >= 0 && (lastx != x || lasty != y)) {
xneeds.push(x);
yneeds.push(y);
checkforaction(false,-1,-1);
}
lastx=x;
lasty=y;
}
} else {
//alert('HEre');
x = evt.pageX + document.body.scrollLeft - elemLeft;
y = evt.pageY + document.body.scrollTop - elemTop;
if (x >= 0 && x <= eval(('' + document.getElementById('myvenn').width).replace('px','')) && y >= 0 && y <= eval(('' + document.getElementById('myvenn').height).replace('px',''))) {
if (curno >= 0 && (lastx != x || lasty != y)) {
xneeds.push(x);
yneeds.push(y);
checkforaction(false,-1,-1);
}
lastx=x;
lasty=y;
}
}
});
Did you know?
Well … we didn’t?! We happened to try the web application above on a tiny iPad and saw that HTML button elements with an innerHTML label containing a line feed ( ie. <br> ) only showed the top line, and, alas, for that button in question, the vital new information used to be on the second line. Hence our fix …
//document.getElementById('bshare').innerHTML='Repainting Top Left Image Periodically ... <br>Click here to Broadcast this session to other interested parties ...';
document.getElementById('bshare').innerHTML='Click here to Broadcast this session to other interested parties ...<br>Repainting Top Left Image Periodically ...';
The CSS border-radius property has come to the rescue of many a programmer, saving us from resorting to SVG to display circle or ellipses or arcs of various sorts …
function checkforaction() {
var bcbit='background-color:rgba(127,127,127,0.5);';
var zeroes='';
var classbit='';
var brbit='';
var ourdist=0;
images saved as changes are detected gathered, as ever smaller thumbnails, in the top right of four table cells of the user display …
var iijk=0, uniquif=''; snapshots=[], elem=null, elemcontext=null, oimg=null, checkforsquare=2;
We hope you try new functionality in our changedeighth draft image_venn.html Google Chart Image Chart Venn Chart or Scatter Chart or GraphViz Chart or Pie Chart or Line Chart or Bar Chart or Candlestick Chart or Map Chart interfacing web application you can also try below.
once a user has that “More Annotation” annotating happening … offer the chance to …
Broadcast … their work as it happens, dynamically …
to an emailee list audience
… and we’re calling this …
Broadcast Talk
… even though it is only visual by nature, presented as an update image still presented and updated periodically. Go figure?! We’re blaming that supper time two back. We’re not sure?!
Anyway, we hope you try out the new arrangements in our changedseventh draft image_venn.html Google Chart Image Chart Venn Chart or Scatter Chart or GraphViz Chart or Pie Chart or Line Chart or Bar Chart or Candlestick Chart or Map Chart interfacing web application you can also try below, and helped out by a WordPress blog good ol’ TwentyTen theme 404.php which now includes …
… the latter being like a “parasite” display idea off the more conventional Statistical Graph favourites, the Line Chart and Bar Chart, where you have a relationship between a numerical concept (eg. sales) and another type of concept (eg. month of the year), and you want to present the data in a graphical form.
Again, we haven’t stopped our “retweaking”. We might “retweak” in the morning or we might “retweak” over a coffee break or we might “retweak” at supper time, but the end result is, well, you’re reading it now!
var prechtt=(ctype == 'v' ? chdt + prenchtt + chdl + preachtt : (ctype == 's' ? chdt + prenchtt + chdl + preachtt + '&chxt=x,y' : (ctype == 'gv' ? chdt + prenchtt :
(ctype.substring(0,1) == 'p' ? chdt + prenchtt + chdl + preachtt :
((ctype + ' ').substring(0,2) == 'bv' ? chdt + prenchtt + chdl + preachtt : (ctype.substring(0,1) == 'l' ? chdt + prenchtt + chdl + preachtt : ''))))));
var promptone=(ctype == 'v' ? "Enter delimited values string for Venn Diagram such that ... " + String.fromCharCode(10) + "The first three values specify the sizes of three circles: A, B, & C. For chart with only two circles, specify zero for the third value." + String.fromCharCode(10) + "The fourth value specifies the size of the intersection of A and B." + String.fromCharCode(10) + "The fifth value specifies the size of the intersection of A and C. For a chart with only two circles, do not specify a value here." + String.fromCharCode(10) + "The sixth value specifies the size of the intersection of B and C. For a chart with only two circles, do not specify a value here." + String.fromCharCode(10) + "The seventh value specifies the size of the common intersection of A, B, and C. For a chart with only two circles, do not specify a value here." + String.fromCharCode(10) + String.fromCharCode(10) + "" : (ctype == 's' ? "Enter delimited values string for Scatter Chart" : (ctype == 'gv' ? "Enter delimited values string for GraphViz Chart" :
(ctype.substring(0,1) == 'p' ? "Enter delimited values string for Pie Chart" :
((ctype + ' ').substring(0,2) == 'bv' ? "Enter g for Group or s for Stacked or o for Overlapped Bar Chart look then a space and then enter delimited values string for Bar Chart. Here is a Candlestick and Bar Chart idea eg. g 1:20,10,15,25,17,30|0,5,10,7,12,6|35,25,45,47,24,46|15,40,30,27,39,54|70,55,63,59,80,6 Prefix just the delimited string you enter by 1: to additionally display Candlestick Charts or by 0: to only display Candlestick Chart" :
(ctype.substring(0,1) == 'l' ? "Enter c for Even or s for Sparklines or xy for Just XY Line Chart look then a space and then enter delimited values string for Line Chart. Here is a Candlestick and Line Chart idea eg. c 1:20,10,15,25,17,30|0,5,10,7,12,6|35,25,45,47,24,46|15,40,30,27,39,54|70,55,63,59,80,6 Prefix just the delimited string you enter by 1: to additionally display Candlestick Charts or by 0: to only display Candlestick Chart" : ""))))));
var oneprompt=(ctype == 'v' ? "Enter delimited values string for your Venn Diagram collaborations, optionally, such that ... " + String.fromCharCode(10) + "The first three values specify the sizes of three circles: A, B, & C. For chart with only two circles, specify zero for the third value." + String.fromCharCode(10) + "The fourth value specifies the size of the intersection of A and B." + String.fromCharCode(10) + "The fifth value specifies the size of the intersection of A and C. For a chart with only two circles, do not specify a value here." + String.fromCharCode(10) + "The sixth value specifies the size of the intersection of B and C. For a chart with only two circles, do not specify a value here." + String.fromCharCode(10) + "The seventh value specifies the size of the common intersection of A, B, and C. For a chart with only two circles, do not specify a value here." + String.fromCharCode(10) + String.fromCharCode(10) + "" : (ctype == 's' ? "Enter delimited values string for Scatter Chart" : (ctype == 'gv' ? "Enter delimited values string for GraphViz Chart" :
(ctype.substring(0,1) == 'p' ? "Enter delimited values string for Pie Chart" :
((ctype + ' ').substring(0,2) == 'bv' ? "Enter g for Grouped or s for Stacked or o for Overlapped Bar Chart look then a space and then enter delimited values string for Bar Chart. Here is a Candlestick and Bar Chart idea eg. g 1:20,10,15,25,17,30|0,5,10,7,12,6|35,25,45,47,24,46|15,40,30,27,39,54|70,55,63,59,80,6 Prefix just the delimited string you enter by 1: to additionally display Candlestick Charts or by 0: to only display Candlestick Chart" :
(ctype.substring(0,1) == 'l' ? "Enter c for Even or s for Sparklines or xy for Just XY Line Chart look then a space and then enter delimited values string for Line Chart. Here is a Candlestick and Line Chart idea eg. c 1:20,10,15,25,17,30|0,5,10,7,12,6|35,25,45,47,24,46|15,40,30,27,39,54|70,55,63,59,80,6 Prefix just the delimited string you enter by 1: to additionally display Candlestick Charts or by 0: to only display Candlestick Chart" : ""))))));
var asktwo=(ctype == 'v' ? true : (ctype == 's' ? true : (ctype == 'gv' ? false :
(ctype.substring(0,1) == 'p' ? true :
((ctype + ' ').substring(0,2) == 'bv' ? true : (ctype.substring(0,1) == 'l' ? true : false))))));
var twopb=(ce.substring(0,1) == 'p' ? 'Any optional legend or title argument snippets? Optionally prefix by 3 for 3d Pie Chart or by c for Concentric Pie Chart. Eg. 3' + chdl + preachtt + '&chtt=My%20' + cencodename + '&chco=' + defchco : 'Any optional legend or title argument snippets? Eg. ' + chdl + preachtt + '&chtt=My%20' + cencodename + '&chco=' + defchco);
var beforeanswer=(ctype.substring(0,1) == 'l' ? 'c ' : ((ctype + ' ').substring(0,2) == 'bv' ? 'g ' : ''));
And yes, you can, and we did, put line feeds into those ternery statements to help with their readability as we add complexity to the parameterization, as we go along, in our changedsixth draft image_venn.html Google Chart Image Chart Venn Chart or Scatter Chart or GraphViz Chart or Pie Chart or Line Chart or Bar Chart or Candlestick Chart interfacing web application you can also try below.
Yes, we are dovetailing with work we’ve done in the past using the excellent …
canvas … element introduced with HTML5 … whereby …
annotations like …
scribble … as the default, and various other …
discrete click shapes … and …
text … including emojis … and …
image
… annotating modus operandi
… can be part of the arrangements. It works that the Annotation Helper is opened …
in a new “known about” popup window … looking out for …
parent based “img” element (in the modus operandi we use, calling it, regarding the parent top left image) … so as to be able to …
populate its canvas element with a clone of that calling “img” graphical content … but add into the mix …
menu driven annotation functionality which can change that canvas look and underlying data … and …
the caller can keep track of this and arrange, or not, for these changes to be reflected back at its top left “img” element … the catch being …
the “within range of GET argument” limits are ruined by this introduction of graphical data, and so in agreeing to this, a user forgoes those simpler sharing and annotating functionalities of yesterday’s (and before) work … though your normal image sharing capabilities via the web browser remain in the caller and the called
As well, today, we are introducing new Google ChartsImage ChartPie Chart interfacing, and because this chart type can have the three …
Normal
3D
Concentric
… guises, there was some work to keep us off this street (okay … so we divulged … again) …
var pretherest='';
var cht=location.search.split('cht=')[1] ? decodeURIComponent(location.search.split('cht=')[1].split('&')[0]) : "v";
if ((cht + ' ').substring(0,1) == 'p' && cht != 'p') { pretherest=cht.substring(1); }
var ctype=location.search.split('type=')[1] ? decodeURIComponent(location.search.split('type=')[1].split('&')[0]) : cht;
var cname=(ctype == 'v' ? 'Venn Chart' : (ctype == 's' ? 'Scatter Chart' : (ctype == 'gv' ? 'GraphViz Chart' : (ctype.substring(0,1) == 'p' ? 'Pie Chart' : ''))));
var cencodename=(ctype == 'v' ? 'Venn%20Diagram' : (ctype == 's' ? 'Scatter%20Chart' : (ctype == 'gv' ? 'GraphViz%20Chart' : (ctype.substring(0,1) == 'p' ? 'Pie%20Chart' : ''))));
var chdt=(ctype == 'v' ? '&chd=t:' : (ctype == 's' ? '&chd=t:' : (ctype == 'gv' ? '&chl=' : (ctype.substring(0,1) == 'p' ? pretherest + '&chd=t:' : ''))));
var chdeq=(ctype == 'v' ? '&chd=' : (ctype == 's' ? '&chd=' : (ctype == 'gv' ? '&chl=' : (ctype.substring(0,1) == 'p' ? '&chd=' : ''))));
var tc=(ctype == 'v' ? 't:' : (ctype == 's' ? 't:' : (ctype == 'gv' ? '' : (ctype.substring(0,1) == 'p' ? 't:' : ''))));
var chdl=(ctype == 'v' ? '&chdl=' : (ctype == 's' ? '&chdl=' : (ctype == 'gv' ? '' : (ctype.substring(0,1) == 'p' ? '&chdl=' : ''))));
var prenchtt=(ctype == 'v' ? '100,80,60,30,30,30,10' : (ctype == 's' ? '12,87,75,41,23,96,68,71,34,9|98,60,27,34,56,79,58,74,18,76|84,23,69,81,47,94,60,93,64,54' : (ctype == 'gv' ? 'graph{C_0--H_0[type=s];C_0--H_1[type=s];C_0--H_2[type=s];C_0--C_1[type=s];C_1--H_3[type=s];C_1--H_4[type=s];C_1--H_5[type=s]}' : (ctype.substring(0,1) == 'p' ? '1,2,3,4' : ''))));
var preachtt=(ctype == 'v' ? 'A|B|C' : (ctype == 's' ? 'Cats|Dogs' : (ctype == 'gv' ? '' : (ctype.substring(0,1) == 'p' ? 'January|February|March|April' : ''))));
var prechtt=(ctype == 'v' ? chdt + prenchtt + chdl + preachtt : (ctype == 's' ? chdt + prenchtt + chdl + preachtt + '&chxt=x,y' : (ctype == 'gv' ? chdt + prenchtt : (ctype.substring(0,1) == 'p' ? chdt + prenchtt + chdl + preachtt : ''))));
var defchco=(ctype == 'v' ? 'ff0000,00ff00,0000ff' : (ctype == 's' ? 'FF0000|0000FF&chxt=x,y' : (ctype == 'gv' ? '' : (ctype.substring(0,1) == 'p' ? 'ff0000,00ff00,0000ff,ff00ff' : ''))));
var promptone=(ctype == 'v' ? "Enter delimited values string for Venn Diagram such that ... " + String.fromCharCode(10) + "The first three values specify the sizes of three circles: A, B, & C. For chart with only two circles, specify zero for the third value." + String.fromCharCode(10) + "The fourth value specifies the size of the intersection of A and B." + String.fromCharCode(10) + "The fifth value specifies the size of the intersection of A and C. For a chart with only two circles, do not specify a value here." + String.fromCharCode(10) + "The sixth value specifies the size of the intersection of B and C. For a chart with only two circles, do not specify a value here." + String.fromCharCode(10) + "The seventh value specifies the size of the common intersection of A, B, and C. For a chart with only two circles, do not specify a value here." + String.fromCharCode(10) + String.fromCharCode(10) + "" : (ctype == 's' ? "Enter delimited values string for Scatter Chart" : (ctype == 'gv' ? "Enter delimited values string for GraphViz Chart" : (ctype.substring(0,1) == 'p' ? "Enter delimited values string for Pie Chart" : ""))));
var oneprompt=(ctype == 'v' ? "Enter delimited values string for your Venn Diagram collaborations, optionally, such that ... " + String.fromCharCode(10) + "The first three values specify the sizes of three circles: A, B, & C. For chart with only two circles, specify zero for the third value." + String.fromCharCode(10) + "The fourth value specifies the size of the intersection of A and B." + String.fromCharCode(10) + "The fifth value specifies the size of the intersection of A and C. For a chart with only two circles, do not specify a value here." + String.fromCharCode(10) + "The sixth value specifies the size of the intersection of B and C. For a chart with only two circles, do not specify a value here." + String.fromCharCode(10) + "The seventh value specifies the size of the common intersection of A, B, and C. For a chart with only two circles, do not specify a value here." + String.fromCharCode(10) + String.fromCharCode(10) + "" : (ctype == 's' ? "Enter delimited values string for Scatter Chart" : (ctype == 'gv' ? "Enter delimited values string for GraphViz Chart" : (ctype.substring(0,1) == 'p' ? "Enter delimited values string for Pie Chart" : ""))));
var asktwo=(ctype == 'v' ? true : (ctype == 's' ? true : (ctype == 'gv' ? false : (ctype.substring(0,1) == 'p' ? true : false))));
var twopb=(ctype.substring(0,1) == 'p' ? 'Any optional legend or title argument snippets? Optionally prefix by 3 for 3d Pie Chart or by c for Concentric Pie Chart. Eg. 3' + chdl + preachtt + '&chtt=My%20' + cencodename + '&chco=' + defchco : 'Any optional legend or title argument snippets? Eg. ' + chdl + preachtt + '&chtt=My%20' + cencodename + '&chco=' + defchco);
var atend="<canvas id=sharecanvas style=display:none;></canvas><div style=display:none;><label for='shareurl'><input type=button onclick='downloadmaybe(); shareurl();' id='sbut' value='Share URL Link'></input>: </label><input onblur=changeu(this.value); title='Suffix by hashtag 1 is text and hashtag 2 is title' style='width:45%;' type=url value='' placeholder='https://www.rjmprogramming.com.au/ITblog/#RJM Programming Blog#IT Blog' id=shareurl ondblclick='this.value=trythis(this.placeholder);'></input><br><br><span> ... and/or ... </span><br><br><label for='files'><input type=button onclick=document.getElementById('share').click(); value='Share media or document files'></input>: </label><input id='files' type='file' accept='image/*,video/*,audio/*,application/*,text/*' multiple></div><br><br><button id='share' type='button'>Share your media or documents or link!</button><output id='output'></output><scr" + "ipt type='text/javascript' src='/web_share_api_test.js?canv" + "asshare=as_necessary9867654' defer></scr" + "ipt>";
atend='';
var vals=[], annowin=null;
var lastbit="<br><br><br><br> <button title='Other complex canvas annotation functionalities (forgoes the simpler ones above) ...' id=annobut onclick=\"document.getElementById('tdleft').style.verticalAlign='top'; setTimeout(prerepaint, 12000); if (arest.length != 0) { if (document.getElementById('myvenn').src.indexOf(arest) == -1) { pdivhide(); document.getElementById('myvenn').src=document.getElementById('myvenn').src.split(arest.substring(0,5))[0] + arest; document.getElementById('tdleft').style.verticalAlign='top'; } } annowin=window.open('/HTMLCSS/user_of_signature_signature.htm?elemode=img','_blank','top=420,left=620,width=900,height=420'); \" style=\"background-color:yellow;\">More Annotations</button> <button id=bshare onclick=repaint(); style=display:none;>Repaint <font size=1>(but lose sharing emojis above)</font></button><br><div id=divcanvas style=display:none;><canvas id=bottomcanvas></canvas></div>";
var fszbit=' <span id=spanfsz><select id=fsz onchange="fsz=this.value;"><option value=".10">10px</option><option value=".6">6px</option><option value=".8">8px</option><option value=".9">9px</option><option value=".11">11px</option><option value=".12">12px</option><option value=".14">14px</option><option value=".16">16px</option><option value=".18">18px</option><option value=".20">20px</option><option value=".24">24px</option><option value=".30">30px</option><option value=".36">36px</option><option value=".40">40px</option><option value=".48">48px</option><option value=".50">50px</option><option value=".64">64px</option></select></span>';
var origemailurl='mailto:?subject=My%20' + cencodename + '%20...%20best%20viewed%20in%20landscape%20...&body=';
var origsmsurl='sms:&body=My%20' + cencodename + '%20...%20best%20viewed%20in%20landscape%20...';
var smsee='';
var chd=location.search.split(chdeq)[1] ? (tc + decodeURIComponent(location.search.split(chdeq)[1].split('&')[0])).replace('t:t:', 't:').replace(/^t\:$/g, '') : "";
var therest=location.search.split(chdeq)[1] ? (pretherest + document.URL.split(document.URL.split('#')[0].split(chdeq)[1].split('&')[0])[1].split('#')[0]) : "";
GraphViz is a package of open source tools for visualizing connectivity graphs. You can create GraphViz graphs using the DOT language and your choice of layout engines.
Org charts are diagrams of a hierarchy of nodes, commonly used to portray superior/subordinate relationships in an organization. A family tree is a type of org chart.
start with an at least two part “inhouse phase” of additional “extra to text” annotation functionality possibilities … just starting with …
line
open rectangle
filled rectangle
… additional functionality, that we may well add to, but being as we feel a change we’ll leave that for another time.
The WordPress blog “404.php” code snippet becomes …
Would you believe, at least to us, it is far less obvious how to display a straight line (that is perhaps not horizontal nor vertical) within a webpage, than it is to display a rectangle, filled or not?! Talk about irony! Over time, we have developed …
HTML hr elements (with a rotation) … and the less kludgy …
HTML div (defining a box with defined dimensions) for a nested SVG element containing the line definition using percentage dimensions
… in the past, for when we needed to do this. But, today, we’d like to thank this great webpage for its suggestion to involve linear gradients …
Scatter Chart interfacing logic … and along the way fix …
mobile platform User Text issues
… making distributing “Venn Chart” hardcodings into a dropdown selectable arrangement, because there are more commonalities than differences, really, and we do like to parameterize … even in the shower, with a fairly loud rendition of this, perhaps.
Here is our framework for parameterization, here, and into the future …
<title>Interfacing to Google Charts Image Chart Venn Chart or Scatter Chart - RJM Programming - November, 2023</title>
<script type=text/javascript>
var cht=location.search.split('cht=')[1] ? decodeURIComponent(location.search.split('cht=')[1].split('&')[0]) : "v";
var ctype=location.search.split('type=')[1] ? decodeURIComponent(location.search.split('type=')[1].split('&')[0]) : cht;
var cname=(ctype == 'v' ? 'Venn Chart' : (ctype == 's' ? 'Scatter Chart' : ''));
var cencodename=(ctype == 'v' ? 'Venn%20Diagram' : (ctype == 's' ? 'Scatter%20Chart' : ''));
var prenchtt=(ctype == 'v' ? '100,80,60,30,30,30,10' : (ctype == 's' ? '12,87,75,41,23,96,68,71,34,9|98,60,27,34,56,79,58,74,18,76|84,23,69,81,47,94,60,93,64,54' : ''));
var preachtt=(ctype == 'v' ? 'A|B|C' : (ctype == 's' ? 'Cats|Dogs' : ''));
var prechtt=(ctype == 'v' ? '&chd=t:' + prenchtt + '&chdl=' + preachtt : (ctype == 's' ? '&chd=t:' + prenchtt + '&chdl=' + preachtt + '&chxt=x,y' : ''));
var defchco=(ctype == 'v' ? 'ff0000,00ff00,0000ff' : (ctype == 's' ? 'FF0000|0000FF&chxt=x,y' : ''));
var promptone=(ctype == 'v' ? "Enter delimited values string for Venn Diagram such that ... " + String.fromCharCode(10) + "The first three values specify the sizes of three circles: A, B, & C. For chart with only two circles, specify zero for the third value." + String.fromCharCode(10) + "The fourth value specifies the size of the intersection of A and B." + String.fromCharCode(10) + "The fifth value specifies the size of the intersection of A and C. For a chart with only two circles, do not specify a value here." + String.fromCharCode(10) + "The sixth value specifies the size of the intersection of B and C. For a chart with only two circles, do not specify a value here." + String.fromCharCode(10) + "The seventh value specifies the size of the common intersection of A, B, and C. For a chart with only two circles, do not specify a value here." + String.fromCharCode(10) + String.fromCharCode(10) + "" : (ctype == 's' ? "Enter delimited values string for Scatter Chart" : ""));
var oneprompt=(ctype == 'v' ? "Enter delimited values string for your Venn Diagram collaborations, optionally, such that ... " + String.fromCharCode(10) + "The first three values specify the sizes of three circles: A, B, & C. For chart with only two circles, specify zero for the third value." + String.fromCharCode(10) + "The fourth value specifies the size of the intersection of A and B." + String.fromCharCode(10) + "The fifth value specifies the size of the intersection of A and C. For a chart with only two circles, do not specify a value here." + String.fromCharCode(10) + "The sixth value specifies the size of the intersection of B and C. For a chart with only two circles, do not specify a value here." + String.fromCharCode(10) + "The seventh value specifies the size of the common intersection of A, B, and C. For a chart with only two circles, do not specify a value here." + String.fromCharCode(10) + String.fromCharCode(10) + "" : (ctype == 's' ? "Enter delimited values string for Scatter Chart" : ""));
// etcetera etcetera etcetera
… but, as you can imagine, there will probably be small retweaks of this arrangement, which is holding out okay so far for Scatter Charts in our changedthird draft image_venn.html Google Chart Image Chart Venn Chart or Scatter Chart interfacing web application you can also try below.
Did you know?
In this online world with so many platforms and devices and software choices, there is no need to ever be embarrassed by what might seem an obvious feature you’ve missed.
Take the way on macOS, but not iOS, using a web browser to get to YouTube, you can flag that a video should loop. Especially good for …
song obsessions …
earworms you need to salve
… and what about if your shower is taking an awfully long time?! Please be careful with moisture and devices, though, in the bathroom!
How does it happen? Right click the play button, and looping is there as the top option. Now back to that shower song obsession.
… given what we learnt in Primary school … or should we say …
“Gryffindor Slytherin Ravenclaw Hufflepuff Junior Business College”
… and, yes, is that you, Aoife? What did you want to point out? After you swallow those Rice Bubbles, that is?! Class is waiting …
.
.
.
.
.
.
.
.
.
.
.
.
.
.
.
.
.
.
.
.
.
.
.
.
.
Yes … miss something … and …
.
.
.
.
.
.
.
.
.
.
.
.
.
.
.
.
.
.
.
.
.
.
.
.
.
Use your words … okay … missing … don’t worry, the bus will wait … no … there’s no need to point … oh! …
… do you mean …
missing ewe … no … missing you … oh! … missing u … oh! … “Gryffindor Slytherin Ravenclaw Hufflepuff Juniour Business College” … quite so, Aiofe … 3 points for Hufflepuff!
Anyway we needed a fleshed out “function ask” to cater for potential onclick event logic catering for co-ordinates …
function ask(evt) {
var answer='', answertherest='';
if (lasttext != '' && evt && normalcall) {
document.getElementById('ilp').placeholder='Enter text and later click place for it on Venn Diagram to left (line feed is ~~)';
if (evt.touches) {
if (evt.touches[0].pageX) {
x = evt.touches[0].pageX + document.body.scrollLeft - elemLeft;
y = evt.touches[0].pageY + document.body.scrollTop - elemTop;
} else {
x = evt.touches[0].clientX + document.body.scrollLeft - elemLeft;
y = evt.touches[0].clientY + document.body.scrollTop - elemTop;
}
} else if (evt.clientX || ev.clientY) {
x = evt.clientX + document.body.scrollLeft - elemLeft;
y = evt.clientY + document.body.scrollTop - elemTop;
} else {
x = evt.pageX + document.body.scrollLeft - elemLeft;
y = evt.pageY + document.body.scrollTop - elemTop;
}
document.getElementById('dtext').innerHTML+='<p style="position:absolute;font-size:10px;font-family:Arial;left:' + x + 'px;top:' + y + 'px;z-index:98;">' + lasttext + '</p>';
document.getElementById('aemail').href+='&text' + textnum + '=' + encodeURIComponent('' + x + ',' + y + ',') + encodeURIComponent(lasttext.replace(/\<br\>/g, String.fromCharCode(10)));
document.getElementById('asms').href+='&text' + textnum + '=' + encodeURIComponent('' + x + ',' + y + ',') + encodeURIComponent(lasttext.replace(/\<br\>/g, String.fromCharCode(10)));
arest+='&text' + textnum + '=' + encodeURIComponent('' + x + ',' + y + ',') + encodeURIComponent(lasttext.replace(/\<br\>/g, String.fromCharCode(10)));
therest+='&text' + textnum + '=' + encodeURIComponent('' + x + ',' + y + ',') + encodeURIComponent(lasttext.replace(/\<br\>/g, String.fromCharCode(10)));
asmsurl+='&text' + textnum + '=' + encodeURIComponent('' + x + ',' + y + ',') + encodeURIComponent(lasttext.replace(/\<br\>/g, String.fromCharCode(10)));
aemailurl+='&text' + textnum + '=' + encodeURIComponent('' + x + ',' + y + ',') + encodeURIComponent(lasttext.replace(/\<br\>/g, String.fromCharCode(10)));
document.getElementById('tdright').innerHTML=" <span id=spemail><a target=_blank href='mailto:?subject=My%20Venn%20Diagram%20...%20best%20viewed%20in%20landscape%20...&body=" + encodeURIComponent((document.getElementById('myvenn').src + arest).replace((document.getElementById('myvenn').src + arest).split('?')[0].split('#')[0], document.URL.split('?')[0].split('#')[0])) + "' id=aemail title=Email>📧</a></span> <span id=spsms><a target=_blank onmouseover=\"if (smsee.length == 0 && origsmsurl.indexOf('sms:&') != -1) { smsee=prompt('Please enter SMS number to send to.', ''); if (smsee == null) { smsee=''; } else { origsmsurl=origsmsurl.replace('sms:&','sms:' + smsee + '&'); asmsurl=asmsurl.replace('sms:&','sms:' + smsee + '&'); this.href=asmsurl; } }\" ontouchstart=\"if (smsee.length == 0 && origsmsurl.indexOf('sms:&') != -1) { smsee=prompt('Please enter SMS number to send to.', ''); if (smsee == null) { smsee=''; } else { origsmsurl=origsmsurl.replace('sms:&','sms:' + smsee + '&'); asmsurl=asmsurl.replace('sms:&','sms:' + smsee + '&'); this.href=asmsurl; } }\" href='sms:&body=" + encodeURIComponent((document.getElementById('myvenn').src + arest).replace(document.getElementById('myvenn').src.split('?')[0].split('#')[0], document.URL.split('?')[0].split('#')[0])) + "' id=asms title=SMS>📟</a></span><br><br> <input id=ilp onblur=\"lasttext=this.value.replace(/\~\~/g, '<br>'); this.value=''; this.placeholder='Click where you want ... ' + lasttext.replace(/\<br\>/g, String.fromCharCode(10)); mvp.setAttribute('content','initial-scale=1'); document.getElementById('myvenn').scrollIntoView();\" placeholder='Enter text and later click place for it on Venn Diagram to left (line feed is ~~)' type=text style=width:500px; value=''></input>";
//alert( document.getElementById('aemail').outerHTML );
//alert( document.getElementById('asms').outerHTML );
textnum++;
lasttext='';
} else if (!evt || !normalcall) {
if (chd == '') {
answer=prompt("Enter delimited values string for Venn Diagram such that ... " + String.fromCharCode(10) + "The first three values specify the sizes of three circles: A, B, & C. For chart with only two circles, specify zero for the third value." + String.fromCharCode(10) + "The fourth value specifies the size of the intersection of A and B." + String.fromCharCode(10) + "The fifth value specifies the size of the intersection of A and C. For a chart with only two circles, do not specify a value here." + String.fromCharCode(10) + "The sixth value specifies the size of the intersection of B and C. For a chart with only two circles, do not specify a value here." + String.fromCharCode(10) + "The seventh value specifies the size of the common intersection of A, B, and C. For a chart with only two circles, do not specify a value here." + String.fromCharCode(10) + String.fromCharCode(10) + "", (chd == '' ? "100,80,60,30,30,30,10" : (chd.replace('t:',''))));
} else {
answer=prompt("Enter delimited values string for your Venn Diagram collaborations, optionally, such that ... " + String.fromCharCode(10) + "The first three values specify the sizes of three circles: A, B, & C. For chart with only two circles, specify zero for the third value." + String.fromCharCode(10) + "The fourth value specifies the size of the intersection of A and B." + String.fromCharCode(10) + "The fifth value specifies the size of the intersection of A and C. For a chart with only two circles, do not specify a value here." + String.fromCharCode(10) + "The sixth value specifies the size of the intersection of B and C. For a chart with only two circles, do not specify a value here." + String.fromCharCode(10) + "The seventh value specifies the size of the common intersection of A, B, and C. For a chart with only two circles, do not specify a value here." + String.fromCharCode(10) + String.fromCharCode(10) + "", (chd == '' ? "100,80,60,30,30,30,10" : (chd.replace('t:',''))));
}
vals=[];
if (answer != null) {
answer=answer.trim();
if (answer.trim() != '') {
var delimis='';
for (var ii=0; ii<answer.length; ii++) {
if (delimis == '' && (answer.substring(ii).substring(0,1) < '0' || answer.substring(ii).substring(0,1) > '9')) {
delimis=answer.substring(ii).substring(0,1);
}
}
}
if (delimis != '') {
vals=answer.split(delimis);
}
if (vals.length == 6 || vals.length == 7) {
answertherest=prompt('Any optional legend or title argument snippets? Eg. &chdl=A|B|C&chtt=My%20Venn%20Diagram&chco=ff0000,00ff00,0000ff', therest);
if (answertherest == null) { answertherest=''; }
therest=answertherest.trim();
var aone=1;
var plotstring='';
var flds=[];
if (therest.indexOf('&text' + aone + '=') != -1) {
while (therest.indexOf('&text' + aone + '=') != -1) {
if (chd == '') {
plotstring=decodeURIComponent(therest.split('&text' + aone + '=')[1].split('&')[0]);
while (plotstring.indexOf(String.fromCharCode(10)) != -1) {
plotstring=plotstring.replace(String.fromCharCode(10), '<br>');
}
flds=plotstring.split(',');
if (eval('' + flds.length) >= 3) {
document.getElementById('dtext').innerHTML+='<p style="position:absolute;font-size:10px;font-family:Arial;left:' + flds[0] + 'px;top:' + flds[1] + 'px;z-index:98;">' + plotstring.split('' + flds[0] + ',' + flds[1] + ',')[1] + '</p>';
}
}
aone++;
textnum=aone;
}
}
//document.getElementById('myvenn').style.backgroundImage='URL(//www.rjmprogramming.com.au/ITblog/' + Math.min(550,window.innerWidth) + '/' + Math.min(350,window.innerHeight) + '/?cht=v&chd=t:' + encodeURIComponent(answer + therest) + ')';
document.getElementById('myvenn').src='//www.rjmprogramming.com.au/ITblog/' + Math.min(550,window.innerWidth) + '/' + Math.min(350,window.innerHeight) + '/?cht=v&chd=t:' + encodeURIComponent(answer) + therest + '';
if (document.getElementById('tdright').innerHTML == '') {
document.getElementById('tdright').innerHTML=" <span id=spemail><a target=_blank href='mailto:?subject=My%20Venn%20Diagram%20...%20best%20viewed%20in%20landscape%20...&body=" + encodeURIComponent((document.getElementById('myvenn').src + arest).replace(document.getElementById('myvenn').src.split('?')[0].split('#')[0], document.URL.split('?')[0].split('#')[0])) + "' id=aemail title=Email>📧</a></span> <span id=spsms><a target=_blank onmouseover=\"if (smsee.length == 0 && origsmsurl.indexOf('sms:&') != -1) { smsee=prompt('Please enter SMS number to send to.', ''); if (smsee == null) { smsee=''; } else { origsmsurl=origsmsurl.replace('sms:&','sms:' + smsee + '&'); asmsurl=asmsurl.replace('sms:&','sms:' + smsee + '&'); this.href=asmsurl; } }\" ontouchstart=\"if (smsee.length == 0 && origsmsurl.indexOf('sms:&') != -1) { smsee=prompt('Please enter SMS number to send to.', ''); if (smsee == null) { smsee=''; } else { origsmsurl=origsmsurl.replace('sms:&','sms:' + smsee + '&'); asmsurl=asmsurl.replace('sms:&','sms:' + smsee + '&'); this.href=asmsurl; } }\" href='sms:&body=" + encodeURIComponent((document.getElementById('myvenn').src + arest).replace(document.getElementById('myvenn').src.split('?')[0].split('#')[0], document.URL.split('?')[0].split('#')[0])) + "' id=asms title=SMS>📟</a></span><br><br> <input id=ilp onblur=\"lasttext=this.value.replace(/\~\~/g, '<br>'); this.value=''; this.placeholder='Click where you want ... ' + lasttext.replace(/\<br\>/g, String.fromCharCode(10));\" placeholder='Enter text and later click place for it on Venn Diagram to left (line feed is ~~)' type=text style=width:500px; value=''></input>";
}
} else {
alert('Try again.');
ask(null);
}
}
}
atstart=false;
normalcall=true;
}
As far as this WordPress blog’s 404.php role goes in all this, we were keen to maintain Venn Diagrams that were purely image based data, because the web browser sharing mechanisms are so much better this way, else we were tempted to just construct a webpage HTML dataset positioning text in an absolute way with a Venn Chart background image. In order to do these purely image based Venn Diagrams we used PHP’s GD image library as per …
Google Chart Image Chart Venn Chart Interfacing Primer Tutorial
So, moving on from Google ChartsImage Chart Map Charts, today, let’s turn our attention to Google ChartsImage ChartVenn Charts which we were dead set curious about given work we’d done in the past regarding Venn Diagrams, which we referenced when we presented Flowchart and Venn Diagram and Mind Map Token Subject Emoji Tutorial some time back. Gobsmackingly good is the Google approach, again, as you’d expect, but the approach covers different ground, so one feels one should go back to Primary School! You thought we were going to give away the answer to one of those security questions, didn’t you?! Didn’t you!?! Well, the answer is “Gryffindor Slytherin Ravenclaw Hufflepuff Junior Business College” … if you must know.
The sharing capabilities are good with the Google Charts approach too, given we are creating an HTML image, as our WordPress blog good ol’ 404.php has been woken up to address via …
Yes, all these Image Chart smarts come, essentially, from a “one line” calling URL! Who’d have believed it! Shiver me timbers!
Well, it’s early days with this Venn Chart interfacing where we allow for …
circle (think up to three) definition … and the rest, in this first draft (hoping you’ve done some reading) …
legend and title and colour selection user definitions dumped into a fairly unfriendly “the rest” Javascript prompt entry we ask of the user should they go ahead with the previous definition … and …
sharing and collaboration email and SMS functionality
Gmail (email) webpage Scan Document option to create an attachment
The use of this Scan Document option works via …
open Gmail webpage on your iOS iPhone or iPad and log in …
do any of “Compose” email (from scratch) or “Reply (All)” or “Forward” (regarding an opened email) …
in body section hold finger down and bring up a menu of options …
swipe to the right and select Scan Document option …
line up your document to scan and shape to take a photo of the document, and the framing will be shown to you to adjust as necessary …
tap Retake or Keep Scan (to save as an attachment) into the email and there will be an option to scan another document in there as well to go back one step …
ready for the rest of an Email writing exercise, all as usual
The raw camera functionality on an iPad is amazing, but short of using stands or rigging up a tripod, its capabilities resolution wise for the scanning of filled out forms can be questionable. We’ve been wanting to do a bit of this recently, and found that the iPad’s Genius Scan (mobile) app we introduced at this blog with Genius Scan App Primer Tutorial (when using it to organize some recipes) could succeed (where raw iPad camera functionality couldn’t (at least for us)) …
get the qualities of photograph resolutions required to see “clearly enough” (the emailee complained about the resolution using native iPad Camera work only) filled out form data
could assemble into the one PDF several scans (meant to be together) in the one document … and then …
share that PDF document by, in our case, emailing it off, to an emailee (ie. recipient)
Cute, huh?!
Today’s PDF slideshow created back on a MacBook Pro’s Preview desktop application illustrates these basic steps (for a two page PDF email attachment) …
If not installed already install the iOS Genius Scan app onto an iPad (in our case, but should work on an iPhone too) via a search of the App Store app for “Genius” … then touch that icon on the iPad desktop to open “Genius Scan” (mobile) app
Touch Camera icon
When form (or other “subject” 1) lined up click the “Shutter” icon
Save to a New Document
Touch Camera icon
When form (or other “subject” 2) lined up click the “Shutter” icon
Save to a Existing Document
Touch that newest Existing Document to open it … so that we can …
Touch the Share icon down at the bottom right
In the Export window that opens up touch the Email icon … which opens a …
Email window with the usual To: CC:/BCC: Subject: Body: filled with the Genius Scan PDF as an email attachment … so we …
Fill out the relevant fields as above and touch the Send “button” up the top left … at which point we can …
Use the iPad’s Home button to bid farewell to the Genius Scan (mobile) app … and in our case open our iPad’s Mail app to view the email ourselves (because we sent it to ourselves)
When you come across a great mobile application it can be a great boon to your relationship with computer equipment. And if it links hardcoded material to the online world all the better. Do you remember when we talked about QR Codes with QR Codes Writer Primer Tutorial? Well, today, with our tutorial about the great iOS mobile application called Genius Scan (and you can just type “Genius” at the App Store application to find it) it feels a bit like the QR Code creation way a mobile device takes a photo of something that is then used to do something else. That “something else” today is that that photo, perhaps of some hardcoded material, can be turned into a PDF by the Genius Scan app and shared, in our case today, by email.
Around our house we used the Genius Scan app to photograph a loose collection of recipes, in poor condition, and centralise (via reprinting) them via …
If not installed already install the iOS Genius Scan app onto an iPad (in our case, but should work on an iPhone too) via a search of the App Store app for “Genius” …
Take photos of the loose collection of recipes and store them as PDFs on the iPad
Another user, meanwhile, has a USB memory stick ready using a MacBook Pro (and in our case we used the Finder application to two finger gesture in the root folder arrived at by clicking the USB Disk and two finger gesturing a New Folder called Recipes)
In batches, email (up to about 11, in our case, of) these off to an email address accessed by a user using a MacBook Pro, and we used a web browser session of Gmail for this
Click Download all Attachments to a zip file in the Downloads folder (of MacBook Pro)
Click the zip file creating a new folder within the Downloads folder
Click that new folder to open its contents
Click (ie. tap) top file
Two finger gesture to Copy all these as you click/tap last file
Click USB folder (and in our case we also click Recipes sub folder)
Two finger gesture Paste files to USB
Repeat from “In batches …” above until all done
Take the USB to Officeworks serve yourself document printing machine, in a similar way, but with photos that last time, that we visited good ol’ Officeworks when we presented Holiday Snaps Printing Primer Tutorial as shown below (and the other thing we’ve learnt since then is that they can recycle some of your old printers if you drop it off at their store)
We found it was too much trouble to do one printout per click for $1.00 Australian per sheet and instead got help from an Officeworks employee to put all the 121 files into a batch job at $0.80 cents per printout … voila …
We had occasion to think about USB Memory Sticks the other day, perhaps a hardware device on the list of ones in danger of slipping away from relevance if we keep moving on in the mobile device and cloud storage direction.
The history of removable media started a long time ago even before the first Windows, back at DOS, and can remember some Wang 8 inch floppies. Back then it was a lot to do with a very finite amount of disk space reflecting when I.T. was more about “real word” processing, rather than, so much, graphical processing. Nowadays, with removable media, and the relatively modern … but for how long? … memory stick holding several gigabytes of media storage, usually, there are media formatting requirements now that have moved on from the default Windows media formatting supporting a File Allocation Table (FAT) file system.
We’ll get to what’s better to use regarding a USB memory stick media formatting arrangement later, but for now, what happens if you …
in Windows or DOS get to a formatting Window and choose to format a USB memory stick of 2gB capacity, for example in “MS-DOS (FAT)” format … or …
in Mac OS X Applications -> Utilities -> Disk Utility -> Selected USB memory stick of 2gB capacity -> Erase tab -> Format -> MS-DOS (FAT)
… well, respectively …
it will have been formatted to have the disk space of a 3 1/4 inch floppy, it looks like, and work on Windows and DOS and Mac OS X
it will have been formatted to have the disk space of a 3 1/4 inch floppy, it looks like, and work on Mac OS X and Windows and DOS
… which is okay but kind of wasteful, in the context of a removable USB 2gB memory stick we wanted to use to store about 320 holiday “snaps” and get printed out. We have these scenarios possible in a house half Mac OS X and half Windows.
So here’s the bit of the tutorial where we can’t help but advertise. Officeworks, with various branches here in Sydney, print 4″ x 6″ photo prints, satin or glossy, at 10 cents per photo. Pretty good, huh? And this can even be done Dragging and Dropping photos online, but up to 20mB, that is. Our 320 holiday “snaps” represented considerably more, and more than for any “MS-DOS (FAT)” file system arrangement, that would get taken for a Same Day do it yourself at a Windows personal computer, with your own USB memory stick arrangement.
So, what is the go to …
use the full capacity of the USB memory stick
be able to fit 320 photos onto the USB memory stick
for normal day to day use, be able to use it on any Mac OS X or Windows computer around the house
have a workable and readable USB memory stick to use at the Officeworks photo printing Do It Yourself Windows personal computers
… having seen unreadable USB memory sticks, at Officeworks Windows personal computers using “in Mac OS X Applications -> Utilities -> Disk Utility -> Selected USB memory stick of 2gB capacity -> Erase tab -> Format -> Mac OS Extended (Journaled)” formatting?
Well, I asked the Fat Controller … of course … what do you take me for? … and they said …
“ExFat” DotDotDot man person
… and, lo and behold … not having registered its existence before … there it was as an option achieving both as per …
in Windows or DOS get to a formatting Window and choose to format a USB memory stick of 2gB capacity, for example in “exFAT” format … or …
in Mac OS X Applications -> Utilities -> Disk Utility -> Selected USB memory stick of 2gB capacity -> Erase tab -> Format -> ExFAT
… resulting in, respectively …
it will have been formatted to have the disk space of its 2gB full capacity, it looks like, and work on Windows and DOS and Mac OS X
it will have been formatted to have the disk space of its 2gB full capacity, it looks like, and work on Mac OS X and Windows and DOS
So, a happy solution for some holiday “snap” printing, and the ongoing less wasteful use of a USB 2gB memory stick on Windows or Mac OS X, on computers around the house. We show some of these ideas with our tutorial picture today.
To read more about getting the photos to the MacBook Pro laptop from the Android phone, please read, below, the techniques from Android Disk to MacBook Pro Disk Tutorial.
We love it here when we can tell you of something that works across the “big brands”, and what we mean by the two “big brands” today is Google (regarding their Android mobile phone operating system) and Apple (regarding their Mac OS X MacBook Pro laptop operating system). Today we transfer files from the Android mobile phone to our MacBook Pro laptop disk via …
For Share ideas that involve your Android mobile phone and storing media on a local hard disk this could be a great alternative to other Share options for the MacBook Pro and some of the ideas we presented with Android Camera to Mac iPhoto Primer Tutorial.
Today’s tutorial picture shows you the setup for this functionality, and you’ll see the online advice for how you work the Mac OS X application for the Android File Transfer application.
When creating Android apps with Android Studio IDE (or any other IDE, for that matter) it’s great to test the working of the app with various mobile phone and tablet emulators with AVD, and it’s even “greater” to extend that to testing on a real physical device.
Today, we’re going to work with …
MacBook Pro testing that latest Android app using an Android Studio IDE project which we talked about with Android Studio on Mac OS X Primer Tutorial regarding “ESL Ideas”
another (ubiquitous) white lead … called a Micro USB Connector … but not Muc, pleeeeease … decided against the puce one because it just didn’t go with the cushions … but we digress
Samsung GT-S5310B Android 4.1.2 mobile phone … and, today of all days the “4.1.2” is a bit significant … because we want to talk about ant builds … but we digress
The (ubiquitous) white lead goes from the MacBook Pro’s USB port to the “underbelly” of the Samsung GT-S5310B.
One thing to do at the “computer” Android Studio end of the lead is to adjust AndroidManifest.xml to show android:debuggable="true" now.
Now if you’re on Windows I’d have more to say about the “computer” end of the lead, and if that is you, and you’ve never tested on a real device, you’ll want to read this great Google Android Studio page.
Come to think of it, everybody who’s never tested on a real device should read Google Android Studio page. See the advice about Android 4.2 … note that … ie. if the Settings menu’s submenu Developer Options is all grayed out tap on Build number (via Settings->About device) seven times … and “twice on the pipe, if the answer is noooooooooo” … but we digress.
However, we have a mobile phone with Android 4.1.2 … and so … this search got me to this great advice … and the consequent turning on of the Settings->Developer Options “switch” to on meant … Bob’s your uncle, Fanny’s your aunt … Android Studio responded like a … like a … well … a very hot studio.
A “Run App” will default to hooking up to this connected physical device (the Samsung GT-S5310B) and run the resultant mobile app on that device.
There are a lot of choices of IDE for creating mobile applications, and if you are a developer wanting to develop mobile apps for both Android and iOS platforms, you may be looking to try to set up an environment where all this can be achieved on the one piece of computer equipment.
We prefer to think in terms of two IDEs handling the two mobile app types of iOS, with Swift and/or Objective-C as the source language, and Android, with Java as the source language. We don’t mind there being two separate IDEs involved, but we find it amazing enough that they can both sit on the one MacBook Pro laptop without resorting to any Operating System disk partitions. With the Android app, using Mac OS X (MacBook Pro) we asked Google if it could be done, and came up with the marvellous Android Studio IDE as a possibility … yay!
iOS mobile apps get created via the Xcode IDE using Swift and/or Objective-C on a Mac OS X (MacBook Pro)
Android apps get created via the Android Studio IDE using Java on a Mac OS X (MacBook Pro)
Today’s tutorial, as with the WordPress 4.1.1’s Android Studio on Mac OS X Primer Tutorial, hones in on that second idea from the install of Android Studio (to a MacBook Pro) through to the “middle game” emulation of an Android app via Android Studio and AVD onto an HTC Nexus One.
In the context of all this, we see the Android app “end game” as involving the creation of an .apk file that can be uploaded to Google Play for public access.
Fragments – components of the Android UI … and setting of startup fragment of interest … fragment_weblayout.xml … fragments go some way to addressing that common issue for mobile developers that all the UI elements of a mobile application fit and would ideally be displayed with a tablet but it would be best to only conditionally display some when it comes to using a smaller format mobile device such as an Android mobile phone device
WebView … similar to Eclipse … allows an Internet web component in your Android mobile app
Use of myWebView.getSettings().setJavaScriptEnabled(true); to allow Javascript functionality for the WebView
AndroidManifest.xml … INTERNET permission … similar to Eclipse … to Build->”Generate Signed APK…” for Google Play publishing you need the extra … android:debuggable="false" clause
Tools->Android->AVD Manager … emulator organization and emulator deployment help … remains the case that it is best to start the emulator all the way to the home page at the simulated device (right swipe unlocking any locks you get) … then run and attach your mobile app to this pre-established connection
You will be pleased to know that after the Android Studio install today, all is (still) well with Xcode on this Mac OS X (MacBook Pro) setup … we mostly like a happy ending … aaaaaaahhhhhhh!
Yesterday, with Android Studio Tic Tac Toe Game Tutorial as shown below, we reacquainted ourselves with Android Studio as an alternative IDE to Eclipse (and there are others too) to use the Android SDK and Java to develop mobile apps for an Android mobile device and in our aforesaid mentioned “start game”, “middle game” and “end game” view of mobile development we focussed on the “middle game”.
Today, we extend the “middle game” discussion of yesterday, with tutorial functionality touching on the “end game” with respect to Android Studio creating an Android mobile app on Google Play.
Wonder if you were around when we created the Morse Code emailer … HTML Morse Code Primer Tutorial? Well, today, we turn that into an Android mobile application using Android Studio, and publish it to Google Play for general “consumption” by the public.
So what are some of the concepts in the Android Studio project regarding the “middle game”, for which huge help came from this great link … thanks …
Fragments – components of the Android UI … and setting of startup fragment of interest … fragments go some way to addressing that common issue for mobile developers that all the UI elements of a mobile application fit and would ideally be displayed with a tablet but it would be best to only conditionally display some when it comes to using a smaller format mobile device such as an Android mobile phone device
Layout in activity_main.xml … similar to Eclipse
WebView … similar to Eclipse … allows an Internet web component in your Android mobile app
Use of myWebView.getSettings().setJavaScriptEnabled(true); to allow Javascript functionality for the WebView
AndroidManifest.xml … INTERNET permission … similar to Eclipse … to Build->”Generate Signed APK…” for Google Play publishing you need the extra … android:debuggable="false" clause
Tools->Android->AVD Manager … emulator organization and emulator deployment help … remains the case that it is best to start the emulator all the way to the home page at the simulated device (right swipe unlocking any locks you get) … then run and attach your mobile app to this pre-established connection
Source code wise, of interest to the “middle game”, is …
Before leaving the “middle game” thoughts, sometimes you need to adjust the code of a WebView’s innards (especially) if you want to do away with any “Back” or “Forward” button mobile application functionality, because any escape from the WebView’s control is that mobile application being effectively lost for that session. As such, the Morse Code programming HTML source code became morsecode.html (… and how we got there morsecode.html …) and the method of creating the email was made to use a PHP piece of supervised code as per morsecode.php (with a live run non-mobile web page link) to cater for Android mobile WebView compatibility … and thanks to this useful link.
Just to challenge you with a “middle, end, start order” … have a look at some information regarding Android Studio mobile development and the “start game” … Android Studio Primer Tutorial.
Hope this is food for thought for your Android mobile development plans! See the results of the work today at Google Play.
Wonder if you were around when we created Tic Tac Toe (or more like Noughts and Crosses, in Australia) using the HTML5 Canvas element and drag and drop methods (if you liked, or just plain box clicking, otherwise, which will be okay for mobile usage) … HTML/Javascript Canvas Tic Tac Toe Game Drag and Drop Tutorial as shown below? Well, today, we turn that into an Android mobile application using Android Studio.
Android Studio is an alternative IDE to Eclipse (and there are others too) to use the Android SDK and Java to develop mobile apps for an Android mobile device and in our aforesaid mentioned “start game”, “middle game” and “end game” view of mobile development we are just showing you the “middle game” today, but if you were to follow through … fore!!!!!!!! … and not shank … and not hook (ie. narrrrrrr … chortle, chortle) … then we may end up at Google Play with a mobile app … by the way, we talk about the “end game” at Eclipse Android App Google Play Ready Primer Tutorial (Android Studio has all this functionality and capability too).
So what are some of the concepts in the Android Studio project, for which huge help came from this great link … thanks …
Fragments – components of the Android UI … and setting of startup fragment of interest … fragments go some way to addressing that common issue for mobile developers that all the UI elements of a mobile application fit and would ideally be displayed with a tablet but it would be best to only conditionally display some when it comes to using a smaller format mobile device such as an Android mobile phone device
Layout in activity_main.xml … similar to Eclipse
WebView … similar to Eclipse … allows an Internet web component in your Android mobile app
Use of myWebView.getSettings().setJavaScriptEnabled(true); to allow Javascript functionality for the WebView
AndroidManifest.xml … INTERNET permission … similar to Eclipse
Tools->Android->AVD Manager … emulator organization and emulator deployment help … remains the case that it is best to start the emulator all the way to the home page at the simulated device (right swipe unlocking any locks you get) … then run and attach your mobile app to this pre-established connection
So that’s a bit about the mobile world, and so concerning the innards of that WebView …
The Canvas HTML element tag can be used as the container to draw graphics on the fly usually via the use of Javascript functions for rendering and event management.
In today’s tutorial we show some image Drag and Drop functionality that you can use with the Canvas HTML5 element where we create a Tic Tac Toe game webpage. We thank w3schools for the great advice at this link.
The Drag and Drop does not work well on tablets, but for own Tic Tac Toe game today we allow either a drag and drop approach, or a touch/click approach.
HTML/Javascript Canvas Tic Tac Toe Game Drag and Drop Tutorial
The Canvas HTML element tag can be used as the container to draw graphics on the fly usually via the use of Javascript functions for rendering and event management.
In today’s tutorial we show some image Drag and Drop functionality that you can use with the Canvas HTML5 element where we create a Tic Tac Toe game webpage. We thank w3schools for the great advice at this link.
The Drag and Drop does not work well on tablets, but for own Tic Tac Toe game today we allow either a drag and drop approach, or a touch/click approach.
the recent, alas now deprecated, Google ChartsImage Charts GraphViz option means of drawing SVG graphics within an HTML image … we’ve known about before about yesterday …
today’s interest, that being PHP Image GraphViz via Pear on AlmaLinux install, via the AlmaLinux cPanel “Module Installers” Pear installer page, means by which we can use GraphViz calls in PHP code … and, for the future …
GraphViz installs for Python via pip
GraphViz via Dot language via command line
GraphViz via QuickChart product interfacing, we interface to, thanks
But, it’s not just the very interesting (curl https: posted JSON data based) QuickChart GraphViz interfacing that we add to our inhouse Image Based Graphs web application, we now have, in a first review, “splashpage aspect” improvements to all of …
Bar Chart
Line Chart
Venn Chart
Scatter Chart
GraphViz Chart
Google-O-Meter Chart
Radar Chart
Pie Chart
… the most work left with this interfacing, in all likelihood, will go to the “missing from the list above” Map Chart, and some Venn Chart user entered parameter logics, where any Map Chart replacement logic will never match the Google means by which region boundaries were defined and, hence, able to be allocated a shaded colour, though we think we’ll be able to show region place name text, in position, moving forward, using Google ChartGeo Chart and/or Map Chart and Wikipedia, thanks.
So, if this is an HTML web application, why the “PHP” mention in the blog posting title? Well, it is good ol’ WordPress Blog TwentyTen theme’s 404.php that remaps URLs from Google Chart Image Chart friendly ones to QuickChart friendly (so far only “splashpage” wise) ones via PHP code snippets …
<?php
function qcpc($inuis) {
$outuis=$inuis;
$sometext='';
// ?chs=550x350&cht=p&chd=t:1,2,3,4&chdl=January|February|March|April&chtt=My%20Pie%20Chart&chco=ff0000,00ff00,0000ff,ff00ff&ufr=_6992072
// to something like
// https://quickchart.io/chart?c={type:'pie',data:{labels:['January','February','March','April','May'], datasets:[{data:[50,60,70,180,190]}]}}#cht=b
// ?chs=550x350&cht=gv&chl=graph{C_0--H_0[type=s];C_0--H_1[type=s];C_0--H_2[type=s];C_0--C_1[type=s];C_1--H_3[type=s];C_1--H_4[type=s];C_1--H_5[type=s]}&chtt=My%20GraphViz%20Chart&chco=&ufr=_5020598
// to something like
// https://quickchart.io/graphviz?format=png&width=100&height=150&graph=graph{a--b}
// ?chs=550x350&cht=gom&chd=t:20,40,60&chdl=A|B|C&chtt=My%20Google-O-Meter%20Chart&chco=ff0000,00ff00,0000ff&ufr=_13133851
// to something like
// ?c={type:'gauge',data:{datasets:[{value:50,data:[20,40,60],backgroundColor:['green','orange','red'],borderWidth:2}]},options:{valueLabel:{fontSize:22,backgroundColor:'transparent',color:'#000',formatter:function(value,context){returnvalue+'mph';},bottomMarginPercentage:10}}}
// ?chs=550x350&cht=v&chd=t:100,80,60,30,30,30,10&chdl=A|B|C&chtt=My%20Venn%20Diagram&chco=ff0000,00ff00,0000ff&ufr=_18142737
// Thanks to https://www.infosol.com/venn-diagrams-in-xcelsius/ for
// chd=t:66,100,-1,33,-1,-1,-1
// These numbers specify the size and overlaps for all groups.
// The ordering is as follows:
// Group 1 size,
// Group 2 size,
// Group 3 size,
// Group 1 & 2 overlap amount,
// Group 1 & 3 overlap amount,
// Group 2 & 3 overlap amount,
// Group 1 & 2 & 3 overlap amount. In this case, we only had two groups to display, so all of the parameter slots reserved for the third group were set to “-1”. If you have a third group, then those “-1” values would be replaced with actual amounts. The Google Chart API provides for a maximum of 3 groups in Venn diagrams.
GraphViz via PHP on AlmaLinux Dot HTML Table Tutorial
In the GraphViz Dot command line world, there are a variety of (what we think of as) “verbs” supplied along with Dot installs for various purposes … think neat -n that helped with the Venn Diagrams of day before yesterday’s … but today we’re back to using “verb dot” again, thanks to QuickChart Graph API, thanks, with …
In so doing we were able to test the integrity of yesterday’s GraphViz via PHP on AlmaLinux Require Once Tutorial … spoiler alert … all okay (but we still have to remember to make our crontab arrangements for each new such web application)! And remind ourselves to revisit the excellent QuickChart product, which can help us get over the demise of Google ChartsImage Charts … somewhat.
The include (or require) statement takes all the text/code/markup that exists in the specified file and copies it into the file that uses the include statement.
Including files is very useful when you want to include the same PHP, HTML, or text on multiple pages of a website.
By peer to peer arrangements, we’re referring to those programming occasions where you’ve written a series of web applications, in today’s case, a series of server side PHP ones, further to the work of yesterday’s GraphViz via PHP on AlmaLinux Dot Circular Layout Tutorial, and want each to have means by which they can link to the others. In external Javascript client side land, that would involve an arrangement like …
visit each HTML code and add the link to the external Javascript … and …
within that external Javascript a dropdown (or some other HTML) element would be dynamically added to the webpage via DOM methodologies … based on …
essentially a hardcoded list (which, likely, needs to be rewritten when something new in the peer list happens) the programmer knows about
… into twopi_vs_circo_example.php PHP hosting Dot second go Circular Layout web application, is all the “code visiting” needed (as long as somebody … anybody … executes it once in a while … more on that later) in this server side methodology. The reason server side works so well is that server side can read and adjust web server code files, where PHP writes PHP here in this solution, whereas external Javascript client side approaches cannot do this.
user can control the Venn (or, it’s getting towards other uses) Diagram fill colour and opacity …
circles can be ellipses also …
the dot (or neat -n) shape option Box is coded for as far as diagram editing is concerned … which means some other Polygon shapes work too, except that changes (via two discrete click/taps) followed through on, turns Polygons without 4 sides into a Box with 4 sides
user can add dot (or neat -n) generic node attributes via the Font Size textbox ( eg. 14 fontcolor=blue margin=0 )
Those Javascript functions of yesterday now look like …
GraphViz via PHP on AlmaLinux Dot Venn Diagram Editing Functionality Tutorial
Yes, further to yesterday’s GraphViz via PHP on AlmaLinux Dot Venn Diagram Editing Design Tutorial we have some SVG data based Venn Diagram editing functionality to offer the user today. In amongst “editing” is new functionality (via a “+” prefix to the Javascript prompt window answer a user gives) to be able to create new circles or text in SVG and Dot formats. As alluded to yesterday, these Javascript onmousedown and ontouchdown event instigated functions look like …
And along the way, here, we determined by starting down that road, that the effort was not worth the reward to also allow HTML output format also work this Venn Diagram editing functionality. No problems, because in any case, the PNG and JPEG formats are not capable either. It is a case of “horses for courses”!
Similarly for the shape dropdown we’ve opened up again. Only the shape=circle scenario works SVG format output for Venn Diagram editing functionality.
… applied to all the SVG “g” elements, and we can use for the “whole shebang” of our solution to this piece of functionality. We’ll be showing you a more settled upon “function clickreg” (hopefully before the day of rest).
You’ll see playing with Venn Diagrams that we’ll need some time to think on whether we can improve positioning of the circles, a matter critical to Venn Diagram “drawing”.
… “forewarning work” into a “more than one day” scenario, it looks like, from today’s …
get the user, via onmousemove event Javascript logic (“szero” referring to the SVG topmost element object of the SVG (no HTML imagemap thoughts yet) within the id=myif iframe element of the parent window) …
szero.addEventListener('mousemove', function(){
if (event.touches) {
//if (event.touches[0].screenX) { pos3 = event.touches[0].screenX; pos4 = event.touches[0].screenY; } else
if (event.touches[0].pageX) {
pos3 = event.touches[0].pageX;
pos4 = event.touches[0].pageY;
} else {
pos3 = event.touches[0].clientX;
pos4 = event.touches[0].clientY;
}
console.log('pos3 = ' + pos3 + ',pos4 = ' + pos4);
//} else if (event.screenX) { pos3 = event.screenX; pos4 = event.screenY;
} else if (event.clientX || event.clientY) {
pos3 = event.clientX;
pos4 = event.clientY;
console.log('pos3 = ' + pos3 + ' ,pos4 = ' + pos4);
} else {
pos3 = event.pageX;
pos4 = event.pageY;
console.log('pos3 = ' + pos3 + ', pos4 = ' + pos4);
}
if (event.target.outerHTML.indexOf('<body') == 0) {
if (dbt == '') { dbt=document.body.title; }
}
pos4+=140; pos3-=40;
parent.document.getElementById('pos').innerHTML=' ... ' + pos3 + ',' + pos4 + ' ... inches ... ' + eval(pos3 / 96).toPrecision(5) + ',' + eval(eval(288 - pos4) / 96).toPrecision(5) + ' ... points ... <span id=pointsx>' + eval(pos3 * 3.0 / 4.0).toPrecision(5) + '</span>,<span id=pointsy>' + eval(288 - eval(pos4 * 3.0 / 4.0)).toPrecision(5) + '</span>';
});
… a display of useful set of co-ordinate sets to base their element movements via … day one progress … and then …
add more event driven Javascript clientside SVG or HTML imagemap clicking logic to both …
show the user a display showing what would happen should they click/tap the “Draw” button … as well as …
modify the top textarea user entries to reflect these proposed changes
… ideas (turned into a day’s worth of reality), as day two’s job (and hopefully not into day three).
Guess today’s work can be thought of as “a unit’s day”. When you talk of co-ordinates, it’s all relative, right?! With this work, for the first time we can remember, “real world” units such as “inches” (as well as “points” and the pixel “px” webpage units yours truly is most familiar with) make an appearance, of some importance. We’re not going to delve into why dot“neato -n” refers to “inches”, but learn a bit trying to fit in with dot“neato -n”‘s wooooooorrrrrrrllllllddddd. Our research and development here led to this link for px to inches thoughts, thanks, and this link for px to points thoughts, thanks. We suspect we might need to reference some/all of the three co-ordinate system ideas tomorrow, including the way in Javascript client land Y co-ordinates start at the top with zero and go down the webpage with ever increasing Y’s, but in dot“neato -n” land the Y co-ordinate increases as you go up the webpage, as most good graph systems we’ve ever known, would do, too!
You might see with the whole Dot file presented to the user as an “up for grabs” we have some fillcolor attributes such as …
fillcolor="#90806090"
… which is Dot’s equivalent to rgba(146,130,96,0.9) ( ie. rgb(146,130,96) with opacity 0.9 ) … on 12/10/2024 realized ((9 x 16) + (0 x 1)) / 256 = 0.5625 … rgba(146,130,96,0.5625) ( ie. rgb(146,130,96) with opacity 0.5625 ) … but, please, stick to the “Dot way” because some other ways just cause black filled in circles. Because Venn Diagrams are often about overlapping, you’d expect opacity to be a feature of use here.
You’ll see playing with Venn Diagrams that we’ll need some time to think on whether we can improve positioning of the circles, a matter critical to Venn Diagram “drawing”.
PDF … (via the dot switch -Tpdf) but, today, we open it up for …
PNG … (via the dot switch -Tpng) and …
JPEG … (via the dot switch -Tjpg) and …
HTML … made up of …
body element … consisting of …
img element as the imagemap part … (via the dot switch -Tpng) as well as …
map element as the imagemap part … (via the dot switch -Tcmapx)
… that last imagemap based one taking up most of the work day, but worth it, we think. And thanks to this excellent advice regarding this.
With the PNG and JPEG (and HTML, we belatedly realized) outputs we initialize the canvas editor with that Colour Wheel image contents, and with SVG and HTML clicks can shape the colour picking for the canvas editor, while PDF is just for … well … PDF.
GraphViz via PHP on AlmaLinux Dot Colour Wheel Tutorial
We’ve discovered another item to add to our list of GraphViz guises, adding …
the recent, alas now deprecated, Google ChartsImage Charts GraphViz option means of drawing SVG graphics within an HTML image … we’ve known about before about yesterday …
today’s interest, that being PHP Image GraphViz via Pear on AlmaLinux install, via the AlmaLinux cPanel “Module Installers” Pear installer page, means by which we can use GraphViz calls in PHP code … and, for the future …
GraphViz installs for Python via pip
GraphViz via Dot language via command line
… and we host that in PHP, starting, today, down this road, taking the Colour Wheel of https://graphviz.org/Gallery/neato/color_wheel.html as an example of “Dot” language GraphViz code (we’ve called colour_wheel.dot, thanks), made use of, after user supplied amendments as required, on the AlmaLinux command line, such as …
?>
… (in an SVG version with no – “minuses” in it’s file name) … so that …
storing in window.localStorage is a simple matter of name=value association where value is a simple RJM Programming domain absolute SVG URL (with the “minuses”, but they are taken out in the first argument of the window.open first argument …
<?php echo ”
function gotothis(inu) {
if (inu.trim() != '') {
if (inu.indexOf('HttP') == 0) {
var toe=null;
if (document.getElementById('sells').innerHTML.indexOf(inu + '\">') != -1) {
toe=prompt('Please enter email address or SMS number to share ' + document.getElementById('sells').innerHTML.split(inu + '\">')[1].split('<')[0].replace('Email or SMS ','') + ' with.', '');
} else {
toe=prompt('Please enter email address or SMS number to share with.', '');
}
if (toe == null) { toe=''; }
if (toe.indexOf('@') != -1) {
if (document.getElementById('sells').innerHTML.indexOf(inu + '\">') != -1) {
document.getElementById('myaemailsms').href='mailto:' + toe.trim() + '?subject=' + encodeURIComponent(document.getElementById('sells').innerHTML.split(inu + '\">')[1].split('<')[0].replace('Email or SMS ','')) + '&body=' + encodeURIComponent(inu.replace('HttP','http').split('#')[0].replace(/\-/g,'').replace('doctestoutput','doctest-output'));
document.getElementById('myaemailsms').click();
} else {
document.getElementById('myaemailsms').href='mailto:' + toe.trim() + '?subject=' + encodeURIComponent('Family Tree') + '&body=' + encodeURIComponent(inu.replace('HttP','http').split('#')[0].replace(/\-/g,'').replace('doctestoutput','doctest-output'));
document.getElementById('myaemailsms').click();
}
} else if (toe.trim() != '') {
if (toe.trim().replace(/0/g,'').replace(/1/g,'').replace(/2/g,'').replace(/3/g,'').replace(/4/g,'').replace(/5/g,'').replace(/6/g,'').replace(/7/g,'').replace(/8/g,'').replace(/9/g,'') == '') {
document.getElementById('myaemailsms').href='sms:' + toe.trim() + '&body=' + encodeURIComponent(inu.replace('HttP','http').split('#')[0].replace(/\-/g,'').replace('doctestoutput','doctest-output'));
document.getElementById('myaemailsms').click();
}
}
document.getElementById('sells').value='';
} else if (inu.indexOf('HTTP') == 0) {
if (inu.indexOf('#saved_family_tree_') != -1) {
deleteAVal(inu.split('#')[eval(-1 + inu.split('#').length)], encodeURIComponent(inu.replace('#' + inu.split('#')[eval(-1 + inu.split('#').length)], '').replace('HTTP','http')));
cookieAVal('saved_family_tree_', true);
}
} else {
woo=window.open(inu.replace(/\-/g,'').replace('doctestoutput','doctest-output').replace('http:','').replace('https:',''), '_blank', 'top=50,left=50,width=800,height=800');
}
}
}
“; ?>
) … to open GraphViz SVGs in a new window or email or SMS them and an option to stop their recall in that intersessional and intrasessional (also via a right hand cell double click) way
As well, onto the progress cursor (which is of no use on mobile platforms) method of flagging to the user they should wait, we add an animated “Draw” button border animation Javascript function …
<?php echo ”
function animbord() {
var bcolsare=['green','#F0F8FF','#F0FFFF','#F0F0E0','#F0FFF0','#FFFFF0','#FFF0E0','#FFFFE0','#F0FFF0','#FFFFFF','#F0F0F0','#F0F7FF','#FFF8F0','#FFF0F0','#E0FFFF','#FFFFE0'];
document.getElementById('mysub').style.border='3px dotted ' + bcolsare[lastj];
lastj++;
if (lastj >= eval('' + bcolsare.length)) { lastj=0; }
setTimeout(animbord, 200);
}
“; ?>
As the user enters in any image URL, we allow a hash delimiting user answer idea whereby they can use an opacity that is not the 0.6 default value in the changed PHP family_tree.phpFamily Tree creation.
Python GraphViz via PHP on AlmaLinux Family Tree Image Tutorial
So far with our GraphViz usages, there have been no images, within any SVG output created. Today, at least with the Family Tree functionality, we want to allow image URL user entered imagery to overlay SVG node elements, using that node’s positioning to guide where this overlayed image should be placed, further to yesterday’s Python GraphViz via PHP on AlmaLinux Family Tree Tutorial.
Is it Javascript DOM helping with this? Yes, we host SVG GraphViz output within HTML iframe elements, where (in the spirit of “Client Pre-Emptive Iframe” thinking), which have an onload event Javascript function looking like …
<?php echo ”
function checksvg(iois) {
var gs=[];
if (iois != null) { // check out window.svgDocument
var aconto = (iois.contentWindow || iois.contentDocument);
if (aconto != null) {
//alert(1);
if (aconto.document) {
aconto = aconto.document;
gs=aconto.getElementsByTagName('g');
if (eval('' + gs.length) > 0) {
gzero=gs[0];
for (var sd=0; sd<gs.length; sd++) {
gs[sd].onclick=function(event){ parent.svgit(event.target, ''); };
gs[sd].ondblclick=function(event){ parent.svgit(event.target, 'ask'); };
}
}
gs=aconto.getElementsByTagName('svg');
if (eval('' + gs.length) > 0) {
szero=gs[0];
for (var sd=0; sd<gs.length; sd++) {
gs[sd].onclick=function(event){ parent.svghost(event.target, ''); };
}
}
console.log(gs.length);
console.log(aconto);
}
//alert(11);
if (aconto.body != null) {
iois=iois;
//alert('yay!');
}
}
if (gzero) {
gzero=gzero;
" . (strlen($addimg) == 0 ? $addimg : ' gzero.innerHTML+="' . $addimg . '"') . "
if (aimg != '') { eval(' gzero.innerHTML+=\"' + aimg + '\"'); }
}
}
}
“; ?>
… relying on iois.contentDocument (as our reading said would help) before any of our aconto.body thinking which suits (our usual) HTML content with the relevant iframe hosting element. From there on, Javascript DOM principles can help modify and scour SVG content, and make use of new Javascript functions, as per …
<?php echo ”
function svghost(svgheo, imgc) {
if (9 == 8) {
if (gzero) {
gzero.innerHTML+=\"<image x='0' y='0' href='/camel.png'></image>\";
} else {
svgheo.innerHTML+=\"<image x='0' y='0' href='/camel.png'></image>\";
}
}
}
If you examine this how we got there link, you will see by how little has changed, how there is so much in common as we build on previous GraphViz work, rather than worrying about the differences … they soon become apparent as you test the https://forum.graphviz.org/t/emojis-not-working/1935/2 inspired family_tree.py Python code inspiration, thanks.
That last link’s Python code made us ditch the inhouse | and ; and . delimitation ideas in favour of the Python structure syntax, it being as self explanatory (or more, we daresay) as the inhouse delimiter ideas, and easier to implement …
<?php
// family_tree.php
// RJM Programming
// September, 2024
// Trying out Python GraphViz package ... thanks to https://forum.graphviz.org/t/emojis-not-working/1935/2
It also served to remind us that users might want to embed emojis into their Family Tree names, so to leave SVG as our default output format would be advantageous, again. All the Stop Press ideas yesterday were relevant too, for the PHP family_tree.phpFamily Tree creation …
Emoji … as we decided upon (as much as anything, because non-ascii characters for other non-English language requirements, might now be possible within the content of the GraphViz entity, as a result) … or …
Format … or …
Sharing … or …
Encoding … or …
Delimitation
We wanted to look back at yesterday to it’s “code architecture”, if you will, as a “lead in” to where we are coming at here. Yesterday, in the user definable textarea elements …
| … “edge” linkage record set delimiter
; … parent from rest delimiter
, … rest child name(s) delimiter
… this user usage delimiter characters “inhouse rules” architecture contributes to making it all the more crucial in the coding, to nail down how the + character is handled …
… which, as you can see with our HTML form onsubmit event fired Javascript function above, amounts to mapping real content + characters to horizontal tab to differentiate this mode of use from the use HTML form encoding uses for it to represent an encoded space character. Are you now getting a bit of an idea with today’s “tidying up” and “nuancing” feel?!
What about if any “edge” names contain one of those delimiters, as above? Well, we try …
<?php echo ”
function various(indi) {
var outdi=indi;
outdi=outdi.replace(/\|\;/g, encodeURIComponent('|') + ';');
outdi=outdi.replace(/\,\;/g, encodeURIComponent(',') + ';');
outdi=outdi.replace(/\;\;/g, encodeURIComponent(';') + ';');
… in that regard, and “double decode” (with a bit of nuance in between) on the other side, to try to account for this. We’ll see!
But the day started thinking about Emojis. What would happen in our PDF default output with Emoji content being introduced by the user within input textarea elements, as they go to Draw their Hierarchical Organization chart? Well, not so good. But, thanks to Graphviz not supporting UTF-8 encoding webpage, we got put onto the idea that an alternative, and now the default, format of output could be SVG … and trying it worked … thanks!
And then it occurred to us that there is also the GraphViz graph mode ( default Digraph versus Graph ), and it’s “edge” element background colour and shape and font size, as well as a resizing mechanism, that could be up for grabs, via user input in the tweakedhierarchy_organization.phpHierarchy Organization diagram “drawer”.
Python GraphViz via PHP on AlmaLinux Organization Hierarchy Tutorial
Calling cab (6754 – 6756 + 4).
Huh?!
Calling the second cab off the rank.
Yes, now that we understand a bit more about file permission issues, after yesterday’s Python GraphViz via PHP on AlmaLinux Permissions Tutorial, having PHP hosting Python with GraphViz calls, let’s turn our attention to the issue of “lots of data”, today, with our …
We thought we’d move the Python, via PHP processing, totally into the purview of the web server administration owner, by involving a …
Korn Shell *.ksh … supervised by …
crontab … pointing to …
ksh -c 'for i in `find /home/rjmprogr/public_html/ -name "subgraph_example_*.ksh"`; do ksh -c `echo $i`; done'
… very regularly
… arrangement, but even that failed, in a first incarnation using /tmp/ placement of the Korn Shell file. “Permission denied”, again. Running a Korn Shell from /tmp/ on AlmaLinux must be a no-no, so moved the place to be AlmaLinux web server’s Document Root place, and then things started happening, in the changedsubgraph_example.phpPython GraphViz using web application.
the recent, alas now deprecated, Google ChartsImage Charts GraphViz option means of drawing SVG graphics within an HTML image … we’ve known about before about yesterday …
today’s interest, that being PHP Image GraphViz via Pear on AlmaLinux install, via the AlmaLinux cPanel “Module Installers” Pear installer page, means by which we can use GraphViz calls in PHP code … and, for the future …
GraphViz installs for Python via pip
…? Well, today, we start down the road of …
installing Python GraphViz package via …
pip install graphviz
On non-mobile focus goes to the address bar on many web browsers unless there is a (nominally) visible input type=text or textarea next in line.
It’s hard to keep in mind except as it “rears up” in an annoying way, but if we’d thought back, yes, we allow in the linked list feel of revealing textboxes (or textareas) only as they are needed scenarios we allow for two blank ones to be (nominally) visible at any given time … not one … but two, presumably because there is a tiny Javascript DOM “refresh period” not short enough to stop the web browser “desperation measure” (of placing focus in the address bar) happening?!
Why the non-mobile mention? Well, on mobile, a user programming [HTMLelement].focus(); call has no affect, as the touch operating systems need control of focus arrangements, presumably?!
How can we forget? My liege, please accept my humble apologies?!
Why the (nominally) mentions? Well, we have, successfully, in the past, just arranged a (statically HTML placed) textbox (ie. input type=text) that sits outside the viewing screen but not (nominally) invisible (eg. style=’position:absolute;top:-200px;left:-200px;’) can help you avoid the focus going up to the web browser address bar.
So that’s that, and other progress today is to allow the emailing or SMS of a recalled URL Step arrangement via more options on that “Recall Dropdown” we started allowing for yesterday.
inhouse intersessional sharing via window.localStorage (ie. like HTTP Cookies)
… over yesterday’s and today’s blog posting timings. Simply put, for us, we …
take a deep breath before starting intersessional window.localStorage work, as it is not to be sneezed at, as any sort of doddle (at least for us) … as well as …
since last intersessional window.localStorage work we’ve started using email and SMS sharing hashtagging arrangements that fit in, like a glove, with this intersessional window.localStorage work … so that …
even though, we write the code here in PHP, all this functionality is client based … which we like because …
get the idea correct, with careful forward planning and implementation, we’ll be able to apply similar such thinking into the future, whether that be for clientside only web applications and/or ones that call on serverside code (like PHP) … and …
if we can keep things just clientside more readers can be involved, we figure
If you’re wondering about the worry of any of this, it is to do with large title and/or URL link and/or ingredient type data whose data length could be huge, where most of our concern lies, and …
hashtagging (where data limits are so much longer) can help it remain as a clientside only solution environment (rather than relying on some form method=POST to a serverside (eg. PHP) receiver solution) …
window.localStorage is a step up from the HTTP Cookie style of intersessional (personal) storage as far as amounts that can be stored is concerned
What are we aiming for here, then, with our improvements?
extend the existant email and SMS functionality …
<?php echo ”
function emailit(insg) {
var em='', ccok='';
if (estitle == '') {
if (cookb.split(' Or hash delimited appended string can ')[0] != '') {
cookb=cookb.replace(cookb.split(' Or hash delimited appended string can ')[0], '');
}
}
if (('' + insg).replace(/^null/g,'').replace(/^undefined/g,'').trim() != '') {
em='' + insg;
} else {
em=prompt('Please enter Email address to share with. ' + cookb, '');
}
if (em != null) {
if (em.trim() == '' && estitle != '') {
em='#' + estitle;
} else if (em == estitle && estitle != '') {
em='#' + estitle;
}
}
if (em.indexOf('#') != -1) {
cook=em.substring(eval(1 + eval('' + em.indexOf('#'))));
em=em.split('#')[0].trim();
if (cook.trim() != '') {
deleteAVal('steps_' + cook.replace(/\ /g,'-'),'');
setAVal('steps_' + cook.replace(/\ /g,'-'), \"" . $hashurl . $hashurld . "\" + anyhashes);
}
}
if (em == null) { em=''; }
if (em.trim() != '') {
if (em.trim().indexOf('@') != -1) {
em+='?subject=Steps&body=' + encodeURIComponent(\"" . $hashurl . $hashurld . "\" + anyhashes);
document.getElementById('dimap').innerHTML=\"<a style=display:none; id=theaemail target=_blank href='mailto:\" + em + \"'>Email</a>\";
document.getElementById('theaemail').click();
} else if (em.trim().replace(/0/g,'').replace(/1/g,'').replace(/2/g,'').replace(/3/g,'').replace(/4/g,'').replace(/5/g,'').replace(/6/g,'').replace(/7/g,'').replace(/8/g,'').replace(/9/g,'') == '') {
em+='&body=' + encodeURIComponent(\"" . $hashurl . $hashurld . "\" + anyhashes);
document.getElementById('dimap').innerHTML=\"<a style=display:none; id=theasms target=_blank href='sms:\" + em + \"'>SMS</a>\";
document.getElementById('theasms').click();
}
}
return false;
}
function smsit(insg) {
var em='', cook='';
if (estitle == '') {
if (cookb.split(' Or hash delimited appended string can ')[0] != '') {
cookb=cookb.replace(cookb.split(' Or hash delimited appended string can ')[0], '');
}
}
if (('' + insg).replace(/^null/g,'').replace(/^undefined/g,'').trim() != '') {
em='' + insg;
} else {
em=prompt('Please enter SMS number to share with. ' + cookb, '');
}
if (em != null) {
if (em.trim() == '' && estitle != '') {
em='#' + estitle;
} else if (em == estitle && estitle != '') {
em='#' + estitle;
}
}
if (em.indexOf('#') != -1) {
cook=em.substring(eval(1 + eval('' + em.indexOf('#'))));
em=em.split('#')[0].trim();
if (cook.trim() != '') {
deleteAVal('steps_' + cook.replace(/\ /g,'-'),'');
setAVal('steps_' + cook.replace(/\ /g,'-'), \"" . $hashurl . $hashurld . "\" + anyhashes);
}
}
if (em == null) { em=''; }
if (em.trim() != '') {
if (em.trim().replace(/0/g,'').replace(/1/g,'').replace(/2/g,'').replace(/3/g,'').replace(/4/g,'').replace(/5/g,'').replace(/6/g,'').replace(/7/g,'').replace(/8/g,'').replace(/9/g,'') == '') {
em+='&body=' + encodeURIComponent(\"" . $hashurl . $hashurld . "\" + anyhashes);
document.getElementById('dimap').innerHTML=\"<a style=display:none; id=theasms target=_blank href='sms:\" + em + \"'>SMS</a>\";
document.getElementById('theasms').click();
} else if (em.trim().indexOf('@') != -1) {
em+='?subject=Steps&body=' + encodeURIComponent(\"" . $hashurl . $hashurld . "\" + anyhashes);
document.getElementById('dimap').innerHTML=\"<a style=display:none; id=theaemail target=_blank href='mailto:\" + em + \"'>Email</a>\";
document.getElementById('theaemail').click();
}
}
return false;
}
“; ?>
… to cater for additional personalized Title (of steps) and Content of steps (using the hashtagging email and SMS URL methods set up yesterday)
<?php echo ”
var estitle=\"" . $estitle . "\";
var cookb=\"" . $cookblurb . "\";
var lssel='';
var woo=null;
function deleteAVal(goodname, aparticularvalue) {
if (window.localStorage && goodname.indexOf('steps_') == 0) {
if (('' + localStorage.getItem(goodname)).replace(/^undefined/g,'').replace(/^null/g,'') != '') {
if (aparticularvalue == '') {
localStorage.removeItem(goodname);
} else {
if (aparticularvalue.replace('HTTP','http').toLowerCase() == ('' + localStorage.getItem(goodname)).toLowerCase()) {
localStorage.removeItem(goodname);
}
}
}
}
}
function setAVal(cName, cVal) {
if (cName.indexOf('steps_') == 0) {
if (window.localStorage) {
localStorage.setItem(cName, encodeURIComponent(cVal));
cookieAVal('steps_', true);
return ' ';
}
return '';
}
return '';
}
add a new …
<a id=pcookie title='Recall this' class=share onclick="return emailit(estitle);" style='display:none;text-decoration:none;cursor:pointer;'>🍪</a>
… emoji link for intersessional window.localStorage work that calls the email functionality modified Javascript function …
allowing a window.localStorage.setItem([Title (of steps)], encodeURIComponent([Content of steps])) to add a personalized and recallable record be kept on the web browser of use … recallable via …
new dropdown populated with existant such records, as well as a dropdown option allowing the user to remove said records, too … which …
can navigate the user to this recallable Steps idea in a new webpage incarnation …
a dropdown arrangement which is intersessional as well as intrasessional by nature, and personalized to that user’s use of the web browser on that device in question
on many mobile devices the horizontally spreading right cell arrangements has been improved by laying out these textarea elements vertically now …
hashtagged URL mailto: and/or sms: “a” links to email and/or SMS communication conduits, respectively …
<?php echo ”
var anyhashes='';
var aone=1;
var tdc=0;
Graphviz (short for Graph Visualization Software) is a package of open-source tools initiated by AT&T Labs Research for drawing graphs (as in nodes and edges, not as in bar charts) specified in DOT language scripts having the file name extension “gv”. It also provides libraries for software applications to use the tools. Graphviz is free software licensed under the Eclipse Public License.
… we’ve learnt recently, means a lot of things, differently (nuanced) for a range of users, three that we’ve so far become aware of being …
the recent, alas now deprecated, Google ChartsImage Charts GraphViz option means of drawing SVG graphics within an HTML image … we’ve known about before about yesterday …
today’s interest, that being PHP Image GraphViz via Pear on AlmaLinux install, via the AlmaLinux cPanel “Module Installers” Pear installer page, means by which we can use GraphViz calls in PHP code … and, for the future …
GraphViz installs for Python via pip
… in amongst many others we’ve seen programmers using … totally cute, totally useful!
It seems with our PHP Image GraphViz via Pear on AlmaLinux as what looks like a very much “pared down” version of the last mode of use above, that we add constructed graph node or edge or cluster objects, and form them into SVG based HTML image elements. It’s look got me thinking “Steps”, then “Recipe Steps”, and back, quietly, to “Any Old Steps” as the day got more generic.
At first we got, as far as Recipes go (and here we thank Italian Wedding Soup for today’s inspiration), to …
cooking steps showing as Image GraphViz edge graphic components (having arrows connect ellipses containing text, a bit like Speech Bubbles) … and then trying to face the “real world” a user interested in recipes might want to see happen …
an Image GraphViz node graphic component whose wording could be a user supplied recipe Title along with a “URL” attribute link, optionally user supplied (via our HTML div SVG hosting ondblclick event allowing its contenteditable=true attribute and onblur event means by which these optional additional data items can enter the “mix”, if you’ll pardon the pun), probably pointing back to the original recipe information saucesource … and …
this title and/or “URL” and/or ingredient list (for example) can all be expressed as the “on hover” title attribute of the tailored user PHP webpage (yes, here we have PHP writing PHP) … and …
at least on Safari, given a recipe Title defined, we can arrange any browser context menu (ie. right click) over the HTML iframe hosted recipe content “Save Iframe As” option being able to download to a reasonably self explanatory download filename … and/or …
any web browser’s Add Bookmark functionality can be harnessed to help the user out in such a way that our PHP codedMy Recipe Steps web application could end up being your one stop shop “Recipe Organizer” online?!
Better to be king for a night than schmuck for a lifetime. Well, at least it’s not a question. … the thing is, silly us, it turns out that angled text issue was not a problem with [element].getBoundingClientRect() but how the PHP GDimagettftext text placement emanated from the bottom left of the text always, Mr De Niro sir.
Never rat on your friends and always keep your mouth shut. Really wish we could! Yes, Mr De Niro, sir, but, you see this means the rats are completely out of the picture, just leaving us with our money spinner. Right, Mr De Niro … sir.
There are three ways of doing things around here: the right way, the wrong way and the way that I do it. [Exeunt: Stage right] Well, that’s odd? Mr De Niro wasn’t interested in the quadrant nature to our problem solution …
… that temporary div element text border drawing, being the crucial way to find out what was happening, and showing us, at least on Google Chrome web browser, not to worry so much about [element].getBoundingClientRect() results for transformed HTML elements. And that is a huge relief in itself.
Also taking up a lot of today, we shored up Image Map Event Editing results bubbling through to an email or SMS recipient. The size of this data, and an analysis of …
… when it comes to complex and sizeable data such as “Javascript scripting” is, we should start swinging towards Ajax thinking, even pinching it off a client pre-emptive iframe onload event logic thought/start sometimes …
var myxhr=null, rawhtml='';
var zhr=null, zform=null;
function stateChanged() {
if (myxhr.readyState == 4) {
if (myxhr.status == 200) {
console.log('myxhr=' + myxhr);
rawhtml = myxhr.responseText.replace(/\\"/g, '"').replace(/\\'/g, "'");
if (document.getElementById('jdiv')) {
//alert('1:' + rawhtml);
//alert('21111 ' + rawhtml.split('<scr')[1]);
document.getElementById('jdiv').innerHTML=rawhtml.split('<scr')[0]; //xaconto.body.innerHTML;
//alert(31111);
if (document.getElementById('talkimg')) {
document.getElementById('talkimg').useMap='#mymap';
} else {
document.getElementById('myvenn').useMap='#mymap';
}
//alert(41111);
} else {
document.body.innerHTML+=rawhtml.split('<scr')[0]; //xaconto.body.innerHTML;
if (document.getElementById('talkimg')) {
document.getElementById('talkimg').useMap='#mymap';
} else {
document.getElementById('myvenn').useMap='#mymap';
}
}
if (rawhtml.indexOf('<scr') != -1) {
if (1 == 1) {
var tag = document.createElement('script');
var nextsep=rawhtml.split('<scr')[1].split('>')[0] + '>';
//var qw=prompt(rawhtml.split('<scr')[1].split(nextsep)[1].split('</scri')[0],rawhtml.split('<scr')[1].split(nextsep)[1].split('</scri')[0]);
//alert('2:' + rawhtml.split('<scr')[1].split(nextsep)[1].split('</scri')[0]);
tag.innerHTML = rawhtml.split('<scr')[1].split(nextsep)[1].split('</scri')[0];
var firstScriptTag = document.getElementsByTagName('script')[eval(-1 + document.getElementsByTagName('script').length)];
firstScriptTag.insertAdjacentElement("afterend", tag);
}
… in the changedlatest draft image_venn.html Google Chart Image Chart Venn Chart or Scatter Chart or GraphViz Chart or Pie Chart or Line Chart or Bar Chart or Candlestick/Box Chart or Google-O-Meter Chart or Radar Chart or Map Chart interfacing web application you can also try below.
that if yesterday we presented some programmer defined image map event logic … then, today, we’d want to …
offer the user the chance to change that default programmer defined image map event logic, to that of their own design
… in the form of
user defined Javascript .. editable in a …
HTML textarea element
… and then the coding latching onto a document.createElement(‘script’) paradigm, to add Javascript clientside logic, on the fly.
There’s a first time we can remember aspect to how we present these possibilities to the user. We present it in …
amongst the inhouse annotation options … as a …
“reveal” pairing of HTML5 details/summary element combination look … the first time we can remember aspect to that being …
only initially displaying within the details element innerHTML is a summary element nesting a single “icon like” image (like the other “inhouse annotation” icon images) … but if clicked …
the details innerHTML has added to it a textarea element …
function fillindetsed(odet) {
if (odet.innerHTML.split('</summary>')[1] == '') {
document.getElementById('tdleft').style.verticalAlign='top';
var onls=thescript.split('<scr' + 'ipt type="text/javascript">');
var onlstuff=onls[1].split('</sc' + 'ript>')[0];
odet.innerHTML+='<scr' + 'ipt type="text/javascript">' + "<br><textarea onblur=tproc(this); id=tscript rows=100 cols=80 value=''>" + onlstuff + "</textarea><br></script>";
//odet.innerHTML+='<scr' + 'ipt type="text/javascript">' + "<br><textarea onblur=tproc(this); id=tscript rows=100 cols=80 value=''>" + encodeURIComponent(onlstuff) + "</textarea><br></script>";
//document.getElementById('tscript').value=decodeURIComponent(document.getElementById('tscript').innerHTML);
}
}
… from which document.createElement(‘script’) code onblur event logic emanates …
… in the changedlatest draft image_venn.html Google Chart Image Chart Venn Chart or Scatter Chart or GraphViz Chart or Pie Chart or Line Chart or Bar Chart or Candlestick/Box Chart or Google-O-Meter Chart or Radar Chart or Map Chart interfacing web application you can also try below.
Google Chart Image Chart Image Map Events Tutorial
We really like HTML image maps, and it occurred to us with yesterday’s Google Chart Image Chart Image Map Tutorial we were hiding its light under some bushel somewhere, because …
yesterday we introduced with only the onclick event coded for in the HTML area subelements to the map parent element … linked to an …
associated img element … via an …
attribute called usemap … and two aspects, at the very least, to stuff under the bushel are …
many more events than onclick can be defined as you define the area subelements … and here’s the kicker …
you can add area subelement event logic that, on paper, would cause interference with other event logic (ie. the same event type in an event bubbling through scenario) but it won’t if you, as a programmer, turn that use of the usemap attribute on and off like a tap
… which, to our mind, represents the bee’s knees of event management. So useful!
To tip our toes into this woooorrrrrlllllddd we’ll show you some newly added area subelement event logics in a Google Chart Image Chart Radar Chart example below …
… with new relevant event code snippet to help add intelligence to the event logic of our Google Chart Image Chart interfacing web application …
function defclick(evt) {
switch ('' + evt.type) {
case 'click':
alert('Welcome to RJM Programming interfacing to Google Charts Image Chart ' + cname);
break;
case 'touch':
document.getElementById('myh3').innerHTML='RJM Programming - November, 2023 ... mobile touch event ' + evt.type + ' called by ' + ('' + evt.target.id);
break;
default:
alert(evt.type);
break;
}
break;
}
}
Interesting, huh?!
Feel free to try this out in the changedlatest draft image_venn.html Google Chart Image Chart Venn Chart or Scatter Chart or GraphViz Chart or Pie Chart or Line Chart or Bar Chart or Candlestick/Box Chart or Google-O-Meter Chart or Radar Chart or Map Chart interfacing web application you can also try below.
Do you like to come at explaining things in layers? Sort of like the analogy …
you start a project thinking of it in terms of “2D” … and then to move forward …
you spend a day making it work for “3D” (and keep the “2D” working as well)
… or …
you start a web application project thinking of only working via a URL entered on the web browser address bar … and then to move forward …
you spend a day making it work for serving the same purpose and/or a difference purpose called within an HTML iframe (and keep it working for the address bar way as well)
And so we look at a “picturesque” but “kinda dumb” (as far as “action items” go) image we have coming off the interfacing to Google Charts Image Chart. Where can we go here? Well, it would be kind of you to take it to the beach, but that’s not always a possibility now, is it?! Were you pulling my leg?! Tee hee. No, we were thinking … oh no … we have a bad feeling about this … let’s open it up to the class … anyone, anyone? Yes, Louis, would you and Auguste like to share with the class what is so amusing to you?
.
.
.
.
.
.
.
.
.
.
.
.
.
.
.
Okay, thank you for your thoughts on this, and yes, you could take the “picture” to “a picture show”. Yes, very droll, indeed. Any other ideas? Okay, Johann, you say the idea just “clicked” with you. This sounds promising. Go on …
.
.
.
.
.
.
.
.
.
.
.
.
.
.
.
Indeed, a young “picturesque” might like to go tap dancing, that is true. Sheeeeesh! But given the lesson is a Computing one, rather than Drama or Dance or Music or the Arts, maybe we would be looking for a way to use the picture in an enhanced way. Okay Kevin, we’ll try you. What do you think?
Frankly, we are flabbergasted! It’s as if you invented HTML image maps (as a way to add position based event logic), or something … 93/4 points to Gryffindor!
helping keep the image mapping going, even if the Image Chart is …
shared via email or SMS … and/or …
forms the basis of a Broadcast Talk demonstration session
We could use Ajax techniques for the Javascript client ways an emailee’s link’s webpage invocation can use this new resource, but we kind of like “client pre-emptive iframe” onload event thinking, for both sides of the ledger, to get this going, as per …
function htmlDecode(input) { // thanks to https://stackoverflow.com/questions/1912501/unescape-html-entities-in-javascript
var e = document.createElement('textarea');
e.innerHTML = input;
// handle case of empty input
return e.childNodes.length === 0 ? "" : e.childNodes[0].nodeValue;
}
Think of Dynamic Icons as a way to decorate one or more data points displayed in one of …
Line Chart
Bar Chart
Map Chart
Radar Chart
We had that certain “Wow!“ factor going as we remembered our state’s motto from some years back, and we tried out the Map Chart to see whether we could embellish the map with a Dynamic Icon relevant to New South Wales, as you can see with today’s tutorial picture.
We’ll show you the most recent snapshot of Javascript parameters a little later, but the change for this is an optional one up to the user to work out, with prompts such as the Map Chart one updated …
Enter vertical bar separated country ISO Country and/or Region Code list. Please note that optional Dynamic Icons are available via a suffixing string example applied to the second data point such as &chem=y;s=bubble_icon_text_small;d=ski,bb,NSW%20State%20of%20Wow!,FFFFFF;dp=1;ds=0 eg. AU-NT|AU-NSW|AU-SA|NZ|IN’
And here is its relevance in a new snapshot of parameterizations …
var prechtt=(ctype == 'v' ? chdt + prenchtt + chdl + preachtt : (ctype == 's' ? chdt + prenchtt + chdl + preachtt + '&chxt=x,y' : (ctype == 'gv' ? chdt + prenchtt :
(ctype.substring(0,1) == 'p' ? chdt + prenchtt + chdl + preachtt :
((ctype + ' ').substring(0,2).substring(0,1) == 'bv'.substring(0,1) ? chdt + prenchtt + chdl + preachtt : (ctype.substring(0,1) == 'l' ? chdt + prenchtt + chdl + preachtt :
(ctype == 'map' ? '' :
(ctype == 'gom' ? chdt + prenchtt + chdl + preachtt :
(ctype == 'r' ? chdt + prenchtt + chdl + preachtt :
'')))))))));
var promptone=(ctype == 'v' ? "Enter delimited values string for Venn Diagram such that ... " + String.fromCharCode(10) + "The first three values specify the sizes of three circles: A, B, & C. For chart with only two circles, specify zero for the third value." + String.fromCharCode(10) + "The fourth value specifies the size of the intersection of A and B." + String.fromCharCode(10) + "The fifth value specifies the size of the intersection of A and C. For a chart with only two circles, do not specify a value here." + String.fromCharCode(10) + "The sixth value specifies the size of the intersection of B and C. For a chart with only two circles, do not specify a value here." + String.fromCharCode(10) + "The seventh value specifies the size of the common intersection of A, B, and C. For a chart with only two circles, do not specify a value here." + String.fromCharCode(10) + String.fromCharCode(10) + "" : (ctype == 's' ? "Enter delimited values string for Scatter Chart" : (ctype == 'gv' ? "Enter delimited values string for GraphViz Chart" :
(ctype.substring(0,1) == 'p' ? "Enter delimited values string for Pie Chart" :
((ctype + ' ').substring(0,2).substring(0,1) == 'bv'.substring(0,1) ? "Enter v for Vertical or h for Horizontal then one of g for Group or s for Stacked or o for Overlapped Bar Chart look then a space and then enter delimited values string for Bar Chart. Here is a Candlestick and horizontal Bar Chart idea eg. hg 1:20,10,15,25,17,30|0,5,10,7,12,6|35,25,45,47,24,46|15,40,30,27,39,54|70,55,63,59,80,6 Here is a vertical Bar Chart and Box Chart idea vs 1:-1,5,10,7,12,-1|-1,25,30,27,24,-1|-1,40,45,47,39,-1|-1,55,63,59,80,-1|-1,30,40,35,30,-1|-1,-1,5,70,90,-1|-1,-1,-1,80,5,-1&chm=F,FF9900,0,1:4,40|H,0CBF0B,0,1:4,1:20|H,000000,4,1:4,1:40|H,0000FF,3,1:4,1:20|o,FF0000,5,-1,7|o,FF0000,6,-1,7 Prefix just the delimited string you enter by 1: to additionally display Candlestick/Box Charts or by 0: to only display Candlestick/Box Chart" :
(ctype.substring(0,1) == 'l' ? "Enter c for Even or s for Sparklines or xy for Just XY Line Chart look then a space and then enter delimited values string for Line Chart. Here is a Candlestick and Line Chart idea eg. c 1:20,10,15,25,17,30|0,5,10,7,12,6|35,25,45,47,24,46|15,40,30,27,39,54|70,55,63,59,80,6 Here is a Line Chart and Box Chart idea s 1:-1,5,10,7,12,-1|-1,25,30,27,24,-1|-1,40,45,47,39,-1|-1,55,63,59,80,-1|-1,30,40,35,30,-1|-1,-1,5,70,90,-1|-1,-1,-1,80,5,-1&chm=F,FF9900,0,1:4,40|H,0CBF0B,0,1:4,1:20|H,000000,4,1:4,1:40|H,0000FF,3,1:4,1:20|o,FF0000,5,-1,7|o,FF0000,6,-1,7 Prefix just the delimited string you enter by 1: to additionally display Candlestick/Box Charts or by 0: to only display Candlestick/Box Chart" :
(ctype == 'map' ? "" :
(ctype == 'gom' ? "Enter delimited values string for Google-O-Meter Chart" :
(ctype == 'r' ? "Enter delimited values string for Radar Chart but prefix with an s for smooth lines" :
"")))))))));
var oneprompt=(ctype == 'v' ? "Enter delimited values string for your Venn Diagram collaborations, optionally, such that ... " + String.fromCharCode(10) + "The first three values specify the sizes of three circles: A, B, & C. For chart with only two circles, specify zero for the third value." + String.fromCharCode(10) + "The fourth value specifies the size of the intersection of A and B." + String.fromCharCode(10) + "The fifth value specifies the size of the intersection of A and C. For a chart with only two circles, do not specify a value here." + String.fromCharCode(10) + "The sixth value specifies the size of the intersection of B and C. For a chart with only two circles, do not specify a value here." + String.fromCharCode(10) + "The seventh value specifies the size of the common intersection of A, B, and C. For a chart with only two circles, do not specify a value here." + String.fromCharCode(10) + String.fromCharCode(10) + "" : (ctype == 's' ? "Enter delimited values string for Scatter Chart" : (ctype == 'gv' ? "Enter delimited values string for GraphViz Chart" :
(ctype.substring(0,1) == 'p' ? "Enter delimited values string for Pie Chart" :
((ctype + ' ').substring(0,2).substring(0,1) == 'bv'.substring(0,1) ? "Enter g for Grouped or s for Stacked or o for Overlapped Bar Chart look then a space and then enter delimited values string for Bar Chart. Here is a Candlestick and Bar Chart idea eg. g 1:20,10,15,25,17,30|0,5,10,7,12,6|35,25,45,47,24,46|15,40,30,27,39,54|70,55,63,59,80,6 Here is a vertical Bar Chart and Box Chart idea vs 1:-1,5,10,7,12,-1|-1,25,30,27,24,-1|-1,40,45,47,39,-1|-1,55,63,59,80,-1|-1,30,40,35,30,-1|-1,-1,5,70,90,-1|-1,-1,-1,80,5,-1&chm=F,FF9900,0,1:4,40|H,0CBF0B,0,1:4,1:20|H,000000,4,1:4,1:40|H,0000FF,3,1:4,1:20|o,FF0000,5,-1,7|o,FF0000,6,-1,7 Prefix just the delimited string you enter by 1: to additionally display Candlestick/Box Charts or by 0: to only display Candlestick/Box Chart" :
(ctype.substring(0,1) == 'l' ? "Enter c for Even or s for Sparklines or xy for Just XY Line Chart look then a space and then enter delimited values string for Line Chart. Here is a Candlestick and Line Chart idea eg. c 1:20,10,15,25,17,30|0,5,10,7,12,6|35,25,45,47,24,46|15,40,30,27,39,54|70,55,63,59,80,6 Here is a Line Chart and Box Chart idea s 1:-1,5,10,7,12,-1|-1,25,30,27,24,-1|-1,40,45,47,39,-1|-1,55,63,59,80,-1|-1,30,40,35,30,-1|-1,-1,5,70,90,-1|-1,-1,-1,80,5,-1&chm=F,FF9900,0,1:4,40|H,0CBF0B,0,1:4,1:20|H,000000,4,1:4,1:40|H,0000FF,3,1:4,1:20|o,FF0000,5,-1,7|o,FF0000,6,-1,7 Prefix just the delimited string you enter by 1: to additionally display Candlestick/Box Charts or by 0: to only display Candlestick/Box Chart" :
(ctype == 'map' ? "" :
(ctype == 'gom' ? "Enter delimited values string for Google-O-Meter Chart" :
(ctype == 'r' ? "Enter delimited values string for Radar Chart but prefix with an s for smooth lines" :
"")))))))));
var asktwo=(ctype == 'v' ? true : (ctype == 's' ? true : (ctype == 'gv' ? false :
(ctype.substring(0,1) == 'p' ? true :
((ctype + ' ').substring(0,2).substring(0,1) == 'bv'.substring(0,1) ? true : (ctype.substring(0,1) == 'l' ? true :
(ctype == 'map' ? false :
(ctype == 'gom' ? true :
(ctype == 'r' ? true :
false)))))))));
var answersuffix=(ctype.substring(0,1).replace('m','l').replace('b','l').replace('r','l') == 'l' ? '. Please note that optional Dynamic Icons are available via a suffixing string example applied to the second data point such as &chem=y;s=bubble_icon_text_small;d=ski,bb,Wheeee!,FFFFFF;dp=1;ds=0 ' : '');
var twopb=(ctype.substring(0,1) == 'p' ? 'Any optional legend or title argument snippets? Optionally prefix by 3 for 3d Pie Chart or by c for Concentric Pie Chart. Eg. 3' + chdl + preachtt + '&chtt=My%20' + cencodename + '&chco=' + defchco : 'Any optional legend or title argument snippets? Eg. ' + chdl + preachtt + '&chtt=My%20' + cencodename + '&chco=' + defchco);
var beforeanswer=(ctype.substring(0,1) == 'l' ? 'c ' : ((ctype + ' ').substring(0,2).substring(0,1) == 'bv'.substring(0,1) ? 'vg ' : ''));
… even though it is only visual by nature, presented as an update image still presented and updated periodically. Go figure?!
… and offer a way to help the “Broadcast Talk” demonstrator “speak” during their demonstration, effectively. In so doing, we are going to add to …
the demonstrator’s visual inputs coming from that canvas annotator helper … with, today …
the demonstrator’s commentary, collected via an HTML textarea element (to optionally supplement the visuals) from that canvas annotator helper’s originator window (ie. the Google ChartsImage Chart interfacing supervisor) … presented …
… animated GIF (PHP 404.php helping) means of display in the viewer windows (off email invitation links they receive via the demonstrator) in the changed …
function newfunction() {
if (document.getElementById('bshare')) {
document.getElementById('sbshare').innerHTML='<iframe id=ifco style=display:none; src=></iframe><br><br><textarea rows=2 cols=80 id=bcommentary placeholder="Commentary to Viewers can go here ... start with or end with ... for ongoing ..." onblur="askaway(this);" value=""></textarea><br><br>';
}
}
… latest draft image_venn.html Google Chart Image Chart Venn Chart or Scatter Chart or GraphViz Chart or Pie Chart or Line Chart or Bar Chart or Candlestick/Box Chart or Google-O-Meter Chart or Radar Chart or Map Chart interfacing web application you can also try below.
first tentative steps towards, on non-mobile platforms, allowing for text placement rubber banding
Why the trepidation? Well, so far, when the text is angled we can’t understand what results we are getting back from a call to [element].getBoundingClientRect() just yet.
Why is this needed? Again, with the questions! Well, Mr De Niro, you see, well, somebody might want to go onto that more complex annotating.
And why would they do that? Sheesh. Well, Mr De Niro, sir, you see, sometimes things happen in life, and well, fingers slip on keyboards, and mice get awfullllly nervous around screens these days.
Yeh, well, show us the money, wiseguy. Who’s is that question? And what’s with the questions? Well, you see, Mr De Niro, the money is if we can get PHP text placement for text at an angle, where it rotates from the middle of the text, to get a similar positioning to good ol’ … pardon, Mr De Niro … good and well respected Javascript transform rotations … not with a triple pike, Mr De Niro, but you’re awfulllllly close, Mr De Niro, sir … rather, we throw in a couple of translations … no, not Latin, Mr De Niro … of co-ordinates, Mr De Niro.
And that will bring in how much by next Tuesday? Back to the questions? Why so many questions? We think it’s a pretty big money spinner, Mr De Niro, sir, and we think you should come back next Tuesday, and we can show you the ropes. Sweat, oozing from the brow, as Mr De Niro exits stage left.
And just while we have a few minutes, here’s the updated Javascript parameterization …
var prechtt=(ctype == 'v' ? chdt + prenchtt + chdl + preachtt : (ctype == 's' ? chdt + prenchtt + chdl + preachtt + '&chxt=x,y' : (ctype == 'gv' ? chdt + prenchtt :
(ctype.substring(0,1) == 'p' ? chdt + prenchtt + chdl + preachtt :
((ctype + ' ').substring(0,2).substring(0,1) == 'bv'.substring(0,1) ? chdt + prenchtt + chdl + preachtt : (ctype.substring(0,1) == 'l' ? chdt + prenchtt + chdl + preachtt :
(ctype == 'map' ? '' :
(ctype == 'gom' ? chdt + prenchtt + chdl + preachtt :
(ctype == 'r' ? chdt + prenchtt + chdl + preachtt :
'')))))))));
var promptone=(ctype == 'v' ? "Enter delimited values string for Venn Diagram such that ... " + String.fromCharCode(10) + "The first three values specify the sizes of three circles: A, B, & C. For chart with only two circles, specify zero for the third value." + String.fromCharCode(10) + "The fourth value specifies the size of the intersection of A and B." + String.fromCharCode(10) + "The fifth value specifies the size of the intersection of A and C. For a chart with only two circles, do not specify a value here." + String.fromCharCode(10) + "The sixth value specifies the size of the intersection of B and C. For a chart with only two circles, do not specify a value here." + String.fromCharCode(10) + "The seventh value specifies the size of the common intersection of A, B, and C. For a chart with only two circles, do not specify a value here." + String.fromCharCode(10) + String.fromCharCode(10) + "" : (ctype == 's' ? "Enter delimited values string for Scatter Chart" : (ctype == 'gv' ? "Enter delimited values string for GraphViz Chart" :
(ctype.substring(0,1) == 'p' ? "Enter delimited values string for Pie Chart" :
((ctype + ' ').substring(0,2).substring(0,1) == 'bv'.substring(0,1) ? "Enter v for Vertical or h for Horizontal then one of g for Group or s for Stacked or o for Overlapped Bar Chart look then a space and then enter delimited values string for Bar Chart. Here is a Candlestick and horizontal Bar Chart idea eg. hg 1:20,10,15,25,17,30|0,5,10,7,12,6|35,25,45,47,24,46|15,40,30,27,39,54|70,55,63,59,80,6 Here is a vertical Bar Chart and Box Chart idea vs 1:-1,5,10,7,12,-1|-1,25,30,27,24,-1|-1,40,45,47,39,-1|-1,55,63,59,80,-1|-1,30,40,35,30,-1|-1,-1,5,70,90,-1|-1,-1,-1,80,5,-1&chm=F,FF9900,0,1:4,40|H,0CBF0B,0,1:4,1:20|H,000000,4,1:4,1:40|H,0000FF,3,1:4,1:20|o,FF0000,5,-1,7|o,FF0000,6,-1,7 Prefix just the delimited string you enter by 1: to additionally display Candlestick/Box Charts or by 0: to only display Candlestick/Box Chart" :
(ctype.substring(0,1) == 'l' ? "Enter c for Even or s for Sparklines or xy for Just XY Line Chart look then a space and then enter delimited values string for Line Chart. Here is a Candlestick and Line Chart idea eg. c 1:20,10,15,25,17,30|0,5,10,7,12,6|35,25,45,47,24,46|15,40,30,27,39,54|70,55,63,59,80,6 Here is a Line Chart and Box Chart idea s 1:-1,5,10,7,12,-1|-1,25,30,27,24,-1|-1,40,45,47,39,-1|-1,55,63,59,80,-1|-1,30,40,35,30,-1|-1,-1,5,70,90,-1|-1,-1,-1,80,5,-1&chm=F,FF9900,0,1:4,40|H,0CBF0B,0,1:4,1:20|H,000000,4,1:4,1:40|H,0000FF,3,1:4,1:20|o,FF0000,5,-1,7|o,FF0000,6,-1,7 Prefix just the delimited string you enter by 1: to additionally display Candlestick/Box Charts or by 0: to only display Candlestick/Box Chart" :
(ctype == 'map' ? "" :
(ctype == 'gom' ? "Enter delimited values string for Google-O-Meter Chart" :
(ctype == 'r' ? "Enter delimited values string for Radar Chart but prefix with an s for smooth lines" :
"")))))))));
var oneprompt=(ctype == 'v' ? "Enter delimited values string for your Venn Diagram collaborations, optionally, such that ... " + String.fromCharCode(10) + "The first three values specify the sizes of three circles: A, B, & C. For chart with only two circles, specify zero for the third value." + String.fromCharCode(10) + "The fourth value specifies the size of the intersection of A and B." + String.fromCharCode(10) + "The fifth value specifies the size of the intersection of A and C. For a chart with only two circles, do not specify a value here." + String.fromCharCode(10) + "The sixth value specifies the size of the intersection of B and C. For a chart with only two circles, do not specify a value here." + String.fromCharCode(10) + "The seventh value specifies the size of the common intersection of A, B, and C. For a chart with only two circles, do not specify a value here." + String.fromCharCode(10) + String.fromCharCode(10) + "" : (ctype == 's' ? "Enter delimited values string for Scatter Chart" : (ctype == 'gv' ? "Enter delimited values string for GraphViz Chart" :
(ctype.substring(0,1) == 'p' ? "Enter delimited values string for Pie Chart" :
((ctype + ' ').substring(0,2).substring(0,1) == 'bv'.substring(0,1) ? "Enter g for Grouped or s for Stacked or o for Overlapped Bar Chart look then a space and then enter delimited values string for Bar Chart. Here is a Candlestick and Bar Chart idea eg. g 1:20,10,15,25,17,30|0,5,10,7,12,6|35,25,45,47,24,46|15,40,30,27,39,54|70,55,63,59,80,6 Here is a vertical Bar Chart and Box Chart idea vs 1:-1,5,10,7,12,-1|-1,25,30,27,24,-1|-1,40,45,47,39,-1|-1,55,63,59,80,-1|-1,30,40,35,30,-1|-1,-1,5,70,90,-1|-1,-1,-1,80,5,-1&chm=F,FF9900,0,1:4,40|H,0CBF0B,0,1:4,1:20|H,000000,4,1:4,1:40|H,0000FF,3,1:4,1:20|o,FF0000,5,-1,7|o,FF0000,6,-1,7 Prefix just the delimited string you enter by 1: to additionally display Candlestick/Box Charts or by 0: to only display Candlestick/Box Chart" :
(ctype.substring(0,1) == 'l' ? "Enter c for Even or s for Sparklines or xy for Just XY Line Chart look then a space and then enter delimited values string for Line Chart. Here is a Candlestick and Line Chart idea eg. c 1:20,10,15,25,17,30|0,5,10,7,12,6|35,25,45,47,24,46|15,40,30,27,39,54|70,55,63,59,80,6 Here is a Line Chart and Box Chart idea s 1:-1,5,10,7,12,-1|-1,25,30,27,24,-1|-1,40,45,47,39,-1|-1,55,63,59,80,-1|-1,30,40,35,30,-1|-1,-1,5,70,90,-1|-1,-1,-1,80,5,-1&chm=F,FF9900,0,1:4,40|H,0CBF0B,0,1:4,1:20|H,000000,4,1:4,1:40|H,0000FF,3,1:4,1:20|o,FF0000,5,-1,7|o,FF0000,6,-1,7 Prefix just the delimited string you enter by 1: to additionally display Candlestick/Box Charts or by 0: to only display Candlestick/Box Chart" :
(ctype == 'map' ? "" :
(ctype == 'gom' ? "Enter delimited values string for Google-O-Meter Chart" :
(ctype == 'r' ? "Enter delimited values string for Radar Chart but prefix with an s for smooth lines" :
"")))))))));
var asktwo=(ctype == 'v' ? true : (ctype == 's' ? true : (ctype == 'gv' ? false :
(ctype.substring(0,1) == 'p' ? true :
((ctype + ' ').substring(0,2).substring(0,1) == 'bv'.substring(0,1) ? true : (ctype.substring(0,1) == 'l' ? true :
(ctype == 'map' ? false :
(ctype == 'gom' ? true :
(ctype == 'r' ? true :
false)))))))));
var twopb=(ctype.substring(0,1) == 'p' ? 'Any optional legend or title argument snippets? Optionally prefix by 3 for 3d Pie Chart or by c for Concentric Pie Chart. Eg. 3' + chdl + preachtt + '&chtt=My%20' + cencodename + '&chco=' + defchco : 'Any optional legend or title argument snippets? Eg. ' + chdl + preachtt + '&chtt=My%20' + cencodename + '&chco=' + defchco);
var beforeanswer=(ctype.substring(0,1) == 'l' ? 'c ' : ((ctype + ' ').substring(0,2).substring(0,1) == 'bv'.substring(0,1) ? 'vg ' : ''));
var emsmlist='';
… that goes into helping make the changedlatest draft image_venn.html Google Chart Image Chart Venn Chart or Scatter Chart or GraphViz Chart or Pie Chart or Line Chart or Bar Chart or Candlestick/Box Chart or Google-O-Meter Chart or Radar Chart or Map Chart interfacing web application you can also try below, have regular sleepovers on cloud nine.
? It styles an input type=number textbox where a placeholder is not really an option to explain a textbox’s purpose, and we do dislike set aside labels, these days. It’s also a way to explain the textbox for mobile users who do not get a hovering message to help. It’s also got an internationalization feel to it, using the degree sign emoji ° (ie. ° or that \u0080 UTF-16 Encoding style of definition suitable for CSS styling usage) to both associate the units we’d want, as well as that we are asking for an angle. Clockwise or anticlockwise, alas, comes down to user experience!
var prechtt=(ctype == 'v' ? chdt + prenchtt + chdl + preachtt : (ctype == 's' ? chdt + prenchtt + chdl + preachtt + '&chxt=x,y' : (ctype == 'gv' ? chdt + prenchtt :
(ctype.substring(0,1) == 'p' ? chdt + prenchtt + chdl + preachtt :
((ctype + ' ').substring(0,2).substring(0,1) == 'bv'.substring(0,1) ? chdt + prenchtt + chdl + preachtt : (ctype.substring(0,1) == 'l' ? chdt + prenchtt + chdl + preachtt :
(ctype == 'map' ? '' :
(ctype == 'gom' ? chdt + prenchtt + chdl + preachtt :
''))))))));
var promptone=(ctype == 'v' ? "Enter delimited values string for Venn Diagram such that ... " + String.fromCharCode(10) + "The first three values specify the sizes of three circles: A, B, & C. For chart with only two circles, specify zero for the third value." + String.fromCharCode(10) + "The fourth value specifies the size of the intersection of A and B." + String.fromCharCode(10) + "The fifth value specifies the size of the intersection of A and C. For a chart with only two circles, do not specify a value here." + String.fromCharCode(10) + "The sixth value specifies the size of the intersection of B and C. For a chart with only two circles, do not specify a value here." + String.fromCharCode(10) + "The seventh value specifies the size of the common intersection of A, B, and C. For a chart with only two circles, do not specify a value here." + String.fromCharCode(10) + String.fromCharCode(10) + "" : (ctype == 's' ? "Enter delimited values string for Scatter Chart" : (ctype == 'gv' ? "Enter delimited values string for GraphViz Chart" :
(ctype.substring(0,1) == 'p' ? "Enter delimited values string for Pie Chart" :
((ctype + ' ').substring(0,2).substring(0,1) == 'bv'.substring(0,1) ? "Enter v for Vertical or h for Horizontal then one of g for Group or s for Stacked or o for Overlapped Bar Chart look then a space and then enter delimited values string for Bar Chart. Here is a Candlestick and horizontal Bar Chart idea eg. hg 1:20,10,15,25,17,30|0,5,10,7,12,6|35,25,45,47,24,46|15,40,30,27,39,54|70,55,63,59,80,6 Here is a vertical Bar Chart and Box Chart idea vs 1:-1,5,10,7,12,-1|-1,25,30,27,24,-1|-1,40,45,47,39,-1|-1,55,63,59,80,-1|-1,30,40,35,30,-1|-1,-1,5,70,90,-1|-1,-1,-1,80,5,-1&chm=F,FF9900,0,1:4,40|H,0CBF0B,0,1:4,1:20|H,000000,4,1:4,1:40|H,0000FF,3,1:4,1:20|o,FF0000,5,-1,7|o,FF0000,6,-1,7 Prefix just the delimited string you enter by 1: to additionally display Candlestick/Box Charts or by 0: to only display Candlestick/Box Chart" :
(ctype.substring(0,1) == 'l' ? "Enter c for Even or s for Sparklines or xy for Just XY Line Chart look then a space and then enter delimited values string for Line Chart. Here is a Candlestick and Line Chart idea eg. c 1:20,10,15,25,17,30|0,5,10,7,12,6|35,25,45,47,24,46|15,40,30,27,39,54|70,55,63,59,80,6 Here is a Line Chart and Box Chart idea s 1:-1,5,10,7,12,-1|-1,25,30,27,24,-1|-1,40,45,47,39,-1|-1,55,63,59,80,-1|-1,30,40,35,30,-1|-1,-1,5,70,90,-1|-1,-1,-1,80,5,-1&chm=F,FF9900,0,1:4,40|H,0CBF0B,0,1:4,1:20|H,000000,4,1:4,1:40|H,0000FF,3,1:4,1:20|o,FF0000,5,-1,7|o,FF0000,6,-1,7 Prefix just the delimited string you enter by 1: to additionally display Candlestick/Box Charts or by 0: to only display Candlestick/Box Chart" :
(ctype == 'map' ? "" :
(ctype == 'gom' ? "Enter delimited values string for Google-O-Meter Chart" :
""))))))));
var oneprompt=(ctype == 'v' ? "Enter delimited values string for your Venn Diagram collaborations, optionally, such that ... " + String.fromCharCode(10) + "The first three values specify the sizes of three circles: A, B, & C. For chart with only two circles, specify zero for the third value." + String.fromCharCode(10) + "The fourth value specifies the size of the intersection of A and B." + String.fromCharCode(10) + "The fifth value specifies the size of the intersection of A and C. For a chart with only two circles, do not specify a value here." + String.fromCharCode(10) + "The sixth value specifies the size of the intersection of B and C. For a chart with only two circles, do not specify a value here." + String.fromCharCode(10) + "The seventh value specifies the size of the common intersection of A, B, and C. For a chart with only two circles, do not specify a value here." + String.fromCharCode(10) + String.fromCharCode(10) + "" : (ctype == 's' ? "Enter delimited values string for Scatter Chart" : (ctype == 'gv' ? "Enter delimited values string for GraphViz Chart" :
(ctype.substring(0,1) == 'p' ? "Enter delimited values string for Pie Chart" :
((ctype + ' ').substring(0,2).substring(0,1) == 'bv'.substring(0,1) ? "Enter g for Grouped or s for Stacked or o for Overlapped Bar Chart look then a space and then enter delimited values string for Bar Chart. Here is a Candlestick and Bar Chart idea eg. g 1:20,10,15,25,17,30|0,5,10,7,12,6|35,25,45,47,24,46|15,40,30,27,39,54|70,55,63,59,80,6 Here is a vertical Bar Chart and Box Chart idea vs 1:-1,5,10,7,12,-1|-1,25,30,27,24,-1|-1,40,45,47,39,-1|-1,55,63,59,80,-1|-1,30,40,35,30,-1|-1,-1,5,70,90,-1|-1,-1,-1,80,5,-1&chm=F,FF9900,0,1:4,40|H,0CBF0B,0,1:4,1:20|H,000000,4,1:4,1:40|H,0000FF,3,1:4,1:20|o,FF0000,5,-1,7|o,FF0000,6,-1,7 Prefix just the delimited string you enter by 1: to additionally display Candlestick/Box Charts or by 0: to only display Candlestick/Box Chart" :
(ctype.substring(0,1) == 'l' ? "Enter c for Even or s for Sparklines or xy for Just XY Line Chart look then a space and then enter delimited values string for Line Chart. Here is a Candlestick and Line Chart idea eg. c 1:20,10,15,25,17,30|0,5,10,7,12,6|35,25,45,47,24,46|15,40,30,27,39,54|70,55,63,59,80,6 Here is a Line Chart and Box Chart idea s 1:-1,5,10,7,12,-1|-1,25,30,27,24,-1|-1,40,45,47,39,-1|-1,55,63,59,80,-1|-1,30,40,35,30,-1|-1,-1,5,70,90,-1|-1,-1,-1,80,5,-1&chm=F,FF9900,0,1:4,40|H,0CBF0B,0,1:4,1:20|H,000000,4,1:4,1:40|H,0000FF,3,1:4,1:20|o,FF0000,5,-1,7|o,FF0000,6,-1,7 Prefix just the delimited string you enter by 1: to additionally display Candlestick/Box Charts or by 0: to only display Candlestick/Box Chart" :
(ctype == 'map' ? "" :
(ctype == 'gom' ? "Enter delimited values string for Google-O-Meter Chart" :
""))))))));
var asktwo=(ctype == 'v' ? true : (ctype == 's' ? true : (ctype == 'gv' ? false :
(ctype.substring(0,1) == 'p' ? true :
((ctype + ' ').substring(0,2).substring(0,1) == 'bv'.substring(0,1) ? true : (ctype.substring(0,1) == 'l' ? true :
(ctype == 'map' ? false :
(ctype == 'gom' ? true :
false))))))));
var twopb=(ctype.substring(0,1) == 'p' ? 'Any optional legend or title argument snippets? Optionally prefix by 3 for 3d Pie Chart or by c for Concentric Pie Chart. Eg. 3' + chdl + preachtt + '&chtt=My%20' + cencodename + '&chco=' + defchco : 'Any optional legend or title argument snippets? Eg. ' + chdl + preachtt + '&chtt=My%20' + cencodename + '&chco=' + defchco);
var beforeanswer=(ctype.substring(0,1) == 'l' ? 'c ' : ((ctype + ' ').substring(0,2).substring(0,1) == 'bv'.substring(0,1) ? 'vg ' : ''));
var emsmlist='';
… that goes into helping make the changedlatest draft image_venn.html Google Chart Image Chart Venn Chart or Scatter Chart or GraphViz Chart or Pie Chart or Line Chart or Bar Chart or Candlestick/Box Chart or Google-O-Meter Chart or Map Chart interfacing web application you can also try below, one of the happiest little vegemites we know.
Restricting you creatives to “inhouse annotations” of the “gray variety” might be seen as a bit boooorrrriiiinnnngggg! And so, onto the progress up to yesterday’s Google Chart Image Chart Rubber Banding Tutorial, today we’ve added a …
colour picker … way user can define an “inhouse annotations” colour … and while we were at it …
as far as text “inhouse annotations” go we’ve added a counterclockwise from the horizon, in degrees, way to define an angle the text should be placed at … and …
we’ve stopped closing off the text font size dropdown too early, allowing the user to mix it up with their annotations, and so …
We now recommend, for those users pushing the boundaries of functionality, to gather all their “inhouse annotations” together before any “graphical canvas annotations” are thought about.
Both colour and degree counterclockwise angle became “Mantissa Madness Monday” tragics, a bit like moi, really?
How did we express these two measures?
colour can be derived at the 404.php end via mantissae that are 9 or more long where a number of the form rrrgggbbb is numerical and passed across to 404.php in the y co-ordinate mantissa … while … kind of crazily …
angle can be a set of zeros in the x co-ordinate mantissa represented by zero characters to the length of the angle from 1 to 359 in front of a pre-existant font size (in px) usage, from last “Mantissa Madness Monday” (us getting away with this because no font size should start with a zero)
Oh! We have such fun around here?! Below is PHP WordPress blog 404.php code …
Rubber banding is a popular technique of drawing geometric primitives such as line, polylines, rectangle, circle and ellipse on the computer screen.
… really appeals to our “inner programmer” … damn! … come, thou, out into the open, reveal thyself! … the sunshine is wonderful down here, and we’ve done away with death duties! … mostly! … but it is …
only really a non-mobile prospect …
function checkforaction(rubberbanding,nx,ny) {
var bcbit='background-color:rgba(127,127,127,0.5);';
var zeroes='';
var classbit='';
var brbit='';
var ourdist=0;
var ioff=(rubberbanding == true ? 1 : 0);
var mone=1;
But there’s more! Despite how long out of the day it takes to barrack for Hairtie United, there was a mobile matter we resolved. A slide in today’s animated GIF presentation shows the issue. On mobile platforms, with these inhouse annotations, it would immediately show a tiny annotation. There panned out to be two event programming related issues we needed to fix related to this problem …
change looking for a “touchstart” event, and instead look for a “touchdown” event for a document.body scope (else we might have restricted the “scope” to just document.getEleementById(‘myvenn’) as another approach (and you should note our event.stopPropagation() statements in lots of places as another research point for you)) because we are talking “discrete click” user behaviour we are targeting … as well as …
start checking that the co-ordinates calculated fall into the range of the Google Charts Image Chart image dimensions … doh!
if (evt.touches) {
if (evt.touches[0].pageX) {
//alert('here');
x = evt.touches[0].pageX + document.body.scrollLeft - elemLeft;
y = evt.touches[0].pageY + document.body.scrollTop - elemTop;
if (x >= 0 && x <= eval(('' + document.getElementById('myvenn').width).replace('px','')) && y >= 0 && y <= eval(('' + document.getElementById('myvenn').height).replace('px',''))) {
if (curno >= 0 && (lastx != x || lasty != y)) {
xneeds.push(x);
yneeds.push(y);
checkforaction(false,-1,-1);
}
lastx=x;
lasty=y;
}
//alert('x:' + x + ' and y:' + y);
} else {
//alert('Here');
x = evt.touches[0].clientX + document.body.scrollLeft - elemLeft;
y = evt.touches[0].clientY + document.body.scrollTop - elemTop;
if (x >= 0 && x <= eval(('' + document.getElementById('myvenn').width).replace('px','')) && y >= 0 && y <= eval(('' + document.getElementById('myvenn').height).replace('px',''))) {
if (curno >= 0 && (lastx != x || lasty != y)) {
xneeds.push(x);
yneeds.push(y);
checkforaction(false,-1,-1);
}
lastx=x;
lasty=y;
}
//alert('x:' + x + ' and y:' + y);
}
} else if (evt.clientX || ev.clientY) {
//alert('HERE');
x = evt.clientX + document.body.scrollLeft - elemLeft;
y = evt.clientY + document.body.scrollTop - elemTop;
if (x >= 0 && x <= eval(('' + document.getElementById('myvenn').width).replace('px','')) && y >= 0 && y <= eval(('' + document.getElementById('myvenn').height).replace('px',''))) {
if (curno >= 0 && (lastx != x || lasty != y)) {
xneeds.push(x);
yneeds.push(y);
checkforaction(false,-1,-1);
}
lastx=x;
lasty=y;
}
} else {
//alert('HEre');
x = evt.pageX + document.body.scrollLeft - elemLeft;
y = evt.pageY + document.body.scrollTop - elemTop;
if (x >= 0 && x <= eval(('' + document.getElementById('myvenn').width).replace('px','')) && y >= 0 && y <= eval(('' + document.getElementById('myvenn').height).replace('px',''))) {
if (curno >= 0 && (lastx != x || lasty != y)) {
xneeds.push(x);
yneeds.push(y);
checkforaction(false,-1,-1);
}
lastx=x;
lasty=y;
}
}
});
Did you know?
Well … we didn’t?! We happened to try the web application above on a tiny iPad and saw that HTML button elements with an innerHTML label containing a line feed ( ie. <br> ) only showed the top line, and, alas, for that button in question, the vital new information used to be on the second line. Hence our fix …
//document.getElementById('bshare').innerHTML='Repainting Top Left Image Periodically ... <br>Click here to Broadcast this session to other interested parties ...';
document.getElementById('bshare').innerHTML='Click here to Broadcast this session to other interested parties ...<br>Repainting Top Left Image Periodically ...';
The CSS border-radius property has come to the rescue of many a programmer, saving us from resorting to SVG to display circle or ellipses or arcs of various sorts …
function checkforaction() {
var bcbit='background-color:rgba(127,127,127,0.5);';
var zeroes='';
var classbit='';
var brbit='';
var ourdist=0;
images saved as changes are detected gathered, as ever smaller thumbnails, in the top right of four table cells of the user display …
var iijk=0, uniquif=''; snapshots=[], elem=null, elemcontext=null, oimg=null, checkforsquare=2;
We hope you try new functionality in our changedeighth draft image_venn.html Google Chart Image Chart Venn Chart or Scatter Chart or GraphViz Chart or Pie Chart or Line Chart or Bar Chart or Candlestick Chart or Map Chart interfacing web application you can also try below.
once a user has that “More Annotation” annotating happening … offer the chance to …
Broadcast … their work as it happens, dynamically …
to an emailee list audience
… and we’re calling this …
Broadcast Talk
… even though it is only visual by nature, presented as an update image still presented and updated periodically. Go figure?! We’re blaming that supper time two back. We’re not sure?!
Anyway, we hope you try out the new arrangements in our changedseventh draft image_venn.html Google Chart Image Chart Venn Chart or Scatter Chart or GraphViz Chart or Pie Chart or Line Chart or Bar Chart or Candlestick Chart or Map Chart interfacing web application you can also try below, and helped out by a WordPress blog good ol’ TwentyTen theme 404.php which now includes …
… the latter being like a “parasite” display idea off the more conventional Statistical Graph favourites, the Line Chart and Bar Chart, where you have a relationship between a numerical concept (eg. sales) and another type of concept (eg. month of the year), and you want to present the data in a graphical form.
Again, we haven’t stopped our “retweaking”. We might “retweak” in the morning or we might “retweak” over a coffee break or we might “retweak” at supper time, but the end result is, well, you’re reading it now!
var prechtt=(ctype == 'v' ? chdt + prenchtt + chdl + preachtt : (ctype == 's' ? chdt + prenchtt + chdl + preachtt + '&chxt=x,y' : (ctype == 'gv' ? chdt + prenchtt :
(ctype.substring(0,1) == 'p' ? chdt + prenchtt + chdl + preachtt :
((ctype + ' ').substring(0,2) == 'bv' ? chdt + prenchtt + chdl + preachtt : (ctype.substring(0,1) == 'l' ? chdt + prenchtt + chdl + preachtt : ''))))));
var promptone=(ctype == 'v' ? "Enter delimited values string for Venn Diagram such that ... " + String.fromCharCode(10) + "The first three values specify the sizes of three circles: A, B, & C. For chart with only two circles, specify zero for the third value." + String.fromCharCode(10) + "The fourth value specifies the size of the intersection of A and B." + String.fromCharCode(10) + "The fifth value specifies the size of the intersection of A and C. For a chart with only two circles, do not specify a value here." + String.fromCharCode(10) + "The sixth value specifies the size of the intersection of B and C. For a chart with only two circles, do not specify a value here." + String.fromCharCode(10) + "The seventh value specifies the size of the common intersection of A, B, and C. For a chart with only two circles, do not specify a value here." + String.fromCharCode(10) + String.fromCharCode(10) + "" : (ctype == 's' ? "Enter delimited values string for Scatter Chart" : (ctype == 'gv' ? "Enter delimited values string for GraphViz Chart" :
(ctype.substring(0,1) == 'p' ? "Enter delimited values string for Pie Chart" :
((ctype + ' ').substring(0,2) == 'bv' ? "Enter g for Group or s for Stacked or o for Overlapped Bar Chart look then a space and then enter delimited values string for Bar Chart. Here is a Candlestick and Bar Chart idea eg. g 1:20,10,15,25,17,30|0,5,10,7,12,6|35,25,45,47,24,46|15,40,30,27,39,54|70,55,63,59,80,6 Prefix just the delimited string you enter by 1: to additionally display Candlestick Charts or by 0: to only display Candlestick Chart" :
(ctype.substring(0,1) == 'l' ? "Enter c for Even or s for Sparklines or xy for Just XY Line Chart look then a space and then enter delimited values string for Line Chart. Here is a Candlestick and Line Chart idea eg. c 1:20,10,15,25,17,30|0,5,10,7,12,6|35,25,45,47,24,46|15,40,30,27,39,54|70,55,63,59,80,6 Prefix just the delimited string you enter by 1: to additionally display Candlestick Charts or by 0: to only display Candlestick Chart" : ""))))));
var oneprompt=(ctype == 'v' ? "Enter delimited values string for your Venn Diagram collaborations, optionally, such that ... " + String.fromCharCode(10) + "The first three values specify the sizes of three circles: A, B, & C. For chart with only two circles, specify zero for the third value." + String.fromCharCode(10) + "The fourth value specifies the size of the intersection of A and B." + String.fromCharCode(10) + "The fifth value specifies the size of the intersection of A and C. For a chart with only two circles, do not specify a value here." + String.fromCharCode(10) + "The sixth value specifies the size of the intersection of B and C. For a chart with only two circles, do not specify a value here." + String.fromCharCode(10) + "The seventh value specifies the size of the common intersection of A, B, and C. For a chart with only two circles, do not specify a value here." + String.fromCharCode(10) + String.fromCharCode(10) + "" : (ctype == 's' ? "Enter delimited values string for Scatter Chart" : (ctype == 'gv' ? "Enter delimited values string for GraphViz Chart" :
(ctype.substring(0,1) == 'p' ? "Enter delimited values string for Pie Chart" :
((ctype + ' ').substring(0,2) == 'bv' ? "Enter g for Grouped or s for Stacked or o for Overlapped Bar Chart look then a space and then enter delimited values string for Bar Chart. Here is a Candlestick and Bar Chart idea eg. g 1:20,10,15,25,17,30|0,5,10,7,12,6|35,25,45,47,24,46|15,40,30,27,39,54|70,55,63,59,80,6 Prefix just the delimited string you enter by 1: to additionally display Candlestick Charts or by 0: to only display Candlestick Chart" :
(ctype.substring(0,1) == 'l' ? "Enter c for Even or s for Sparklines or xy for Just XY Line Chart look then a space and then enter delimited values string for Line Chart. Here is a Candlestick and Line Chart idea eg. c 1:20,10,15,25,17,30|0,5,10,7,12,6|35,25,45,47,24,46|15,40,30,27,39,54|70,55,63,59,80,6 Prefix just the delimited string you enter by 1: to additionally display Candlestick Charts or by 0: to only display Candlestick Chart" : ""))))));
var asktwo=(ctype == 'v' ? true : (ctype == 's' ? true : (ctype == 'gv' ? false :
(ctype.substring(0,1) == 'p' ? true :
((ctype + ' ').substring(0,2) == 'bv' ? true : (ctype.substring(0,1) == 'l' ? true : false))))));
var twopb=(ce.substring(0,1) == 'p' ? 'Any optional legend or title argument snippets? Optionally prefix by 3 for 3d Pie Chart or by c for Concentric Pie Chart. Eg. 3' + chdl + preachtt + '&chtt=My%20' + cencodename + '&chco=' + defchco : 'Any optional legend or title argument snippets? Eg. ' + chdl + preachtt + '&chtt=My%20' + cencodename + '&chco=' + defchco);
var beforeanswer=(ctype.substring(0,1) == 'l' ? 'c ' : ((ctype + ' ').substring(0,2) == 'bv' ? 'g ' : ''));
And yes, you can, and we did, put line feeds into those ternery statements to help with their readability as we add complexity to the parameterization, as we go along, in our changedsixth draft image_venn.html Google Chart Image Chart Venn Chart or Scatter Chart or GraphViz Chart or Pie Chart or Line Chart or Bar Chart or Candlestick Chart interfacing web application you can also try below.
Yes, we are dovetailing with work we’ve done in the past using the excellent …
canvas … element introduced with HTML5 … whereby …
annotations like …
scribble … as the default, and various other …
discrete click shapes … and …
text … including emojis … and …
image
… annotating modus operandi
… can be part of the arrangements. It works that the Annotation Helper is opened …
in a new “known about” popup window … looking out for …
parent based “img” element (in the modus operandi we use, calling it, regarding the parent top left image) … so as to be able to …
populate its canvas element with a clone of that calling “img” graphical content … but add into the mix …
menu driven annotation functionality which can change that canvas look and underlying data … and …
the caller can keep track of this and arrange, or not, for these changes to be reflected back at its top left “img” element … the catch being …
the “within range of GET argument” limits are ruined by this introduction of graphical data, and so in agreeing to this, a user forgoes those simpler sharing and annotating functionalities of yesterday’s (and before) work … though your normal image sharing capabilities via the web browser remain in the caller and the called
As well, today, we are introducing new Google ChartsImage ChartPie Chart interfacing, and because this chart type can have the three …
Normal
3D
Concentric
… guises, there was some work to keep us off this street (okay … so we divulged … again) …
var pretherest='';
var cht=location.search.split('cht=')[1] ? decodeURIComponent(location.search.split('cht=')[1].split('&')[0]) : "v";
if ((cht + ' ').substring(0,1) == 'p' && cht != 'p') { pretherest=cht.substring(1); }
var ctype=location.search.split('type=')[1] ? decodeURIComponent(location.search.split('type=')[1].split('&')[0]) : cht;
var cname=(ctype == 'v' ? 'Venn Chart' : (ctype == 's' ? 'Scatter Chart' : (ctype == 'gv' ? 'GraphViz Chart' : (ctype.substring(0,1) == 'p' ? 'Pie Chart' : ''))));
var cencodename=(ctype == 'v' ? 'Venn%20Diagram' : (ctype == 's' ? 'Scatter%20Chart' : (ctype == 'gv' ? 'GraphViz%20Chart' : (ctype.substring(0,1) == 'p' ? 'Pie%20Chart' : ''))));
var chdt=(ctype == 'v' ? '&chd=t:' : (ctype == 's' ? '&chd=t:' : (ctype == 'gv' ? '&chl=' : (ctype.substring(0,1) == 'p' ? pretherest + '&chd=t:' : ''))));
var chdeq=(ctype == 'v' ? '&chd=' : (ctype == 's' ? '&chd=' : (ctype == 'gv' ? '&chl=' : (ctype.substring(0,1) == 'p' ? '&chd=' : ''))));
var tc=(ctype == 'v' ? 't:' : (ctype == 's' ? 't:' : (ctype == 'gv' ? '' : (ctype.substring(0,1) == 'p' ? 't:' : ''))));
var chdl=(ctype == 'v' ? '&chdl=' : (ctype == 's' ? '&chdl=' : (ctype == 'gv' ? '' : (ctype.substring(0,1) == 'p' ? '&chdl=' : ''))));
var prenchtt=(ctype == 'v' ? '100,80,60,30,30,30,10' : (ctype == 's' ? '12,87,75,41,23,96,68,71,34,9|98,60,27,34,56,79,58,74,18,76|84,23,69,81,47,94,60,93,64,54' : (ctype == 'gv' ? 'graph{C_0--H_0[type=s];C_0--H_1[type=s];C_0--H_2[type=s];C_0--C_1[type=s];C_1--H_3[type=s];C_1--H_4[type=s];C_1--H_5[type=s]}' : (ctype.substring(0,1) == 'p' ? '1,2,3,4' : ''))));
var preachtt=(ctype == 'v' ? 'A|B|C' : (ctype == 's' ? 'Cats|Dogs' : (ctype == 'gv' ? '' : (ctype.substring(0,1) == 'p' ? 'January|February|March|April' : ''))));
var prechtt=(ctype == 'v' ? chdt + prenchtt + chdl + preachtt : (ctype == 's' ? chdt + prenchtt + chdl + preachtt + '&chxt=x,y' : (ctype == 'gv' ? chdt + prenchtt : (ctype.substring(0,1) == 'p' ? chdt + prenchtt + chdl + preachtt : ''))));
var defchco=(ctype == 'v' ? 'ff0000,00ff00,0000ff' : (ctype == 's' ? 'FF0000|0000FF&chxt=x,y' : (ctype == 'gv' ? '' : (ctype.substring(0,1) == 'p' ? 'ff0000,00ff00,0000ff,ff00ff' : ''))));
var promptone=(ctype == 'v' ? "Enter delimited values string for Venn Diagram such that ... " + String.fromCharCode(10) + "The first three values specify the sizes of three circles: A, B, & C. For chart with only two circles, specify zero for the third value." + String.fromCharCode(10) + "The fourth value specifies the size of the intersection of A and B." + String.fromCharCode(10) + "The fifth value specifies the size of the intersection of A and C. For a chart with only two circles, do not specify a value here." + String.fromCharCode(10) + "The sixth value specifies the size of the intersection of B and C. For a chart with only two circles, do not specify a value here." + String.fromCharCode(10) + "The seventh value specifies the size of the common intersection of A, B, and C. For a chart with only two circles, do not specify a value here." + String.fromCharCode(10) + String.fromCharCode(10) + "" : (ctype == 's' ? "Enter delimited values string for Scatter Chart" : (ctype == 'gv' ? "Enter delimited values string for GraphViz Chart" : (ctype.substring(0,1) == 'p' ? "Enter delimited values string for Pie Chart" : ""))));
var oneprompt=(ctype == 'v' ? "Enter delimited values string for your Venn Diagram collaborations, optionally, such that ... " + String.fromCharCode(10) + "The first three values specify the sizes of three circles: A, B, & C. For chart with only two circles, specify zero for the third value." + String.fromCharCode(10) + "The fourth value specifies the size of the intersection of A and B." + String.fromCharCode(10) + "The fifth value specifies the size of the intersection of A and C. For a chart with only two circles, do not specify a value here." + String.fromCharCode(10) + "The sixth value specifies the size of the intersection of B and C. For a chart with only two circles, do not specify a value here." + String.fromCharCode(10) + "The seventh value specifies the size of the common intersection of A, B, and C. For a chart with only two circles, do not specify a value here." + String.fromCharCode(10) + String.fromCharCode(10) + "" : (ctype == 's' ? "Enter delimited values string for Scatter Chart" : (ctype == 'gv' ? "Enter delimited values string for GraphViz Chart" : (ctype.substring(0,1) == 'p' ? "Enter delimited values string for Pie Chart" : ""))));
var asktwo=(ctype == 'v' ? true : (ctype == 's' ? true : (ctype == 'gv' ? false : (ctype.substring(0,1) == 'p' ? true : false))));
var twopb=(ctype.substring(0,1) == 'p' ? 'Any optional legend or title argument snippets? Optionally prefix by 3 for 3d Pie Chart or by c for Concentric Pie Chart. Eg. 3' + chdl + preachtt + '&chtt=My%20' + cencodename + '&chco=' + defchco : 'Any optional legend or title argument snippets? Eg. ' + chdl + preachtt + '&chtt=My%20' + cencodename + '&chco=' + defchco);
var atend="<canvas id=sharecanvas style=display:none;></canvas><div style=display:none;><label for='shareurl'><input type=button onclick='downloadmaybe(); shareurl();' id='sbut' value='Share URL Link'></input>: </label><input onblur=changeu(this.value); title='Suffix by hashtag 1 is text and hashtag 2 is title' style='width:45%;' type=url value='' placeholder='https://www.rjmprogramming.com.au/ITblog/#RJM Programming Blog#IT Blog' id=shareurl ondblclick='this.value=trythis(this.placeholder);'></input><br><br><span> ... and/or ... </span><br><br><label for='files'><input type=button onclick=document.getElementById('share').click(); value='Share media or document files'></input>: </label><input id='files' type='file' accept='image/*,video/*,audio/*,application/*,text/*' multiple></div><br><br><button id='share' type='button'>Share your media or documents or link!</button><output id='output'></output><scr" + "ipt type='text/javascript' src='/web_share_api_test.js?canv" + "asshare=as_necessary9867654' defer></scr" + "ipt>";
atend='';
var vals=[], annowin=null;
var lastbit="<br><br><br><br> <button title='Other complex canvas annotation functionalities (forgoes the simpler ones above) ...' id=annobut onclick=\"document.getElementById('tdleft').style.verticalAlign='top'; setTimeout(prerepaint, 12000); if (arest.length != 0) { if (document.getElementById('myvenn').src.indexOf(arest) == -1) { pdivhide(); document.getElementById('myvenn').src=document.getElementById('myvenn').src.split(arest.substring(0,5))[0] + arest; document.getElementById('tdleft').style.verticalAlign='top'; } } annowin=window.open('/HTMLCSS/user_of_signature_signature.htm?elemode=img','_blank','top=420,left=620,width=900,height=420'); \" style=\"background-color:yellow;\">More Annotations</button> <button id=bshare onclick=repaint(); style=display:none;>Repaint <font size=1>(but lose sharing emojis above)</font></button><br><div id=divcanvas style=display:none;><canvas id=bottomcanvas></canvas></div>";
var fszbit=' <span id=spanfsz><select id=fsz onchange="fsz=this.value;"><option value=".10">10px</option><option value=".6">6px</option><option value=".8">8px</option><option value=".9">9px</option><option value=".11">11px</option><option value=".12">12px</option><option value=".14">14px</option><option value=".16">16px</option><option value=".18">18px</option><option value=".20">20px</option><option value=".24">24px</option><option value=".30">30px</option><option value=".36">36px</option><option value=".40">40px</option><option value=".48">48px</option><option value=".50">50px</option><option value=".64">64px</option></select></span>';
var origemailurl='mailto:?subject=My%20' + cencodename + '%20...%20best%20viewed%20in%20landscape%20...&body=';
var origsmsurl='sms:&body=My%20' + cencodename + '%20...%20best%20viewed%20in%20landscape%20...';
var smsee='';
var chd=location.search.split(chdeq)[1] ? (tc + decodeURIComponent(location.search.split(chdeq)[1].split('&')[0])).replace('t:t:', 't:').replace(/^t\:$/g, '') : "";
var therest=location.search.split(chdeq)[1] ? (pretherest + document.URL.split(document.URL.split('#')[0].split(chdeq)[1].split('&')[0])[1].split('#')[0]) : "";
GraphViz is a package of open source tools for visualizing connectivity graphs. You can create GraphViz graphs using the DOT language and your choice of layout engines.
Org charts are diagrams of a hierarchy of nodes, commonly used to portray superior/subordinate relationships in an organization. A family tree is a type of org chart.
start with an at least two part “inhouse phase” of additional “extra to text” annotation functionality possibilities … just starting with …
line
open rectangle
filled rectangle
… additional functionality, that we may well add to, but being as we feel a change we’ll leave that for another time.
The WordPress blog “404.php” code snippet becomes …
Would you believe, at least to us, it is far less obvious how to display a straight line (that is perhaps not horizontal nor vertical) within a webpage, than it is to display a rectangle, filled or not?! Talk about irony! Over time, we have developed …
HTML hr elements (with a rotation) … and the less kludgy …
HTML div (defining a box with defined dimensions) for a nested SVG element containing the line definition using percentage dimensions
… in the past, for when we needed to do this. But, today, we’d like to thank this great webpage for its suggestion to involve linear gradients …
Scatter Chart interfacing logic … and along the way fix …
mobile platform User Text issues
… making distributing “Venn Chart” hardcodings into a dropdown selectable arrangement, because there are more commonalities than differences, really, and we do like to parameterize … even in the shower, with a fairly loud rendition of this, perhaps.
Here is our framework for parameterization, here, and into the future …
<title>Interfacing to Google Charts Image Chart Venn Chart or Scatter Chart - RJM Programming - November, 2023</title>
<script type=text/javascript>
var cht=location.search.split('cht=')[1] ? decodeURIComponent(location.search.split('cht=')[1].split('&')[0]) : "v";
var ctype=location.search.split('type=')[1] ? decodeURIComponent(location.search.split('type=')[1].split('&')[0]) : cht;
var cname=(ctype == 'v' ? 'Venn Chart' : (ctype == 's' ? 'Scatter Chart' : ''));
var cencodename=(ctype == 'v' ? 'Venn%20Diagram' : (ctype == 's' ? 'Scatter%20Chart' : ''));
var prenchtt=(ctype == 'v' ? '100,80,60,30,30,30,10' : (ctype == 's' ? '12,87,75,41,23,96,68,71,34,9|98,60,27,34,56,79,58,74,18,76|84,23,69,81,47,94,60,93,64,54' : ''));
var preachtt=(ctype == 'v' ? 'A|B|C' : (ctype == 's' ? 'Cats|Dogs' : ''));
var prechtt=(ctype == 'v' ? '&chd=t:' + prenchtt + '&chdl=' + preachtt : (ctype == 's' ? '&chd=t:' + prenchtt + '&chdl=' + preachtt + '&chxt=x,y' : ''));
var defchco=(ctype == 'v' ? 'ff0000,00ff00,0000ff' : (ctype == 's' ? 'FF0000|0000FF&chxt=x,y' : ''));
var promptone=(ctype == 'v' ? "Enter delimited values string for Venn Diagram such that ... " + String.fromCharCode(10) + "The first three values specify the sizes of three circles: A, B, & C. For chart with only two circles, specify zero for the third value." + String.fromCharCode(10) + "The fourth value specifies the size of the intersection of A and B." + String.fromCharCode(10) + "The fifth value specifies the size of the intersection of A and C. For a chart with only two circles, do not specify a value here." + String.fromCharCode(10) + "The sixth value specifies the size of the intersection of B and C. For a chart with only two circles, do not specify a value here." + String.fromCharCode(10) + "The seventh value specifies the size of the common intersection of A, B, and C. For a chart with only two circles, do not specify a value here." + String.fromCharCode(10) + String.fromCharCode(10) + "" : (ctype == 's' ? "Enter delimited values string for Scatter Chart" : ""));
var oneprompt=(ctype == 'v' ? "Enter delimited values string for your Venn Diagram collaborations, optionally, such that ... " + String.fromCharCode(10) + "The first three values specify the sizes of three circles: A, B, & C. For chart with only two circles, specify zero for the third value." + String.fromCharCode(10) + "The fourth value specifies the size of the intersection of A and B." + String.fromCharCode(10) + "The fifth value specifies the size of the intersection of A and C. For a chart with only two circles, do not specify a value here." + String.fromCharCode(10) + "The sixth value specifies the size of the intersection of B and C. For a chart with only two circles, do not specify a value here." + String.fromCharCode(10) + "The seventh value specifies the size of the common intersection of A, B, and C. For a chart with only two circles, do not specify a value here." + String.fromCharCode(10) + String.fromCharCode(10) + "" : (ctype == 's' ? "Enter delimited values string for Scatter Chart" : ""));
// etcetera etcetera etcetera
… but, as you can imagine, there will probably be small retweaks of this arrangement, which is holding out okay so far for Scatter Charts in our changedthird draft image_venn.html Google Chart Image Chart Venn Chart or Scatter Chart interfacing web application you can also try below.
Did you know?
In this online world with so many platforms and devices and software choices, there is no need to ever be embarrassed by what might seem an obvious feature you’ve missed.
Take the way on macOS, but not iOS, using a web browser to get to YouTube, you can flag that a video should loop. Especially good for …
song obsessions …
earworms you need to salve
… and what about if your shower is taking an awfully long time?! Please be careful with moisture and devices, though, in the bathroom!
How does it happen? Right click the play button, and looping is there as the top option. Now back to that shower song obsession.
… given what we learnt in Primary school … or should we say …
“Gryffindor Slytherin Ravenclaw Hufflepuff Junior Business College”
… and, yes, is that you, Aoife? What did you want to point out? After you swallow those Rice Bubbles, that is?! Class is waiting …
.
.
.
.
.
.
.
.
.
.
.
.
.
.
.
.
.
.
.
.
.
.
.
.
.
Yes … miss something … and …
.
.
.
.
.
.
.
.
.
.
.
.
.
.
.
.
.
.
.
.
.
.
.
.
.
Use your words … okay … missing … don’t worry, the bus will wait … no … there’s no need to point … oh! …
… do you mean …
missing ewe … no … missing you … oh! … missing u … oh! … “Gryffindor Slytherin Ravenclaw Hufflepuff Juniour Business College” … quite so, Aiofe … 3 points for Hufflepuff!
Anyway we needed a fleshed out “function ask” to cater for potential onclick event logic catering for co-ordinates …
function ask(evt) {
var answer='', answertherest='';
if (lasttext != '' && evt && normalcall) {
document.getElementById('ilp').placeholder='Enter text and later click place for it on Venn Diagram to left (line feed is ~~)';
if (evt.touches) {
if (evt.touches[0].pageX) {
x = evt.touches[0].pageX + document.body.scrollLeft - elemLeft;
y = evt.touches[0].pageY + document.body.scrollTop - elemTop;
} else {
x = evt.touches[0].clientX + document.body.scrollLeft - elemLeft;
y = evt.touches[0].clientY + document.body.scrollTop - elemTop;
}
} else if (evt.clientX || ev.clientY) {
x = evt.clientX + document.body.scrollLeft - elemLeft;
y = evt.clientY + document.body.scrollTop - elemTop;
} else {
x = evt.pageX + document.body.scrollLeft - elemLeft;
y = evt.pageY + document.body.scrollTop - elemTop;
}
document.getElementById('dtext').innerHTML+='<p style="position:absolute;font-size:10px;font-family:Arial;left:' + x + 'px;top:' + y + 'px;z-index:98;">' + lasttext + '</p>';
document.getElementById('aemail').href+='&text' + textnum + '=' + encodeURIComponent('' + x + ',' + y + ',') + encodeURIComponent(lasttext.replace(/\<br\>/g, String.fromCharCode(10)));
document.getElementById('asms').href+='&text' + textnum + '=' + encodeURIComponent('' + x + ',' + y + ',') + encodeURIComponent(lasttext.replace(/\<br\>/g, String.fromCharCode(10)));
arest+='&text' + textnum + '=' + encodeURIComponent('' + x + ',' + y + ',') + encodeURIComponent(lasttext.replace(/\<br\>/g, String.fromCharCode(10)));
therest+='&text' + textnum + '=' + encodeURIComponent('' + x + ',' + y + ',') + encodeURIComponent(lasttext.replace(/\<br\>/g, String.fromCharCode(10)));
asmsurl+='&text' + textnum + '=' + encodeURIComponent('' + x + ',' + y + ',') + encodeURIComponent(lasttext.replace(/\<br\>/g, String.fromCharCode(10)));
aemailurl+='&text' + textnum + '=' + encodeURIComponent('' + x + ',' + y + ',') + encodeURIComponent(lasttext.replace(/\<br\>/g, String.fromCharCode(10)));
document.getElementById('tdright').innerHTML=" <span id=spemail><a target=_blank href='mailto:?subject=My%20Venn%20Diagram%20...%20best%20viewed%20in%20landscape%20...&body=" + encodeURIComponent((document.getElementById('myvenn').src + arest).replace((document.getElementById('myvenn').src + arest).split('?')[0].split('#')[0], document.URL.split('?')[0].split('#')[0])) + "' id=aemail title=Email>📧</a></span> <span id=spsms><a target=_blank onmouseover=\"if (smsee.length == 0 && origsmsurl.indexOf('sms:&') != -1) { smsee=prompt('Please enter SMS number to send to.', ''); if (smsee == null) { smsee=''; } else { origsmsurl=origsmsurl.replace('sms:&','sms:' + smsee + '&'); asmsurl=asmsurl.replace('sms:&','sms:' + smsee + '&'); this.href=asmsurl; } }\" ontouchstart=\"if (smsee.length == 0 && origsmsurl.indexOf('sms:&') != -1) { smsee=prompt('Please enter SMS number to send to.', ''); if (smsee == null) { smsee=''; } else { origsmsurl=origsmsurl.replace('sms:&','sms:' + smsee + '&'); asmsurl=asmsurl.replace('sms:&','sms:' + smsee + '&'); this.href=asmsurl; } }\" href='sms:&body=" + encodeURIComponent((document.getElementById('myvenn').src + arest).replace(document.getElementById('myvenn').src.split('?')[0].split('#')[0], document.URL.split('?')[0].split('#')[0])) + "' id=asms title=SMS>📟</a></span><br><br> <input id=ilp onblur=\"lasttext=this.value.replace(/\~\~/g, '<br>'); this.value=''; this.placeholder='Click where you want ... ' + lasttext.replace(/\<br\>/g, String.fromCharCode(10)); mvp.setAttribute('content','initial-scale=1'); document.getElementById('myvenn').scrollIntoView();\" placeholder='Enter text and later click place for it on Venn Diagram to left (line feed is ~~)' type=text style=width:500px; value=''></input>";
//alert( document.getElementById('aemail').outerHTML );
//alert( document.getElementById('asms').outerHTML );
textnum++;
lasttext='';
} else if (!evt || !normalcall) {
if (chd == '') {
answer=prompt("Enter delimited values string for Venn Diagram such that ... " + String.fromCharCode(10) + "The first three values specify the sizes of three circles: A, B, & C. For chart with only two circles, specify zero for the third value." + String.fromCharCode(10) + "The fourth value specifies the size of the intersection of A and B." + String.fromCharCode(10) + "The fifth value specifies the size of the intersection of A and C. For a chart with only two circles, do not specify a value here." + String.fromCharCode(10) + "The sixth value specifies the size of the intersection of B and C. For a chart with only two circles, do not specify a value here." + String.fromCharCode(10) + "The seventh value specifies the size of the common intersection of A, B, and C. For a chart with only two circles, do not specify a value here." + String.fromCharCode(10) + String.fromCharCode(10) + "", (chd == '' ? "100,80,60,30,30,30,10" : (chd.replace('t:',''))));
} else {
answer=prompt("Enter delimited values string for your Venn Diagram collaborations, optionally, such that ... " + String.fromCharCode(10) + "The first three values specify the sizes of three circles: A, B, & C. For chart with only two circles, specify zero for the third value." + String.fromCharCode(10) + "The fourth value specifies the size of the intersection of A and B." + String.fromCharCode(10) + "The fifth value specifies the size of the intersection of A and C. For a chart with only two circles, do not specify a value here." + String.fromCharCode(10) + "The sixth value specifies the size of the intersection of B and C. For a chart with only two circles, do not specify a value here." + String.fromCharCode(10) + "The seventh value specifies the size of the common intersection of A, B, and C. For a chart with only two circles, do not specify a value here." + String.fromCharCode(10) + String.fromCharCode(10) + "", (chd == '' ? "100,80,60,30,30,30,10" : (chd.replace('t:',''))));
}
vals=[];
if (answer != null) {
answer=answer.trim();
if (answer.trim() != '') {
var delimis='';
for (var ii=0; ii<answer.length; ii++) {
if (delimis == '' && (answer.substring(ii).substring(0,1) < '0' || answer.substring(ii).substring(0,1) > '9')) {
delimis=answer.substring(ii).substring(0,1);
}
}
}
if (delimis != '') {
vals=answer.split(delimis);
}
if (vals.length == 6 || vals.length == 7) {
answertherest=prompt('Any optional legend or title argument snippets? Eg. &chdl=A|B|C&chtt=My%20Venn%20Diagram&chco=ff0000,00ff00,0000ff', therest);
if (answertherest == null) { answertherest=''; }
therest=answertherest.trim();
var aone=1;
var plotstring='';
var flds=[];
if (therest.indexOf('&text' + aone + '=') != -1) {
while (therest.indexOf('&text' + aone + '=') != -1) {
if (chd == '') {
plotstring=decodeURIComponent(therest.split('&text' + aone + '=')[1].split('&')[0]);
while (plotstring.indexOf(String.fromCharCode(10)) != -1) {
plotstring=plotstring.replace(String.fromCharCode(10), '<br>');
}
flds=plotstring.split(',');
if (eval('' + flds.length) >= 3) {
document.getElementById('dtext').innerHTML+='<p style="position:absolute;font-size:10px;font-family:Arial;left:' + flds[0] + 'px;top:' + flds[1] + 'px;z-index:98;">' + plotstring.split('' + flds[0] + ',' + flds[1] + ',')[1] + '</p>';
}
}
aone++;
textnum=aone;
}
}
//document.getElementById('myvenn').style.backgroundImage='URL(//www.rjmprogramming.com.au/ITblog/' + Math.min(550,window.innerWidth) + '/' + Math.min(350,window.innerHeight) + '/?cht=v&chd=t:' + encodeURIComponent(answer + therest) + ')';
document.getElementById('myvenn').src='//www.rjmprogramming.com.au/ITblog/' + Math.min(550,window.innerWidth) + '/' + Math.min(350,window.innerHeight) + '/?cht=v&chd=t:' + encodeURIComponent(answer) + therest + '';
if (document.getElementById('tdright').innerHTML == '') {
document.getElementById('tdright').innerHTML=" <span id=spemail><a target=_blank href='mailto:?subject=My%20Venn%20Diagram%20...%20best%20viewed%20in%20landscape%20...&body=" + encodeURIComponent((document.getElementById('myvenn').src + arest).replace(document.getElementById('myvenn').src.split('?')[0].split('#')[0], document.URL.split('?')[0].split('#')[0])) + "' id=aemail title=Email>📧</a></span> <span id=spsms><a target=_blank onmouseover=\"if (smsee.length == 0 && origsmsurl.indexOf('sms:&') != -1) { smsee=prompt('Please enter SMS number to send to.', ''); if (smsee == null) { smsee=''; } else { origsmsurl=origsmsurl.replace('sms:&','sms:' + smsee + '&'); asmsurl=asmsurl.replace('sms:&','sms:' + smsee + '&'); this.href=asmsurl; } }\" ontouchstart=\"if (smsee.length == 0 && origsmsurl.indexOf('sms:&') != -1) { smsee=prompt('Please enter SMS number to send to.', ''); if (smsee == null) { smsee=''; } else { origsmsurl=origsmsurl.replace('sms:&','sms:' + smsee + '&'); asmsurl=asmsurl.replace('sms:&','sms:' + smsee + '&'); this.href=asmsurl; } }\" href='sms:&body=" + encodeURIComponent((document.getElementById('myvenn').src + arest).replace(document.getElementById('myvenn').src.split('?')[0].split('#')[0], document.URL.split('?')[0].split('#')[0])) + "' id=asms title=SMS>📟</a></span><br><br> <input id=ilp onblur=\"lasttext=this.value.replace(/\~\~/g, '<br>'); this.value=''; this.placeholder='Click where you want ... ' + lasttext.replace(/\<br\>/g, String.fromCharCode(10));\" placeholder='Enter text and later click place for it on Venn Diagram to left (line feed is ~~)' type=text style=width:500px; value=''></input>";
}
} else {
alert('Try again.');
ask(null);
}
}
}
atstart=false;
normalcall=true;
}
As far as this WordPress blog’s 404.php role goes in all this, we were keen to maintain Venn Diagrams that were purely image based data, because the web browser sharing mechanisms are so much better this way, else we were tempted to just construct a webpage HTML dataset positioning text in an absolute way with a Venn Chart background image. In order to do these purely image based Venn Diagrams we used PHP’s GD image library as per …
Google Chart Image Chart Venn Chart Interfacing Primer Tutorial
So, moving on from Google ChartsImage Chart Map Charts, today, let’s turn our attention to Google ChartsImage ChartVenn Charts which we were dead set curious about given work we’d done in the past regarding Venn Diagrams, which we referenced when we presented Flowchart and Venn Diagram and Mind Map Token Subject Emoji Tutorial some time back. Gobsmackingly good is the Google approach, again, as you’d expect, but the approach covers different ground, so one feels one should go back to Primary School! You thought we were going to give away the answer to one of those security questions, didn’t you?! Didn’t you!?! Well, the answer is “Gryffindor Slytherin Ravenclaw Hufflepuff Junior Business College” … if you must know.
The sharing capabilities are good with the Google Charts approach too, given we are creating an HTML image, as our WordPress blog good ol’ 404.php has been woken up to address via …
Yes, all these Image Chart smarts come, essentially, from a “one line” calling URL! Who’d have believed it! Shiver me timbers!
Well, it’s early days with this Venn Chart interfacing where we allow for …
circle (think up to three) definition … and the rest, in this first draft (hoping you’ve done some reading) …
legend and title and colour selection user definitions dumped into a fairly unfriendly “the rest” Javascript prompt entry we ask of the user should they go ahead with the previous definition … and …
sharing and collaboration email and SMS functionality