Python GraphViz via PHP on AlmaLinux Family Tree Image Tutorial

Python GraphViz via PHP on AlmaLinux Family Tree Image Tutorial

Python GraphViz via PHP on AlmaLinux Family Tree Image Tutorial

So far with our GraphViz usages, there have been no images, within any SVG output created. Today, at least with the Family Tree functionality, we want to allow image URL user entered imagery to overlay SVG node elements, using that node’s positioning to guide where this overlayed image should be placed, further to yesterday’s Python GraphViz via PHP on AlmaLinux Family Tree Tutorial.

Is it Javascript DOM helping with this? Yes, we host SVG GraphViz output within HTML iframe elements, where (in the spirit of “Client Pre-Emptive Iframe” thinking), which have an onload event Javascript function looking like …

<?php echo ”

function checksvg(iois) {
var gs=[];
if (iois != null) { // check out window.svgDocument
var aconto = (iois.contentWindow || iois.contentDocument);
if (aconto != null) {
//alert(1);
if (aconto.document) {
aconto = aconto.document;
gs=aconto.getElementsByTagName('g');
if (eval('' + gs.length) > 0) {
gzero=gs[0];
for (var sd=0; sd<gs.length; sd++) {
gs[sd].onclick=function(event){ parent.svgit(event.target, ''); };
gs[sd].ondblclick=function(event){ parent.svgit(event.target, 'ask'); };
}
}
gs=aconto.getElementsByTagName('svg');
if (eval('' + gs.length) > 0) {
szero=gs[0];
for (var sd=0; sd<gs.length; sd++) {
gs[sd].onclick=function(event){ parent.svghost(event.target, ''); };
}
}
console.log(gs.length);
console.log(aconto);
}
//alert(11);
if (aconto.body != null) {
iois=iois;
//alert('yay!');
}
}
if (gzero) {
gzero=gzero;
" . (strlen($addimg) == 0 ? $addimg : ' gzero.innerHTML+="' . $addimg . '"') . "
if (aimg != '') { eval(' gzero.innerHTML+=\"' + aimg + '\"'); }
}
}
}

“; ?>

… relying on iois.contentDocument (as our reading said would help) before any of our aconto.body thinking which suits (our usual) HTML content with the relevant iframe hosting element. From there on, Javascript DOM principles can help modify and scour SVG content, and make use of new Javascript functions, as per …

<?php echo ”

function svghost(svgheo, imgc) {
if (9 == 8) {
if (gzero) {
gzero.innerHTML+=\"<image x='0' y='0' href='/camel.png'></image>\";
} else {
svgheo.innerHTML+=\"<image x='0' y='0' href='/camel.png'></image>\";
}
}
}

function psvgit() {
svgit(lastsvgeo, lastimgc);
}

function svgit(svgeo, imgc) {
var pres='';
lastsvgeo=svgeo;
lastimgc=imgc;
if (('' + svgeo.outerHTML).indexOf('<text') == 0) {
if ((svgeo.innerHTML.toHtmlEntities().split('&')[0].split('(')[0].split('<')[0]).replace('%20',' ').replace('+',' ').indexOf(' ') != -1 && lasturl != '//thatsthem.com/name/' + encodeURIComponent(svgeo.innerHTML.toHtmlEntities().split('&')[0].split('(')[0].split('<')[0])) {
lasturl='//thatsthem.com/name/' + encodeURIComponent(svgeo.innerHTML.toHtmlEntities().split('&')[0].split('(')[0].split('<')[0])
window.open('//www.google.com/search?sca_esv=8957a51bd870705f&sxsrf=ADLYWIL9Z95Y2XILCVHy1Ep_vA8UA0HVLw:1728014294038&q=' + encodeURIComponent(svgeo.innerHTML.toHtmlEntities().split('&')[0].split('(')[0].split('<')[0]) + '&udm=2&fbs=AEQNm0CrHVBV9axs7YmgJiq-TjYcvrKLYvLdNLLD2b8MCfaxte6rE3yH_shvJRqV-Iqr8JJvO9luGxMyf8tABHRE_ER5WVi_ouuYD0ZGCgonp8RpBmOUpTB-X6dVFbJc8KMdvjlHxs0_OJiYCY4-Y60oHTMiC_1a9mkGkMIYHO4XqP68ipa4P5rJaQCtA4WPne6f0aAKhdyAMTPbTsWJEdFYpNvI5RzOgw&sa=X&ved=2ahUKEwjCwabx6vOIAxWJ7DQHHQIOJBoQtKgLegQIDRAB&biw=1433&bih=739&dpr=2', '_blank', 'top=100,left=' + eval(-600 + screen.width) + ',width=600,height=600');
window.focus();
uselast=true;
setTimeout(psvgit, 2000);
return '';
}
lasttext=svgeo;
if (lastiurl.indexOf(\"<image x='\" + svgeo.getAttribute('x') + \"' y='\" + svgeo.getAttribute('y')) == -1 && (imgc == 'ask' || lasturl == '//thatsthem.com/name/' + encodeURIComponent(svgeo.innerHTML.toHtmlEntities().split('&')[0].split('(')[0].split('<')[0]))) {
if (('' + svgeo.getAttribute('width')).indexOf('null') != -1) {
lastiurl=\"<image x='\" + eval(-20 + eval('' + svgeo.getAttribute('x'))) + \"' y='\" + eval(-20 + eval('' + svgeo.getAttribute('y'))) + \"' width='45' height='45' opacity='0.6' href=''></image>\";
} else {
lastiurl=\"<image x='\" + svgeo.getAttribute('x') + \"' y='\" + svgeo.getAttribute('y') + \"' opacity='0.6' width='\" + svgeo.getAttribute('width') + \"' height='\" + svgeo.getAttribute('height') + \"' href=''></image>\";
}
window.focus();
pres=null;
try {
if (lastp != 'Regarding ' + svgeo.innerHTML + ' please enter an optional image URL') {
pres=prompt('Regarding ' + svgeo.innerHTML + ' please enter an optional image URL', '');
}
} catch(exc) {
console.log('error');
}
if (pres == null) { console.log('err'); pres=''; if (uselast) { setTimeout(psvgit, 2000); } } else { uselast=false; lastp='Regarding ' + svgeo.innerHTML + ' please enter an optional image URL'; }
if (pres != '') {
uselast=false;
lastp='Regarding ' + svgeo.innerHTML + ' please enter an optional image URL';
lastiurl=lastiurl.replace(\" href=''\", \" href='\" + pres + \"'\");
if (gzero) {
//alert(\"<image x='0' y='0' width='45' height='45' href=\" + lastiurl.split('href=')[1]);
//gzero.innerHTML+=\"<image x='0' y='0' width='45' height='45' href=\" + lastiurl.split('href=')[1]; //.replace(/\-/g,'');
//if (document.getElementById('addimg').value == '') {
// document.getElementById('addimg').value=' gzero.innerHTML+=\"\"; ';
//}
document.getElementById('addimg').value+=lastiurl;
//alert(document.getElementById('addimg').value);
gzero.innerHTML+=lastiurl;
}
}
}
if (lasturl != '//thatsthem.com/name/' + encodeURIComponent(svgeo.innerHTML.toHtmlEntities().split('&')[0].split('(')[0].split('<')[0])) {
lasturl='//thatsthem.com/name/' + encodeURIComponent(svgeo.innerHTML.toHtmlEntities().split('&')[0].split('(')[0].split('<')[0])
if (('' + svgeo.innerHTML.toHtmlEntities().split('&')[0].split('(')[0].split('<')[0]).replace('%20',' ').replace('+',' ').indexOf(' ') == -1) {
setTimeout(function(){ window.open(lasturl, '_blank', 'top=100,left=' + eval(-600 + screen.width) + ',width=600,height=600'); }, 3000);
} else {
lasturl+=' ';
}
//svgeo.innerHTML+='</text><text>+';
}
}
if (1 == 2) {
svgeo.innerHTML+='+';
alert('' + svgeo.outerHTML);
}
}

“; ?>

… in a changed PHP family_tree.php Family Tree creation. This usage, including some data URI image links, is apparent clicking Simpsons Family Tree link.


Previous relevant Python GraphViz via PHP on AlmaLinux Family Tree Tutorial is shown below.

Python GraphViz via PHP on AlmaLinux Family Tree Tutorial

Python GraphViz via PHP on AlmaLinux Family Tree Tutorial

Thinking on the hierarchical skills of GraphViz, it is not surprising that we turn to Family Tree functionality, as the follow up work onto yesterday’s Python GraphViz via PHP on AlmaLinux Organization Hierarchy Emoji Tutorial.

y

If you examine this how we got there link, you will see by how little has changed, how there is so much in common as we build on previous GraphViz work, rather than worrying about the differences … they soon become apparent as you test the https://forum.graphviz.org/t/emojis-not-working/1935/2 inspired family_tree.py Python code inspiration, thanks.

That last link’s Python code made us ditch the inhouse | and ; and . delimitation ideas in favour of the Python structure syntax, it being as self explanatory (or more, we daresay) as the inhouse delimiter ideas, and easier to implement …

<?php

// family_tree.php
// RJM Programming
// September, 2024
// Trying out Python GraphViz package ... thanks to https://forum.graphviz.org/t/emojis-not-working/1935/2

$abl=['my_family_tree',"\"Malik✅\", \"Cecil\", \"Sultan\"","\"Mehwish\", \"Miriam\", \"Sultana\"","\"Malik✅\": [\"Sultan\", \"Usman\"], \"Cecil\": [\"Margaret\", \"Christina\"], \"Sultan\": [\"Lilly\", \"Adam\"]"];
$newabl=['my-family-tree',"\"Malik✅\", \"Cecil\", \"Sultan\"","\"Mehwish\", \"Miriam\", \"Sultana\"","\"Malik✅\": [\"Sultan\", \"Usman\"], \"Cecil\": [\"Margaret\", \"Christina\"], \"Sultan\": [\"Lilly\", \"Adam\"]"];

// lots more PHP code follows
?>

It also served to remind us that users might want to embed emojis into their Family Tree names, so to leave SVG as our default output format would be advantageous, again. All the Stop Press ideas yesterday were relevant too, for the PHP family_tree.php Family Tree creation …

Calling cab (6754 – 6756 + 5).

… helper (of Python).

Sharing and collaboration concepts mean that we can share links such as The Simpsons Family Tree we gleaned from thanks to this great link to look like as shown in today’s animated GIF presentation.


Previous relevant Python GraphViz via PHP on AlmaLinux Organization Hierarchy Emoji Tutorial is shown below.

Python GraphViz via PHP on AlmaLinux Organization Hierarchy Emoji Tutorial

Python GraphViz via PHP on AlmaLinux Organization Hierarchy Emoji Tutorial

As far as the title of today’s tutorial goes, onto yesterday’s Python GraphViz via PHP on AlmaLinux Organization Hierarchy Tutorial, we figure “the new word” in the title could have come from …

  • Emoji … as we decided upon (as much as anything, because non-ascii characters for other non-English language requirements, might now be possible within the content of the GraphViz entity, as a result) … or …
  • Format … or …
  • Sharing … or …
  • Encoding … or …
  • Delimitation

We wanted to look back at yesterday to it’s “code architecture”, if you will, as a “lead in” to where we are coming at here. Yesterday, in the user definable textarea elements …

| … “edge” linkage record set delimiter
; … parent from rest delimiter
, … rest child name(s) delimiter

… this user usage delimiter characters “inhouse rules” architecture contributes to making it all the more crucial in the coding, to nail down how the + character is handled …

<?php echo ”

function contentfix(inid) {
document.getElementById('ititle').value=document.getElementById('ititle').value.replace(/\+/g,'-').replace(/\=/g,'-').replace(/\ /g,'-');
document.getElementById('none').value=various(document.getElementById('one').value.replace(/\+/g,String.fromCharCode(9)));
document.getElementById('ntwo').value=various(document.getElementById('two').value.replace(/\+/g,String.fromCharCode(9)));
document.getElementById('nthree').value=various(document.getElementById('three').value.replace(/\+/g,String.fromCharCode(9)));
return inid;
}

“; ?>

… which, as you can see with our HTML form onsubmit event fired Javascript function above, amounts to mapping real content + characters to horizontal tab to differentiate this mode of use from the use HTML form encoding uses for it to represent an encoded space character. Are you now getting a bit of an idea with today’s “tidying up” and “nuancing” feel?!

What about if any “edge” names contain one of those delimiters, as above? Well, we try …

<?php echo ”

function various(indi) {
var outdi=indi;
outdi=outdi.replace(/\|\;/g, encodeURIComponent('|') + ';');
outdi=outdi.replace(/\,\;/g, encodeURIComponent(',') + ';');
outdi=outdi.replace(/\;\;/g, encodeURIComponent(';') + ';');

outdi=outdi.replace(/\|\,/g, encodeURIComponent('|') + ',');
outdi=outdi.replace(/\,\,/g, encodeURIComponent(',') + ',');
outdi=outdi.replace(/\;\,/g, encodeURIComponent(';') + ',');

outdi=outdi.replace(/\|\|/g, encodeURIComponent('|') + '|');
outdi=outdi.replace(/\,\|/g, encodeURIComponent(',') + '|');
outdi=outdi.replace(/\;\|/g, encodeURIComponent(';') + '|');

return outdi;
}

“; ?>

… in that regard, and “double decode” (with a bit of nuance in between) on the other side, to try to account for this. We’ll see!

But the day started thinking about Emojis. What would happen in our PDF default output with Emoji content being introduced by the user within input textarea elements, as they go to Draw their Hierarchical Organization chart? Well, not so good. But, thanks to Graphviz not supporting UTF-8 encoding webpage, we got put onto the idea that an alternative, and now the default, format of output could be SVG … and trying it worked … thanks!

And then there’s Sharing (and collaboration) thoughts, again?! Email and SMS hashtagged URLs, again?! Well, here, we modelled ideas from the sharing ideas of the PDF to Images and Microsoft Office on AlmaLinux Tutorial thread of blog postings, ending up with …

<?php echo ”

function emailit(inais) {
event.stopPropagation();
var em=null;
em=prompt('Please enter email address to send output ' + document.getElementById('fmt').value + ' URL link to.', '');
if (em == null) { em=''; }
if (em.indexOf('@') != -1) {
document.getElementById('ititle').value=document.getElementById('ititle').value.replace(/\+/g,'-').replace(/\=/g,'-').replace(/\ /g,'-');
document.getElementById('none').value=various(document.getElementById('one').value.replace(/\+/g,String.fromCharCode(9)));
document.getElementById('ntwo').value=various(document.getElementById('two').value.replace(/\+/g,String.fromCharCode(9)));
document.getElementById('nthree').value=various(document.getElementById('three').value.replace(/\+/g,String.fromCharCode(9)));
em+='?subject=Hierarchy%20Organization&body=' + encodeURIComponent( (document.URL.split('?')[0].split('#')[0] + '?rand=' + Math.floor(Math.random() * 19897865) + '#title=' + encodeURIComponent(document.getElementById('ititle').value) + '#fmt=' + encodeURIComponent(document.getElementById('fmt').value) + '#one=' + encodeURIComponent(document.getElementById('none').value) + '#two=' + encodeURIComponent(document.getElementById('ntwo').value) + '#three=' + encodeURIComponent(document.getElementById('nthree').value)).replace('#fmt=svg#one=#','#fmt=pdf#one=#') );
document.getElementById('dimap').innerHTML=\"<a style=display:none; id=theaemail target=_blank href='mailto:\" + em + \"'>Email</a>\";
document.getElementById('theaemail').click();
}
return false;
}

function smsit(inais) {
event.stopPropagation();
var em=null;
em=prompt('Please enter SMS number to send output ' + document.getElementById('fmt').value + ' URL link to.', '');
if (em == null) { em=''; }
if (em.trim() != '') {
document.getElementById('ititle').value=document.getElementById('ititle').value.replace(/\+/g,'-').replace(/\=/g,'-').replace(/\ /g,'-');
document.getElementById('none').value=various(document.getElementById('one').value.replace(/\+/g,String.fromCharCode(9)));
document.getElementById('ntwo').value=various(document.getElementById('two').value.replace(/\+/g,String.fromCharCode(9)));
document.getElementById('nthree').value=various(document.getElementById('three').value.replace(/\+/g,String.fromCharCode(9)));
em+='&body=' + encodeURIComponent( (document.URL.split('?')[0].split('#')[0] + '?rand=' + Math.floor(Math.random() * 19897865) + '#title=' + encodeURIComponent(document.getElementById('ititle').value) + '#fmt=' + encodeURIComponent(document.getElementById('fmt').value) + '#one=' + encodeURIComponent(document.getElementById('none').value) + '#two=' + encodeURIComponent(document.getElementById('ntwo').value) + '#three=' + encodeURIComponent(document.getElementById('nthree').value)).replace('#fmt=svg#one=#','#fmt=pdf#one=#') );
document.getElementById('dimap').innerHTML=\"<a style=display:none; id=theasms target=_blank href='sms:\" + em + \"'>SMS</a>\";
if (!document.getElementById('theasms') && document.getElementById('psms')) {
document.getElementById('psms').click();
} else {
document.getElementById('theasms').click();
}
}
}
return false;
}

“; ?>

… within the changed hierarchy_organization.php Hierarchy Organization diagram “drawer”.

Stop Press

And then it occurred to us that there is also the GraphViz graph mode ( default Digraph versus Graph ), and it’s “edge” element background colour and shape and font size, as well as a resizing mechanism, that could be up for grabs, via user input in the tweaked hierarchy_organization.php Hierarchy Organization diagram “drawer”.


Previous relevant Python GraphViz via PHP on AlmaLinux Organization Hierarchy Tutorial is shown below.

Python GraphViz via PHP on AlmaLinux Organization Hierarchy Tutorial

Python GraphViz via PHP on AlmaLinux Organization Hierarchy Tutorial

Calling cab (6754 – 6756 + 4).

Huh?!

Calling the second cab off the rank.

Yes, now that we understand a bit more about file permission issues, after yesterday’s Python GraphViz via PHP on AlmaLinux Permissions Tutorial, having PHP hosting Python with GraphViz calls, let’s turn our attention to the issue of “lots of data”, today, with our …


Organization Hierarchyist

… what do you say?! It’s a bit embarrassingly easy a remedy because we are writing in PHP, to just …

  • make any $_GET[] (web browser address bar arguments) references become $_POST[] equivalents … and any …
  • HTML form method=GET should become HTML form method=POST

Calling log (6754 – 6756 + 4 – 1) … to fall off.

Python code wise, our hierarchy_organization.py inspiration came from https://graphviz.readthedocs.io/en/stable/examples.html thanks.

Then we worked on PHP hierarchy_organization.php to be as close to being a buddy with a Python as, well, Monty?!


Previous relevant Python GraphViz via PHP on AlmaLinux Permissions Tutorial is shown below.

Python GraphViz via PHP on AlmaLinux Permissions Tutorial

Python GraphViz via PHP on AlmaLinux Permissions Tutorial

Did you guess, regarding the Python Graphviz via PHP work of yesterday’s Python GraphViz via PHP on AlmaLinux Tutorial, we were experiencing File Permission issues?

Well, yesterday, regarding the Python Graphviz via PHP work of yesterday’s Python GraphViz via PHP on AlmaLinux Tutorial, we were experiencing File Permission issues.

We thought we’d move the Python, via PHP processing, totally into the purview of the web server administration owner, by involving a …

  1. Korn Shell *.ksh … supervised by …
  2. crontab … pointing to …

    ksh -c 'for i in `find /home/rjmprogr/public_html/ -name "subgraph_example_*.ksh"`; do ksh -c `echo $i`; done'

    … very regularly

… arrangement, but even that failed, in a first incarnation using /tmp/ placement of the Korn Shell file. “Permission denied”, again. Running a Korn Shell from /tmp/ on AlmaLinux must be a no-no, so moved the place to be AlmaLinux web server’s Document Root place, and then things started happening, in the changed subgraph_example.php Python GraphViz using web application.


Previous relevant Python GraphViz via PHP on AlmaLinux Tutorial is shown below.

Python GraphViz via PHP on AlmaLinux Tutorial

Python GraphViz via PHP on AlmaLinux Tutorial

Do you remember reading, with PHP Image GraphViz via Pear on AlmaLinux Primer Tutorial below, our outlining three known GraphViz guises …

  • the recent, alas now deprecated, Google Charts Image Charts GraphViz option means of drawing SVG graphics within an HTML image … we’ve known about before about yesterday
  • today’s interest, that being PHP Image GraphViz via Pear on AlmaLinux install, via the AlmaLinux cPanel “Module Installers” Pear installer page, means by which we can use GraphViz calls in PHP code … and, for the future …
  • GraphViz installs for Python via pip

…? Well, today, we start down the road of …

  1. installing Python GraphViz package via …

    pip install graphviz

    … then …
  2. getting great help from https://graphviz.readthedocs.io/en/stable/, thanks, as the Python code basis we call subgraph_example.py … and …
  3. used and remoulded by our overseeing PHP subgraph_example.php Python GraphViz using web application

… we need to work on more after this first draft start to another road of our GraphViz journey last talked about at PHP Image GraphViz via Pear on AlmaLinux Focus Tutorial.


Previous relevant PHP Image GraphViz via Pear on AlmaLinux Focus Tutorial is shown below.

PHP Image GraphViz via Pear on AlmaLinux Focus Tutorial

PHP Image GraphViz via Pear on AlmaLinux Focus Tutorial

It reared it’s ugly head with the Animated GIF Creator here at RJM Programming (helped out by the great Jeroen van Wissen open source work, thanks). And with yesterday’s PHP Image GraphViz via Pear on AlmaLinux Recallable Tutorial it reared up again.

On non-mobile focus goes to the address bar on many web browsers unless there is a (nominally) visible input type=text or textarea next in line.

It’s hard to keep in mind except as it “rears up” in an annoying way, but if we’d thought back, yes, we allow in the linked list feel of revealing textboxes (or textareas) only as they are needed scenarios we allow for two blank ones to be (nominally) visible at any given time … not one … but two, presumably because there is a tiny Javascript DOM “refresh period” not short enough to stop the web browser “desperation measure” (of placing focus in the address bar) happening?!

Why the non-mobile mention? Well, on mobile, a user programming [HTMLelement].focus(); call has no affect, as the touch operating systems need control of focus arrangements, presumably?!

How can we forget? My liege, please accept my humble apologies?!

Why the (nominally) mentions? Well, we have, successfully, in the past, just arranged a (statically HTML placed) textbox (ie. input type=text) that sits outside the viewing screen but not (nominally) invisible (eg. style=’position:absolute;top:-200px;left:-200px;’) can help you avoid the focus going up to the web browser address bar.

So that’s that, and other progress today is to allow the emailing or SMS of a recalled URL Step arrangement via more options on that “Recall Dropdown” we started allowing for yesterday.

Please see this happening in our changed PHP coded My Recipe Steps web application you can also try below.


Previous relevant PHP Image GraphViz via Pear on AlmaLinux Recallable Tutorial is shown below.

PHP Image GraphViz via Pear on AlmaLinux Recallable Tutorial

PHP Image GraphViz via Pear on AlmaLinux Recallable Tutorial

After yesterday’s PHP Image GraphViz via Pear on AlmaLinux Sharing Tutorial some readers may be curious to understand the distinction between …

  • email and SMS sharing … and …
  • inhouse intersessional sharing via window.localStorage (ie. like HTTP Cookies)

… over yesterday’s and today’s blog posting timings. Simply put, for us, we …

  • take a deep breath before starting intersessional window.localStorage work, as it is not to be sneezed at, as any sort of doddle (at least for us) … as well as …
  • since last intersessional window.localStorage work we’ve started using email and SMS sharing hashtagging arrangements that fit in, like a glove, with this intersessional window.localStorage work … so that …
  • even though, we write the code here in PHP, all this functionality is client based … which we like because …
  • get the idea correct, with careful forward planning and implementation, we’ll be able to apply similar such thinking into the future, whether that be for clientside only web applications and/or ones that call on serverside code (like PHP) … and …
  • if we can keep things just clientside more readers can be involved, we figure

If you’re wondering about the worry of any of this, it is to do with large title and/or URL link and/or ingredient type data whose data length could be huge, where most of our concern lies, and …

  • hashtagging (where data limits are so much longer) can help it remain as a clientside only solution environment (rather than relying on some form method=POST to a serverside (eg. PHP) receiver solution) …
  • window.localStorage is a step up from the HTTP Cookie style of intersessional (personal) storage as far as amounts that can be stored is concerned

What are we aiming for here, then, with our improvements?

  • extend the existant email and SMS functionality …
    <?php echo ”

    function emailit(insg) {
    var em='', ccok='';
    if (estitle == '') {
    if (cookb.split(' Or hash delimited appended string can ')[0] != '') {
    cookb=cookb.replace(cookb.split(' Or hash delimited appended string can ')[0], '');
    }
    }
    if (('' + insg).replace(/^null/g,'').replace(/^undefined/g,'').trim() != '') {
    em='' + insg;
    } else {

    em=prompt('Please enter Email address to share with. ' + cookb, '');
    }
    if (em != null) {
    if (em.trim() == '' && estitle != '') {
    em='#' + estitle;
    } else if (em == estitle && estitle != '') {
    em='#' + estitle;
    }
    }
    if (em.indexOf('#') != -1) {
    cook=em.substring(eval(1 + eval('' + em.indexOf('#'))));
    em=em.split('#')[0].trim();
    if (cook.trim() != '') {
    deleteAVal('steps_' + cook.replace(/\ /g,'-'),'');
    setAVal('steps_' + cook.replace(/\ /g,'-'), \"" . $hashurl . $hashurld . "\" + anyhashes);
    }
    }

    if (em == null) { em=''; }
    if (em.trim() != '') {
    if (em.trim().indexOf('@') != -1) {
    em+='?subject=Steps&body=' + encodeURIComponent(\"" . $hashurl . $hashurld . "\" + anyhashes);
    document.getElementById('dimap').innerHTML=\"<a style=display:none; id=theaemail target=_blank href='mailto:\" + em + \"'>Email</a>\";
    document.getElementById('theaemail').click();
    } else if (em.trim().replace(/0/g,'').replace(/1/g,'').replace(/2/g,'').replace(/3/g,'').replace(/4/g,'').replace(/5/g,'').replace(/6/g,'').replace(/7/g,'').replace(/8/g,'').replace(/9/g,'') == '') {
    em+='&body=' + encodeURIComponent(\"" . $hashurl . $hashurld . "\" + anyhashes);
    document.getElementById('dimap').innerHTML=\"<a style=display:none; id=theasms target=_blank href='sms:\" + em + \"'>SMS</a>\";
    document.getElementById('theasms').click();
    }
    }
    return false;

    }

    function smsit(insg) {
    var em='', cook='';
    if (estitle == '') {
    if (cookb.split(' Or hash delimited appended string can ')[0] != '') {
    cookb=cookb.replace(cookb.split(' Or hash delimited appended string can ')[0], '');
    }
    }
    if (('' + insg).replace(/^null/g,'').replace(/^undefined/g,'').trim() != '') {
    em='' + insg;
    } else {

    em=prompt('Please enter SMS number to share with. ' + cookb, '');
    }
    if (em != null) {
    if (em.trim() == '' && estitle != '') {
    em='#' + estitle;
    } else if (em == estitle && estitle != '') {
    em='#' + estitle;
    }
    }
    if (em.indexOf('#') != -1) {
    cook=em.substring(eval(1 + eval('' + em.indexOf('#'))));
    em=em.split('#')[0].trim();
    if (cook.trim() != '') {
    deleteAVal('steps_' + cook.replace(/\ /g,'-'),'');
    setAVal('steps_' + cook.replace(/\ /g,'-'), \"" . $hashurl . $hashurld . "\" + anyhashes);
    }
    }

    if (em == null) { em=''; }
    if (em.trim() != '') {
    if (em.trim().replace(/0/g,'').replace(/1/g,'').replace(/2/g,'').replace(/3/g,'').replace(/4/g,'').replace(/5/g,'').replace(/6/g,'').replace(/7/g,'').replace(/8/g,'').replace(/9/g,'') == '') {
    em+='&body=' + encodeURIComponent(\"" . $hashurl . $hashurld . "\" + anyhashes);
    document.getElementById('dimap').innerHTML=\"<a style=display:none; id=theasms target=_blank href='sms:\" + em + \"'>SMS</a>\";
    document.getElementById('theasms').click();
    } else if (em.trim().indexOf('@') != -1) {
    em+='?subject=Steps&body=' + encodeURIComponent(\"" . $hashurl . $hashurld . "\" + anyhashes);
    document.getElementById('dimap').innerHTML=\"<a style=display:none; id=theaemail target=_blank href='mailto:\" + em + \"'>Email</a>\";
    document.getElementById('theaemail').click();
    }
    }
    return false;
    }

    “; ?>
    … to cater for additional personalized Title (of steps) and Content of steps (using the hashtagging email and SMS URL methods set up yesterday)
    <?php echo ”

    var estitle=\"" . $estitle . "\";
    var cookb=\"" . $cookblurb . "\";
    var lssel='';
    var woo=null;

    function deleteAVal(goodname, aparticularvalue) {
    if (window.localStorage && goodname.indexOf('steps_') == 0) {
    if (('' + localStorage.getItem(goodname)).replace(/^undefined/g,'').replace(/^null/g,'') != '') {
    if (aparticularvalue == '') {
    localStorage.removeItem(goodname);
    } else {
    if (aparticularvalue.replace('HTTP','http').toLowerCase() == ('' + localStorage.getItem(goodname)).toLowerCase()) {
    localStorage.removeItem(goodname);
    }
    }
    }
    }
    }

    function setAVal(cName, cVal) {
    if (cName.indexOf('steps_') == 0) {
    if (window.localStorage) {
    localStorage.setItem(cName, encodeURIComponent(cVal));
    cookieAVal('steps_', true);
    return ' ';
    }
    return '';
    }
    return '';
    }

    function gotothis(inu) {
    if (inu.trim() != '') {
    if (inu.indexOf('HTTP') == 0) {
    //alert('2:' + inu);
    if (inu.indexOf('#steps_') != -1) {
    //alert('22:' + inu.split('#')[eval(-1 + inu.split('#').length)]);
    deleteAVal(inu.split('#')[eval(-1 + inu.split('#').length)], encodeURIComponent(inu.replace('#' + inu.split('#')[eval(-1 + inu.split('#').length)], '').replace('HTTP','http')));
    //alert('222:' + inu.split('#')[eval(-1 + inu.split('#').length)]);
    cookieAVal('steps_', true);
    //alert('2222:' + inu.split('#')[eval(-1 + inu.split('#').length)]);
    }
    } else {
    woo=window.open(inu, '_blank', 'top=50,left=50,width=800,height=800');
    }
    }
    }

    function cookieAVal(cName, selize) {
    var key=null;
    if (selize && window.localStorage) {
    lssel=' ';
    for (var i=0; i<localStorage.length; i++) { // thanks to https://stackoverflow.com/questions/41271092/how-to-loop-through-localstorage-values
    key = localStorage.key(i);
    if (('' + key).indexOf(cName) == 0) {
    if (lssel.trim() == '') {
    lssel='<select id=sells onchange=gotothis(this.value);><option value=\"\">Recallable Steps below ...</option></select>';
    }
    lssel=lssel.replace('</select>', '<option value=\"' + decodeURIComponent(localStorage.getItem('' + key)) + '\">' + ('' + key).substring(eval('' + cName.length)).replace(/\_/g,' ').replace(/\-/g,' ') + '</option>' + '<option value=\"' + decodeURIComponent(localStorage.getItem('' + key).replace('http','HTTP')) + '#steps_' + ('' + key).substring(eval('' + cName.length)) + '\">Remove ' + ('' + key).substring(eval('' + cName.length)).replace(/\_/g,' ').replace(/\-/g,' ') + '</option>' + '</select>');
    }
    }
    if (lssel != '') {
    document.getElementById('ssel').innerHTML=lssel.trim();
    }
    }
    if (cName.indexOf('steps_') == 0) {
    if (window.localStorage) {
    if (decodeURIComponent(('' + localStorage.getItem(cName)).replace(/^undefined/g,'').replace(/^null/g,'')) != '') {
    return decodeURIComponent(localStorage.getItem(cName));
    }
    if (decodeURIComponent(('' + sessionStorage.getItem(cName)).replace(/^undefined/g,'').replace(/^null/g,'')) != '') {
    return decodeURIComponent(sessionStorage.getItem(cName));
    }
    }
    return '';
    }
    return '';
    }

    “; ?>
  • add a new …

    <a id=pcookie title='Recall this' class=share onclick="return emailit(estitle);" style='display:none;text-decoration:none;cursor:pointer;'>🍪</a>

    … emoji link for intersessional window.localStorage work that calls the email functionality modified Javascript function …
  • allowing a window.localStorage.setItem([Title (of steps)], encodeURIComponent([Content of steps])) to add a personalized and recallable record be kept on the web browser of use … recallable via …
  • new dropdown populated with existant such records, as well as a dropdown option allowing the user to remove said records, too … which …
  • can navigate the user to this recallable Steps idea in a new webpage incarnation …
  • a dropdown arrangement which is intersessional as well as intrasessional by nature, and personalized to that user’s use of the web browser on that device in question

… in our changed PHP coded My Recipe Steps web application you can also try below.


Previous relevant PHP Image GraphViz via Pear on AlmaLinux Sharing Tutorial is shown below.

PHP Image GraphViz via Pear on AlmaLinux Sharing Tutorial

PHP Image GraphViz via Pear on AlmaLinux Sharing Tutorial

Adding to yesterday’s PHP Image GraphViz via Pear on AlmaLinux Primer Tutorial

  • on many mobile devices the horizontally spreading right cell arrangements has been improved by laying out these textarea elements vertically now …
  • hashtagged URL mailto: and/or sms: “a” links to email and/or SMS communication conduits, respectively …
    <?php echo ”

    var anyhashes='';
    var aone=1;
    var tdc=0;

    function checkforlh() {
    aone=1;
    if (('' + location.hash.indexOf('dtitle')) != -1) {
    if (('' + location.hash.indexOf('dtitle=')) != -1) {
    document.getElementById('therest').value=decodeURIComponent(('' + location.hash).split('dtitle=')[1].split('#')[0].split(encodeURIComponent('#'))[0]);
    document.getElementById('therest').name='dtitle';
    } else if (('' + location.hash.indexOf('dtitle' + encodeURIComponent('='))) != -1) {
    document.getElementById('therest').value=decodeURIComponent(('' + location.hash).split('dtitle' + encodeURIComponent('='))[1].split('#')[0].split(encodeURIComponent('#'))[0]);
    document.getElementById('therest').name='dtitle';
    }
    }
    var retv='';
    while (('' + location.hash.indexOf('step' + aone)) != -1) {
    if (('' + location.hash.indexOf('step' + aone + '=')) != -1) {
    if (aone <= 1) {
    document.getElementById('tdi' + aone).value=decodeURIComponent(('' + location.hash).split('step' + aone + '=')[1].split('#')[0].split(encodeURIComponent('#'))[0]);
    } else {
    document.getElementById('tdi' + aone).value=decodeURIComponent(('' + location.hash).split('step' + aone + '=')[1].split('#')[0].split(encodeURIComponent('#'))[0]);
    obl(document.getElementById('tdi' + aone), true); //document.getElementById('tdi' + aone).blur();
    if ( document.getElementById('tdi' + eval(1 + aone))) {
    document.getElementById('tdi' + eval(1 + aone)).focus();
    }
    }
    } else if (('' + location.hash.indexOf('step' + aone + encodeURIComponent('='))) != -1) {
    if (aone <= 1) {
    document.getElementById('tdi' + aone).value=decodeURIComponent(('' + location.hash).split('step' + aone + encodeURIComponent('='))[1].split('#')[0].split(encodeURIComponent('#'))[0]);
    } else {
    document.getElementById('tdi' + aone).value=decodeURIComponent(('' + location.hash).split('step' + aone + encodeURIComponent('='))[1].split('#')[0].split(encodeURIComponent('#'))[0]);
    obl(document.getElementById('tdi' + aone), true); //document.getElementById('tdi' + aone).blur();
    if ( document.getElementById('tdi' + eval(1 + aone))) {
    document.getElementById('tdi' + eval(1 + aone)).focus();
    }
    }
    }
    aone++;
    }
    if (aone > 1 || document.getElementById('therest').value != '') { anyhashes=('' + location.hash).replace(/\%23/g,'#'); setTimeout(function(){ if (confirm('Draw now (versus add more yourself)?') == true) { document.getElementById('mysub').click(); } }, 8000); }
    }

    “; ?>
    … help out with some new sharing functionalities

… so that “a procedure made up of steps” can now be shared and/or created collaboratively in our changed PHP coded My Recipe Steps web application.


Previous relevant PHP Image GraphViz via Pear on AlmaLinux Primer Tutorial is shown below.

PHP Image GraphViz via Pear on AlmaLinux Primer Tutorial

https://en.wikipedia.org/wiki/Graphviz

The term “GraphViz”

Graphviz (short for Graph Visualization Software) is a package of open-source tools initiated by AT&T Labs Research for drawing graphs (as in nodes and edges, not as in bar charts) specified in DOT language scripts having the file name extension “gv”. It also provides libraries for software applications to use the tools. Graphviz is free software licensed under the Eclipse Public License.

… we’ve learnt recently, means a lot of things, differently (nuanced) for a range of users, three that we’ve so far become aware of being …

  • the recent, alas now deprecated, Google Charts Image Charts GraphViz option means of drawing SVG graphics within an HTML image … we’ve known about before about yesterday
  • today’s interest, that being PHP Image GraphViz via Pear on AlmaLinux install, via the AlmaLinux cPanel “Module Installers” Pear installer page, means by which we can use GraphViz calls in PHP code … and, for the future …
  • GraphViz installs for Python via pip

… in amongst many others we’ve seen programmers using … totally cute, totally useful!

It seems with our PHP Image GraphViz via Pear on AlmaLinux as what looks like a very much “pared down” version of the last mode of use above, that we add constructed graph node or edge or cluster objects, and form them into SVG based HTML image elements. It’s look got me thinking “Steps”, then “Recipe Steps”, and back, quietly, to “Any Old Steps” as the day got more generic.

At first we got, as far as Recipes go (and here we thank Italian Wedding Soup for today’s inspiration), to …

  • cooking steps showing as Image GraphViz edge graphic components (having arrows connect ellipses containing text, a bit like Speech Bubbles) … and then trying to face the “real world” a user interested in recipes might want to see happen …
  • an Image GraphViz node graphic component whose wording could be a user supplied recipe Title along with a “URL” attribute link, optionally user supplied (via our HTML div SVG hosting ondblclick event allowing its contenteditable=true attribute and onblur event means by which these optional additional data items can enter the “mix”, if you’ll pardon the pun), probably pointing back to the original recipe information saucesource … and …
  • this title and/or “URL” and/or ingredient list (for example) can all be expressed as the “on hover” title attribute of the tailored user PHP webpage (yes, here we have PHP writing PHP) … and …
  • at least on Safari, given a recipe Title defined, we can arrange any browser context menu (ie. right click) over the HTML iframe hosted recipe content “Save Iframe As” option being able to download to a reasonably self explanatory download filename … and/or …
  • any web browser’s Add Bookmark functionality can be harnessed to help the user out in such a way that our PHP coded My Recipe Steps web application could end up being your one stop shop “Recipe Organizer” online?!

See what we mean below …


Previous relevant Google Chart Image Chart Angled Text Annotation Tutorial is shown below.

Google Chart Image Chart Angled Text Annotation Tutorial

Google Chart Image Chart Angled Text Annotation Tutorial

It’s Tuesday, in places around the world, looking back at yesterday’s Google Chart Image Chart Image Map Event Editing Tutorial. Can’t help but think we’ve forgotten something. Ah yes …

You talkin’ to me? You talkin’ to me? Meanwhile, back at the questions! Welcome back, Mr De Niro, sir. We hope your Tuesday is treating you well. (Rhetorical. Let it please be Rhetorical … oh dear God … it must be Rhetorical … it must be Rhetorical) We have news regarding “the dosh” (wink, wink) we were discussing the other day. You see …

Better to be king for a night than schmuck for a lifetime. Well, at least it’s not a question. … the thing is, silly us, it turns out that angled text issue was not a problem with [element].getBoundingClientRect() but how the PHP GD imagettftext text placement emanated from the bottom left of the text always, Mr De Niro sir.

Never rat on your friends and always keep your mouth shut. Really wish we could! Yes, Mr De Niro, sir, but, you see this means the rats are completely out of the picture, just leaving us with our money spinner. Right, Mr De Niro … sir.

There are three ways of doing things around here: the right way, the wrong way and the way that I do it. [Exeunt: Stage right] Well, that’s odd? Mr De Niro wasn’t interested in the quadrant nature to our problem solution …


var rectex=extents[eval(-1 + extents.length)].getBoundingClientRect();
if (document.URL.indexOf('debug=') != -1) {
document.body.innerHTML+='<div style="position:absolute;border:1px solid rgba(255,0,0,0.5);top:' + rectex.top + 'px;left:' + rectex.left + 'px;width:' + rectex.width + 'px;height:' + rectex.height + 'px;z-index:200;" title="position:absolute;border:1px solid rgba(255,0,0,0.5);top:' + rectex.top + 'px;left:' + rectex.left + 'px;width:' + rectex.width + 'px;height:' + rectex.height + 'px;z-index:200;"></div>';
}

var invs=inv.split('.'); // angled text origin depends on angle quadrant
var wasi=inv;
var theang=eval('' + fsx);
//alert('' + inv + ' ' + theang);

if (eval('' + invs.length) > 2 && inv.indexOf(',') != -1) {
//alert('' + rectex.width + 'x' + rectex.height + ' ' + ';' + rectex.top + 'vs' + rectex.bottom + ' ' + ';' + rectex.left + 'vs' + rectex.right + ' ' + inv + ' ' + extents[-1 + extents.length].outerHTML + ' ' + rectex.x + '+' + rectex.y);
if (7 == 8) {
inv=inv.replace(invs[0], '' + Math.floor(eval(rectex.left + rectex.width / 2)));
} else {
if (theang > (315 + 45) || theang < (45 + 45)) {
inv=inv.replace(invs[0], '' + Math.floor(eval(rectex.left * 1 + rectex.right * 0 + 0 * rectex.width / 2)));
} else if (theang >= (45 + 45) && theang <= (135 + 45)) {
inv=inv.replace(invs[0], '' + Math.floor(eval(rectex.left * 0 + rectex.right * 1 + 0 * rectex.width / 2)));
} else if (theang >= (225 + 45) && theang <= (315 + 45)) {
inv=inv.replace(invs[0], '' + Math.floor(eval(rectex.left * 1 + rectex.right * 0 + 0 * rectex.width / 2)));
} else {
inv=inv.replace(invs[0], '' + Math.floor(eval(rectex.left * 0 + rectex.right * 1 + 0 * rectex.width / 2)));
}
}


if (7 == 8) {
inv=inv.replace(',' + invs[1].split(',')[1], ',' + Math.floor(eval(rectex.top + rectex.height / 2)));
} else {
if (theang > (315 + 45) || theang < (45 + 45)) {
inv=inv.replace(',' + invs[1].split(',')[1], ',' + Math.floor(eval(rectex.top * 0 + rectex.bottom * 1 + 0 * rectex.height / 2)));
//alert('' + wasi + ' vs ' + inv + ' ' + invs.length);
} else if (theang >= (225 + 45) && theang <= (315 + 45)) {
inv=inv.replace(',' + invs[1].split(',')[1], ',' + Math.floor(eval(rectex.top * 1 + rectex.bottom * 0 + 0 * rectex.height / 2)));
} else if (theang >= (45 + 45) && theang < (135 + 45)) {
inv=inv.replace(',' + invs[1].split(',')[1], ',' + Math.floor(eval(rectex.top * 0 + rectex.bottom * 1 + 0 * rectex.height / 2)));
} else {
inv=inv.replace(',' + invs[1].split(',')[1], ',' + Math.floor(eval(rectex.top * 1 + rectex.bottom * 0 + 0 * rectex.height / 2)));
}
}


//alert('was=' + wasi + ' and now=' + inv);
} else if (eval('' + invs.length) == 2 && inv.indexOf(',') != -1) {
//alert('' + rectex.width + 'x' + rectex.height + ' ' + ';' + rectex.top + 'vs' + rectex.bottom + ' ' + ';' + rectex.left + 'vs' + rectex.right + ' ' + inv + ' ' + extents[-1 + extents.length].outerHTML + ' ' + rectex.x + '+' + rectex.y);
if (theang > (315 + 45) || theang < (45 + 45)) {
inv=inv.replace(invs[0], '' + Math.floor(eval(rectex.left * 1 + rectex.right * 0 + 0 * rectex.width / 2)));
} else if (theang >= (45 + 45) && theang <= (135 + 45)) {
inv=inv.replace(invs[0], '' + Math.floor(eval(rectex.left * 0 + rectex.right * 1 + 0 * rectex.width / 2)));
} else if (theang >= (225 + 45) && theang <= (315 + 45)) {
inv=inv.replace(invs[0], '' + Math.floor(eval(rectex.left * 1 + rectex.right * 0 + 0 * rectex.width / 2)));
} else {
inv=inv.replace(invs[0], '' + Math.floor(eval(rectex.left * 0 + rectex.right * 1 + 0 * rectex.width / 2)));
}
invs=inv.split(',');
if (theang > (315 + 45) || theang <= (45 + 45)) {
inv=inv.replace(',' + invs[1].split(',')[0].split('.')[0], ',' + Math.floor(eval(rectex.top * 0 + rectex.bottom * 1 + 0 * rectex.height / 2)));
//alert('' + wasi + ' vs ' + inv + ' ' + invs.length);
} else if (theang >= (225 + 45) && theang <= (315 + 45)) {
inv=inv.replace(',' + invs[1].split(',')[0].split('.')[0], ',' + Math.floor(eval(rectex.top * 1 + rectex.bottom * 0 + 0 * rectex.height / 2)));
} else if (theang >= (45 + 45) && theang < (135 + 45)) {
inv=inv.replace(',' + invs[1].split(',')[0].split('.')[0], ',' + Math.floor(eval(rectex.top * 0 + rectex.bottom * 1 + 0 * rectex.height / 2)));
} else {
inv=inv.replace(',' + invs[1].split(',')[0].split('.')[0], ',' + Math.floor(eval(rectex.top * 1 + rectex.bottom * 0 + 0 * rectex.height / 2)));
}
//alert('was=' + wasi + ' and now=' + inv);
}

… that temporary div element text border drawing, being the crucial way to find out what was happening, and showing us, at least on Google Chrome web browser, not to worry so much about [element].getBoundingClientRect() results for transformed HTML elements. And that is a huge relief in itself.

Also taking up a lot of today, we shored up Image Map Event Editing results bubbling through to an email or SMS recipient. The size of this data, and an analysis of …

  • client pre-emptive iframe … versus …
  • Ajax methodologies

… when it comes to complex and sizeable data such as “Javascript scripting” is, we should start swinging towards Ajax thinking, even pinching it off a client pre-emptive iframe onload event logic thought/start sometimes …


var myxhr=null, rawhtml='';
var zhr=null, zform=null;

function stateChanged() {
if (myxhr.readyState == 4) {
if (myxhr.status == 200) {
console.log('myxhr=' + myxhr);
rawhtml = myxhr.responseText.replace(/\\"/g, '"').replace(/\\'/g, "'");
if (document.getElementById('jdiv')) {
//alert('1:' + rawhtml);
//alert('21111 ' + rawhtml.split('<scr')[1]);
document.getElementById('jdiv').innerHTML=rawhtml.split('<scr')[0]; //xaconto.body.innerHTML;
//alert(31111);
if (document.getElementById('talkimg')) {
document.getElementById('talkimg').useMap='#mymap';
} else {
document.getElementById('myvenn').useMap='#mymap';
}
//alert(41111);
} else {
document.body.innerHTML+=rawhtml.split('<scr')[0]; //xaconto.body.innerHTML;
if (document.getElementById('talkimg')) {
document.getElementById('talkimg').useMap='#mymap';
} else {
document.getElementById('myvenn').useMap='#mymap';
}
}
if (rawhtml.indexOf('<scr') != -1) {

if (1 == 1) {
var tag = document.createElement('script');
var nextsep=rawhtml.split('<scr')[1].split('>')[0] + '>';
//var qw=prompt(rawhtml.split('<scr')[1].split(nextsep)[1].split('</scri')[0],rawhtml.split('<scr')[1].split(nextsep)[1].split('</scri')[0]);
//alert('2:' + rawhtml.split('<scr')[1].split(nextsep)[1].split('</scri')[0]);
tag.innerHTML = rawhtml.split('<scr')[1].split(nextsep)[1].split('</scri')[0];
var firstScriptTag = document.getElementsByTagName('script')[eval(-1 + document.getElementsByTagName('script').length)];
firstScriptTag.insertAdjacentElement("afterend", tag);
}

}
}
}
}

function prehrefcheck(inso) {
if (obsuffix != '') {
zhr = new XMLHttpRequest();
zform = new FormData();
if (decodeURIComponent(obsuffix.replace('&thescript=','')).indexOf('<scr') == -1) {
zform.append('scrstuff', ('<scr' + 'ipt type="text/javascript"> ' + decodeURIComponent(obsuffix.replace('&thescript=','')) + ' </scr' + 'ipt>').replace(/\ \ \ /g, String.fromCharCode(9)).replace(/\+\=/g, ' += '));
} else {
zform.append('scrstuff', ('<scr' + decodeURIComponent(obsuffix.replace('&thescript=','')).split('<scr')[1]).replace(/\ \ \ /g, String.fromCharCode(9)).replace(/\+\=/g, ' += '));
}
if (jufr == '') {
jufr='_' + Math.floor(Math.random() * 19878675);
}
zform.append('ufr', jufr);
zhr.responseType='Document';
zhr.open('post', '//www.rjmprogramming.com.au/ITblog/' + Math.min(550,window.innerWidth) + '/' + Math.min(350,window.innerHeight) + '/?cht=' + ctype, true);
zhr.send(zform);
}
}

function sofarpj(iois) {
var aname='', partsare=[], ipis=0, areabits='', repfrom='', repto='', iv=0, variety=String.fromCharCode(10) + ' var variety=[]; ' + String.fromCharCode(10);
while (thescript.indexOf(' var variety' + ('' + iv).replace(/^0$/g, '') + '=') != -1) {
repfrom='[' + thescript.split(' var variety' + ('' + iv).replace(/^0$/g, '') + '=[')[1].split('];')[0] + '];';
iv++;
}
if (iv > 0) { variety=String.fromCharCode(10) + ' var variety' + iv + '=[]; ' + String.fromCharCode(10); }
if (iois.src != '') {
var aconto = (iois.contentWindow || iois.contentDocument);
if (aconto != null) {
if (aconto.document) { aconto = aconto.document; }
if (aconto.body.innerHTML.indexOf('<scr') != -1 || document.URL.indexOf('ufr=') != -1) {
if (document.URL.indexOf('ufr=') != -1) {
if (!document.getElementById('jdiv')) {
document.body.innerHTML+='<div id=jdiv></div>';
}
//thescript='';
myxhr = new XMLHttpRequest();
myxhr.open('GET', '//www.rjmprogramming.com.au/presentation' + (location.search.split('ufr=')[1] ? decodeURIComponent(location.search.split('ufr=')[1].split('&')[0]) : '') + '.html', true);
myxhr.responseType = "text";
myxhr.onreadystatechange=stateChanged;
myxhr.send(null);
} else if (aconto.body.innerHTML.indexOf('<scr') != -1) {

thescript='<scr' + aconto.body.innerHTML.split('<scr')[1];
var tag = document.createElement('script');
var nextsep=thescript.split('<scr')[1].split('>')[0] + '>';
tag.innerHTML = thescript.split('<scr')[1].split(nextsep)[1].split('</scri')[0];
var firstScriptTag = document.getElementsByTagName('script')[eval(-1 + document.getElementsByTagName('script').length)];
firstScriptTag.insertAdjacentElement("afterend", tag);
}
}
pjsbih=aconto.body.innerHTML.split('<scr')[0];
if (lastpjsbih != '' && pjsbih != lastpjsbih.replace(/\ $/g,'')) {
//alert('Found new Image Map data of ' + pjsbih);
// {"chartshape":[{"name":"axis0_0","type":"RECT","coords":[21,336,28,344]},{"name":"axis0_1","type":"RECT","coords":[65,336,77,344]},{"name":"axis0_2","type":"RECT","coords":[111,336,124,344]},{"name":"axis0_3","type":"RECT","coords":[158,336,170,344]},{"name":"axis0_4","type":"RECT","coords":[204,336,217,344]},{"name":"axis0_5","type":"RECT","coords":[251,336,263,344]},{"name":"axis0_6","type":"RECT","coords":[297,336,310,344]},{"name":"axis0_7","type":"RECT","coords":[344,336,356,344]},{"name":"axis0_8","type":"RECT","coords":[390,336,403,344]},{"name":"axis0_9","type":"RECT","coords":[437,336,449,344]},{"name":"axis0_10","type":"RECT","coords":[480,336,499,344]},{"name":"axis1_0","type":"RECT","coords":[14,326,20,334]},{"name":"axis1_1","type":"RECT","coords":[8,297,20,305]},{"name":"axis1_2","type":"RECT","coords":[8,267,20,275]},{"name":"axis1_3","type":"RECT","coords":[8,237,20,245]},{"name":"axis1_4","type":"RECT","coords":[8,208,20,216]},{"name":"axis1_5","type":"RECT","coords":[8,178,20,186]},{"name":"axis1_6","type":"RECT","coords":[8,148,20,156]},{"name":"axis1_7","type":"RECT","coords":[8,119,20,127]},{"name":"axis1_8","type":"RECT","coords":[8,89,20,97]},{"name":"axis1_9","type":"RECT","coords":[8,59,20,67]},{"name":"axis1_10","type":"RECT","coords":[2,29,20,37]},{"name":"legend0","type":"RECT","coords":[500,167,512,179]},{"name":"legend1","type":"RECT","coords":[500,185,512,197]},{"name":"circle0","type":"CIRCLE","coords":[80,39,4]},{"name":"circle1","type":"CIRCLE","coords":[429,152,1]},{"name":"circle2","type":"CIRCLE","coords":[373,250,3]},{"name":"circle3","type":"CIRCLE","coords":[215,230,4]},{"name":"circle4","type":"CIRCLE","coords":[131,164,2]},{"name":"circle5","type":"CIRCLE","coords":[471,96,5]},{"name":"circle6","type":"CIRCLE","coords":[341,158,3]},{"name":"circle7","type":"CIRCLE","coords":[355,111,5]},{"name":"circle8","type":"CIRCLE","coords":[183,277,3]},{"name":"circle9","type":"CIRCLE","coords":[66,105,3]}]}
if (pjsbih.replace(/\[\]/g, '').indexOf('[') != -1) {
partsare=pjsbih.split('","coords":[');
for (ipis=1; ipis<partsare.length; ipis++) {
if (partsare[eval(-1 + ipis)].split('"')[eval(-1 + partsare[eval(-1 + ipis)].split('"').length)] == 'RECT') {
aname=partsare[eval(-1 + ipis)].split('"name":"')[eval(-1 + partsare[eval(-1 + ipis)].split('"name":"').length)].split('"')[0];
if (variety.indexOf(aname.split('_')[0].split('0')[0].split('1')[0].split('2')[0].split('3')[0].split('4')[0].split('5')[0].split('6')[0].split('7')[0].split('8')[0].split('9')[0] + '/rect') == -1) {
if (variety.indexOf('[]') != -1) {
variety=variety.replace("[]", "['" + aname.split('_')[0].split('0')[0].split('1')[0].split('2')[0].split('3')[0].split('4')[0].split('5')[0].split('6')[0].split('7')[0].split('8')[0].split('9')[0] + '/rect' + "']");
} else {
variety=variety.replace("]", ",'" + aname.split('_')[0].split('0')[0].split('1')[0].split('2')[0].split('3')[0].split('4')[0].split('5')[0].split('6')[0].split('7')[0].split('8')[0].split('9')[0] + '/rect' + "']");
}
repto='[' + variety.split('[')[1].split('];')[0] + '];';
}
areabits+='<area onmousedown=defclick(event); ondblclick=defclick(event); oncontextmenu=defclick(event); ontouchend=defclick(event); ontouchstart=defclick(event); onmouseout=defclick(event); onmousemove=defclick(event); ontouchdown=defclick(event); onmouseover=defclick(event); shape="rect" coords="' + partsare[ipis].split(']')[0] + '" id="' + aname + '" name="' + aname + '" alt="' + aname + '" onclick="' + "youralert(this,'This feature name is " + aname + "'" + ');" nohref>';
} else if (partsare[eval(-1 + ipis)].split('"')[eval(-1 + partsare[eval(-1 + ipis)].split('"').length)] == 'CIRCLE') {
aname=partsare[eval(-1 + ipis)].split('"name":"')[eval(-1 + partsare[eval(-1 + ipis)].split('"name":"').length)].split('"')[0];
if (variety.indexOf(aname.split('_')[0].split('0')[0].split('1')[0].split('2')[0].split('3')[0].split('4')[0].split('5')[0].split('6')[0].split('7')[0].split('8')[0].split('9')[0] + '/circle') == -1) {
if (variety.indexOf('[]') != -1) {
variety=variety.replace("[]", "['" + aname.split('_')[0].split('0')[0].split('1')[0].split('2')[0].split('3')[0].split('4')[0].split('5')[0].split('6')[0].split('7')[0].split('8')[0].split('9')[0] + '/circle' + "']");
} else {
variety=variety.replace("]", ",'" + aname.split('_')[0].split('0')[0].split('1')[0].split('2')[0].split('3')[0].split('4')[0].split('5')[0].split('6')[0].split('7')[0].split('8')[0].split('9')[0] + '/circle' + "']");
}
repto='[' + variety.split('[')[1].split('];')[0] + '];';
}
areabits+='<area onmousedown=defclick(event); ondblclick=defclick(event); oncontextmenu=defclick(event); ontouchend=defclick(event); ontouchstart=defclick(event); onmouseout=defclick(event); onmousemove=defclick(event); ontouchdown=defclick(event); onmouseover=defclick(event); shape="circle" coords="' + partsare[ipis].split(']')[0] + '" id="' + aname + '" name="' + aname + '" alt="' + aname + '" onclick="' + "youralert(this,'This feature name is " + aname + "'" + ');" nohref>';
} else if (partsare[eval(-1 + ipis)].split('"')[eval(-1 + partsare[eval(-1 + ipis)].split('"').length)] == 'POLY') {
aname=partsare[eval(-1 + ipis)].split('"name":"')[eval(-1 + partsare[eval(-1 + ipis)].split('"name":"').length)].split('"')[0];
if (variety.indexOf(aname.split('_')[0].split('0')[0].split('1')[0].split('2')[0].split('3')[0].split('4')[0].split('5')[0].split('6')[0].split('7')[0].split('8')[0].split('9')[0] + '/poly') == -1) {
if (variety.indexOf('[]') != -1) {
variety=variety.replace("[]", "['" + aname.split('_')[0].split('0')[0].split('1')[0].split('2')[0].split('3')[0].split('4')[0].split('5')[0].split('6')[0].split('7')[0].split('8')[0].split('9')[0] + '/poly' + "']");
} else {
variety=variety.replace("]", ",'" + aname.split('_')[0].split('0')[0].split('1')[0].split('2')[0].split('3')[0].split('4')[0].split('5')[0].split('6')[0].split('7')[0].split('8')[0].split('9')[0] + '/poly' + "']");
}
repto='[' + variety.split('[')[1].split('];')[0] + '];';
}
areabits+='<area onmousedown=defclick(event); ondblclick=defclick(event); oncontextmenu=defclick(event); ontouchend=defclick(event); ontouchstart=defclick(event); onmouseout=defclick(event); onmousemove=defclick(event); ontouchdown=defclick(event); onmouseover=defclick(event); shape="poly" coords="' + partsare[ipis].split(']')[0] + '" id="' + aname + '" name="' + aname + '" alt="' + aname + '" onclick="' + "youralert(this,'This feature name is " + aname + "'" + ');" nohref>';
}
}
document.getElementById('mymap').innerHTML=areabits + '<area' + atend.split('<area')[1].split('>')[0] + '>'; //"<area onclick=defclick(event); shape='default' nohref>";
if (repto.replace('[];','') != '' && repfrom != '') { thescript=thescript.replace(repfrom, repto); } else if (thescript.indexOf('[' + variety.split('[')[1]) == -1) { thescript=thescript.replace('>', '>' + variety); }
origmap=document.getElementById('mymap').outerHTML + thescript;
}
} else if (lastpjsbih != '') {
//alert('Found the same ' + pjsbih);
if (pjsbih.replace(/\[\]/g, '').indexOf('[') != -1) {
partsare=pjsbih.split('","coords":[');
for (ipis=1; ipis<partsare.length; ipis++) {
if (partsare[eval(-1 + ipis)].split('"')[eval(-1 + partsare[eval(-1 + ipis)].split('"').length)] == 'RECT') {
aname=partsare[eval(-1 + ipis)].split('"name":"')[eval(-1 + partsare[eval(-1 + ipis)].split('"name":"').length)].split('"')[0];
if (variety.indexOf(aname.split('_')[0].split('0')[0].split('1')[0].split('2')[0].split('3')[0].split('4')[0].split('5')[0].split('6')[0].split('7')[0].split('8')[0].split('9')[0] + '/rect') == -1) {
if (variety.indexOf('[]') != -1) {
variety=variety.replace("[]", "['" + aname.split('_')[0].split('0')[0].split('1')[0].split('2')[0].split('3')[0].split('4')[0].split('5')[0].split('6')[0].split('7')[0].split('8')[0].split('9')[0] + '/rect' + "']");
} else {
variety=variety.replace("]", ",'" + aname.split('_')[0].split('0')[0].split('1')[0].split('2')[0].split('3')[0].split('4')[0].split('5')[0].split('6')[0].split('7')[0].split('8')[0].split('9')[0] + '/rect' + "']");
}
repto='[' + variety.split('[')[1].split('];')[0] + '];';
}
areabits+='<area onmousedown=defclick(event); ondblclick=defclick(event); oncontextmenu=defclick(event); ontouchend=defclick(event); ontouchstart=defclick(event); onmouseout=defclick(event); onmousemove=defclick(event); ontouchdown=defclick(event); onmouseover=defclick(event); shape="rect" coords="' + partsare[ipis].split(']')[0] + '" id="' + aname + '" name="' + aname + '" alt="' + aname + '" onclick="' + "youralert(this,'This feature name is " + aname + "'" + ');" nohref>';
} else if (partsare[eval(-1 + ipis)].split('"')[eval(-1 + partsare[eval(-1 + ipis)].split('"').length)] == 'CIRCLE') {
aname=partsare[eval(-1 + ipis)].split('"name":"')[eval(-1 + partsare[eval(-1 + ipis)].split('"name":"').length)].split('"')[0];
if (variety.indexOf(aname.split('_')[0].split('0')[0].split('1')[0].split('2')[0].split('3')[0].split('4')[0].split('5')[0].split('6')[0].split('7')[0].split('8')[0].split('9')[0] + '/circle') == -1) {
if (variety.indexOf('[]') != -1) {
variety=variety.replace("[]", "['" + aname.split('_')[0].split('0')[0].split('1')[0].split('2')[0].split('3')[0].split('4')[0].split('5')[0].split('6')[0].split('7')[0].split('8')[0].split('9')[0] + '/circle' + "']");
} else {
variety=variety.replace("]", ",'" + aname.split('_')[0].split('0')[0].split('1')[0].split('2')[0].split('3')[0].split('4')[0].split('5')[0].split('6')[0].split('7')[0].split('8')[0].split('9')[0] + '/circle' + "']");
}
repto='[' + variety.split('[')[1].split('];')[0] + '];';
}
areabits+='<area onmousedown=defclick(event); ondblclick=defclick(event); oncontextmenu=defclick(event); ontouchend=defclick(event); ontouchstart=defclick(event); onmouseout=defclick(event); onmousemove=defclick(event); ontouchdown=defclick(event); onmouseover=defclick(event); shape="circle" coords="' + partsare[ipis].split(']')[0] + '" id="' + aname + '" name="' + aname + '" alt="' + aname + '" onclick="' + "youralert(this,'This feature name is " + aname + "'" + ');" nohref>';
} else if (partsare[eval(-1 + ipis)].split('"')[eval(-1 + partsare[eval(-1 + ipis)].split('"').length)] == 'POLY') {
aname=partsare[eval(-1 + ipis)].split('"name":"')[eval(-1 + partsare[eval(-1 + ipis)].split('"name":"').length)].split('"')[0];
if (variety.indexOf(aname.split('_')[0].split('0')[0].split('1')[0].split('2')[0].split('3')[0].split('4')[0].split('5')[0].split('6')[0].split('7')[0].split('8')[0].split('9')[0] + '/poly') == -1) {
if (variety.indexOf('[]') != -1) {
variety=variety.replace("[]", "['" + aname.split('_')[0].split('0')[0].split('1')[0].split('2')[0].split('3')[0].split('4')[0].split('5')[0].split('6')[0].split('7')[0].split('8')[0].split('9')[0] + '/poly' + "']");
} else {
variety=variety.replace("]", ",'" + aname.split('_')[0].split('0')[0].split('1')[0].split('2')[0].split('3')[0].split('4')[0].split('5')[0].split('6')[0].split('7')[0].split('8')[0].split('9')[0] + '/poly' + "']");
}
repto='[' + variety.split('[')[1].split('];')[0] + '];';
}
areabits+='<area onmousedown=defclick(event); ondblclick=defclick(event); oncontextmenu=defclick(event); ontouchend=defclick(event); ontouchstart=defclick(event); onmouseout=defclick(event); onmousemove=defclick(event); ontouchdown=defclick(event); onmouseover=defclick(event); shape="poly" coords="' + partsare[ipis].split(']')[0] + '" id="' + aname + '" name="' + aname + '" alt="' + aname + '" onclick="' + "youralert(this,'This feature name is " + aname + "'" + ');" nohref>';
}
}
document.getElementById('mymap').innerHTML=areabits + '<area' + atend.split('<area')[1].split('>')[0] + '>'; //"<area onclick=defclick(event); shape='default' nohref>";
if (repto.replace('[];','') != '' && repfrom != '') { thescript=thescript.replace(repfrom, repto); } else if (thescript.indexOf('[' + variety.split('[')[1]) == -1) { thescript=thescript.replace('>', '>' + variety); }
origmap=document.getElementById('mymap').outerHTML + thescript;
}
}
lastpjsbih=pjsbih;
}
}
}


cimg=new Image;

cimg.onload = function(){
var honebit="<h2><span onclick=\"location.href=document.URL.split('?')[0].split('#')[0];\" title=Reset style=cursor:pointer;>Interfacing</span> to <a target=_blank href='https://developers.google.com/chart/interactive/docs/index' title='Google Chart Tools provide a perfect way to visualize data on your website. From simple line charts to complex hierarchical tree maps, the chart galley provides a large number of well-designed chart types. Populating your data is easy using the provided client- and server-side tools.'>Google Charts</a> <a target=_blank title='Google Charts Image Chart' href='https://developers.google.com/chart/image/docs/gallery/chart_gall'>Image Chart</a></h2><h4 id=myh3>RJM Programming - November, 2023</h4>";
var hthreebit="";
document.body.style.backgroundColor='transparent';
document.body.innerHTML=agscript.replace("'';", "'" + cht.replace('_','') + "';").replace('<canvas ','<canvas width=' + cimg.width + ' height=' + cimg.height + ' ') + "<table><tr><td><img style='border-right:1px dotted pink;border-bottom:1px dotted pink;' ondblclick=\"window.open(document.URL.split('?')[0].split('#')[0],'_blank','top=50,left=50,width=600,height=600');\" title='Talk image that will update over time (double click for Google Chart Image Chart interfacing) ... " + ("" + (new Date())) + "' id=talkimg src='" + cimg.src + "?rand=" + Math.floor(Math.random() * 198786754) + "' usemap='#mymap'></img></td><td id=tdtr style=\"opacity:0.0;background-image:url(" + cimg.src.replace('presentation_', 'presentation__') + "),url(" + cimg.src + "?rand=0);background-position:0% 0%,50% 0%;background-size:50% 50%,50% 50%;background-repeat:no-repeat,no-repeat;\"></td></tr><tr><td id=tdbl>" + honebit + hthreebit + "</td><td><img style='border-right:1px dotted pink;border-bottom:1px dotted pink;' ondblclick=\"window.open(document.URL.split('?')[0].split('#')[0],'_blank','top=50,left=50,width=600,height=600');\" title='Talk first and last images that will update over time (double click for Google Chart Image Chart interfacing) ... " + ("" + (new Date())) + "' id=talkimgg src='" + cimg.src.replace('.png','.gif') + "?rand=" + Math.floor(Math.random() * 198786754) + "'></img></td></tr></table><div id=idiv></div><iframe onload=mapsofarpj(this); id=mappjs style=display:none; src=></iframe><div id=jdiv></div>";
document.body.style.cursor='progress';
if (cht.substring(0,1) == '_') {
//alert('//www.rjmprogramming.com.au/presentation' + cht + '.html_GETME');
if (1 == 1) {
myxhr = new XMLHttpRequest();
myxhr.open('GET', '//www.rjmprogramming.com.au/presentation' + cht + '.html', true);
myxhr.responseType = "text";
myxhr.onreadystatechange=stateChanged;
myxhr.send(null);
} else {

document.getElementById('mappjs').src='//www.rjmprogramming.com.au/presentation' + cht + '.html';
}
setTimeout(canvinit, 5000);
}
setTimeout(talkupdate, eightthousand);
};

cimg.src='//www.rjmprogramming.com.au/presentation' + cht + '.png';
return '';
}

… in the changed latest draft image_venn.html Google Chart Image Chart Venn Chart or Scatter Chart or GraphViz Chart or Pie Chart or Line Chart or Bar Chart or Candlestick/Box Chart or Google-O-Meter Chart or Radar Chart or Map Chart interfacing web application you can also try below.


Previous relevant Google Chart Image Chart Image Map Event Editing Tutorial is shown below.

Google Chart Image Chart Image Map Event Editing Tutorial

Google Chart Image Chart Image Map Event Editing Tutorial

If we are talking “layers” (of functionality) again, onto the progress that yesterday’s Google Chart Image Chart Image Map Events Tutorial represented, then , it is logical …

  • that if yesterday we presented some programmer defined image map event logic … then, today, we’d want to …
  • offer the user the chance to change that default programmer defined image map event logic, to that of their own design

… in the form of

  • user defined Javascript .. editable in a …
  • HTML textarea element

… and then the coding latching onto a document.createElement(‘script’) paradigm, to add Javascript clientside logic, on the fly.

There’s a first time we can remember aspect to how we present these possibilities to the user. We present it in …

  • amongst the inhouse annotation options … as a …
  • “reveal” pairing of HTML5 details/summary element combination look … the first time we can remember aspect to that being …
  • only initially displaying within the details element innerHTML is a summary element nesting a single “icon like” image (like the other “inhouse annotation” icon images) … but if clicked …
  • the details innerHTML has added to it a textarea element …

    function fillindetsed(odet) {
    if (odet.innerHTML.split('</summary>')[1] == '') {
    document.getElementById('tdleft').style.verticalAlign='top';
    var onls=thescript.split('<scr' + 'ipt type="text/javascript">');
    var onlstuff=onls[1].split('</sc' + 'ript>')[0];
    odet.innerHTML+='<scr' + 'ipt type="text/javascript">' + "<br><textarea onblur=tproc(this); id=tscript rows=100 cols=80 value=''>" + onlstuff + "</textarea><br></script>";
    //odet.innerHTML+='<scr' + 'ipt type="text/javascript">' + "<br><textarea onblur=tproc(this); id=tscript rows=100 cols=80 value=''>" + encodeURIComponent(onlstuff) + "</textarea><br></script>";
    //document.getElementById('tscript').value=decodeURIComponent(document.getElementById('tscript').innerHTML);
    }
    }

… from which document.createElement(‘script’) code onblur event logic emanates …


function tproc(ota) {
//alert(ota.value);
var tag = document.createElement('script');
if (1 == 1) {
obsuffix='&thescript=' + encodeURIComponent(ota.value);
if (document.getElementById('aemail')) {
hrefcheck(document.getElementById('aemail'));
}
//alert('<scr' + 'ipt type="text/javascript"> ' + String.fromCharCode(10) + ota.value + String.fromCharCode(10) + ' </scr' + 'ipt>');
tag.innerHTML = ' <scr'.substring(0,1) + 'ipt type="text/javascript"> '.slice(-1) + String.fromCharCode(10) + ota.value + String.fromCharCode(10) + ' </scr'.substring(0,1) + 'ipt> '.slice(-1);
document.getElementById('dmap').innerHTML=document.getElementById('mymap').outerHTML + ' <scr' + 'ipt type="text/javascript"> ' + String.fromCharCode(10) + ota.value + String.fromCharCode(10) + ' </scr' + 'ipt> ';
}
var firstScriptTag = document.getElementsByTagName('script')[eval(-1 + document.getElementsByTagName('script').length)];
//alert(tag.outerHTML);
firstScriptTag.insertAdjacentElement("afterend", tag);
//alert(ota.value);
document.getElementById('detsed').open=false;
}

… in the changed latest draft image_venn.html Google Chart Image Chart Venn Chart or Scatter Chart or GraphViz Chart or Pie Chart or Line Chart or Bar Chart or Candlestick/Box Chart or Google-O-Meter Chart or Radar Chart or Map Chart interfacing web application you can also try below.


Previous relevant Google Chart Image Chart Image Map Events Tutorial is shown below.

Google Chart Image Chart Image Map Events Tutorial

Google Chart Image Chart Image Map Events Tutorial

We really like HTML image maps, and it occurred to us with yesterday’s Google Chart Image Chart Image Map Tutorial we were hiding its light under some bushel somewhere, because …

  • yesterday we introduced with only the onclick event coded for in the HTML area subelements to the map parent element … linked to an …
  • associated img element … via an …
  • attribute called usemap … and two aspects, at the very least, to stuff under the bushel are …
    1. many more events than onclick can be defined as you define the area subelements … and here’s the kicker …
    2. you can add area subelement event logic that, on paper, would cause interference with other event logic (ie. the same event type in an event bubbling through scenario) but it won’t if you, as a programmer, turn that use of the usemap attribute on and off like a tap

… which, to our mind, represents the bee’s knees of event management. So useful!

To tip our toes into this woooorrrrrlllllddd we’ll show you some newly added area subelement event logics in a Google Chart Image Chart Radar Chart example below …


<map name="mymap" id="mymap"><area onmousedown="defclick(event);" ondblclick="defclick(event);" oncontextmenu="defclick(event);" ontouchend="defclick(event);" ontouchstart="defclick(event);" onmouseout="defclick(event);" onmousemove="defclick(event);" ontouchdown="defclick(event);" onmouseover="defclick(event);" shape="rect" coords="151,34,157,42" id="axis0_0" name="axis0_0" alt="axis0_0" onclick="youralert(this,'This feature name is axis0_0');" nohref=""><area onmousedown="defclick(event);" ondblclick="defclick(event);" oncontextmenu="defclick(event);" ontouchend="defclick(event);" ontouchstart="defclick(event);" onmouseout="defclick(event);" onmousemove="defclick(event);" ontouchdown="defclick(event);" onmouseover="defclick(event);" shape="rect" coords="281,110,288,118" id="axis0_1" name="axis0_1" alt="axis0_1" onclick="youralert(this,'This feature name is axis0_1');" nohref=""><area onmousedown="defclick(event);" ondblclick="defclick(event);" oncontextmenu="defclick(event);" ontouchend="defclick(event);" ontouchstart="defclick(event);" onmouseout="defclick(event);" onmousemove="defclick(event);" ontouchdown="defclick(event);" onmouseover="defclick(event);" shape="rect" coords="281,260,288,268" id="axis0_2" name="axis0_2" alt="axis0_2" onclick="youralert(this,'This feature name is axis0_2');" nohref=""><area onmousedown="defclick(event);" ondblclick="defclick(event);" oncontextmenu="defclick(event);" ontouchend="defclick(event);" ontouchstart="defclick(event);" onmouseout="defclick(event);" onmousemove="defclick(event);" ontouchdown="defclick(event);" onmouseover="defclick(event);" shape="rect" coords="151,336,157,344" id="axis0_3" name="axis0_3" alt="axis0_3" onclick="youralert(this,'This feature name is axis0_3');" nohref=""><area onmousedown="defclick(event);" ondblclick="defclick(event);" oncontextmenu="defclick(event);" ontouchend="defclick(event);" ontouchstart="defclick(event);" onmouseout="defclick(event);" onmousemove="defclick(event);" ontouchdown="defclick(event);" onmouseover="defclick(event);" shape="rect" coords="20,260,27,268" id="axis0_4" name="axis0_4" alt="axis0_4" onclick="youralert(this,'This feature name is axis0_4');" nohref=""><area onmousedown="defclick(event);" ondblclick="defclick(event);" oncontextmenu="defclick(event);" ontouchend="defclick(event);" ontouchstart="defclick(event);" onmouseout="defclick(event);" onmousemove="defclick(event);" ontouchdown="defclick(event);" onmouseover="defclick(event);" shape="rect" coords="20,110,27,118" id="axis0_5" name="axis0_5" alt="axis0_5" onclick="youralert(this,'This feature name is axis0_5');" nohref=""><area id="adef" onclick=" defclick(event); if (!done) { done=false; if (atstart) { normalcall=false; ask(null); normalcall=true; atstart=false; } else { ask(event); } } "
shape="default" nohref=""></map>

… with new relevant event code snippet to help add intelligence to the event logic of our Google Chart Image Chart interfacing web application …


function defclick(evt) {
switch ('' + evt.type) {
case 'click':

alert('Welcome to RJM Programming interfacing to Google Charts Image Chart ' + cname);
break;

default:
switch (('' + evt.type + ' ').substring(0,5)) {
case 'mouse':
document.getElementById('myh3').innerHTML='RJM Programming - November, 2023 ... non-mobile mouse event ' + evt.type + ' called by ' + ('' + evt.target.id);
break;

case 'touch':
document.getElementById('myh3').innerHTML='RJM Programming - November, 2023 ... mobile touch event ' + evt.type + ' called by ' + ('' + evt.target.id);
break;

default:
alert(evt.type);
break;
}
break;
}

}

Interesting, huh?!

Feel free to try this out in the changed latest draft image_venn.html Google Chart Image Chart Venn Chart or Scatter Chart or GraphViz Chart or Pie Chart or Line Chart or Bar Chart or Candlestick/Box Chart or Google-O-Meter Chart or Radar Chart or Map Chart interfacing web application you can also try below.


Previous relevant Google Chart Image Chart Image Map Tutorial is shown below.

Google Chart Image Chart Image Map Tutorial

Google Chart Image Chart Image Map Tutorial

Do you like to come at explaining things in layers? Sort of like the analogy …

  • you start a project thinking of it in terms of “2D” … and then to move forward …
  • you spend a day making it work for “3D” (and keep the “2D” working as well)

… or …

  • you start a web application project thinking of only working via a URL entered on the web browser address bar … and then to move forward …
  • you spend a day making it work for serving the same purpose and/or a difference purpose called within an HTML iframe (and keep it working for the address bar way as well)

And so we look at a “picturesque” but “kinda dumb” (as far as “action items” go) image we have coming off the interfacing to Google Charts Image Chart. Where can we go here? Well, it would be kind of you to take it to the beach, but that’s not always a possibility now, is it?! Were you pulling my leg?! Tee hee. No, we were thinking … oh no … we have a bad feeling about this … let’s open it up to the class … anyone, anyone? Yes, Louis, would you and Auguste like to share with the class what is so amusing to you?

.
.
.
.
.
.
.
.
.
.
.
.
.
.
.

Okay, thank you for your thoughts on this, and yes, you could take the “picture” to “a picture show”. Yes, very droll, indeed. Any other ideas? Okay, Johann, you say the idea just “clicked” with you. This sounds promising. Go on …

.
.
.
.
.
.
.
.
.
.
.
.
.
.
.

Indeed, a young “picturesque” might like to go tap dancing, that is true. Sheeeeesh! But given the lesson is a Computing one, rather than Drama or Dance or Music or the Arts, maybe we would be looking for a way to use the picture in an enhanced way. Okay Kevin, we’ll try you. What do you think?

.
.
.
.
.
.
.
.
.
.
.
.
.
.
.
.
.
.
.
.
.
.
.
.
.
.
.
.
.
.

Frankly, we are flabbergasted! It’s as if you invented HTML image maps (as a way to add position based event logic), or something … 93/4 points to Gryffindor!

Yes, helping out we image map enthusiasts regarding interfacing to Google Charts Image Charts is Google’s Image Map creation helping Json output tool. From that help, we can …

  • at the demonstrator’s webpage, create an Image Map … and as the user requires …
  • at the uniquifier definition phase of our WordPress 404.php’s contribution we accept the demonstrator’s image map HTML, and save it to a public resource
    <?php

    if (isset($_POST['canvcont'])) {
    if (isset($_POST['uniquifier'])) {
    $uniquifier=str_replace('+',' ',urldecode($_POST['uniquifier']));
    }
    if ($uniquifier == '') {
    $uniquifier='_' . rand(0,78654356);
    file_put_contents($_SERVER['DOCUMENT_ROOT'] . DIRECTORY_SEPARATOR . "presentation" . $uniquifier . ".png", base64_decode( explode('base64,', str_replace(' ','+',urldecode($_POST['canvcont'])))[1]));
    file_put_contents($_SERVER['DOCUMENT_ROOT'] . DIRECTORY_SEPARATOR . "presentation_" . $uniquifier . ".png", base64_decode( explode('base64,', str_replace(' ','+',urldecode($_POST['canvcont'])))[1]));
    file_put_contents($_SERVER['DOCUMENT_ROOT'] . DIRECTORY_SEPARATOR . "presentation__" . $uniquifier . ".png", base64_decode( explode('base64,', str_replace(' ','+',urldecode($_POST['canvcont'])))[1]));
    if (isset($_POST['mapstuff'])) {
    file_put_contents($_SERVER['DOCUMENT_ROOT'] . DIRECTORY_SEPARATOR . "presentation" . $uniquifier . ".html", '<html><body>' . str_replace('+',' ',urldecode($_POST['mapstuff'])) . '</body></html>');
    }

    exec("/usr/local/cpanel/3rdparty/bin/convert -delay 20 -loop 0 " . $_SERVER['DOCUMENT_ROOT'] . DIRECTORY_SEPARATOR . "presentation" . $uniquifier . ".png" . " " . $_SERVER['DOCUMENT_ROOT'] . DIRECTORY_SEPARATOR . "presentation" . $uniquifier . ".gif");
    echo "<html><body onload=\"if (parent.document.getElementById('uniquifier')) { if (parent.document.getElementById('uniquifier').value == '') { parent.document.getElementById('uniquifier').value='" . $uniquifier . "'; } }\"></body></html>";
    } else {
    file_put_contents($_SERVER['DOCUMENT_ROOT'] . DIRECTORY_SEPARATOR . "presentation" . $uniquifier . ".png", base64_decode( explode('base64,', str_replace(' ','+',urldecode($_POST['canvcont'])))[1]));
    if (file_exists($_SERVER['DOCUMENT_ROOT'] . DIRECTORY_SEPARATOR . "presentation__" . $uniquifier . ".png")) {
    $middelay='';
    $enddelay='';
    if (filesize($_SERVER['DOCUMENT_ROOT'] . DIRECTORY_SEPARATOR . "presentation__" . $uniquifier . ".png") < filesize($_SERVER['DOCUMENT_ROOT'] . DIRECTORY_SEPARATOR . "presentation_" . $uniquifier . ".png")) {
    $middelay=' -delay 800 ';
    $enddelay=' -delay 800 ';
    }
    exec("rm -f " . $_SERVER['DOCUMENT_ROOT'] . DIRECTORY_SEPARATOR . "presentation" . $uniquifier . ".gif ; /usr/local/cpanel/3rdparty/bin/convert -delay 600 -loop 0 " . $_SERVER['DOCUMENT_ROOT'] . DIRECTORY_SEPARATOR . "presentation_" . $uniquifier . ".png " . $middelay . $_SERVER['DOCUMENT_ROOT'] . DIRECTORY_SEPARATOR . "presentation__" . $uniquifier . ".png " . $enddelay . $_SERVER['DOCUMENT_ROOT'] . DIRECTORY_SEPARATOR . "presentation" . $uniquifier . ".png" . " " . $_SERVER['DOCUMENT_ROOT'] . DIRECTORY_SEPARATOR . "presentation" . $uniquifier . ".gif");
    } else {
    exec("rm -f " . $_SERVER['DOCUMENT_ROOT'] . DIRECTORY_SEPARATOR . "presentation" . $uniquifier . ".gif ; /usr/local/cpanel/3rdparty/bin/convert -delay 200 -loop 0 " . $_SERVER['DOCUMENT_ROOT'] . DIRECTORY_SEPARATOR . "presentation_" . $uniquifier . ".png " . $_SERVER['DOCUMENT_ROOT'] . DIRECTORY_SEPARATOR . "presentation" . $uniquifier . ".png" . " " . $_SERVER['DOCUMENT_ROOT'] . DIRECTORY_SEPARATOR . "presentation" . $uniquifier . ".gif");
    }
    }
    exit;
    }

    ?>
  • helping keep the image mapping going, even if the Image Chart is …
    1. shared via email or SMS … and/or …
    2. forms the basis of a Broadcast Talk demonstration session

We could use Ajax techniques for the Javascript client ways an emailee’s link’s webpage invocation can use this new resource, but we kind of like “client pre-emptive iframe” onload event thinking, for both sides of the ledger, to get this going, as per …


function htmlDecode(input) { // thanks to https://stackoverflow.com/questions/1912501/unescape-html-entities-in-javascript
var e = document.createElement('textarea');
e.innerHTML = input;
// handle case of empty input
return e.childNodes.length === 0 ? "" : e.childNodes[0].nodeValue;
}

function mapsofarpj(xiois) {
//alert(('' + xiois.src));
if (xiois.src != '' && ('' + xiois.src).indexOf('presentation') != -1) {
//alert(('' + xiois.src));
var xaconto = (xiois.contentWindow || xiois.contentDocument);
//alert(11);
if (xaconto != null) {
//alert(111);
if (xaconto.document) { xaconto = xaconto.document; }
//alert(1111);
if (xaconto.body.innerHTML.indexOf('<map') != -1) {
var ihis=xaconto.body.innerHTML;
//while (ihis.indexOf('\"') != -1) {
// ihis=ihis.replace('\"', '')
//}
ihis=htmlDecode(ihis).replace(/\\"/g,'').replace(/\\'/g,"'").replace(/\=\"\"/g,'').replace(/This\"/g,"This").replace(/\;\ nohref/g, ';" nohref');
//alert(ihis);
if (document.getElementById('jdiv')) {
//alert(21111);
document.getElementById('jdiv').innerHTML=ihis; //xaconto.body.innerHTML;
//alert(31111);
document.getElementById('talkimg').useMap='#mymap';
//alert(41111);
} else {
document.body.innerHTML+=ihis; //xaconto.body.innerHTML;
document.getElementById('talkimg').useMap='#mymap';
}
}
}
}
}

function sofarpj(iois) {
var aname='', partsare=[], ipis=0, areabits='';
if (iois.src != '') {
var aconto = (iois.contentWindow || iois.contentDocument);
if (aconto != null) {
if (aconto.document) { aconto = aconto.document; }
pjsbih=aconto.body.innerHTML;
if (lastpjsbih != '' && pjsbih != lastpjsbih.replace(/\ $/g,'')) {
//alert('Found new Image Map data of ' + pjsbih);
// {"chartshape":[{"name":"axis0_0","type":"RECT","coords":[21,336,28,344]},{"name":"axis0_1","type":"RECT","coords":[65,336,77,344]},{"name":"axis0_2","type":"RECT","coords":[111,336,124,344]},{"name":"axis0_3","type":"RECT","coords":[158,336,170,344]},{"name":"axis0_4","type":"RECT","coords":[204,336,217,344]},{"name":"axis0_5","type":"RECT","coords":[251,336,263,344]},{"name":"axis0_6","type":"RECT","coords":[297,336,310,344]},{"name":"axis0_7","type":"RECT","coords":[344,336,356,344]},{"name":"axis0_8","type":"RECT","coords":[390,336,403,344]},{"name":"axis0_9","type":"RECT","coords":[437,336,449,344]},{"name":"axis0_10","type":"RECT","coords":[480,336,499,344]},{"name":"axis1_0","type":"RECT","coords":[14,326,20,334]},{"name":"axis1_1","type":"RECT","coords":[8,297,20,305]},{"name":"axis1_2","type":"RECT","coords":[8,267,20,275]},{"name":"axis1_3","type":"RECT","coords":[8,237,20,245]},{"name":"axis1_4","type":"RECT","coords":[8,208,20,216]},{"name":"axis1_5","type":"RECT","coords":[8,178,20,186]},{"name":"axis1_6","type":"RECT","coords":[8,148,20,156]},{"name":"axis1_7","type":"RECT","coords":[8,119,20,127]},{"name":"axis1_8","type":"RECT","coords":[8,89,20,97]},{"name":"axis1_9","type":"RECT","coords":[8,59,20,67]},{"name":"axis1_10","type":"RECT","coords":[2,29,20,37]},{"name":"legend0","type":"RECT","coords":[500,167,512,179]},{"name":"legend1","type":"RECT","coords":[500,185,512,197]},{"name":"circle0","type":"CIRCLE","coords":[80,39,4]},{"name":"circle1","type":"CIRCLE","coords":[429,152,1]},{"name":"circle2","type":"CIRCLE","coords":[373,250,3]},{"name":"circle3","type":"CIRCLE","coords":[215,230,4]},{"name":"circle4","type":"CIRCLE","coords":[131,164,2]},{"name":"circle5","type":"CIRCLE","coords":[471,96,5]},{"name":"circle6","type":"CIRCLE","coords":[341,158,3]},{"name":"circle7","type":"CIRCLE","coords":[355,111,5]},{"name":"circle8","type":"CIRCLE","coords":[183,277,3]},{"name":"circle9","type":"CIRCLE","coords":[66,105,3]}]}
if (pjsbih.replace(/\[\]/g, '').indexOf('[') != -1) {
partsare=pjsbih.split('","coords":[');
for (ipis=1; ipis<partsare.length; ipis++) {
if (partsare[eval(-1 + ipis)].split('"')[eval(-1 + partsare[eval(-1 + ipis)].split('"').length)] == 'RECT') {
aname=partsare[eval(-1 + ipis)].split('"name":"')[eval(-1 + partsare[eval(-1 + ipis)].split('"name":"').length)].split('"')[0];
areabits+='<area shape="rect" coords="' + partsare[ipis].split(']')[0] + '" alt="' + aname + '" onclick="' + "alert('This feature name is " + aname + "'" + ');" nohref>';
} else if (partsare[eval(-1 + ipis)].split('"')[eval(-1 + partsare[eval(-1 + ipis)].split('"').length)] == 'CIRCLE') {
aname=partsare[eval(-1 + ipis)].split('"name":"')[eval(-1 + partsare[eval(-1 + ipis)].split('"name":"').length)].split('"')[0];
areabits+='<area shape="circle" coords="' + partsare[ipis].split(']')[0] + '" alt="' + aname + '" onclick="' + "alert('This feature name is " + aname + "'" + ');" nohref>';
} else if (partsare[eval(-1 + ipis)].split('"')[eval(-1 + partsare[eval(-1 + ipis)].split('"').length)] == 'POLY') {
aname=partsare[eval(-1 + ipis)].split('"name":"')[eval(-1 + partsare[eval(-1 + ipis)].split('"name":"').length)].split('"')[0];
areabits+='<area shape="poly" coords="' + partsare[ipis].split(']')[0] + '" alt="' + aname + '" onclick="' + "alert('This feature name is " + aname + "'" + ');" nohref>';
}
}
document.getElementById('mymap').innerHTML=areabits + '<area' + atend.split('<area')[1].split('>')[0] + '>'; //"<area onclick=defclick(event); shape='default' nohref>";
origmap=document.getElementById('mymap').outerHTML;
}
} else if (lastpjsbih != '') {
//alert('Found the same ' + pjsbih);
if (pjsbih.replace(/\[\]/g, '').indexOf('[') != -1) {
partsare=pjsbih.split('","coords":[');
for (ipis=1; ipis<partsare.length; ipis++) {
if (partsare[eval(-1 + ipis)].split('"')[eval(-1 + partsare[eval(-1 + ipis)].split('"').length)] == 'RECT') {
aname=partsare[eval(-1 + ipis)].split('"name":"')[eval(-1 + partsare[eval(-1 + ipis)].split('"name":"').length)].split('"')[0];
areabits+='<area shape="rect" coords="' + partsare[ipis].split(']')[0] + '" alt="' + aname + '" onclick="' + "alert('This feature name is " + aname + "'" + ');" nohref>';
} else if (partsare[eval(-1 + ipis)].split('"')[eval(-1 + partsare[eval(-1 + ipis)].split('"').length)] == 'CIRCLE') {
aname=partsare[eval(-1 + ipis)].split('"name":"')[eval(-1 + partsare[eval(-1 + ipis)].split('"name":"').length)].split('"')[0];
areabits+='<area shape="circle" coords="' + partsare[ipis].split(']')[0] + '" alt="' + aname + '" onclick="' + "alert('This feature name is " + aname + "'" + ');" nohref>';
} else if (partsare[eval(-1 + ipis)].split('"')[eval(-1 + partsare[eval(-1 + ipis)].split('"').length)] == 'POLY') {
aname=partsare[eval(-1 + ipis)].split('"name":"')[eval(-1 + partsare[eval(-1 + ipis)].split('"name":"').length)].split('"')[0];
areabits+='<area shape="poly" coords="' + partsare[ipis].split(']')[0] + '" alt="' + aname + '" onclick="' + "alert('This feature name is " + aname + "'" + ');" nohref>';
}
}
document.getElementById('mymap').innerHTML=areabits + '<area' + atend.split('<area')[1].split('>')[0] + '>'; //"<area onclick=defclick(event); shape='default' nohref>";
origmap=document.getElementById('mymap').outerHTML;
}
}
lastpjsbih=pjsbih;
}
}
}

… further to yesterday’s Google Chart Image Chart Dynamic Icons Tutorial in the changed latest draft image_venn.html Google Chart Image Chart Venn Chart or Scatter Chart or GraphViz Chart or Pie Chart or Line Chart or Bar Chart or Candlestick/Box Chart or Google-O-Meter Chart or Radar Chart or Map Chart interfacing web application you can also try below.


Previous relevant Google Chart Image Chart Dynamic Icons Tutorial is shown below.

Google Chart Image Chart Dynamic Icons Tutorial

Google Chart Image Chart Dynamic Icons Tutorial

Does statistics have to be staid and boring? Kitch and quiche?! Welcome to the wooorrrlllddd of Google Charts Image Chart Dynamic Icons!

Think of Dynamic Icons as a way to decorate one or more data points displayed in one of …

  • Line Chart
  • Bar Chart
  • Map Chart
  • Radar Chart

We had that certain “Wow! factor going as we remembered our state’s motto from some years back, and we tried out the Map Chart to see whether we could embellish the map with a Dynamic Icon relevant to New South Wales, as you can see with today’s tutorial picture.

We’ll show you the most recent snapshot of Javascript parameters a little later, but the change for this is an optional one up to the user to work out, with prompts such as the Map Chart one updated

Enter vertical bar separated country ISO Country and/or Region Code list. Please note that optional Dynamic Icons are available via a suffixing string example applied to the second data point such as &chem=y;s=bubble_icon_text_small;d=ski,bb,NSW%20State%20of%20Wow!,FFFFFF;dp=1;ds=0 eg. AU-NT|AU-NSW|AU-SA|NZ|IN’

And here is its relevance in a new snapshot of parameterizations …


var prefixandon='';
var dtextis='dtext';
var pretherest='';
var newtherest='';
var tmod='';
var colchange='';
var cht=location.search.split('cht=')[1] ? decodeURIComponent(location.search.split('cht=')[1].split('&')[0]) : "v";
if ((cht + ' ').substring(0,1) == 'p' && cht != 'p') { pretherest=cht.substring(1); }
//if ((cht + ' ').substring(0,2) == 'bv' && cht != 'bv') { pretherest=cht.substring(2); if (1 == 1) { cht='bv'; } }
if ((cht + ' ').substring(0,1) == 'bv'.substring(0,1) && cht != 'bv'.substring(0,1)) { pretherest=cht.substring(1); if (1 == 1) { cht='bv'.substring(0,1); } }
if ((cht + ' ').substring(0,1) == 'l' && cht != 'l') { pretherest=cht.substring(1); if (1 == 1) { cht='l'; } }
if ((cht + ' ').substring(0,1) == 'r' && cht != 'r') { pretherest=cht.substring(1); if (1 == 1) { cht='r'; } }
var ccode=location.search.split('chld=')[1] ? decodeURIComponent(location.search.split('chld=')[1].split('&')[0]) : "";
var ctype=location.search.split('type=')[1] ? decodeURIComponent(location.search.split('type=')[1].split('&')[0]) : cht;
var cname=(ctype == 'v' ? 'Venn Chart' : (ctype == 's' ? 'Scatter Chart' : (ctype == 'gv' ? 'GraphViz Chart' :
(ctype.substring(0,1) == 'p' ? 'Pie Chart' :
((ctype + ' ').substring(0,2).substring(0,1) == 'bv'.substring(0,1) ? 'Bar Chart' : (ctype.substring(0,1) == 'l' ? 'Line Chart' :
(ctype == 'map' ? 'Map Chart' :
(ctype == 'gom' ? 'Google-O-Meter Chart' :
(ctype == 'r' ? 'Radar Chart' :
'')))))))));
var cencodename=(ctype == 'v' ? 'Venn%20Diagram' : (ctype == 's' ? 'Scatter%20Chart' : (ctype == 'gv' ? 'GraphViz%20Chart' :
(ctype.substring(0,1) == 'p' ? 'Pie%20Chart' :
((ctype + ' ').substring(0,2).substring(0,1) == 'bv'.substring(0,1) ? 'Bar%20Chart' : (ctype.substring(0,1) == 'l' ? 'Line%20Chart' :
(ctype == 'map' ? 'Map%20Chart' :
(ctype == 'gom' ? 'Google-O-Meter%20Chart' :
(ctype == 'r' ? 'Radar%20Chart' :
'')))))))));
var chdt=(ctype == 'v' ? '&chd=t:' : (ctype == 's' ? '&chd=t:' : (ctype == 'gv' ? '&chl=' :
(ctype.substring(0,1) == 'p' ? pretherest + '&chd=t:' :
((ctype + ' ').substring(0,2).substring(0,1) == 'bv'.substring(0,1) ? '&chd=t:' : (ctype.substring(0,1) == 'l' ? '&chd=t:' :
(ctype == 'map' ? '' :
(ctype == 'gom' ? '&chd=t:' :
(ctype == 'r' ? pretherest + '&chd=t:' :
'')))))))));
var chdeq=(ctype == 'v' ? '&chd=' : (ctype == 's' ? '&chd=' : (ctype == 'gv' ? '&chl=' :
(ctype.substring(0,1) == 'p' ? '&chd=' :
((ctype + ' ').substring(0,2).substring(0,1) == 'bv'.substring(0,1) ? '&chd=' : (ctype.substring(0,1) == 'l' ? '&chd=' :
(ctype == 'map' ? '&chld=' :
(ctype == 'gom' ? '&chld=' :
(ctype == 'r' ? '&chd=' :
'')))))))));
var tc=(ctype == 'v' ? 't:' : (ctype == 's' ? 't:' : (ctype == 'gv' ? '' :
(ctype.substring(0,1) == 'p' ? 't:' :
((ctype + ' ').substring(0,2).substring(0,1) == 'bv'.substring(0,1) ? 't:' : (ctype.substring(0,1) == 'l' ? 't:' :
(ctype == 'map' ? '' :
(ctype == 'gom' ? 't:' :
(ctype == 'r' ? 't:' :
'')))))))));
var chdl=(ctype == 'v' ? '&chdl=' : (ctype == 's' ? '&chdl=' : (ctype == 'gv' ? '' :
(ctype.substring(0,1) == 'p' ? '&chdl=' :
((ctype + ' ').substring(0,2).substring(0,1) == 'bv'.substring(0,1) ? '&chbh=' : (ctype.substring(0,1) == 'l' ? '&chbh=' :
(ctype == 'map' ? '' :
(ctype == 'gom' ? '&chdl=' :
(ctype == 'r' ? '&chxt=x&chxl=' :
'')))))))));

var prenchtt=(ctype == 'v' ? '100,80,60,30,30,30,10' : (ctype == 's' ? '12,87,75,41,23,96,68,71,34,9|98,60,27,34,56,79,58,74,18,76|84,23,69,81,47,94,60,93,64,54' : (ctype == 'gv' ? 'graph{C_0--H_0[type=s];C_0--H_1[type=s];C_0--H_2[type=s];C_0--C_1[type=s];C_1--H_3[type=s];C_1--H_4[type=s];C_1--H_5[type=s]}' :
(ctype.substring(0,1) == 'p' ? '1,2,3,4' :
((ctype + ' ').substring(0,2).substring(0,1) == 'bv'.substring(0,1) ? '5,5,5|10,10,10|15,15,15' : (ctype.substring(0,1) == 'l' ? '5,45,5|10,60,10|15,85,15' :
(ctype == 'map' ? '' :
(ctype == 'gom' ? '20,40,60' :
(ctype == 'r' ? '10,20,30,40,50' :
'')))))))));
var preachtt=(ctype == 'v' ? 'A|B|C' : (ctype == 's' ? 'Cats|Dogs' : (ctype == 'gv' ? '' :
(ctype.substring(0,1) == 'p' ? 'January|February|March|April' :
((ctype + ' ').substring(0,2).substring(0,1) == 'bv'.substring(0,1) ? '15,4,15' : (ctype.substring(0,1) == 'l' ? '15,4,15' :
(ctype == 'map' ? '' :
(ctype == 'gom' ? 'A|B|C' :
(ctype == 'r' ? '0:|1|2|3|4|5|6' :
'')))))))));
var defchco=(ctype == 'v' ? 'ff0000,00ff00,0000ff' : (ctype == 's' ? 'FF0000|0000FF&chxt=x,y' : (ctype == 'gv' ? '' :
(ctype.substring(0,1) == 'p' ? 'ff0000,00ff00,0000ff,ff00ff' :
((ctype + ' ').substring(0,2).substring(0,1) == 'bv'.substring(0,1) ? '4D89F9,C6D9FD,C6FDD9&chxt=x,y' : (ctype.substring(0,1) == 'l' ? '3D89F9.B6D9FD,B6FDD9&chxt=x,y' :
(ctype == 'map' ? '' :
(ctype == 'gom' ? 'ff0000,00ff00,0000ff' :
(ctype == 'r' ? 'FF0000,FF9900,ff0a00,00ffb0,000cff' :
'')))))))));

var prechtt=(ctype == 'v' ? chdt + prenchtt + chdl + preachtt : (ctype == 's' ? chdt + prenchtt + chdl + preachtt + '&chxt=x,y' : (ctype == 'gv' ? chdt + prenchtt :
(ctype.substring(0,1) == 'p' ? chdt + prenchtt + chdl + preachtt :
((ctype + ' ').substring(0,2).substring(0,1) == 'bv'.substring(0,1) ? chdt + prenchtt + chdl + preachtt : (ctype.substring(0,1) == 'l' ? chdt + prenchtt + chdl + preachtt :
(ctype == 'map' ? '' :
(ctype == 'gom' ? chdt + prenchtt + chdl + preachtt :
(ctype == 'r' ? chdt + prenchtt + chdl + preachtt :
'')))))))));
var promptone=(ctype == 'v' ? "Enter delimited values string for Venn Diagram such that ... " + String.fromCharCode(10) + "The first three values specify the sizes of three circles: A, B, & C. For chart with only two circles, specify zero for the third value." + String.fromCharCode(10) + "The fourth value specifies the size of the intersection of A and B." + String.fromCharCode(10) + "The fifth value specifies the size of the intersection of A and C. For a chart with only two circles, do not specify a value here." + String.fromCharCode(10) + "The sixth value specifies the size of the intersection of B and C. For a chart with only two circles, do not specify a value here." + String.fromCharCode(10) + "The seventh value specifies the size of the common intersection of A, B, and C. For a chart with only two circles, do not specify a value here." + String.fromCharCode(10) + String.fromCharCode(10) + "" : (ctype == 's' ? "Enter delimited values string for Scatter Chart" : (ctype == 'gv' ? "Enter delimited values string for GraphViz Chart" :
(ctype.substring(0,1) == 'p' ? "Enter delimited values string for Pie Chart" :
((ctype + ' ').substring(0,2).substring(0,1) == 'bv'.substring(0,1) ? "Enter v for Vertical or h for Horizontal then one of g for Group or s for Stacked or o for Overlapped Bar Chart look then a space and then enter delimited values string for Bar Chart. Here is a Candlestick and horizontal Bar Chart idea eg. hg 1:20,10,15,25,17,30|0,5,10,7,12,6|35,25,45,47,24,46|15,40,30,27,39,54|70,55,63,59,80,6 Here is a vertical Bar Chart and Box Chart idea vs 1:-1,5,10,7,12,-1|-1,25,30,27,24,-1|-1,40,45,47,39,-1|-1,55,63,59,80,-1|-1,30,40,35,30,-1|-1,-1,5,70,90,-1|-1,-1,-1,80,5,-1&chm=F,FF9900,0,1:4,40|H,0CBF0B,0,1:4,1:20|H,000000,4,1:4,1:40|H,0000FF,3,1:4,1:20|o,FF0000,5,-1,7|o,FF0000,6,-1,7 Prefix just the delimited string you enter by 1: to additionally display Candlestick/Box Charts or by 0: to only display Candlestick/Box Chart" :
(ctype.substring(0,1) == 'l' ? "Enter c for Even or s for Sparklines or xy for Just XY Line Chart look then a space and then enter delimited values string for Line Chart. Here is a Candlestick and Line Chart idea eg. c 1:20,10,15,25,17,30|0,5,10,7,12,6|35,25,45,47,24,46|15,40,30,27,39,54|70,55,63,59,80,6 Here is a Line Chart and Box Chart idea s 1:-1,5,10,7,12,-1|-1,25,30,27,24,-1|-1,40,45,47,39,-1|-1,55,63,59,80,-1|-1,30,40,35,30,-1|-1,-1,5,70,90,-1|-1,-1,-1,80,5,-1&chm=F,FF9900,0,1:4,40|H,0CBF0B,0,1:4,1:20|H,000000,4,1:4,1:40|H,0000FF,3,1:4,1:20|o,FF0000,5,-1,7|o,FF0000,6,-1,7 Prefix just the delimited string you enter by 1: to additionally display Candlestick/Box Charts or by 0: to only display Candlestick/Box Chart" :
(ctype == 'map' ? "" :
(ctype == 'gom' ? "Enter delimited values string for Google-O-Meter Chart" :
(ctype == 'r' ? "Enter delimited values string for Radar Chart but prefix with an s for smooth lines" :
"")))))))));
var oneprompt=(ctype == 'v' ? "Enter delimited values string for your Venn Diagram collaborations, optionally, such that ... " + String.fromCharCode(10) + "The first three values specify the sizes of three circles: A, B, & C. For chart with only two circles, specify zero for the third value." + String.fromCharCode(10) + "The fourth value specifies the size of the intersection of A and B." + String.fromCharCode(10) + "The fifth value specifies the size of the intersection of A and C. For a chart with only two circles, do not specify a value here." + String.fromCharCode(10) + "The sixth value specifies the size of the intersection of B and C. For a chart with only two circles, do not specify a value here." + String.fromCharCode(10) + "The seventh value specifies the size of the common intersection of A, B, and C. For a chart with only two circles, do not specify a value here." + String.fromCharCode(10) + String.fromCharCode(10) + "" : (ctype == 's' ? "Enter delimited values string for Scatter Chart" : (ctype == 'gv' ? "Enter delimited values string for GraphViz Chart" :
(ctype.substring(0,1) == 'p' ? "Enter delimited values string for Pie Chart" :
((ctype + ' ').substring(0,2).substring(0,1) == 'bv'.substring(0,1) ? "Enter g for Grouped or s for Stacked or o for Overlapped Bar Chart look then a space and then enter delimited values string for Bar Chart. Here is a Candlestick and Bar Chart idea eg. g 1:20,10,15,25,17,30|0,5,10,7,12,6|35,25,45,47,24,46|15,40,30,27,39,54|70,55,63,59,80,6 Here is a vertical Bar Chart and Box Chart idea vs 1:-1,5,10,7,12,-1|-1,25,30,27,24,-1|-1,40,45,47,39,-1|-1,55,63,59,80,-1|-1,30,40,35,30,-1|-1,-1,5,70,90,-1|-1,-1,-1,80,5,-1&chm=F,FF9900,0,1:4,40|H,0CBF0B,0,1:4,1:20|H,000000,4,1:4,1:40|H,0000FF,3,1:4,1:20|o,FF0000,5,-1,7|o,FF0000,6,-1,7 Prefix just the delimited string you enter by 1: to additionally display Candlestick/Box Charts or by 0: to only display Candlestick/Box Chart" :
(ctype.substring(0,1) == 'l' ? "Enter c for Even or s for Sparklines or xy for Just XY Line Chart look then a space and then enter delimited values string for Line Chart. Here is a Candlestick and Line Chart idea eg. c 1:20,10,15,25,17,30|0,5,10,7,12,6|35,25,45,47,24,46|15,40,30,27,39,54|70,55,63,59,80,6 Here is a Line Chart and Box Chart idea s 1:-1,5,10,7,12,-1|-1,25,30,27,24,-1|-1,40,45,47,39,-1|-1,55,63,59,80,-1|-1,30,40,35,30,-1|-1,-1,5,70,90,-1|-1,-1,-1,80,5,-1&chm=F,FF9900,0,1:4,40|H,0CBF0B,0,1:4,1:20|H,000000,4,1:4,1:40|H,0000FF,3,1:4,1:20|o,FF0000,5,-1,7|o,FF0000,6,-1,7 Prefix just the delimited string you enter by 1: to additionally display Candlestick/Box Charts or by 0: to only display Candlestick/Box Chart" :
(ctype == 'map' ? "" :
(ctype == 'gom' ? "Enter delimited values string for Google-O-Meter Chart" :
(ctype == 'r' ? "Enter delimited values string for Radar Chart but prefix with an s for smooth lines" :
"")))))))));
var asktwo=(ctype == 'v' ? true : (ctype == 's' ? true : (ctype == 'gv' ? false :
(ctype.substring(0,1) == 'p' ? true :
((ctype + ' ').substring(0,2).substring(0,1) == 'bv'.substring(0,1) ? true : (ctype.substring(0,1) == 'l' ? true :
(ctype == 'map' ? false :
(ctype == 'gom' ? true :
(ctype == 'r' ? true :
false)))))))));

var answersuffix=(ctype.substring(0,1).replace('m','l').replace('b','l').replace('r','l') == 'l' ? '. Please note that optional Dynamic Icons are available via a suffixing string example applied to the second data point such as &chem=y;s=bubble_icon_text_small;d=ski,bb,Wheeee!,FFFFFF;dp=1;ds=0 ' : '');

var twopb=(ctype.substring(0,1) == 'p' ? 'Any optional legend or title argument snippets? Optionally prefix by 3 for 3d Pie Chart or by c for Concentric Pie Chart. Eg. 3' + chdl + preachtt + '&chtt=My%20' + cencodename + '&chco=' + defchco : 'Any optional legend or title argument snippets? Eg. ' + chdl + preachtt + '&chtt=My%20' + cencodename + '&chco=' + defchco);
var beforeanswer=(ctype.substring(0,1) == 'l' ? 'c ' : ((ctype + ' ').substring(0,2).substring(0,1) == 'bv'.substring(0,1) ? 'vg ' : ''));

var emsmlist='';

… further to yesterday’s Google Chart Image Chart Broadcast Talk Commentary Tutorial in the changed latest draft image_venn.html Google Chart Image Chart Venn Chart or Scatter Chart or GraphViz Chart or Pie Chart or Line Chart or Bar Chart or Candlestick/Box Chart or Google-O-Meter Chart or Radar Chart or Map Chart interfacing web application you can also try below.


Previous relevant Google Chart Image Chart Broadcast Talk Commentary Tutorial is shown below.

Google Chart Image Chart Broadcast Talk Commentary Tutorial

Google Chart Image Chart Broadcast Talk Commentary Tutorial

We’ll leave yesterday’s Google Chart Image Chart Radar Chart Tutorial angled text predilections for now, given we’ve got until Tuesday until tswhtf so to speak. Let’s today remedy the concern we had when we presented Google Chart Image Chart Broadcast Talk Context Tutorial regarding, the at the time new, “Broadcast Talk”, concept …

… even though it is only visual by nature, presented as an update image still presented and updated periodically. Go figure?!

… and offer a way to help the “Broadcast Talk” demonstrator “speak” during their demonstration, effectively. In so doing, we are going to add to …

  • the demonstrator’s visual inputs coming from that canvas annotator helper … with, today …
  • the demonstrator’s commentary, collected via an HTML textarea element (to optionally supplement the visuals) from that canvas annotator helper’s originator window (ie. the Google Charts Image Chart interfacing supervisor) … presented …

… via a new “middle of three slide” …

<?php

$uwidth=trim($uparts[$ioff - 2 + sizeof($uparts)]);
$uheight=trim(explode('#',explode('?',$uparts[$ioff - 1 + sizeof($uparts)])[0])[0]);
if (isset($_GET['canvcont']) && isset($_GET['uniquifier'])) {
$uniquifier=str_replace('+',' ',urldecode($_GET['uniquifier']));
if (file_exists($_SERVER['DOCUMENT_ROOT'] . DIRECTORY_SEPARATOR . "presentation__" . $uniquifier . ".png")) {
$im = imagecreatefromstring(file_get_contents($_SERVER['DOCUMENT_ROOT'] . DIRECTORY_SEPARATOR . "presentation__" . $uniquifier . ".png"));
$white = imagecolorallocate($im, 255, 255, 255);
$black = imagecolorallocate($im, 1, 1, 1);
imagefilledrectangle($im, 0, 0, $uwidth, $uheight, $white);
imagesavealpha($im, TRUE);
try {
if (function_exists('imagettftext')) {
imagettftext($im, 12, 0, 20, 20, $black, realpath('arial.ttf'), str_replace('+',' ',urldecode($_GET['canvcont'])));
}
} catch (Exception $e) { }

imagepng($im, $_SERVER['DOCUMENT_ROOT'] . DIRECTORY_SEPARATOR . "presentation__" . $uniquifier . ".png");
imagedestroy($im);
exit;
}
exit;
}


?>

… animated GIF (PHP 404.php helping) means of display in the viewer windows (off email invitation links they receive via the demonstrator) in the changed


function askaway() {
var waspis=prefixandon, nl='', newwaspis='';
if (document.getElementById('bcommentary')) {
if (document.getElementById('bcommentary').value.trim() != '') {
if (document.getElementById('bcommentary').value.trim().indexOf(String.fromCharCode(10)) == -1) {
nl=String.fromCharCode(10);
}
eightthousand=24000;
if ((' ' + document.getElementById('bcommentary').value.trim()).slice(-3) != '...' && (' ' + prefixandon.trim()).slice(-3) != '...' && (document.getElementById('bcommentary').value.trim() + ' ').substring(0,3) != '...') {
prefixandon='';
lastval='';
} else if ((document.getElementById('bcommentary').value.trim() + ' ').substring(0,3) == '...') {
if (waspis.indexOf(lastval.trim()) == -1) {
prefixandon=String.fromCharCode(10) + lastval.trim().replace(/\.\.\.NoWayJosE$/g, ' ' + nl + ('' + (new Date())) + ' ... ') + waspis;
newwaspis=prefixandon;
}
}
if ((' ' + document.getElementById('bcommentary').value.trim()).slice(-3) == '...') {
document.getElementById('ifco').src='//www.rjmprogramming.com.au/ITblog/' + Math.min(550,window.innerWidth) + '/' + Math.min(350,window.innerHeight) + '/?uniquifier=' + encodeURIComponent(document.getElementById('uniquifier').value) + '&canvcont=' + encodeURIComponent(document.getElementById('bcommentary').value.trim().replace(/\.\.\.$/g, ' ' + nl + ('' + (new Date())) + ' ... ' + String.fromCharCode(10) + String.fromCharCode(10) + prefixandon));
} else {
document.getElementById('ifco').src='//www.rjmprogramming.com.au/ITblog/' + Math.min(550,window.innerWidth) + '/' + Math.min(350,window.innerHeight) + '/?uniquifier=' + encodeURIComponent(document.getElementById('uniquifier').value) + '&canvcont=' + encodeURIComponent(document.getElementById('bcommentary').value + String.fromCharCode(10) + String.fromCharCode(10) + prefixandon);
}
document.getElementById('bcommentary').title=document.getElementById('bcommentary').value;
if ((document.getElementById('bcommentary').value.trim() + ' ').substring(0,3) == '...') {
if (newwaspis != '') { waspis=newwaspis; }
if (waspis.indexOf(document.getElementById('bcommentary').value.trim()) == -1) {
prefixandon=String.fromCharCode(10) + document.getElementById('bcommentary').value.trim().replace(/\.\.\.$/g, ' ' + nl + ('' + (new Date())) + ' ... ') + waspis;
}
}
lastval=document.getElementById('bcommentary').value;
document.getElementById('bcommentary').value='';
setTimeout(function(){ document.getElementById('subcc').click(); }, 2000);
}
}
}

function newfunction() {
if (document.getElementById('bshare')) {
document.getElementById('sbshare').innerHTML='<iframe id=ifco style=display:none; src=></iframe><br><br><textarea rows=2 cols=80 id=bcommentary placeholder="Commentary to Viewers can go here ... start with or end with ... for ongoing ..." onblur="askaway(this);" value=""></textarea><br><br>';
}
}

latest draft image_venn.html Google Chart Image Chart Venn Chart or Scatter Chart or GraphViz Chart or Pie Chart or Line Chart or Bar Chart or Candlestick/Box Chart or Google-O-Meter Chart or Radar Chart or Map Chart interfacing web application you can also try below.


Previous relevant Google Chart Image Chart Radar Chart Tutorial is shown below.

Google Chart Image Chart Radar Chart Tutorial

Google Chart Image Chart Radar Chart Tutorial

Onto yesterday’s Google Chart Image Chart Box Chart Tutorial, today we have a two part stepping forward via new …

Why the trepidation? Well, so far, when the text is angled we can’t understand what results we are getting back from a call to [element].getBoundingClientRect() just yet.

Why is this needed? Again, with the questions! Well, Mr De Niro, you see, well, somebody might want to go onto that more complex annotating.

And why would they do that? Sheesh. Well, Mr De Niro, sir, you see, sometimes things happen in life, and well, fingers slip on keyboards, and mice get awfullllly nervous around screens these days.

Yeh, well, show us the money, wiseguy. Who’s is that question? And what’s with the questions? Well, you see, Mr De Niro, the money is if we can get PHP text placement for text at an angle, where it rotates from the middle of the text, to get a similar positioning to good ol’ … pardon, Mr De Niro … good and well respected Javascript transform rotations … not with a triple pike, Mr De Niro, but you’re awfulllllly close, Mr De Niro, sir … rather, we throw in a couple of translations … no, not Latin, Mr De Niro … of co-ordinates, Mr De Niro.

And that will bring in how much by next Tuesday? Back to the questions? Why so many questions? We think it’s a pretty big money spinner, Mr De Niro, sir, and we think you should come back next Tuesday, and we can show you the ropes. Sweat, oozing from the brow, as Mr De Niro exits stage left.

And just while we have a few minutes, here’s the updated Javascript parameterization …


var dtextis='dtext';
var pretherest='';
var newtherest='';
var tmod='';
var colchange='';
var cht=location.search.split('cht=')[1] ? decodeURIComponent(location.search.split('cht=')[1].split('&')[0]) : "v";
if ((cht + ' ').substring(0,1) == 'p' && cht != 'p') { pretherest=cht.substring(1); }
//if ((cht + ' ').substring(0,2) == 'bv' && cht != 'bv') { pretherest=cht.substring(2); if (1 == 1) { cht='bv'; } }
if ((cht + ' ').substring(0,1) == 'bv'.substring(0,1) && cht != 'bv'.substring(0,1)) { pretherest=cht.substring(1); if (1 == 1) { cht='bv'.substring(0,1); } }
if ((cht + ' ').substring(0,1) == 'l' && cht != 'l') { pretherest=cht.substring(1); if (1 == 1) { cht='l'; } }
if ((cht + ' ').substring(0,1) == 'r' && cht != 'r') { pretherest=cht.substring(1); if (1 == 1) { cht='r'; } }
var ccode=location.search.split('chld=')[1] ? decodeURIComponent(location.search.split('chld=')[1].split('&')[0]) : "";
var ctype=location.search.split('type=')[1] ? decodeURIComponent(location.search.split('type=')[1].split('&')[0]) : cht;
var cname=(ctype == 'v' ? 'Venn Chart' : (ctype == 's' ? 'Scatter Chart' : (ctype == 'gv' ? 'GraphViz Chart' :
(ctype.substring(0,1) == 'p' ? 'Pie Chart' :
((ctype + ' ').substring(0,2).substring(0,1) == 'bv'.substring(0,1) ? 'Bar Chart' : (ctype.substring(0,1) == 'l' ? 'Line Chart' :
(ctype == 'map' ? 'Map Chart' :
(ctype == 'gom' ? 'Google-O-Meter Chart' :
(ctype == 'r' ? 'Radar Chart' :
'')))))))));
var cencodename=(ctype == 'v' ? 'Venn%20Diagram' : (ctype == 's' ? 'Scatter%20Chart' : (ctype == 'gv' ? 'GraphViz%20Chart' :
(ctype.substring(0,1) == 'p' ? 'Pie%20Chart' :
((ctype + ' ').substring(0,2).substring(0,1) == 'bv'.substring(0,1) ? 'Bar%20Chart' : (ctype.substring(0,1) == 'l' ? 'Line%20Chart' :
(ctype == 'map' ? 'Map%20Chart' :
(ctype == 'gom' ? 'Google-O-Meter%20Chart' :
(ctype == 'r' ? 'Radar%20Chart' :
'')))))))));
var chdt=(ctype == 'v' ? '&chd=t:' : (ctype == 's' ? '&chd=t:' : (ctype == 'gv' ? '&chl=' :
(ctype.substring(0,1) == 'p' ? pretherest + '&chd=t:' :
((ctype + ' ').substring(0,2).substring(0,1) == 'bv'.substring(0,1) ? '&chd=t:' : (ctype.substring(0,1) == 'l' ? '&chd=t:' :
(ctype == 'map' ? '' :
(ctype == 'gom' ? '&chd=t:' :
(ctype == 'r' ? pretherest + '&chd=t:' :
'')))))))));
var chdeq=(ctype == 'v' ? '&chd=' : (ctype == 's' ? '&chd=' : (ctype == 'gv' ? '&chl=' :
(ctype.substring(0,1) == 'p' ? '&chd=' :
((ctype + ' ').substring(0,2).substring(0,1) == 'bv'.substring(0,1) ? '&chd=' : (ctype.substring(0,1) == 'l' ? '&chd=' :
(ctype == 'map' ? '&chld=' :
(ctype == 'gom' ? '&chld=' :
(ctype == 'r' ? '&chd=' :
'')))))))));
var tc=(ctype == 'v' ? 't:' : (ctype == 's' ? 't:' : (ctype == 'gv' ? '' :
(ctype.substring(0,1) == 'p' ? 't:' :
((ctype + ' ').substring(0,2).substring(0,1) == 'bv'.substring(0,1) ? 't:' : (ctype.substring(0,1) == 'l' ? 't:' :
(ctype == 'map' ? '' :
(ctype == 'gom' ? 't:' :
(ctype == 'r' ? 't:' :
'')))))))));
var chdl=(ctype == 'v' ? '&chdl=' : (ctype == 's' ? '&chdl=' : (ctype == 'gv' ? '' :
(ctype.substring(0,1) == 'p' ? '&chdl=' :
((ctype + ' ').substring(0,2).substring(0,1) == 'bv'.substring(0,1) ? '&chbh=' : (ctype.substring(0,1) == 'l' ? '&chbh=' :
(ctype == 'map' ? '' :
(ctype == 'gom' ? '&chdl=' :
(ctype == 'r' ? '&chxt=x&chxl=' :
'')))))))));

var prenchtt=(ctype == 'v' ? '100,80,60,30,30,30,10' : (ctype == 's' ? '12,87,75,41,23,96,68,71,34,9|98,60,27,34,56,79,58,74,18,76|84,23,69,81,47,94,60,93,64,54' : (ctype == 'gv' ? 'graph{C_0--H_0[type=s];C_0--H_1[type=s];C_0--H_2[type=s];C_0--C_1[type=s];C_1--H_3[type=s];C_1--H_4[type=s];C_1--H_5[type=s]}' :
(ctype.substring(0,1) == 'p' ? '1,2,3,4' :
((ctype + ' ').substring(0,2).substring(0,1) == 'bv'.substring(0,1) ? '5,5,5|10,10,10|15,15,15' : (ctype.substring(0,1) == 'l' ? '5,45,5|10,60,10|15,85,15' :
(ctype == 'map' ? '' :
(ctype == 'gom' ? '20,40,60' :
(ctype == 'r' ? '10,20,30,40,50' :
'')))))))));
var preachtt=(ctype == 'v' ? 'A|B|C' : (ctype == 's' ? 'Cats|Dogs' : (ctype == 'gv' ? '' :
(ctype.substring(0,1) == 'p' ? 'January|February|March|April' :
((ctype + ' ').substring(0,2).substring(0,1) == 'bv'.substring(0,1) ? '15,4,15' : (ctype.substring(0,1) == 'l' ? '15,4,15' :
(ctype == 'map' ? '' :
(ctype == 'gom' ? 'A|B|C' :
(ctype == 'r' ? '0:|1|2|3|4|5|6' :
'')))))))));
var defchco=(ctype == 'v' ? 'ff0000,00ff00,0000ff' : (ctype == 's' ? 'FF0000|0000FF&chxt=x,y' : (ctype == 'gv' ? '' :
(ctype.substring(0,1) == 'p' ? 'ff0000,00ff00,0000ff,ff00ff' :
((ctype + ' ').substring(0,2).substring(0,1) == 'bv'.substring(0,1) ? '4D89F9,C6D9FD,C6FDD9&chxt=x,y' : (ctype.substring(0,1) == 'l' ? '3D89F9.B6D9FD,B6FDD9&chxt=x,y' :
(ctype == 'map' ? '' :
(ctype == 'gom' ? 'ff0000,00ff00,0000ff' :
(ctype == 'r' ? 'FF0000,FF9900,ff0a00,00ffb0,000cff' :
'')))))))));

var prechtt=(ctype == 'v' ? chdt + prenchtt + chdl + preachtt : (ctype == 's' ? chdt + prenchtt + chdl + preachtt + '&chxt=x,y' : (ctype == 'gv' ? chdt + prenchtt :
(ctype.substring(0,1) == 'p' ? chdt + prenchtt + chdl + preachtt :
((ctype + ' ').substring(0,2).substring(0,1) == 'bv'.substring(0,1) ? chdt + prenchtt + chdl + preachtt : (ctype.substring(0,1) == 'l' ? chdt + prenchtt + chdl + preachtt :
(ctype == 'map' ? '' :
(ctype == 'gom' ? chdt + prenchtt + chdl + preachtt :
(ctype == 'r' ? chdt + prenchtt + chdl + preachtt :
'')))))))));
var promptone=(ctype == 'v' ? "Enter delimited values string for Venn Diagram such that ... " + String.fromCharCode(10) + "The first three values specify the sizes of three circles: A, B, & C. For chart with only two circles, specify zero for the third value." + String.fromCharCode(10) + "The fourth value specifies the size of the intersection of A and B." + String.fromCharCode(10) + "The fifth value specifies the size of the intersection of A and C. For a chart with only two circles, do not specify a value here." + String.fromCharCode(10) + "The sixth value specifies the size of the intersection of B and C. For a chart with only two circles, do not specify a value here." + String.fromCharCode(10) + "The seventh value specifies the size of the common intersection of A, B, and C. For a chart with only two circles, do not specify a value here." + String.fromCharCode(10) + String.fromCharCode(10) + "" : (ctype == 's' ? "Enter delimited values string for Scatter Chart" : (ctype == 'gv' ? "Enter delimited values string for GraphViz Chart" :
(ctype.substring(0,1) == 'p' ? "Enter delimited values string for Pie Chart" :
((ctype + ' ').substring(0,2).substring(0,1) == 'bv'.substring(0,1) ? "Enter v for Vertical or h for Horizontal then one of g for Group or s for Stacked or o for Overlapped Bar Chart look then a space and then enter delimited values string for Bar Chart. Here is a Candlestick and horizontal Bar Chart idea eg. hg 1:20,10,15,25,17,30|0,5,10,7,12,6|35,25,45,47,24,46|15,40,30,27,39,54|70,55,63,59,80,6 Here is a vertical Bar Chart and Box Chart idea vs 1:-1,5,10,7,12,-1|-1,25,30,27,24,-1|-1,40,45,47,39,-1|-1,55,63,59,80,-1|-1,30,40,35,30,-1|-1,-1,5,70,90,-1|-1,-1,-1,80,5,-1&chm=F,FF9900,0,1:4,40|H,0CBF0B,0,1:4,1:20|H,000000,4,1:4,1:40|H,0000FF,3,1:4,1:20|o,FF0000,5,-1,7|o,FF0000,6,-1,7 Prefix just the delimited string you enter by 1: to additionally display Candlestick/Box Charts or by 0: to only display Candlestick/Box Chart" :
(ctype.substring(0,1) == 'l' ? "Enter c for Even or s for Sparklines or xy for Just XY Line Chart look then a space and then enter delimited values string for Line Chart. Here is a Candlestick and Line Chart idea eg. c 1:20,10,15,25,17,30|0,5,10,7,12,6|35,25,45,47,24,46|15,40,30,27,39,54|70,55,63,59,80,6 Here is a Line Chart and Box Chart idea s 1:-1,5,10,7,12,-1|-1,25,30,27,24,-1|-1,40,45,47,39,-1|-1,55,63,59,80,-1|-1,30,40,35,30,-1|-1,-1,5,70,90,-1|-1,-1,-1,80,5,-1&chm=F,FF9900,0,1:4,40|H,0CBF0B,0,1:4,1:20|H,000000,4,1:4,1:40|H,0000FF,3,1:4,1:20|o,FF0000,5,-1,7|o,FF0000,6,-1,7 Prefix just the delimited string you enter by 1: to additionally display Candlestick/Box Charts or by 0: to only display Candlestick/Box Chart" :
(ctype == 'map' ? "" :
(ctype == 'gom' ? "Enter delimited values string for Google-O-Meter Chart" :
(ctype == 'r' ? "Enter delimited values string for Radar Chart but prefix with an s for smooth lines" :
"")))))))));
var oneprompt=(ctype == 'v' ? "Enter delimited values string for your Venn Diagram collaborations, optionally, such that ... " + String.fromCharCode(10) + "The first three values specify the sizes of three circles: A, B, & C. For chart with only two circles, specify zero for the third value." + String.fromCharCode(10) + "The fourth value specifies the size of the intersection of A and B." + String.fromCharCode(10) + "The fifth value specifies the size of the intersection of A and C. For a chart with only two circles, do not specify a value here." + String.fromCharCode(10) + "The sixth value specifies the size of the intersection of B and C. For a chart with only two circles, do not specify a value here." + String.fromCharCode(10) + "The seventh value specifies the size of the common intersection of A, B, and C. For a chart with only two circles, do not specify a value here." + String.fromCharCode(10) + String.fromCharCode(10) + "" : (ctype == 's' ? "Enter delimited values string for Scatter Chart" : (ctype == 'gv' ? "Enter delimited values string for GraphViz Chart" :
(ctype.substring(0,1) == 'p' ? "Enter delimited values string for Pie Chart" :
((ctype + ' ').substring(0,2).substring(0,1) == 'bv'.substring(0,1) ? "Enter g for Grouped or s for Stacked or o for Overlapped Bar Chart look then a space and then enter delimited values string for Bar Chart. Here is a Candlestick and Bar Chart idea eg. g 1:20,10,15,25,17,30|0,5,10,7,12,6|35,25,45,47,24,46|15,40,30,27,39,54|70,55,63,59,80,6 Here is a vertical Bar Chart and Box Chart idea vs 1:-1,5,10,7,12,-1|-1,25,30,27,24,-1|-1,40,45,47,39,-1|-1,55,63,59,80,-1|-1,30,40,35,30,-1|-1,-1,5,70,90,-1|-1,-1,-1,80,5,-1&chm=F,FF9900,0,1:4,40|H,0CBF0B,0,1:4,1:20|H,000000,4,1:4,1:40|H,0000FF,3,1:4,1:20|o,FF0000,5,-1,7|o,FF0000,6,-1,7 Prefix just the delimited string you enter by 1: to additionally display Candlestick/Box Charts or by 0: to only display Candlestick/Box Chart" :
(ctype.substring(0,1) == 'l' ? "Enter c for Even or s for Sparklines or xy for Just XY Line Chart look then a space and then enter delimited values string for Line Chart. Here is a Candlestick and Line Chart idea eg. c 1:20,10,15,25,17,30|0,5,10,7,12,6|35,25,45,47,24,46|15,40,30,27,39,54|70,55,63,59,80,6 Here is a Line Chart and Box Chart idea s 1:-1,5,10,7,12,-1|-1,25,30,27,24,-1|-1,40,45,47,39,-1|-1,55,63,59,80,-1|-1,30,40,35,30,-1|-1,-1,5,70,90,-1|-1,-1,-1,80,5,-1&chm=F,FF9900,0,1:4,40|H,0CBF0B,0,1:4,1:20|H,000000,4,1:4,1:40|H,0000FF,3,1:4,1:20|o,FF0000,5,-1,7|o,FF0000,6,-1,7 Prefix just the delimited string you enter by 1: to additionally display Candlestick/Box Charts or by 0: to only display Candlestick/Box Chart" :
(ctype == 'map' ? "" :
(ctype == 'gom' ? "Enter delimited values string for Google-O-Meter Chart" :
(ctype == 'r' ? "Enter delimited values string for Radar Chart but prefix with an s for smooth lines" :
"")))))))));
var asktwo=(ctype == 'v' ? true : (ctype == 's' ? true : (ctype == 'gv' ? false :
(ctype.substring(0,1) == 'p' ? true :
((ctype + ' ').substring(0,2).substring(0,1) == 'bv'.substring(0,1) ? true : (ctype.substring(0,1) == 'l' ? true :
(ctype == 'map' ? false :
(ctype == 'gom' ? true :
(ctype == 'r' ? true :
false)))))))));

var twopb=(ctype.substring(0,1) == 'p' ? 'Any optional legend or title argument snippets? Optionally prefix by 3 for 3d Pie Chart or by c for Concentric Pie Chart. Eg. 3' + chdl + preachtt + '&chtt=My%20' + cencodename + '&chco=' + defchco : 'Any optional legend or title argument snippets? Eg. ' + chdl + preachtt + '&chtt=My%20' + cencodename + '&chco=' + defchco);
var beforeanswer=(ctype.substring(0,1) == 'l' ? 'c ' : ((ctype + ' ').substring(0,2).substring(0,1) == 'bv'.substring(0,1) ? 'vg ' : ''));


var emsmlist='';

… that goes into helping make the changed latest draft image_venn.html Google Chart Image Chart Venn Chart or Scatter Chart or GraphViz Chart or Pie Chart or Line Chart or Bar Chart or Candlestick/Box Chart or Google-O-Meter Chart or Radar Chart or Map Chart interfacing web application you can also try below, have regular sleepovers on cloud nine.

Did you know?

Did you notice the inclusion of CSS styling …

<style>

#fsangle { background-image: url("data:image/svg+xml;utf8,<svg xmlns='http://www.w3.org/2000/svg' width='24' height='24' viewport='0 0 100 100' style='font-family:Verdana;font-size:10px;'><text y='50%'> \00B0</text></svg>"); background-repeat: no-repeat; background-position: center right; }

</style>

? It styles an input type=number textbox where a placeholder is not really an option to explain a textbox’s purpose, and we do dislike set aside labels, these days. It’s also a way to explain the textbox for mobile users who do not get a hovering message to help. It’s also got an internationalization feel to it, using the degree sign emoji ° (ie. &#176; or that \u0080 UTF-16 Encoding style of definition suitable for CSS styling usage) to both associate the units we’d want, as well as that we are asking for an angle. Clockwise or anticlockwise, alas, comes down to user experience!


Previous relevant Google Chart Image Chart Box Chart Tutorial is shown below.

Google Chart Image Chart Box Chart Tutorial

Google Chart Image Chart Box Chart Tutorial

Today we offer new …

… interfacings, onto the progress up to yesterday’s Google Chart Image Chart Colour Tutorial.

As such, it’s probably timely to update you with the parameterization up the top of the Javascript code …


var pretherest='';
var newtherest='';
var tmod='';
var colchange='';
var cht=location.search.split('cht=')[1] ? decodeURIComponent(location.search.split('cht=')[1].split('&')[0]) : "v";
if ((cht + ' ').substring(0,1) == 'p' && cht != 'p') { pretherest=cht.substring(1); }
//if ((cht + ' ').substring(0,2) == 'bv' && cht != 'bv') { pretherest=cht.substring(2); if (1 == 1) { cht='bv'; } }
if ((cht + ' ').substring(0,1) == 'bv'.substring(0,1) && cht != 'bv'.substring(0,1)) { pretherest=cht.substring(1); if (1 == 1) { cht='bv'.substring(0,1); } }
if ((cht + ' ').substring(0,1) == 'l' && cht != 'l') { pretherest=cht.substring(1); if (1 == 1) { cht='l'; } }
var ccode=location.search.split('chld=')[1] ? decodeURIComponent(location.search.split('chld=')[1].split('&')[0]) : "";
var ctype=location.search.split('type=')[1] ? decodeURIComponent(location.search.split('type=')[1].split('&')[0]) : cht;
var cname=(ctype == 'v' ? 'Venn Chart' : (ctype == 's' ? 'Scatter Chart' : (ctype == 'gv' ? 'GraphViz Chart' :
(ctype.substring(0,1) == 'p' ? 'Pie Chart' :
((ctype + ' ').substring(0,2).substring(0,1) == 'bv'.substring(0,1) ? 'Bar Chart' : (ctype.substring(0,1) == 'l' ? 'Line Chart' :
(ctype == 'map' ? 'Map Chart' :
(ctype == 'gom' ? 'Google-O-Meter Chart' :
''))))))));
var cencodename=(ctype == 'v' ? 'Venn%20Diagram' : (ctype == 's' ? 'Scatter%20Chart' : (ctype == 'gv' ? 'GraphViz%20Chart' :
(ctype.substring(0,1) == 'p' ? 'Pie%20Chart' :
((ctype + ' ').substring(0,2).substring(0,1) == 'bv'.substring(0,1) ? 'Bar%20Chart' : (ctype.substring(0,1) == 'l' ? 'Line%20Chart' :
(ctype == 'map' ? 'Map%20Chart' :
(ctype == 'gom' ? 'Google-O-Meter%20Chart' :
''))))))));
var chdt=(ctype == 'v' ? '&chd=t:' : (ctype == 's' ? '&chd=t:' : (ctype == 'gv' ? '&chl=' :
(ctype.substring(0,1) == 'p' ? pretherest + '&chd=t:' :
((ctype + ' ').substring(0,2).substring(0,1) == 'bv'.substring(0,1) ? '&chd=t:' : (ctype.substring(0,1) == 'l' ? '&chd=t:' :
(ctype == 'map' ? '' :
(ctype == 'gom' ? '&chd=t:' :
''))))))));
var chdeq=(ctype == 'v' ? '&chd=' : (ctype == 's' ? '&chd=' : (ctype == 'gv' ? '&chl=' :
(ctype.substring(0,1) == 'p' ? '&chd=' :
((ctype + ' ').substring(0,2).substring(0,1) == 'bv'.substring(0,1) ? '&chd=' : (ctype.substring(0,1) == 'l' ? '&chd=' :
(ctype == 'map' ? '&chld=' :
(ctype == 'gom' ? '&chdl=' :
''))))))));
var tc=(ctype == 'v' ? 't:' : (ctype == 's' ? 't:' : (ctype == 'gv' ? '' :
(ctype.substring(0,1) == 'p' ? 't:' :
((ctype + ' ').substring(0,2).substring(0,1) == 'bv'.substring(0,1) ? 't:' : (ctype.substring(0,1) == 'l' ? 't:' :
(ctype == 'map' ? '' :
(ctype == 'gom' ? 't:' :
''))))))));
var chdl=(ctype == 'v' ? '&chdl=' : (ctype == 's' ? '&chdl=' : (ctype == 'gv' ? '' :
(ctype.substring(0,1) == 'p' ? '&chdl=' :
((ctype + ' ').substring(0,2).substring(0,1) == 'bv'.substring(0,1) ? '&chbh=' : (ctype.substring(0,1) == 'l' ? '&chbh=' :
(ctype == 'map' ? '' :
(ctype == 'gom' ? '&chdl=' :
''))))))));

var prenchtt=(ctype == 'v' ? '100,80,60,30,30,30,10' : (ctype == 's' ? '12,87,75,41,23,96,68,71,34,9|98,60,27,34,56,79,58,74,18,76|84,23,69,81,47,94,60,93,64,54' : (ctype == 'gv' ? 'graph{C_0--H_0[type=s];C_0--H_1[type=s];C_0--H_2[type=s];C_0--C_1[type=s];C_1--H_3[type=s];C_1--H_4[type=s];C_1--H_5[type=s]}' :
(ctype.substring(0,1) == 'p' ? '1,2,3,4' :
((ctype + ' ').substring(0,2).substring(0,1) == 'bv'.substring(0,1) ? '5,5,5|10,10,10|15,15,15' : (ctype.substring(0,1) == 'l' ? '5,45,5|10,60,10|15,85,15' :
(ctype == 'map' ? '' :
(ctype == 'gom' ? '20,40,60' :
''))))))));
var preachtt=(ctype == 'v' ? 'A|B|C' : (ctype == 's' ? 'Cats|Dogs' : (ctype == 'gv' ? '' :
(ctype.substring(0,1) == 'p' ? 'January|February|March|April' :
((ctype + ' ').substring(0,2).substring(0,1) == 'bv'.substring(0,1) ? '15,4,15' : (ctype.substring(0,1) == 'l' ? '15,4,15' :
(ctype == 'map' ? '' :
(ctype == 'gom' ? 'A|B|C' :
''))))))));
var defchco=(ctype == 'v' ? 'ff0000,00ff00,0000ff' : (ctype == 's' ? 'FF0000|0000FF&chxt=x,y' : (ctype == 'gv' ? '' :
(ctype.substring(0,1) == 'p' ? 'ff0000,00ff00,0000ff,ff00ff' :
((ctype + ' ').substring(0,2).substring(0,1) == 'bv'.substring(0,1) ? '4D89F9,C6D9FD,C6FDD9&chxt=x,y' : (ctype.substring(0,1) == 'l' ? '3D89F9.B6D9FD,B6FDD9&chxt=x,y' :
(ctype == 'map' ? '' :
(ctype == 'gom' ? 'ff0000,00ff00,0000ff' :
''))))))));

var prechtt=(ctype == 'v' ? chdt + prenchtt + chdl + preachtt : (ctype == 's' ? chdt + prenchtt + chdl + preachtt + '&chxt=x,y' : (ctype == 'gv' ? chdt + prenchtt :
(ctype.substring(0,1) == 'p' ? chdt + prenchtt + chdl + preachtt :
((ctype + ' ').substring(0,2).substring(0,1) == 'bv'.substring(0,1) ? chdt + prenchtt + chdl + preachtt : (ctype.substring(0,1) == 'l' ? chdt + prenchtt + chdl + preachtt :
(ctype == 'map' ? '' :
(ctype == 'gom' ? chdt + prenchtt + chdl + preachtt :
''))))))));
var promptone=(ctype == 'v' ? "Enter delimited values string for Venn Diagram such that ... " + String.fromCharCode(10) + "The first three values specify the sizes of three circles: A, B, & C. For chart with only two circles, specify zero for the third value." + String.fromCharCode(10) + "The fourth value specifies the size of the intersection of A and B." + String.fromCharCode(10) + "The fifth value specifies the size of the intersection of A and C. For a chart with only two circles, do not specify a value here." + String.fromCharCode(10) + "The sixth value specifies the size of the intersection of B and C. For a chart with only two circles, do not specify a value here." + String.fromCharCode(10) + "The seventh value specifies the size of the common intersection of A, B, and C. For a chart with only two circles, do not specify a value here." + String.fromCharCode(10) + String.fromCharCode(10) + "" : (ctype == 's' ? "Enter delimited values string for Scatter Chart" : (ctype == 'gv' ? "Enter delimited values string for GraphViz Chart" :
(ctype.substring(0,1) == 'p' ? "Enter delimited values string for Pie Chart" :
((ctype + ' ').substring(0,2).substring(0,1) == 'bv'.substring(0,1) ? "Enter v for Vertical or h for Horizontal then one of g for Group or s for Stacked or o for Overlapped Bar Chart look then a space and then enter delimited values string for Bar Chart. Here is a Candlestick and horizontal Bar Chart idea eg. hg 1:20,10,15,25,17,30|0,5,10,7,12,6|35,25,45,47,24,46|15,40,30,27,39,54|70,55,63,59,80,6 Here is a vertical Bar Chart and Box Chart idea vs 1:-1,5,10,7,12,-1|-1,25,30,27,24,-1|-1,40,45,47,39,-1|-1,55,63,59,80,-1|-1,30,40,35,30,-1|-1,-1,5,70,90,-1|-1,-1,-1,80,5,-1&chm=F,FF9900,0,1:4,40|H,0CBF0B,0,1:4,1:20|H,000000,4,1:4,1:40|H,0000FF,3,1:4,1:20|o,FF0000,5,-1,7|o,FF0000,6,-1,7 Prefix just the delimited string you enter by 1: to additionally display Candlestick/Box Charts or by 0: to only display Candlestick/Box Chart" :
(ctype.substring(0,1) == 'l' ? "Enter c for Even or s for Sparklines or xy for Just XY Line Chart look then a space and then enter delimited values string for Line Chart. Here is a Candlestick and Line Chart idea eg. c 1:20,10,15,25,17,30|0,5,10,7,12,6|35,25,45,47,24,46|15,40,30,27,39,54|70,55,63,59,80,6 Here is a Line Chart and Box Chart idea s 1:-1,5,10,7,12,-1|-1,25,30,27,24,-1|-1,40,45,47,39,-1|-1,55,63,59,80,-1|-1,30,40,35,30,-1|-1,-1,5,70,90,-1|-1,-1,-1,80,5,-1&chm=F,FF9900,0,1:4,40|H,0CBF0B,0,1:4,1:20|H,000000,4,1:4,1:40|H,0000FF,3,1:4,1:20|o,FF0000,5,-1,7|o,FF0000,6,-1,7 Prefix just the delimited string you enter by 1: to additionally display Candlestick/Box Charts or by 0: to only display Candlestick/Box Chart" :
(ctype == 'map' ? "" :
(ctype == 'gom' ? "Enter delimited values string for Google-O-Meter Chart" :
""))))))));
var oneprompt=(ctype == 'v' ? "Enter delimited values string for your Venn Diagram collaborations, optionally, such that ... " + String.fromCharCode(10) + "The first three values specify the sizes of three circles: A, B, & C. For chart with only two circles, specify zero for the third value." + String.fromCharCode(10) + "The fourth value specifies the size of the intersection of A and B." + String.fromCharCode(10) + "The fifth value specifies the size of the intersection of A and C. For a chart with only two circles, do not specify a value here." + String.fromCharCode(10) + "The sixth value specifies the size of the intersection of B and C. For a chart with only two circles, do not specify a value here." + String.fromCharCode(10) + "The seventh value specifies the size of the common intersection of A, B, and C. For a chart with only two circles, do not specify a value here." + String.fromCharCode(10) + String.fromCharCode(10) + "" : (ctype == 's' ? "Enter delimited values string for Scatter Chart" : (ctype == 'gv' ? "Enter delimited values string for GraphViz Chart" :
(ctype.substring(0,1) == 'p' ? "Enter delimited values string for Pie Chart" :
((ctype + ' ').substring(0,2).substring(0,1) == 'bv'.substring(0,1) ? "Enter g for Grouped or s for Stacked or o for Overlapped Bar Chart look then a space and then enter delimited values string for Bar Chart. Here is a Candlestick and Bar Chart idea eg. g 1:20,10,15,25,17,30|0,5,10,7,12,6|35,25,45,47,24,46|15,40,30,27,39,54|70,55,63,59,80,6 Here is a vertical Bar Chart and Box Chart idea vs 1:-1,5,10,7,12,-1|-1,25,30,27,24,-1|-1,40,45,47,39,-1|-1,55,63,59,80,-1|-1,30,40,35,30,-1|-1,-1,5,70,90,-1|-1,-1,-1,80,5,-1&chm=F,FF9900,0,1:4,40|H,0CBF0B,0,1:4,1:20|H,000000,4,1:4,1:40|H,0000FF,3,1:4,1:20|o,FF0000,5,-1,7|o,FF0000,6,-1,7 Prefix just the delimited string you enter by 1: to additionally display Candlestick/Box Charts or by 0: to only display Candlestick/Box Chart" :
(ctype.substring(0,1) == 'l' ? "Enter c for Even or s for Sparklines or xy for Just XY Line Chart look then a space and then enter delimited values string for Line Chart. Here is a Candlestick and Line Chart idea eg. c 1:20,10,15,25,17,30|0,5,10,7,12,6|35,25,45,47,24,46|15,40,30,27,39,54|70,55,63,59,80,6 Here is a Line Chart and Box Chart idea s 1:-1,5,10,7,12,-1|-1,25,30,27,24,-1|-1,40,45,47,39,-1|-1,55,63,59,80,-1|-1,30,40,35,30,-1|-1,-1,5,70,90,-1|-1,-1,-1,80,5,-1&chm=F,FF9900,0,1:4,40|H,0CBF0B,0,1:4,1:20|H,000000,4,1:4,1:40|H,0000FF,3,1:4,1:20|o,FF0000,5,-1,7|o,FF0000,6,-1,7 Prefix just the delimited string you enter by 1: to additionally display Candlestick/Box Charts or by 0: to only display Candlestick/Box Chart" :
(ctype == 'map' ? "" :
(ctype == 'gom' ? "Enter delimited values string for Google-O-Meter Chart" :
""))))))));
var asktwo=(ctype == 'v' ? true : (ctype == 's' ? true : (ctype == 'gv' ? false :
(ctype.substring(0,1) == 'p' ? true :
((ctype + ' ').substring(0,2).substring(0,1) == 'bv'.substring(0,1) ? true : (ctype.substring(0,1) == 'l' ? true :
(ctype == 'map' ? false :
(ctype == 'gom' ? true :
false))))))));

var twopb=(ctype.substring(0,1) == 'p' ? 'Any optional legend or title argument snippets? Optionally prefix by 3 for 3d Pie Chart or by c for Concentric Pie Chart. Eg. 3' + chdl + preachtt + '&chtt=My%20' + cencodename + '&chco=' + defchco : 'Any optional legend or title argument snippets? Eg. ' + chdl + preachtt + '&chtt=My%20' + cencodename + '&chco=' + defchco);
var beforeanswer=(ctype.substring(0,1) == 'l' ? 'c ' : ((ctype + ' ').substring(0,2).substring(0,1) == 'bv'.substring(0,1) ? 'vg ' : ''));

var emsmlist='';

… that goes into helping make the changed latest draft image_venn.html Google Chart Image Chart Venn Chart or Scatter Chart or GraphViz Chart or Pie Chart or Line Chart or Bar Chart or Candlestick/Box Chart or Google-O-Meter Chart or Map Chart interfacing web application you can also try below, one of the happiest little vegemites we know.


Previous relevant Google Chart Image Chart Colour Tutorial is shown below.

Google Chart Image Chart Colour Tutorial

Google Chart Image Chart Colour Tutorial

Restricting you creatives to “inhouse annotations” of the “gray variety” might be seen as a bit boooorrrriiiinnnngggg! And so, onto the progress up to yesterday’s Google Chart Image Chart Rubber Banding Tutorial, today we’ve added a …

  • colour picker … way user can define an “inhouse annotations” colour … and while we were at it …
  • as far as text “inhouse annotations” go we’ve added a counterclockwise from the horizon, in degrees, way to define an angle the text should be placed at … and …
  • we’ve stopped closing off the text font size dropdown too early, allowing the user to mix it up with their annotations, and so …

    We now recommend, for those users pushing the boundaries of functionality, to gather all their “inhouse annotations” together before any “graphical canvas annotations” are thought about.

Which begs the question …

Where do you get it?

Well, here, via … dare we say it?! … … via …

Mantissa Madness Monday

Both colour and degree counterclockwise angle became “Mantissa Madness Monday” tragics, a bit like moi, really?

How did we express these two measures?

  • colour can be derived at the 404.php end via mantissae that are 9 or more long where a number of the form rrrgggbbb is numerical and passed across to 404.php in the y co-ordinate mantissa … while … kind of crazily …
  • angle can be a set of zeros in the x co-ordinate mantissa represented by zero characters to the length of the angle from 1 to 359 in front of a pre-existant font size (in px) usage, from last “Mantissa Madness Monday” (us getting away with this because no font size should start with a zero)

Oh! We have such fun around here?! Below is PHP WordPress blog 404.php code …

<?php

// text placement
$black = imagecolorallocatealpha($im, 1, 1, 1, 0);
$blackish = imagecolorallocatealpha($im, 127, 127, 127, 64);
$yis=$csv[1];
$mantissae=explode('.', ('' . $csv[1]));
if (sizeof($mantissae) > 1) {
if (strlen($mantissae[1]) >= 9) {
$black = imagecolorallocatealpha($im, intval(substr($mantissae[1],0,3)), intval(substr(substr($mantissae[1],3),0,3)), intval(substr(substr($mantissae[1],6),0,3)), 0);
$blackish = imagecolorallocatealpha($im, intval(substr($mantissae[1],0,3)), intval(substr(substr($mantissae[1],3),0,3)), intval(substr(substr($mantissae[1],6),0,3)), 64);
}
$yis=$mantissae[0];
}

$za=0;
$xis=$csv[0];

$mantissae=explode('.', ('' . $csv[0]));
if (sizeof($mantissae) > 1) {
if (substr($mantissae[1],0,1) == '0') {
if (str_replace('0','',$mantissae[1]) != '') {
while (substr($mantissae[1],0,1) == '0') {
$za++;
$mantiss=substr($mantissae[1],1);
$mantissae[1]=$mantiss;
}
}
}

$tenpx=$mantissae[1];
$xis=$mantissae[0];
}
try {
if (function_exists('imagettftext')) {
if (explode('' . $csv[0] . ',' . $csv[1] . ',', $plotstring)[1] !== '') {
//echo explode('' . $csv[0] . ',' . $csv[1] . ',', $plotstring)[1];
//exit;
imagettftext($im, $tenpx, $za, $xis, $yis, $black, realpath('arial.ttf'), explode('' . $csv[0] . ',' . $csv[1] . ',', $plotstring)[1]);
}
}
} catch (Exception $e) { }

?>

… used by our changed latest draft image_venn.html Google Chart Image Chart Venn Chart or Scatter Chart or GraphViz Chart or Pie Chart or Line Chart or Bar Chart or Candlestick Chart or Map Chart interfacing web application you can also try below.


Previous relevant Google Chart Image Chart Rubber Banding Tutorial is shown below.

Google Chart Image Chart Rubber Banding Tutorial

Google Chart Image Chart Rubber Banding Tutorial

The Javascript clientside idea of “Rubber Banding”

Rubber banding is a popular technique of drawing geometric primitives such as line, polylines, rectangle, circle and ellipse on the computer screen.

… really appeals to our “inner programmer” … damn! … come, thou, out into the open, reveal thyself! … the sunshine is wonderful down here, and we’ve done away with death duties! … mostly! but it is …

  • only really a non-mobile prospect …

    function checkforaction(rubberbanding,nx,ny) {
    var bcbit='background-color:rgba(127,127,127,0.5);';
    var zeroes='';
    var classbit='';
    var brbit='';
    var ourdist=0;
    var ioff=(rubberbanding == true ? 1 : 0);
    var mone=1;

    curno=eval('' + xneeds.length);
    if (eval(ioff + curno) >= needtohave) {
    if (!rubberbanding) {
    document.getElementById('fauxdtext').innerHTML='';
    }
    if (curmode == 8) {
    zeroes='00000000';
    classbit=' class="crerect" ';
    } else if (curmode == -5) {
    //alert(1);
    bcbit='border:2px solid rgba(127,127,127,0.5);';
    if (rubberbanding) {
    ourdist=eval(2.0 * Math.sqrt((nx - xneeds[0]) * (nx - xneeds[0]) + (ny - yneeds[0]) * (ny - yneeds[0])));
    ourdist-=10;
    bcbit='border:2px solid gray;background-color:transparent;';
    } else {
    ourdist=eval(2.0 * Math.sqrt((xneeds[1] - xneeds[0]) * (xneeds[1] - xneeds[0]) + (yneeds[1] - yneeds[0]) * (yneeds[1] - yneeds[0])));
    }
    //alert(ourdist);
    //xneeds[1]=Math.floor('' + ourdist);
    //yneeds[1]=xneeds[1];
    brbit='border-radius:' + Math.floor(eval(ourdist / 2)) + 'px;';
    zeroes='00000';
    classbit=' class="ocirc" ';
    //alert('open circle');
    } else if (curmode == 6) {
    if (rubberbanding) {
    ourdist=eval(2.0 * Math.sqrt((nx - xneeds[0]) * (nx - xneeds[0]) + (ny - yneeds[0]) * (ny - yneeds[0])));
    ourdist-=10;
    } else {
    ourdist=eval(2.0 * Math.sqrt((xneeds[1] - xneeds[0]) * (xneeds[1] - xneeds[0]) + (yneeds[1] - yneeds[0]) * (yneeds[1] - yneeds[0])));
    }
    //xneeds[1]=Math.floor('' + ourdist);
    //yneeds[1]=xneeds[1];
    brbit='border-radius:' + Math.floor(eval(ourdist / 2)) + 'px;';
    //bcbit='border:2px solid rgba(127,127,127,0.5);';
    zeroes='000000';
    classbit=' class="ccirc" ';
    //alert('closed circle ' + bcbit);
    } else if (curmode == -4) {
    if (rubberbanding) {
    mone=0.90;
    bcbit='border:2px solid gray;background-color:transparent;';
    } else {
    bcbit='border:2px solid rgba(127,127,127,0.5);';
    }
    zeroes='00';
    classbit=' class="orect" ';
    } else if (curmode == 2) {
    zeroes='0';
    if (rubberbanding) {
    if (Math.min(xneeds[0],nx) == xneeds[0] && Math.min(yneeds[0],ny) == ny) { // thanks to https://stackoverflow.com/questions/18012420/draw-diagonal-lines-in-div-background-with-css
    classbit=' class="crossedtotl" ';
    } else if (Math.min(xneeds[0],nx) == nx && Math.min(yneeds[0],ny) == yneeds[0]) { // thanks to https://stackoverflow.com/questions/18012420/draw-diagonal-lines-in-div-background-with-css
    classbit=' class="crossedtotl" ';
    } else {
    classbit=' class="crossedtotr" ';
    }
    } else {
    if (Math.min(xneeds[0],xneeds[1]) == xneeds[0] && Math.min(yneeds[0],yneeds[1]) == yneeds[1]) { // thanks to https://stackoverflow.com/questions/18012420/draw-diagonal-lines-in-div-background-with-css
    classbit=' class="crossedtotl" ';
    } else if (Math.min(xneeds[0],xneeds[1]) == xneeds[1] && Math.min(yneeds[0],yneeds[1]) == yneeds[0]) { // thanks to https://stackoverflow.com/questions/18012420/draw-diagonal-lines-in-div-background-with-css
    classbit=' class="crossedtotl" ';
    } else {
    classbit=' class="crossedtotr" ';
    }
    }
    bcbit='';
    } else if (curmode == 4) {
    if (rubberbanding) {
    mone=0.90;
    }
    zeroes='0000';
    classbit=' class="crect" ';
    }
    if (!rubberbanding) {
    curno=-1;
    //if (brbit != '') {
    //document.getElementById('dtext').innerHTML+='<div' + classbit + ' style="' + brbit + 'position:absolute;left:' + Math.min(xneeds[0],nx) + 'px;top:' + Math.min(yneeds[0],ny) + 'px;width:' + Math.abs(xneeds[0] - nx) + 'px;height:' + Math.abs(yneeds[0] - ny) + 'px;z-index:98;' + bcbit + '"></div>';
    //} else {
    //document.getElementById('dtext').innerHTML+='<div' + classbit + ' style="' + brbit + 'position:absolute;left:' + Math.min(xneeds[0],xneeds[1]) + 'px;top:' + Math.min(yneeds[0],yneeds[1]) + 'px;width:' + Math.abs(xneeds[0] - xneeds[1]) + 'px;height:' + Math.abs(yneeds[0] - yneeds[1]) + 'px;z-index:98;' + bcbit + '"></div>';
    //}
    document.getElementById('aemail').href+='&text' + textnum + '=' + encodeURIComponent('' + xneeds[0] + '.' + zeroes + xneeds[1] + ',' + yneeds[0] + '.' + yneeds[1] + ',') + '';
    document.getElementById('asms').href+='&text' + textnum + '=' + encodeURIComponent('' + xneeds[0] + '.' + zeroes + xneeds[1] + ',' + yneeds[0] + '.' + yneeds[1] + ',') + '';
    aemailurl+='&text' + textnum + '=' + encodeURIComponent('' + xneeds[0] + '.' + zeroes + xneeds[1] + ',' + yneeds[0] + '.' + yneeds[1] + ',') + '';
    asmsurl+='&text' + textnum + '=' + encodeURIComponent('' + xneeds[0] + '.' + zeroes + xneeds[1] + ',' + yneeds[0] + '.' + yneeds[1] + ',') + '';
    arest+='&text' + textnum + '=' + encodeURIComponent('' + xneeds[0] + '.' + zeroes + xneeds[1] + ',' + yneeds[0] + '.' + yneeds[1] + ',') + '';
    }
    if (brbit != '') {
    //alert('brbit=' + brbit);
    //xneeds[0]-=(xneeds[1] - xneeds[0]);
    //yneeds[0]-=(yneeds[1] - yneeds[0]);
    //alert('xneeds[0]=' + xneeds[0]);
    if (rubberbanding) {
    document.getElementById('fauxdtext').innerHTML='<div' + classbit + ' style="' + brbit + 'z-index:-89;position:absolute;left:' + Math.floor(eval(Math.min(xneeds[0],xneeds[0]) - ourdist / 2)) + 'px;top:' + Math.floor(eval(Math.min(yneeds[0],yneeds[0]) - ourdist / 2)) + 'px;width:' + ourdist + 'px;height:' + ourdist + 'px;z-index:98;' + bcbit + '"></div>';
    } else {
    document.getElementById('dtext').innerHTML+='<div' + classbit + ' style="' + brbit + 'position:absolute;left:' + Math.floor(eval(Math.min(xneeds[0],xneeds[0]) - ourdist / 2)) + 'px;top:' + Math.floor(eval(Math.min(yneeds[0],yneeds[0]) - ourdist / 2)) + 'px;width:' + ourdist + 'px;height:' + ourdist + 'px;z-index:98;' + bcbit + '"></div>';
    }
    } else {
    if (rubberbanding) {
    document.getElementById('fauxdtext').innerHTML='<div' + classbit + ' style="' + brbit + 'z-index:-89;position:absolute;left:' + Math.min(xneeds[0],nx) + 'px;top:' + Math.min(yneeds[0],ny) + 'px;width:' + Math.max(Math.floor(eval(-30 + Math.abs(xneeds[0] - nx))),Math.floor(eval(mone * Math.abs(xneeds[0] - nx)))) + 'px;height:' + Math.max(Math.floor(eval(-30 + Math.abs(yneeds[0] - ny))),Math.floor(eval(mone * Math.abs(yneeds[0] - ny)))) + 'px;z-index:98;' + bcbit + '"></div>';
    } else {
    document.getElementById('dtext').innerHTML+='<div' + classbit + ' style="' + brbit + 'position:absolute;left:' + Math.min(xneeds[0],xneeds[1]) + 'px;top:' + Math.min(yneeds[0],yneeds[1]) + 'px;width:' + Math.abs(xneeds[0] - xneeds[1]) + 'px;height:' + Math.abs(yneeds[0] - yneeds[1]) + 'px;z-index:98;' + bcbit + '"></div>';
    }
    }
    if (!rubberbanding) {
    textnum++;
    xneeds=[];
    yneeds=[];
    //alert('arest=' + arest);
    document.getElementById('tdright').innerHTML="  <span id=spemail><a target=_blank href='mailto:?subject=My%20" + cencodename + "%20...%20best%20viewed%20in%20landscape%20...&body=" + encodeURIComponent((document.getElementById('myvenn').src + arest).replace((document.getElementById('myvenn').src + arest).split('?')[0].split('#')[0], document.URL.split('?')[0].split('#')[0])) + "' id=aemail title=Email>&#128231;</a></span>      <span id=spsms><a target=_blank onmouseover=\"if (smsee.length == 0 && origsmsurl.indexOf('sms:&') != -1) { smsee=prompt('Please enter SMS number to send to.', ''); if (smsee == null) { smsee=''; } else { origsmsurl=origsmsurl.replace('sms:&','sms:' + smsee + '&'); asmsurl=asmsurl.replace('sms:&','sms:' + smsee + '&'); this.href=asmsurl; } }\" ontouchstart=\"if (smsee.length == 0 && origsmsurl.indexOf('sms:&') != -1) { smsee=prompt('Please enter SMS number to send to.', ''); if (smsee == null) { smsee=''; } else { origsmsurl=origsmsurl.replace('sms:&','sms:' + smsee + '&'); asmsurl=asmsurl.replace('sms:&','sms:' + smsee + '&'); this.href=asmsurl; } }\" href='sms:&body=" + encodeURIComponent((document.getElementById('myvenn').src + arest).replace(document.getElementById('myvenn').src.split('?')[0].split('#')[0], document.URL.split('?')[0].split('#')[0])) + "' id=asms title=SMS>&#128223;</a></span><br><br>  <input title=\"\" onclick=\"event.stopPropagation();\" id=ilp onblur=\"waitfortwo(0); lasttext=this.value.replace(/\~\~/g, '<br>'); this.title=lasttext; if (!navigator.userAgent.match(/Android|BlackBerry|iPhone|iPad|iPod|Opera Mini|IEMobile/i)) { this.value=''; } this.placeholder='Click where you want ... ' + lasttext.replace(/\<br\>/g, String.fromCharCode(10)); mvp.setAttribute('content','initial-scale=1'); document.getElementById('myvenn').scrollIntoView();\" placeholder='Enter text and later click place for it on " + decodeURIComponent(cencodename) + " to left (line feed is ~~)' type=text style=width:500px; value=''></input>" + fszbit + "<br><br>  <img id=line src='/MarkItUp/line.png' onclick=\"event.stopPropagation(); this.style.border='1px dotted red'; waitfortwo(2);\"></img>  <img id=rectangle src='/MarkItUp/rectangle.png' onclick=\"event.stopPropagation(); this.style.border='1px dotted red'; waitfortwo(4);\"></img>  <img id=orectangle src='/MarkItUp/orectangle.png' onclick=\"event.stopPropagation(); this.style.border='1px dotted red'; waitfortwo(-4);\"></img>  <img id=circle src='/MarkItUp/circlefill.png' onclick=\"event.stopPropagation(); this.style.border='1px dotted red'; waitfortwo(6);\"></img>  <img id=ocircle src='/MarkItUp/circle.png' onclick=\"event.stopPropagation(); this.style.border='1px dotted red'; waitfortwo(-5);\"></img>  <button id=orerect onclick=\"event.stopPropagation(); this.style.border='1px dotted red'; waitfortwo(8);\" title=\"Zoom in on rectangle you define via two clicks\" style=display:none;>&#128270;</button>" + lastbit + atend;
    //alert(1);
    if (!navigator.userAgent.match(/Android|BlackBerry|iPhone|iPad|iPod|Opera Mini|IEMobile/i)) { document.getElementById('ilp').focus(); }
    document.getElementById('ilp').placeholder='Enter text and later click place for it on ' + decodeURIComponent(cencodename) + ' to left (line feed is ~~)';
    }
    } else if (curmode == 2 && !rubberbanding) {
    document.getElementById('line').style.border='1px dashed yellow';
    } else if (curmode == -4 && !rubberbanding) {
    document.getElementById('orectangle').style.border='1px dashed yellow';
    } else if (curmode == 4 && !rubberbanding) {
    document.getElementById('rectangle').style.border='1px dashed yellow';
    } else if (curmode == -5 && !rubberbanding) {
    document.getElementById('ocircle').style.border='1px dashed yellow';
    } else if (curmode == 6 && !rubberbanding) {
    document.getElementById('circle').style.border='1px dashed yellow';
    } else if (curmode == 8 && !rubberbanding) {
    document.getElementById('orerect').style.border='1px dashed yellow';
    }
    }

    // Rubber banding
    document.body.addEventListener('mousemove', function(evt){
    evt = evt || window.event;

    evt.preventDefault();

    elemLeft = document.getElementById('myvenn').offsetLeft;
    elemTop = document.getElementById('myvenn').offsetTop;

    //document.getElementById('myh3').innerHTML+=' ' + elemLeft + ':' + elemTop;
    //document.getElementById('myh3').innerHTML+=' ' + document.body.scrollLeft + '.' + document.body.scrollTop;

    if (evt.touches) {
    if (evt.touches[0].pageX) {
    //alert('here');
    xx = evt.touches[0].pageX + document.body.scrollLeft - elemLeft;
    yy = evt.touches[0].pageY + document.body.scrollTop - elemTop;
    if (xx >= 0 && xx <= eval(('' + document.getElementById('myvenn').width).replace('px','')) && yy >= 0 && yy <= eval(('' + document.getElementById('myvenn').height).replace('px',''))) {
    if (curno == 1 && (lastx != xx || lasty != yy)) {
    checkforaction(true,xx,yy);
    }
    //lastx=xx;
    //lasty=yy;
    //alert('x:' + x + ' and y:' + y);
    }
    } else {
    //alert('Here');
    xx = evt.touches[0].clientX + document.body.scrollLeft - elemLeft;
    yy = evt.touches[0].clientY + document.body.scrollTop - elemTop;
    if (xx >= 0 && xx <= eval(('' + document.getElementById('myvenn').width).replace('px','')) && yy >= 0 && yy <= eval(('' + document.getElementById('myvenn').height).replace('px',''))) {
    if (curno == 1 && (lastx != xx || lasty != yy)) {
    checkforaction(true,xx,yy);
    }
    //lastx=xx;
    //lasty=yy;
    //alert('x:' + x + ' and y:' + y);
    }
    }
    } else if (evt.clientX || ev.clientY) {
    //alert('HERE');
    xx = evt.clientX + document.body.scrollLeft - elemLeft;
    yy = evt.clientY + document.body.scrollTop - elemTop;
    if (xx >= 0 && xx <= eval(('' + document.getElementById('myvenn').width).replace('px','')) && yy >= 0 && yy <= eval(('' + document.getElementById('myvenn').height).replace('px',''))) {
    if (curno == 1 && (lastx != xx || lasty != yy)) {
    checkforaction(true,xx,yy);
    }
    //lastx=xx;
    //lasty=yy;
    }
    } else {
    //alert('HEre');
    xx = evt.pageX + document.body.scrollLeft - elemLeft;
    yy = evt.pageY + document.body.scrollTop - elemTop;
    if (xx >= 0 && xx <= eval(('' + document.getElementById('myvenn').width).replace('px','')) && yy >= 0 && yy <= eval(('' + document.getElementById('myvenn').height).replace('px',''))) {
    if (curno == 1 && (lastx != xx || lasty != yy)) {
    checkforaction(true,xx,yy);
    }
    //lastx=xx;
    //lasty=yy;
    }
    }
    });

    … at least for us (being as we do not want to clobber any pinch or spread gesture ideas, for the user)
  • is only a really, “nice to have” functionality idea

Even so, achieving even a 95% percent working “rubber band” is like … is like …

Barracking for Hairtie United …
You little beauty, Untied!

And so, further to yesterday’s Google Chart Image Chart Circle Annotation Tutorial we have this non-mobile “Rubber Banding” inhouse annotation functionality included in our changed latest draft image_venn.html Google Chart Image Chart Venn Chart or Scatter Chart or GraphViz Chart or Pie Chart or Line Chart or Bar Chart or Candlestick Chart or Map Chart interfacing web application you can also try below.

But there’s more! Despite how long out of the day it takes to barrack for Hairtie United, there was a mobile matter we resolved. A slide in today’s animated GIF presentation shows the issue. On mobile platforms, with these inhouse annotations, it would immediately show a tiny annotation. There panned out to be two event programming related issues we needed to fix related to this problem …

  1. change looking for a “touchstart” event, and instead look for a “touchdown” event for a document.body scope (else we might have restricted the “scope” to just document.getEleementById(‘myvenn’) as another approach (and you should note our event.stopPropagation() statements in lots of places as another research point for you)) because we are talking “discrete click” user behaviour we are targeting … as well as …
  2. start checking that the co-ordinates calculated fall into the range of the Google Charts Image Chart image dimensions … doh!


document.body.addEventListener('touchdown', function(evt){
//alert(8);
evt = evt || window.event;

evt.preventDefault();

elemLeft = document.getElementById('myvenn').offsetLeft;
elemTop = document.getElementById('myvenn').offsetTop;

//document.getElementById('myh3').innerHTML+=' ' + elemLeft + ';' + elemTop;

if (evt.touches) {
if (evt.touches[0].pageX) {
//alert('here');
x = evt.touches[0].pageX + document.body.scrollLeft - elemLeft;
y = evt.touches[0].pageY + document.body.scrollTop - elemTop;
if (x >= 0 && x <= eval(('' + document.getElementById('myvenn').width).replace('px','')) && y >= 0 && y <= eval(('' + document.getElementById('myvenn').height).replace('px',''))) {
if (curno >= 0 && (lastx != x || lasty != y)) {
xneeds.push(x);
yneeds.push(y);
checkforaction(false,-1,-1);
}
lastx=x;
lasty=y;
}
//alert('x:' + x + ' and y:' + y);
} else {
//alert('Here');
x = evt.touches[0].clientX + document.body.scrollLeft - elemLeft;
y = evt.touches[0].clientY + document.body.scrollTop - elemTop;
if (x >= 0 && x <= eval(('' + document.getElementById('myvenn').width).replace('px','')) && y >= 0 && y <= eval(('' + document.getElementById('myvenn').height).replace('px',''))) {
if (curno >= 0 && (lastx != x || lasty != y)) {
xneeds.push(x);
yneeds.push(y);
checkforaction(false,-1,-1);
}
lastx=x;
lasty=y;
}
//alert('x:' + x + ' and y:' + y);
}
} else if (evt.clientX || ev.clientY) {
//alert('HERE');
x = evt.clientX + document.body.scrollLeft - elemLeft;
y = evt.clientY + document.body.scrollTop - elemTop;
if (x >= 0 && x <= eval(('' + document.getElementById('myvenn').width).replace('px','')) && y >= 0 && y <= eval(('' + document.getElementById('myvenn').height).replace('px',''))) {
if (curno >= 0 && (lastx != x || lasty != y)) {
xneeds.push(x);
yneeds.push(y);
checkforaction(false,-1,-1);
}
lastx=x;
lasty=y;
}
} else {
//alert('HEre');
x = evt.pageX + document.body.scrollLeft - elemLeft;
y = evt.pageY + document.body.scrollTop - elemTop;
if (x >= 0 && x <= eval(('' + document.getElementById('myvenn').width).replace('px','')) && y >= 0 && y <= eval(('' + document.getElementById('myvenn').height).replace('px',''))) {
if (curno >= 0 && (lastx != x || lasty != y)) {
xneeds.push(x);
yneeds.push(y);
checkforaction(false,-1,-1);
}
lastx=x;
lasty=y;
}
}
});

Did you know?

Well … we didn’t?! We happened to try the web application above on a tiny iPad and saw that HTML button elements with an innerHTML label containing a line feed ( ie. <br> ) only showed the top line, and, alas, for that button in question, the vital new information used to be on the second line. Hence our fix …


//document.getElementById('bshare').innerHTML='Repainting Top Left Image Periodically ... <br>Click here to Broadcast this session to other interested parties ...';
document.getElementById('bshare').innerHTML='Click here to Broadcast this session to other interested parties ...<br>Repainting Top Left Image Periodically ...';


Previous relevant Google Chart Image Chart Circle Annotation Tutorial is shown below.

Google Chart Image Chart Circle Annotation Tutorial

Google Chart Image Chart Circle Annotation Tutorial

Today, we add …

  • open circle
  • filled circle

… annotation possibilities onto the “Broadcast Talk” work in yesterday’s Google Chart Image Chart Broadcast Talk Context Tutorial.

The CSS border-radius property has come to the rescue of many a programmer, saving us from resorting to SVG to display circle or ellipses or arcs of various sorts …


function checkforaction() {
var bcbit='background-color:rgba(127,127,127,0.5);';
var zeroes='';
var classbit='';
var brbit='';
var ourdist=0;


curno=eval('' + xneeds.length);
if (curno >= needtohave) {
if (curmode == 8) {
zeroes='00000000';
classbit=' class="crerect" ';
} else if (curmode == -5) {
//alert(1);
ourdist=eval(2.0 * Math.sqrt((xneeds[1] - xneeds[0]) * (xneeds[1] - xneeds[0]) + (yneeds[1] - yneeds[0]) * (yneeds[1] - yneeds[0])));
//alert(ourdist);
//xneeds[1]=Math.floor('' + ourdist);
//yneeds[1]=xneeds[1];
brbit='border-radius:' + Math.floor(eval(ourdist / 2)) + 'px;';
bcbit='border:2px solid rgba(127,127,127,0.5);';
zeroes='00000';
classbit=' class="ocirc" ';
//alert('open circle');
} else if (curmode == 6) {
ourdist=eval(2.0 * Math.sqrt((xneeds[1] - xneeds[0]) * (xneeds[1] - xneeds[0]) + (yneeds[1] - yneeds[0]) * (yneeds[1] - yneeds[0])));
//xneeds[1]=Math.floor('' + ourdist);
//yneeds[1]=xneeds[1];
brbit='border-radius:' + Math.floor(eval(ourdist / 2)) + 'px;';
//bcbit='border:2px solid rgba(127,127,127,0.5);';
zeroes='000000';
classbit=' class="ccirc" ';
//alert('closed circle ' + bcbit);
}
else if (curmode == -4) {
bcbit='border:2px solid rgba(127,127,127,0.5);';
zeroes='00';
classbit=' class="orect" ';
} else if (curmode == 2) {
zeroes='0';
if (Math.min(xneeds[0],xneeds[1]) == xneeds[0] && Math.min(yneeds[0],yneeds[1]) == yneeds[1]) { // thanks to https://stackoverflow.com/questions/18012420/draw-diagonal-lines-in-div-background-with-css
classbit=' class="crossedtotl" ';
} else if (Math.min(xneeds[0],xneeds[1]) == xneeds[1] && Math.min(yneeds[0],yneeds[1]) == yneeds[0]) { // thanks to https://stackoverflow.com/questions/18012420/draw-diagonal-lines-in-div-background-with-css
classbit=' class="crossedtotl" ';
} else {
classbit=' class="crossedtotr" ';
}
bcbit='';
} else if (curmode == 4) {
zeroes='0000';
classbit=' class="crect" ';
}
curno=-1;
//if (brbit != '') {
//document.getElementById('dtext').innerHTML+='<div' + classbit + ' style="' + brbit + 'position:absolute;left:' + Math.min(xneeds[0],xneeds[1]) + 'px;top:' + Math.min(yneeds[0],yneeds[1]) + 'px;width:' + Math.abs(xneeds[0] - xneeds[1]) + 'px;height:' + Math.abs(yneeds[0] - yneeds[1]) + 'px;z-index:98;' + bcbit + '"></div>';
//} else {
//document.getElementById('dtext').innerHTML+='<div' + classbit + ' style="' + brbit + 'position:absolute;left:' + Math.min(xneeds[0],xneeds[1]) + 'px;top:' + Math.min(yneeds[0],yneeds[1]) + 'px;width:' + Math.abs(xneeds[0] - xneeds[1]) + 'px;height:' + Math.abs(yneeds[0] - yneeds[1]) + 'px;z-index:98;' + bcbit + '"></div>';
//}
document.getElementById('aemail').href+='&text' + textnum + '=' + encodeURIComponent('' + xneeds[0] + '.' + zeroes + xneeds[1] + ',' + yneeds[0] + '.' + yneeds[1] + ',') + '';
document.getElementById('asms').href+='&text' + textnum + '=' + encodeURIComponent('' + xneeds[0] + '.' + zeroes + xneeds[1] + ',' + yneeds[0] + '.' + yneeds[1] + ',') + '';
aemailurl+='&text' + textnum + '=' + encodeURIComponent('' + xneeds[0] + '.' + zeroes + xneeds[1] + ',' + yneeds[0] + '.' + yneeds[1] + ',') + '';
asmsurl+='&text' + textnum + '=' + encodeURIComponent('' + xneeds[0] + '.' + zeroes + xneeds[1] + ',' + yneeds[0] + '.' + yneeds[1] + ',') + '';
arest+='&text' + textnum + '=' + encodeURIComponent('' + xneeds[0] + '.' + zeroes + xneeds[1] + ',' + yneeds[0] + '.' + yneeds[1] + ',') + '';
if (brbit != '') {
//alert('brbit=' + brbit);
//xneeds[0]-=(xneeds[1] - xneeds[0]);
//yneeds[0]-=(yneeds[1] - yneeds[0]);
//alert('xneeds[0]=' + xneeds[0]);
document.getElementById('dtext').innerHTML+='<div' + classbit + ' style="' + brbit + 'position:absolute;left:' + Math.floor(eval(Math.min(xneeds[0],xneeds[0]) - ourdist / 2)) + 'px;top:' + Math.floor(eval(Math.min(yneeds[0],yneeds[0]) - ourdist / 2)) + 'px;width:' + ourdist + 'px;height:' + ourdist + 'px;z-index:98;' + bcbit + '"></div>';
} else {

document.getElementById('dtext').innerHTML+='<div' + classbit + ' style="' + brbit + 'position:absolute;left:' + Math.min(xneeds[0],xneeds[1]) + 'px;top:' + Math.min(yneeds[0],yneeds[1]) + 'px;width:' + Math.abs(xneeds[0] - xneeds[1]) + 'px;height:' + Math.abs(yneeds[0] - yneeds[1]) + 'px;z-index:98;' + bcbit + '"></div>';
}
textnum++;
xneeds=[];
yneeds=[];
//alert('arest=' + arest);
document.getElementById('tdright').innerHTML="  <span id=spemail><a target=_blank href='mailto:?subject=My%20" + cencodename + "%20...%20best%20viewed%20in%20landscape%20...&body=" + encodeURIComponent((document.getElementById('myvenn').src + arest).replace((document.getElementById('myvenn').src + arest).split('?')[0].split('#')[0], document.URL.split('?')[0].split('#')[0])) + "' id=aemail title=Email>&#128231;</a></span>      <span id=spsms><a target=_blank onmouseover=\"if (smsee.length == 0 && origsmsurl.indexOf('sms:&') != -1) { smsee=prompt('Please enter SMS number to send to.', ''); if (smsee == null) { smsee=''; } else { origsmsurl=origsmsurl.replace('sms:&','sms:' + smsee + '&'); asmsurl=asmsurl.replace('sms:&','sms:' + smsee + '&'); this.href=asmsurl; } }\" ontouchstart=\"if (smsee.length == 0 && origsmsurl.indexOf('sms:&') != -1) { smsee=prompt('Please enter SMS number to send to.', ''); if (smsee == null) { smsee=''; } else { origsmsurl=origsmsurl.replace('sms:&','sms:' + smsee + '&'); asmsurl=asmsurl.replace('sms:&','sms:' + smsee + '&'); this.href=asmsurl; } }\" href='sms:&body=" + encodeURIComponent((document.getElementById('myvenn').src + arest).replace(document.getElementById('myvenn').src.split('?')[0].split('#')[0], document.URL.split('?')[0].split('#')[0])) + "' id=asms title=SMS>&#128223;</a></span><br><br>  <input title=\"\" onclick=\"event.stopPropagation();\" id=ilp onblur=\"waitfortwo(0); lasttext=this.value.replace(/\~\~/g, '<br>'); this.title=lasttext; if (!navigator.userAgent.match(/Android|BlackBerry|iPhone|iPad|iPod|Opera Mini|IEMobile/i)) { this.value=''; } this.placeholder='Click where you want ... ' + lasttext.replace(/\<br\>/g, String.fromCharCode(10)); mvp.setAttribute('content','initial-scale=1'); document.getElementById('myvenn').scrollIntoView();\" placeholder='Enter text and later click place for it on " + decodeURIComponent(cencodename) + " to left (line feed is ~~)' type=text style=width:500px; value=''></input>" + fszbit + "<br><br>  <img id=line src='/MarkItUp/line.png' onclick=\"event.stopPropagation(); this.style.border='1px dotted red'; waitfortwo(2);\"></img>  <img id=rectangle src='/MarkItUp/rectangle.png' onclick=\"event.stopPropagation(); this.style.border='1px dotted red'; waitfortwo(4);\"></img>  <img id=orectangle src='/MarkItUp/orectangle.png' onclick=\"event.stopPropagation(); this.style.border='1px dotted red'; waitfortwo(-4);\"></img>  <img id=circle src='/MarkItUp/circlefill.png' onclick=\"event.stopPropagation(); this.style.border='1px dotted red'; waitfortwo(6);\"></img>  <img id=ocircle src='/MarkItUp/circle.png' onclick=\"event.stopPropagation(); this.style.border='1px dotted red'; waitfortwo(-5);\"></img>  <button id=orerect onclick=\"event.stopPropagation(); this.style.border='1px dotted red'; waitfortwo(8);\" title=\"Zoom in on rectangle you define via two clicks\" style=display:none;>&#128270;</button>" + lastbit + atend;
//alert(1);
if (!navigator.userAgent.match(/Android|BlackBerry|iPhone|iPad|iPod|Opera Mini|IEMobile/i)) { document.getElementById('ilp').focus(); }
document.getElementById('ilp').placeholder='Enter text and later click place for it on ' + decodeURIComponent(cencodename) + ' to left (line feed is ~~)';
} else if (curmode == 2) {
document.getElementById('line').style.border='1px dashed yellow';
} else if (curmode == -4) {
document.getElementById('orectangle').style.border='1px dashed yellow';
} else if (curmode == 4) {
document.getElementById('rectangle').style.border='1px dashed yellow';
} else if (curmode == -5) {
document.getElementById('ocircle').style.border='1px dashed yellow';
} else if (curmode == 6) {
document.getElementById('circle').style.border='1px dashed yellow';
} else if (curmode == 8) {
document.getElementById('orerect').style.border='1px dashed yellow';
}
}

… to team up with WordPress blog 404.php changes …

<?php

if (strlen($zeroesbit) == 6) { // filled in circle
if (sizeof($csv) == 3) {
array_push($csv, $csv[2]);
} else if (sizeof($csv) >= 4) {
$dist=(2.0 * sqrt(($csv[0] - $csv[2]) * ($csv[0] - $csv[2]) + ($csv[1] - $csv[3]) * ($csv[1] - $csv[3])));
$csv[2]=$dist;
$csv[3]=$dist;
}
imagefilledellipse($im, $csv[0], $csv[1], $csv[2], $csv[3], $blackish);
} else if (strlen($zeroesbit) == 5) { // circle
if (sizeof($csv) == 3) {
array_push($csv, $csv[2]);
} else if (sizeof($csv) >= 4) {
$dist=(2.0 * sqrt(($csv[0] - $csv[2]) * ($csv[0] - $csv[2]) + ($csv[1] - $csv[3]) * ($csv[1] - $csv[3])));
$csv[2]=$dist;
$csv[3]=$dist;
}
imageellipse($im, $csv[0], $csv[1], $csv[2], $csv[3], $black);
}

?>

… with our changed ninth draft image_venn.html Google Chart Image Chart Venn Chart or Scatter Chart or GraphViz Chart or Pie Chart or Line Chart or Bar Chart or Candlestick Chart or Map Chart interfacing web application you can also try below.


Previous relevant Google Chart Image Chart Broadcast Talk Context Tutorial is shown below.

Google Chart Image Chart Broadcast Talk Context Tutorial

Google Chart Image Chart Broadcast Talk Context Tutorial

The progress, today, along the same lines as yesterday’s Google Chart Image Chart Broadcast Talk Tutorial‘s introduction of a “Broadcast Talk” functionality, was to …

  • improve “Broadcast Talk” context, by adding onto yesterday’s …

    presented as an update image still presented and updated periodically

    … only display option, with, as of today …

  • a presenter’s first snapshotted image retained for user display (in case they arrive late to the lesson … tutt tutt) … and …
  • ImageMagick created animated GIF with slides for just this first image and the most recent image, updated periodically, in bottom right cell of user display …
    <?php

    if (isset($_POST['canvcont']) && isset($_POST['uniquifier']) && strpos(('?' . $_SERVER['QUERY_STRING']), 'cht=') === false) {
    if (isset($_POST['uniquifier'])) {
    $uniquifier=str_replace('+',' ',urldecode($_POST['uniquifier']));
    }
    if ($uniquifier == '') {
    $uniquifier='_' . rand(0,78654356);
    file_put_contents($_SERVER['DOCUMENT_ROOT'] . DIRECTORY_SEPARATOR . "presentation" . $uniquifier . ".png", base64_decode( explode('base64,', str_replace(' ','+',urldecode($_POST['canvcont'])))[1]));
    exec("/usr/local/cpanel/3rdparty/bin/convert -delay 20 -loop 0 " . $_SERVER['DOCUMENT_ROOT'] . DIRECTORY_SEPARATOR . "presentation" . $uniquifier . ".png" . " " . $_SERVER['DOCUMENT_ROOT'] . DIRECTORY_SEPARATOR . "presentation" . $uniquifier . ".gif");
    echo "<html><body onload=\"if (parent.document.getElementById('uniquifier')) { if (parent.document.getElementById('uniquifier').value == '') { parent.document.getElementById('uniquifier').value='" . $uniquifier . "'; } }\"></body></html>";
    } else {
    file_put_contents($_SERVER['DOCUMENT_ROOT'] . DIRECTORY_SEPARATOR . "presentation" . $uniquifier . ".png", base64_decode( explode('base64,', str_replace(' ','+',urldecode($_POST['canvcont'])))[1]));
    exec("rm -f " . $_SERVER['DOCUMENT_ROOT'] . DIRECTORY_SEPARATOR . "presentation" . $uniquifier . ".gif ; /usr/local/cpanel/3rdparty/bin/convert -delay 200 -loop 0 " . $_SERVER['DOCUMENT_ROOT'] . DIRECTORY_SEPARATOR . "presentation_" . $uniquifier . ".png " . $_SERVER['DOCUMENT_ROOT'] . DIRECTORY_SEPARATOR . "presentation" . $uniquifier . ".png" . " " . $_SERVER['DOCUMENT_ROOT'] . DIRECTORY_SEPARATOR . "presentation" . $uniquifier . ".gif");
    }
    exit;
    }

    ?>
    … and …
  • images saved as changes are detected gathered, as ever smaller thumbnails, in the top right of four table cells of the user display …

    var iijk=0, uniquif=''; snapshots=[], elem=null, elemcontext=null, oimg=null, checkforsquare=2;

    function canvinit() {
    var kkii=0, wpx=0, hpx=0;
    var tdr=document.getElementById('tdtr').getBoundingClientRect();
    wpx=eval('' + tdr.width);
    hpx=eval('' + tdr.height);
    elem=document.getElementById('agcanvas');
    elemcontext=elem.getContext('2d');
    elem.width=elem.width;
    elemcontext.drawImage(document.getElementById('talkimg'),0,0);
    if (iijk == 0 || ('' + document.getElementById('tdtr').style.backgroundImage).indexOf('rand=0') != -1) {
    //alert('89 ' + elem.toDataURL().length);
    //snapshots.push(elem.toDataURL());
    iijk=eval(-1 + eval('' + ('' + document.getElementById('tdtr').style.backgroundImage).split('),').length));
    document.getElementById('tdtr').style.backgroundImage=('' + document.getElementById('tdtr').style.backgroundImage).replace(('' + document.getElementById('tdtr').style.backgroundImage).split('),')[iijk], '' + 'url(' + elem.toDataURL() + '),' + ('' + document.getElementById('tdtr').style.backgroundImage).split('),')[iijk]).replace('rand=0', 'rand=x');
    iijk=eval(0 + eval('' + ('' + document.getElementById('tdtr').style.backgroundImage).split('),').length));
    setInterval(canvinit, 9000);
    } else {
    elem.width=elem.width;
    elemcontext.drawImage(document.getElementById('talkimg'),0,0);
    if (document.body.innerHTML.indexOf(elem.toDataURL()) == -1) {
    //snapshots.push(elem.toDataURL());
    iijk=eval(-1 + eval('' + ('' + document.getElementById('tdtr').style.backgroundImage).split('),').length));
    document.getElementById('tdtr').style.backgroundImage=('' + document.getElementById('tdtr').style.backgroundImage).replace(('' + document.getElementById('tdtr').style.backgroundImage).split('),')[iijk], '' + 'url(' + elem.toDataURL() + '),' + ('' + document.getElementById('tdtr').style.backgroundImage).split('),')[iijk]).replace('rand=x','rand=x' + Math.floor(Math.random() * 9));
    iijk=eval(0 + eval('' + ('' + document.getElementById('tdtr').style.backgroundImage).split('),').length));
    }
    }
    var bpx='background-position:;';
    var bbpx='background-position:;';
    var bsx='background-size:;';
    var brx='background-repeat:;';
    var xstart=0;
    var ystart=0;
    var xxstart=eval('' + tdr.left);
    var yystart=eval('' + tdr.top);
    if (iijk > eval(checkforsquare * checkforsquare)) { checkforsquare++; }
    for (kkii=1; kkii<=iijk; kkii++) {
    if (bsx.indexOf(':;') != -1) {
    bsx=bsx.replace(':;', ':' + Math.round(eval(wpx / checkforsquare)) + 'px ' + Math.round(eval(hpx /checkforsquare)) + 'px;');
    brx=brx.replace(':;', ':no-repeat;');
    bpx=bpx.replace(':;', ':' + Math.round(xstart) + 'px ' + Math.round(ystart) + 'px;');
    bbpx=bbpx.replace(':;', ':' + Math.round(xxstart) + 'px ' + Math.round(yystart) + 'px;');
    } else {
    bsx=bsx.replace(';', ',' + Math.round(eval(wpx / checkforsquare)) + 'px ' + Math.round(eval(hpx /checkforsquare)) + 'px;');
    brx=brx.replace(';', ',no-repeat;');
    bpx=bpx.replace(';', ',' + Math.round(xstart) + 'px ' + Math.round(ystart) + 'px;');
    bbpx=bbpx.replace(';', ',' + Math.round(xxstart) + 'px ' + Math.round(yystart) + 'px;');
    }
    if (eval(kkii % checkforsquare) == 0) {
    xstart=0;
    xxstart=eval('' + tdr.left);
    ystart+=eval(hpx / checkforsquare);
    yystart+=eval(hpx / checkforsquare);
    } else {
    xstart+=eval(wpx / checkforsquare);
    xxstart+=eval(wpx / checkforsquare);
    }
    }
    //alert('iijk=' + iijk + ' ' + bbpx + ' ' + bpx + ' ' + bsx + ' ' + brx);
    document.getElementById('tdtr').style.backgroundRepeat=brx.split(':')[1];
    document.getElementById('tdtr').style.backgroundSize=bsx.split(':')[1];
    document.getElementById('tdtr').style.backgroundPosition=bpx.split(':')[1];
    //document.body.style.backgroundImage=('' + document.getElementById('tdtr').style.backgroundImage);
    //document.body.style.backgroundRepeat=brx.split(':')[1];
    //document.body.style.backgroundSize=bsx.split(':')[1];

    document.body.style.backgroundPosition=bbpx.split(':')[1];
    var kdss=bsx.split(':')[1].replace(/\;/g,'').split(',');
    var idss=bbpx.split(':')[1].replace(/\;/g,'').split(',');
    var jdss=(('' + document.getElementById('tdtr').style.backgroundImage) + ',').replace(';,',',').replace(/url\(/g,'').replace(/URL\(/g,'').replace(/\"\;/g,'').replace(/\"/g,'').split('),');
    document.getElementById('idiv').innerHTML='';
    var istuff='', laststuff='';
    for (var iop=0; iop<idss.length; iop++) {
    //while (istuff == laststuff) {
    if (('' + jdss[iop]) != 'undefined' && ('' + jdss[iop]).trim() != '') {
    if (jdss[iop].trim().indexOf('iVBOR') != -1) {
    istuff+='<img style="position:absolute;width:' + kdss[iop].split(' ')[0] + ';height:' + kdss[iop].split(' ')[1] + ';left:' + idss[iop].split(' ')[0] + ';top:' + idss[iop].split(' ')[1] + ';" src="data:image/png;base64,iVBOR' + jdss[iop].trim().split('iVBOR')[1] + '"></img>';
    } else if (jdss[iop].trim() .indexOf('//') != -1) {
    istuff+='<img style="position:absolute;width:' + kdss[iop].split(' ')[0] + ';height:' + kdss[iop].split(' ')[1] + ';left:' + idss[iop].split(' ')[0] + ';top:' + idss[iop].split(' ')[1] + ';" src="' + jdss[iop].trim() + '"></img>';
    }
    //}
    laststuff=istuff;
    }
    }
    document.getElementById('idiv').innerHTML=istuff;
    }

We hope you try new functionality in our changed eighth draft image_venn.html Google Chart Image Chart Venn Chart or Scatter Chart or GraphViz Chart or Pie Chart or Line Chart or Bar Chart or Candlestick Chart or Map Chart interfacing web application you can also try below.


Previous relevant Google Chart Image Chart Broadcast Talk Tutorial is shown below.

Google Chart Image Chart Broadcast Talk Tutorial

Google Chart Image Chart Broadcast Talk Tutorial

Onto yesterday’s Google Chart Image Chart Statistical Charts Tutorial progress we want to offer …

  • once a user has that “More Annotation” annotating happening … offer the chance to …
  • Broadcast … their work as it happens, dynamically …
  • to an emailee list audience

… and we’re calling this …

Broadcast Talk

… even though it is only visual by nature, presented as an update image still presented and updated periodically. Go figure?! We’re blaming that supper time two back. We’re not sure?!

Anyway, we hope you try out the new arrangements in our changed seventh draft image_venn.html Google Chart Image Chart Venn Chart or Scatter Chart or GraphViz Chart or Pie Chart or Line Chart or Bar Chart or Candlestick Chart or Map Chart interfacing web application you can also try below, and helped out by a WordPress blog good ol’ TwentyTen theme 404.php which now includes …

<?php

if (isset($_POST['canvcont']) && isset($_POST['uniquifier']) && strpos(('?' . $_SERVER['QUERY_STRING']), 'cht=') === false) {
if (isset($_POST['uniquifier'])) {
$uniquifier=str_replace('+',' ',urldecode($_POST['uniquifier']));
}
if ($uniquifier == '') {
$uniquifier='_' . rand(0,78654356);
file_put_contents($_SERVER['DOCUMENT_ROOT'] . DIRECTORY_SEPARATOR . "presentation" . $uniquifier . ".png", base64_decode( explode('base64,', str_replace(' ','+',urldecode($_POST['canvcont'])))[1]));
echo "<html><body onload=\"if (parent.document.getElementById('uniquifier')) { if (parent.document.getElementById('uniquifier').value == '') { parent.document.getElementById('uniquifier').value='" . $uniquifier . "'; } }\"></body></html>";
} else {
file_put_contents($_SERVER['DOCUMENT_ROOT'] . DIRECTORY_SEPARATOR . "presentation" . $uniquifier . ".png", base64_decode( explode('base64,', str_replace(' ','+',urldecode($_POST['canvcont'])))[1]));
}
exit;
}

?>

… featuring our first use of this 404.php in response to a method=POST form call. Verrrrrryyyy interesting!


Previous relevant Google Chart Image Chart Statistical Charts Tutorial is shown below.

Google Chart Image Chart Statistical Charts Tutorial

Google Chart Image Chart Statistical Charts Tutorial

Further to yesterday’s Google Chart Image Chart Pie Chart Tutorial, today, we embark on our first ventures into composite charts, along what we like to think of as “statistical lines”, regarding interfacing to Google Charts Image Chart

… the latter being like a “parasite” display idea off the more conventional Statistical Graph favourites, the Line Chart and Bar Chart, where you have a relationship between a numerical concept (eg. sales) and another type of concept (eg. month of the year), and you want to present the data in a graphical form.

Again, we haven’t stopped our “retweaking”. We might “retweak” in the morning or we might “retweak” over a coffee break or we might “retweak” at supper time, but the end result is, well, you’re reading it now!


var pretherest='';
var newtherest='';
var tmod='';
var cht=location.search.split('cht=')[1] ? decodeURIComponent(location.search.split('cht=')[1].split('&')[0]) : "v";
if ((cht + ' ').substring(0,1) == 'p' && cht != 'p') { pretherest=cht.substring(1); }
if ((cht + ' ').substring(0,2) == 'bv' && cht != 'bv') { pretherest=cht.substring(2); if (1 == 1) { cht='bv'; } }
if ((cht + ' ').substring(0,1) == 'l' && cht != 'l') { pretherest=cht.substring(1); if (1 == 1) { cht='l'; } }
var ctype=location.search.split('type=')[1] ? decodeURIComponent(location.search.split('type=')[1].split('&')[0]) : cht;
var cname=(ctype == 'v' ? 'Venn Chart' : (ctype == 's' ? 'Scatter Chart' : (ctype == 'gv' ? 'GraphViz Chart' :
(ctype.substring(0,1) == 'p' ? 'Pie Chart' :
((ctype + ' ').substring(0,2) == 'bv' ? 'Bar Chart' : (ctype.substring(0,1) == 'l' ? 'Line Chart' : ''))))));
var cencodename=(ctype == 'v' ? 'Venn%20Diagram' : (ctype == 's' ? 'Scatter%20Chart' : (ctype == 'gv' ? 'GraphViz%20Chart' :
(ctype.substring(0,1) == 'p' ? 'Pie%20Chart' :
((ctype + ' ').substring(0,2) == 'bv' ? 'Bar%20Chart' : (ctype.substring(0,1) == 'l' ? 'Line%20Chart' : ''))))));
var chdt=(ctype == 'v' ? '&chd=t:' : (ctype == 's' ? '&chd=t:' : (ctype == 'gv' ? '&chl=' :
(ctype.substring(0,1) == 'p' ? pretherest + '&chd=t:' :
((ctype + ' ').substring(0,2) == 'bv' ? '&chd=t:' : (ctype.substring(0,1) == 'l' ? '&chd=t:' : ''))))));
var chdeq=(ctype == 'v' ? '&chd=' : (ctype == 's' ? '&chd=' : (ctype == 'gv' ? '&chl=' :
(ctype.substring(0,1) == 'p' ? '&chd=' :
((ctype + ' ').substring(0,2) == 'bv' ? '&chd=' : (ctype.substring(0,1) == 'l' ? '&chd=' : ''))))));
var tc=(ctype == 'v' ? 't:' : (ctype == 's' ? 't:' : (ctype == 'gv' ? '' :
(ctype.substring(0,1) == 'p' ? 't:' :
((ctype + ' ').substring(0,2) == 'bv' ? 't:' : (ctype.substring(0,1) == 'l' ? 't:' : ''))))));
var chdl=(ctype == 'v' ? '&chdl=' : (ctype == 's' ? '&chdl=' : (ctype == 'gv' ? '' :
(ctype.substring(0,1) == 'p' ? '&chdl=' :
((ctype + ' ').substring(0,2) == 'bv' ? '&chbh=' : (ctype.substring(0,1) == 'l' ? '&chbh=' : ''))))));

var prenchtt=(ctype == 'v' ? '100,80,60,30,30,30,10' : (ctype == 's' ? '12,87,75,41,23,96,68,71,34,9|98,60,27,34,56,79,58,74,18,76|84,23,69,81,47,94,60,93,64,54' : (ctype == 'gv' ? 'graph{C_0--H_0[type=s];C_0--H_1[type=s];C_0--H_2[type=s];C_0--C_1[type=s];C_1--H_3[type=s];C_1--H_4[type=s];C_1--H_5[type=s]}' :
(ctype.substring(0,1) == 'p' ? '1,2,3,4' :
((ctype + ' ').substring(0,2) == 'bv' ? '5,5,5|10,10,10|15,15,15' : (ctype.substring(0,1) == 'l' ? '5,45,5|10,60,10|15,85,15' : ''))))));
var preachtt=(ctype == 'v' ? 'A|B|C' : (ctype == 's' ? 'Cats|Dogs' : (ctype == 'gv' ? '' :
(ctype.substring(0,1) == 'p' ? 'January|February|March|April' :
((ctype + ' ').substring(0,2) == 'bv' ? '15,4,15' : (ctype.substring(0,1) == 'l' ? '15,4,15' : ''))))));
var defchco=(ctype == 'v' ? 'ff0000,00ff00,0000ff' : (ctype == 's' ? 'FF0000|0000FF&chxt=x,y' : (ctype == 'gv' ? '' :
(ctype.substring(0,1) == 'p' ? 'ff0000,00ff00,0000ff,ff00ff' :
((ctype + ' ').substring(0,2) == 'bv' ? '4D89F9,C6D9FD,C6FDD9&chxt=x,y' : (ctype.substring(0,1) == 'l' ? '3D89F9.B6D9FD,B6FDD9&chxt=x,y' : ''))))));

var prechtt=(ctype == 'v' ? chdt + prenchtt + chdl + preachtt : (ctype == 's' ? chdt + prenchtt + chdl + preachtt + '&chxt=x,y' : (ctype == 'gv' ? chdt + prenchtt :
(ctype.substring(0,1) == 'p' ? chdt + prenchtt + chdl + preachtt :
((ctype + ' ').substring(0,2) == 'bv' ? chdt + prenchtt + chdl + preachtt : (ctype.substring(0,1) == 'l' ? chdt + prenchtt + chdl + preachtt : ''))))));
var promptone=(ctype == 'v' ? "Enter delimited values string for Venn Diagram such that ... " + String.fromCharCode(10) + "The first three values specify the sizes of three circles: A, B, & C. For chart with only two circles, specify zero for the third value." + String.fromCharCode(10) + "The fourth value specifies the size of the intersection of A and B." + String.fromCharCode(10) + "The fifth value specifies the size of the intersection of A and C. For a chart with only two circles, do not specify a value here." + String.fromCharCode(10) + "The sixth value specifies the size of the intersection of B and C. For a chart with only two circles, do not specify a value here." + String.fromCharCode(10) + "The seventh value specifies the size of the common intersection of A, B, and C. For a chart with only two circles, do not specify a value here." + String.fromCharCode(10) + String.fromCharCode(10) + "" : (ctype == 's' ? "Enter delimited values string for Scatter Chart" : (ctype == 'gv' ? "Enter delimited values string for GraphViz Chart" :
(ctype.substring(0,1) == 'p' ? "Enter delimited values string for Pie Chart" :
((ctype + ' ').substring(0,2) == 'bv' ? "Enter g for Group or s for Stacked or o for Overlapped Bar Chart look then a space and then enter delimited values string for Bar Chart. Here is a Candlestick and Bar Chart idea eg. g 1:20,10,15,25,17,30|0,5,10,7,12,6|35,25,45,47,24,46|15,40,30,27,39,54|70,55,63,59,80,6 Prefix just the delimited string you enter by 1: to additionally display Candlestick Charts or by 0: to only display Candlestick Chart" :
(ctype.substring(0,1) == 'l' ? "Enter c for Even or s for Sparklines or xy for Just XY Line Chart look then a space and then enter delimited values string for Line Chart. Here is a Candlestick and Line Chart idea eg. c 1:20,10,15,25,17,30|0,5,10,7,12,6|35,25,45,47,24,46|15,40,30,27,39,54|70,55,63,59,80,6 Prefix just the delimited string you enter by 1: to additionally display Candlestick Charts or by 0: to only display Candlestick Chart" : ""))))));
var oneprompt=(ctype == 'v' ? "Enter delimited values string for your Venn Diagram collaborations, optionally, such that ... " + String.fromCharCode(10) + "The first three values specify the sizes of three circles: A, B, & C. For chart with only two circles, specify zero for the third value." + String.fromCharCode(10) + "The fourth value specifies the size of the intersection of A and B." + String.fromCharCode(10) + "The fifth value specifies the size of the intersection of A and C. For a chart with only two circles, do not specify a value here." + String.fromCharCode(10) + "The sixth value specifies the size of the intersection of B and C. For a chart with only two circles, do not specify a value here." + String.fromCharCode(10) + "The seventh value specifies the size of the common intersection of A, B, and C. For a chart with only two circles, do not specify a value here." + String.fromCharCode(10) + String.fromCharCode(10) + "" : (ctype == 's' ? "Enter delimited values string for Scatter Chart" : (ctype == 'gv' ? "Enter delimited values string for GraphViz Chart" :
(ctype.substring(0,1) == 'p' ? "Enter delimited values string for Pie Chart" :
((ctype + ' ').substring(0,2) == 'bv' ? "Enter g for Grouped or s for Stacked or o for Overlapped Bar Chart look then a space and then enter delimited values string for Bar Chart. Here is a Candlestick and Bar Chart idea eg. g 1:20,10,15,25,17,30|0,5,10,7,12,6|35,25,45,47,24,46|15,40,30,27,39,54|70,55,63,59,80,6 Prefix just the delimited string you enter by 1: to additionally display Candlestick Charts or by 0: to only display Candlestick Chart" :
(ctype.substring(0,1) == 'l' ? "Enter c for Even or s for Sparklines or xy for Just XY Line Chart look then a space and then enter delimited values string for Line Chart. Here is a Candlestick and Line Chart idea eg. c 1:20,10,15,25,17,30|0,5,10,7,12,6|35,25,45,47,24,46|15,40,30,27,39,54|70,55,63,59,80,6 Prefix just the delimited string you enter by 1: to additionally display Candlestick Charts or by 0: to only display Candlestick Chart" : ""))))));
var asktwo=(ctype == 'v' ? true : (ctype == 's' ? true : (ctype == 'gv' ? false :
(ctype.substring(0,1) == 'p' ? true :
((ctype + ' ').substring(0,2) == 'bv' ? true : (ctype.substring(0,1) == 'l' ? true : false))))));
var twopb=(ce.substring(0,1) == 'p' ? 'Any optional legend or title argument snippets? Optionally prefix by 3 for 3d Pie Chart or by c for Concentric Pie Chart. Eg. 3' + chdl + preachtt + '&chtt=My%20' + cencodename + '&chco=' + defchco : 'Any optional legend or title argument snippets? Eg. ' + chdl + preachtt + '&chtt=My%20' + cencodename + '&chco=' + defchco);
var beforeanswer=(ctype.substring(0,1) == 'l' ? 'c ' : ((ctype + ' ').substring(0,2) == 'bv' ? 'g ' : ''));

if ((document.URL.toLowerCase().indexOf('chd=t%3a') == -1 && document.URL.toLowerCase().indexOf('chd=t:') == -1) && document.URL.toLowerCase().indexOf('chd=t') != -1 && document.URL.toLowerCase().indexOf('%3a') != -1) {
tmod=document.URL.toLowerCase().split('chd=t')[1].split('%3')[0];
//tc='t' + tmod + ':';
//chdt=chdt.replace('t:', 't' + tmod + ':');
//answer=answer.trim().replace(tmod + ':','');
//therest+='&chm=F,,1,1:4,20';
} else if ((document.URL.toLowerCase().indexOf('chd=t%3a') == -1 && document.URL.toLowerCase().indexOf('chd=t:') == -1) && document.URL.toLowerCase().indexOf('chd=t') != -1 && document.URL.toLowerCase().substring(8).indexOf(':') != -1) {
tmod=document.URL.toLowerCase().split('chd=t')[1].split(':')[0];
//tc='t' + tmod + ':';
//chdt=chdt.replace('t:', 't' + tmod + ':');
//answer=answer.trim().replace(tmod + ':','');
//therest+='&chm=F,,1,1:4,20';
}

var atend="<canvas id=sharecanvas style=display:none;></canvas><div style=display:none;><label for='shareurl'><input type=button onclick='downloadmaybe(); shareurl();' id='sbut' value='Share URL Link'></input>: </label><input onblur=changeu(this.value); title='Suffix by hashtag 1 is text and hashtag 2 is title' style='width:45%;' type=url value='' placeholder='https://www.rjmprogramming.com.au/ITblog/#RJM Programming Blog#IT Blog' id=shareurl ondblclick='this.value=trythis(this.placeholder);'></input><br><br><span> ... and/or ... </span><br><br><label for='files'><input type=button onclick=document.getElementById('share').click(); value='Share media or document files'></input>: </label><input id='files' type='file' accept='image/*,video/*,audio/*,application/*,text/*' multiple></div><br><br><button id='share' type='button'>Share your media or documents or link!</button><output id='output'></output><scr" + "ipt type='text/javascript' src='/web_share_api_test.js?canv" + "asshare=as_necessary9867654' defer></scr" + "ipt>";
atend='';

var vals=[], annowin=null;


var lastbit="<br><br><br><br>  <button title='Other complex canvas annotation functionalities (forgoes the simpler ones above) ...' id=annobut onclick=\"document.getElementById('tdleft').style.verticalAlign='top'; setTimeout(prerepaint, 12000); if (arest.length != 0) { alert('arest=' + arest); if (document.getElementById('myvenn').src.indexOf(arest) == -1) { pdivhide(); document.getElementById('myvenn').src=document.getElementById('myvenn').src.split(arest.substring(0,5))[0] + arest; document.getElementById('tdleft').style.verticalAlign='top'; } } annowin=window.open('/HTMLCSS/user_of_signature_signature.htm?elemode=img','_blank','top=420,left=620,width=900,height=420'); \" style=\"background-color:yellow;\">More Annotations</button>  <button id=bshare onclick=repaint(); style=display:none;>Repaint <font size=1>(but lose sharing emojis above)</font></button><br><div id=divcanvas style=display:none;><canvas id=bottomcanvas></canvas></div>";
var fszbit='  <span id=spanfsz><select id=fsz onchange="fsz=this.value;"><option value=".10">10px</option><option value=".6">6px</option><option value=".8">8px</option><option value=".9">9px</option><option value=".11">11px</option><option value=".12">12px</option><option value=".14">14px</option><option value=".16">16px</option><option value=".18">18px</option><option value=".20">20px</option><option value=".24">24px</option><option value=".30">30px</option><option value=".36">36px</option><option value=".40">40px</option><option value=".48">48px</option><option value=".50">50px</option><option value=".64">64px</option></select></span>';
var origemailurl='mailto:?subject=My%20' + cencodename + '%20...%20best%20viewed%20in%20landscape%20...&body=';
var origsmsurl='sms:&body=My%20' + cencodename + '%20...%20best%20viewed%20in%20landscape%20...';
var smsee='';
var chd=location.search.split(chdeq)[1] ? (tc + dectypodeURIComponent(location.search.split(chdeq)[1].split('&')[0])).replace('t:t:', 't:').replace(/^t\:$/g, '') : "";
var therest=location.search.split(chdeq)[1] ? (pretherest + document.URL.split(document.URL.split('#')[0].split(chdeq)[1].split('&')[0])[1].split('#')[0]) : "";
newtherest=((ctype + ' ').substring(0,2) == 'bv' ? therest : '');

And yes, you can, and we did, put line feeds into those ternery statements to help with their readability as we add complexity to the parameterization, as we go along, in our changed sixth draft image_venn.html Google Chart Image Chart Venn Chart or Scatter Chart or GraphViz Chart or Pie Chart or Line Chart or Bar Chart or Candlestick Chart interfacing web application you can also try below.


Previous relevant Google Chart Image Chart Pie Chart Tutorial is shown below.

Google Chart Image Chart Pie Chart Tutorial

Google Chart Image Chart Pie Chart Tutorial

As we intimated in yesterday’s Google Chart Image Chart GraphViz Chart Tutorial

start with an at least two part “inhouse phase” of additional “extra to text” annotation functionality possibilities …

… we would return! And so, here thou lingers. It’s “part two” day, even bigger than “Ben Hur” in certain outback towns we’re a little bit shy to divulge until we get to know our readers that little bit better.

Yes, we are dovetailing with work we’ve done in the past using the excellent …

  • canvas … element introduced with HTML5 … whereby …
  • annotations like …
    1. scribble … as the default, and various other …
    2. discrete click shapes … and …
    3. text … including emojis … and …
    4. image

    … annotating modus operandi

… can be part of the arrangements. It works that the Annotation Helper is opened …

  • in a new “known about” popup window … looking out for …
  • parent based “img” element (in the modus operandi we use, calling it, regarding the parent top left image) … so as to be able to …
  • populate its canvas element with a clone of that calling “img” graphical content … but add into the mix …
  • menu driven annotation functionality which can change that canvas look and underlying data … and …
  • the caller can keep track of this and arrange, or not, for these changes to be reflected back at its top left “img” element … the catch being …
  • the “within range of GET argument” limits are ruined by this introduction of graphical data, and so in agreeing to this, a user forgoes those simpler sharing and annotating functionalities of yesterday’s (and before) work … though your normal image sharing capabilities via the web browser remain in the caller and the called

As well, today, we are introducing new Google Charts Image Chart Pie Chart interfacing, and because this chart type can have the three …

  • Normal
  • 3D
  • Concentric

… guises, there was some work to keep us off this street (okay … so we divulgedagain)


var pretherest='';
var cht=location.search.split('cht=')[1] ? decodeURIComponent(location.search.split('cht=')[1].split('&')[0]) : "v";
if ((cht + ' ').substring(0,1) == 'p' && cht != 'p') { pretherest=cht.substring(1); }
var ctype=location.search.split('type=')[1] ? decodeURIComponent(location.search.split('type=')[1].split('&')[0]) : cht;
var cname=(ctype == 'v' ? 'Venn Chart' : (ctype == 's' ? 'Scatter Chart' : (ctype == 'gv' ? 'GraphViz Chart' : (ctype.substring(0,1) == 'p' ? 'Pie Chart' : ''))));
var cencodename=(ctype == 'v' ? 'Venn%20Diagram' : (ctype == 's' ? 'Scatter%20Chart' : (ctype == 'gv' ? 'GraphViz%20Chart' : (ctype.substring(0,1) == 'p' ? 'Pie%20Chart' : ''))));
var chdt=(ctype == 'v' ? '&chd=t:' : (ctype == 's' ? '&chd=t:' : (ctype == 'gv' ? '&chl=' : (ctype.substring(0,1) == 'p' ? pretherest + '&chd=t:' : ''))));
var chdeq=(ctype == 'v' ? '&chd=' : (ctype == 's' ? '&chd=' : (ctype == 'gv' ? '&chl=' : (ctype.substring(0,1) == 'p' ? '&chd=' : ''))));
var tc=(ctype == 'v' ? 't:' : (ctype == 's' ? 't:' : (ctype == 'gv' ? '' : (ctype.substring(0,1) == 'p' ? 't:' : ''))));
var chdl=(ctype == 'v' ? '&chdl=' : (ctype == 's' ? '&chdl=' : (ctype == 'gv' ? '' : (ctype.substring(0,1) == 'p' ? '&chdl=' : ''))));
var prenchtt=(ctype == 'v' ? '100,80,60,30,30,30,10' : (ctype == 's' ? '12,87,75,41,23,96,68,71,34,9|98,60,27,34,56,79,58,74,18,76|84,23,69,81,47,94,60,93,64,54' : (ctype == 'gv' ? 'graph{C_0--H_0[type=s];C_0--H_1[type=s];C_0--H_2[type=s];C_0--C_1[type=s];C_1--H_3[type=s];C_1--H_4[type=s];C_1--H_5[type=s]}' : (ctype.substring(0,1) == 'p' ? '1,2,3,4' : ''))));
var preachtt=(ctype == 'v' ? 'A|B|C' : (ctype == 's' ? 'Cats|Dogs' : (ctype == 'gv' ? '' : (ctype.substring(0,1) == 'p' ? 'January|February|March|April' : ''))));
var prechtt=(ctype == 'v' ? chdt + prenchtt + chdl + preachtt : (ctype == 's' ? chdt + prenchtt + chdl + preachtt + '&chxt=x,y' : (ctype == 'gv' ? chdt + prenchtt : (ctype.substring(0,1) == 'p' ? chdt + prenchtt + chdl + preachtt : ''))));
var defchco=(ctype == 'v' ? 'ff0000,00ff00,0000ff' : (ctype == 's' ? 'FF0000|0000FF&chxt=x,y' : (ctype == 'gv' ? '' : (ctype.substring(0,1) == 'p' ? 'ff0000,00ff00,0000ff,ff00ff' : ''))));
var promptone=(ctype == 'v' ? "Enter delimited values string for Venn Diagram such that ... " + String.fromCharCode(10) + "The first three values specify the sizes of three circles: A, B, & C. For chart with only two circles, specify zero for the third value." + String.fromCharCode(10) + "The fourth value specifies the size of the intersection of A and B." + String.fromCharCode(10) + "The fifth value specifies the size of the intersection of A and C. For a chart with only two circles, do not specify a value here." + String.fromCharCode(10) + "The sixth value specifies the size of the intersection of B and C. For a chart with only two circles, do not specify a value here." + String.fromCharCode(10) + "The seventh value specifies the size of the common intersection of A, B, and C. For a chart with only two circles, do not specify a value here." + String.fromCharCode(10) + String.fromCharCode(10) + "" : (ctype == 's' ? "Enter delimited values string for Scatter Chart" : (ctype == 'gv' ? "Enter delimited values string for GraphViz Chart" : (ctype.substring(0,1) == 'p' ? "Enter delimited values string for Pie Chart" : ""))));
var oneprompt=(ctype == 'v' ? "Enter delimited values string for your Venn Diagram collaborations, optionally, such that ... " + String.fromCharCode(10) + "The first three values specify the sizes of three circles: A, B, & C. For chart with only two circles, specify zero for the third value." + String.fromCharCode(10) + "The fourth value specifies the size of the intersection of A and B." + String.fromCharCode(10) + "The fifth value specifies the size of the intersection of A and C. For a chart with only two circles, do not specify a value here." + String.fromCharCode(10) + "The sixth value specifies the size of the intersection of B and C. For a chart with only two circles, do not specify a value here." + String.fromCharCode(10) + "The seventh value specifies the size of the common intersection of A, B, and C. For a chart with only two circles, do not specify a value here." + String.fromCharCode(10) + String.fromCharCode(10) + "" : (ctype == 's' ? "Enter delimited values string for Scatter Chart" : (ctype == 'gv' ? "Enter delimited values string for GraphViz Chart" : (ctype.substring(0,1) == 'p' ? "Enter delimited values string for Pie Chart" : ""))));
var asktwo=(ctype == 'v' ? true : (ctype == 's' ? true : (ctype == 'gv' ? false : (ctype.substring(0,1) == 'p' ? true : false))));
var twopb=(ctype.substring(0,1) == 'p' ? 'Any optional legend or title argument snippets? Optionally prefix by 3 for 3d Pie Chart or by c for Concentric Pie Chart. Eg. 3' + chdl + preachtt + '&chtt=My%20' + cencodename + '&chco=' + defchco : 'Any optional legend or title argument snippets? Eg. ' + chdl + preachtt + '&chtt=My%20' + cencodename + '&chco=' + defchco);

var atend="<canvas id=sharecanvas style=display:none;></canvas><div style=display:none;><label for='shareurl'><input type=button onclick='downloadmaybe(); shareurl();' id='sbut' value='Share URL Link'></input>: </label><input onblur=changeu(this.value); title='Suffix by hashtag 1 is text and hashtag 2 is title' style='width:45%;' type=url value='' placeholder='https://www.rjmprogramming.com.au/ITblog/#RJM Programming Blog#IT Blog' id=shareurl ondblclick='this.value=trythis(this.placeholder);'></input><br><br><span> ... and/or ... </span><br><br><label for='files'><input type=button onclick=document.getElementById('share').click(); value='Share media or document files'></input>: </label><input id='files' type='file' accept='image/*,video/*,audio/*,application/*,text/*' multiple></div><br><br><button id='share' type='button'>Share your media or documents or link!</button><output id='output'></output><scr" + "ipt type='text/javascript' src='/web_share_api_test.js?canv" + "asshare=as_necessary9867654' defer></scr" + "ipt>";
atend='';

var vals=[], annowin=null;
var lastbit="<br><br><br><br>  <button title='Other complex canvas annotation functionalities (forgoes the simpler ones above) ...' id=annobut onclick=\"document.getElementById('tdleft').style.verticalAlign='top'; setTimeout(prerepaint, 12000); if (arest.length != 0) { if (document.getElementById('myvenn').src.indexOf(arest) == -1) { pdivhide(); document.getElementById('myvenn').src=document.getElementById('myvenn').src.split(arest.substring(0,5))[0] + arest; document.getElementById('tdleft').style.verticalAlign='top'; } } annowin=window.open('/HTMLCSS/user_of_signature_signature.htm?elemode=img','_blank','top=420,left=620,width=900,height=420'); \" style=\"background-color:yellow;\">More Annotations</button>  <button id=bshare onclick=repaint(); style=display:none;>Repaint <font size=1>(but lose sharing emojis above)</font></button><br><div id=divcanvas style=display:none;><canvas id=bottomcanvas></canvas></div>";
var fszbit='  <span id=spanfsz><select id=fsz onchange="fsz=this.value;"><option value=".10">10px</option><option value=".6">6px</option><option value=".8">8px</option><option value=".9">9px</option><option value=".11">11px</option><option value=".12">12px</option><option value=".14">14px</option><option value=".16">16px</option><option value=".18">18px</option><option value=".20">20px</option><option value=".24">24px</option><option value=".30">30px</option><option value=".36">36px</option><option value=".40">40px</option><option value=".48">48px</option><option value=".50">50px</option><option value=".64">64px</option></select></span>';
var origemailurl='mailto:?subject=My%20' + cencodename + '%20...%20best%20viewed%20in%20landscape%20...&body=';
var origsmsurl='sms:&body=My%20' + cencodename + '%20...%20best%20viewed%20in%20landscape%20...';
var smsee='';
var chd=location.search.split(chdeq)[1] ? (tc + decodeURIComponent(location.search.split(chdeq)[1].split('&')[0])).replace('t:t:', 't:').replace(/^t\:$/g, '') : "";
var therest=location.search.split(chdeq)[1] ? (pretherest + document.URL.split(document.URL.split('#')[0].split(chdeq)[1].split('&')[0])[1].split('#')[0]) : "";

Please acquaint yourself with these new annotating features in our changed fifth draft image_venn.html Google Chart Image Chart Venn Chart or Scatter Chart or GraphViz Chart or Pie Chart interfacing web application you can also try below.


Previous relevant Google Chart Image Chart GraphViz Chart Tutorial is shown below.

Google Chart Image Chart GraphViz Chart Tutorial

Google Chart Image Chart GraphViz Chart Tutorial

Today we have two strands of forward progress, onto the progress up to yesterday’s Google Chart Image Chart Scatter Chart Tutorial, they being …

  • establish a new interfacing to GraphViz Chart

    GraphViz is a package of open source tools for visualizing connectivity graphs. You can create GraphViz graphs using the DOT language and your choice of layout engines.

    … a chart looking a bit like Organization Charts

    Org charts are diagrams of a hierarchy of nodes, commonly used to portray superior/subordinate relationships in an organization. A family tree is a type of org chart.


  • start with an at least two part “inhouse phase” of additional “extra to text” annotation functionality possibilities … just starting with …
    1. line
    2. open rectangle
    3. filled rectangle

… additional functionality, that we may well add to, but being as we feel a change we’ll leave that for another time.

The WordPress blog “404.php” code snippet becomes …

<?php

if (strpos(('?' . $_SERVER['QUERY_STRING']), '?cht=') !== false || strpos(('?' . $_SERVER['QUERY_STRING']), '&cht=') !== false) {

$theqs=str_replace('??','?',('?' . $_SERVER['QUERY_STRING']));
if (strpos($theqs, '?chs=') === false && strpos($theqs, '&chs=') === false) {
$theqs='?chs=' . $newWidth . 'x' . $newHeight . '&' . explode('?', $theqs)[1];
}


if (strpos(('?' . $_SERVER['QUERY_STRING']), 'text1=') !== false) {
$theone=2;
$im = imagecreatefromstring(file_get_contents('http://chart.googleapis.com/chart' . explode('&text1=', $theqs)[0]));

if (7 == 7) {

$plotstring=str_replace('+',' ',urldecode($_GET['text1']));
$csv=explode(',', $plotstring);
$black = imagecolorallocatealpha($im, 1, 1, 1, 0);
$blackish = imagecolorallocatealpha($im, 127, 127, 127, 64);
if (sizeof($csv) >= 3) {
if (trim($csv[2]) == '') { // non text annotations

$zeroesbit='';
$izeroes=0;
$xmantissae=explode('.', ('' . $csv[0]));
if (sizeof($xmantissae) > 1) {
$csv[0]=$xmantissae[0];
while (substr($xmantissae[1],0,1) == '0') {
$zeroesbit.='0';
$xmantissae[1]=substr($xmantissae[1],1);
}
$csv[2]=$xmantissae[1];
}
$ymantissae=explode('.', ('' . $csv[1]));
if (sizeof($ymantissae) > 1) {
$csv[1]=$ymantissae[0];
if (sizeof($csv) > 3) {
$csv[3]=$ymantissae[1];
} else {
array_push($csv, $ymantissae[1]);
}
}


if (strlen($zeroesbit) == 4) { // filled in rectangle
imagefilledrectangle($im, $csv[0], $csv[1], $csv[2], $csv[3], $blackish);
} else if (strlen($zeroesbit) == 2) { // rectangle
imagerectangle($im, $csv[0], $csv[1], $csv[2], $csv[3], $black);
} else if (strlen($zeroesbit) == 1) { // line
imageline($im, $csv[0], $csv[1], $csv[2], $csv[3], $black);
}

} else { // text placement
$xis=$csv[0];
$mantissae=explode('.', ('' . $csv[0]));
if (sizeof($mantissae) > 1) {
$tenpx=$mantissae[1];
$xis=$mantissae[0];
}
try {
if (function_exists('imagettftext')) {
if (explode('' . $csv[0] . ',' . $csv[1] . ',', $plotstring)[1] !== '') {
//echo explode('' . $csv[0] . ',' . $csv[1] . ',', $plotstring)[1];
//exit;
imagettftext($im, $tenpx, 0, $xis, $csv[1], $black, realpath('arial.ttf'), explode('' . $csv[0] . ',' . $csv[1] . ',', $plotstring)[1]);
}
}
} catch (Exception $e) { }
}
while (isset($_GET['text' . $theone])) {
$plotstring=str_replace('+',' ',urldecode($_GET['text' . $theone]));
$csv=explode(',', $plotstring);
if (sizeof($csv) >= 3) {
if (trim($csv[2]) == '') { // non text annotations

$zeroesbit='';
$izeroes=0;
$xmantissae=explode('.', ('' . $csv[0]));
if (sizeof($xmantissae) > 1) {
$csv[0]=$xmantissae[0];
while (substr($xmantissae[1],0,1) == '0') {
$zeroesbit.='0';
$xmantissae[1]=substr($xmantissae[1],1);
}
$csv[2]=$xmantissae[1];
}
$ymantissae=explode('.', ('' . $csv[1]));
if (sizeof($ymantissae) > 1) {
$csv[1]=$ymantissae[0];
if (sizeof($csv) > 3) {
$csv[3]=$ymantissae[1];
} else {
array_push($csv, $ymantissae[1]);
}
}


if (strlen($zeroesbit) == 4) { // filled in rectangle
imagefilledrectangle($im, $csv[0], $csv[1], $csv[2], $csv[3], $blackish);
} else if (strlen($zeroesbit) == 2) { // rectangle
imagerectangle($im, $csv[0], $csv[1], $csv[2], $csv[3], $black);
} else if (strlen($zeroesbit) == 1) { // line
imageline($im, $csv[0], $csv[1], $csv[2], $csv[3], $black);
}

} else { // text placement
try {
$xis=$csv[0];
$mantissae=explode('.', ('' . $csv[0]));
if (sizeof($mantissae) > 1) {
$tenpx=$mantissae[1];
$xis=$mantissae[0];
}
if (function_exists('imagettftext')) {
if (explode('' . $csv[0] . ',' . $csv[1] . ',', $plotstring)[1] !== '') {
imagettftext($im, $tenpx, 0, $xis, $csv[1], $black, realpath('arial.ttf'), explode('' . $csv[0] . ',' . $csv[1] . ',', $plotstring)[1]);
}
}
} catch (Exception $e) { }
}
$theone++;
}
}
//}
}


}

header('Content-Type: image/png');

imagepng($im);
imagedestroy($im);
} else {
header('Content-Type: image/png');
echo file_get_contents('http://chart.googleapis.com/chart' . $theqs);
}
exit;

}

?>

… utilizing that good ol’ PHP GD image library.

We hope you enjoy the …

Mantissa Madness Monday

… coding feel utilized to retain yesterday’s …


&textn=x,y,Text

… argument snippet basis, adding “x” and “y” mantissa arrangement smarts with a “nothing” Text in our changed fourth draft image_venn.html Google Chart Image Chart Venn Chart or Scatter Chart or GraphViz Chart interfacing web application you can also try below.

Did you know?

Would you believe, at least to us, it is far less obvious how to display a straight line (that is perhaps not horizontal nor vertical) within a webpage, than it is to display a rectangle, filled or not?! Talk about irony! Over time, we have developed …

  • HTML hr elements (with a rotation) … and the less kludgy …
  • HTML div (defining a box with defined dimensions) for a nested SVG element containing the line definition using percentage dimensions

… in the past, for when we needed to do this. But, today, we’d like to thank this great webpage for its suggestion to involve linear gradients …


<style>

.crossedtotl {
background:
linear-gradient(to top left,
rgba(0,0,0,0) 0%,
rgba(0,0,0,0) calc(50% - 0.8px),
rgba(0,0,0,1) 50%,
rgba(0,0,0,0) calc(50% + 0.8px),
rgba(0,0,0,0) 100%);
}
.crossedtotr {
background:
linear-gradient(to top right,
rgba(0,0,0,0) 0%,
rgba(0,0,0,0) calc(50% - 0.8px),
rgba(0,0,0,1) 50%,
rgba(0,0,0,0) calc(50% + 0.8px),
rgba(0,0,0,0) 100%);
}
</style>

… in a, basically, CSS solution. Great stuff, thanks!


Previous relevant Google Chart Image Chart Scatter Chart Tutorial is shown below.

Google Chart Image Chart Scatter Chart Tutorial

Google Chart Image Chart Scatter Chart Tutorial

Today, we bring the Google Charts Image Chart

… making distributing “Venn Chart” hardcodings into a dropdown selectable arrangement, because there are more commonalities than differences, really, and we do like to parameterize … even in the shower, with a fairly loud rendition of this, perhaps.

Here is our framework for parameterization, here, and into the future


<title>Interfacing to Google Charts Image Chart Venn Chart or Scatter Chart - RJM Programming - November, 2023</title>
<script type=text/javascript>
var cht=location.search.split('cht=')[1] ? decodeURIComponent(location.search.split('cht=')[1].split('&')[0]) : "v";
var ctype=location.search.split('type=')[1] ? decodeURIComponent(location.search.split('type=')[1].split('&')[0]) : cht;
var cname=(ctype == 'v' ? 'Venn Chart' : (ctype == 's' ? 'Scatter Chart' : ''));
var cencodename=(ctype == 'v' ? 'Venn%20Diagram' : (ctype == 's' ? 'Scatter%20Chart' : ''));
var prenchtt=(ctype == 'v' ? '100,80,60,30,30,30,10' : (ctype == 's' ? '12,87,75,41,23,96,68,71,34,9|98,60,27,34,56,79,58,74,18,76|84,23,69,81,47,94,60,93,64,54' : ''));
var preachtt=(ctype == 'v' ? 'A|B|C' : (ctype == 's' ? 'Cats|Dogs' : ''));
var prechtt=(ctype == 'v' ? '&chd=t:' + prenchtt + '&chdl=' + preachtt : (ctype == 's' ? '&chd=t:' + prenchtt + '&chdl=' + preachtt + '&chxt=x,y' : ''));
var defchco=(ctype == 'v' ? 'ff0000,00ff00,0000ff' : (ctype == 's' ? 'FF0000|0000FF&chxt=x,y' : ''));
var promptone=(ctype == 'v' ? "Enter delimited values string for Venn Diagram such that ... " + String.fromCharCode(10) + "The first three values specify the sizes of three circles: A, B, & C. For chart with only two circles, specify zero for the third value." + String.fromCharCode(10) + "The fourth value specifies the size of the intersection of A and B." + String.fromCharCode(10) + "The fifth value specifies the size of the intersection of A and C. For a chart with only two circles, do not specify a value here." + String.fromCharCode(10) + "The sixth value specifies the size of the intersection of B and C. For a chart with only two circles, do not specify a value here." + String.fromCharCode(10) + "The seventh value specifies the size of the common intersection of A, B, and C. For a chart with only two circles, do not specify a value here." + String.fromCharCode(10) + String.fromCharCode(10) + "" : (ctype == 's' ? "Enter delimited values string for Scatter Chart" : ""));
var oneprompt=(ctype == 'v' ? "Enter delimited values string for your Venn Diagram collaborations, optionally, such that ... " + String.fromCharCode(10) + "The first three values specify the sizes of three circles: A, B, & C. For chart with only two circles, specify zero for the third value." + String.fromCharCode(10) + "The fourth value specifies the size of the intersection of A and B." + String.fromCharCode(10) + "The fifth value specifies the size of the intersection of A and C. For a chart with only two circles, do not specify a value here." + String.fromCharCode(10) + "The sixth value specifies the size of the intersection of B and C. For a chart with only two circles, do not specify a value here." + String.fromCharCode(10) + "The seventh value specifies the size of the common intersection of A, B, and C. For a chart with only two circles, do not specify a value here." + String.fromCharCode(10) + String.fromCharCode(10) + "" : (ctype == 's' ? "Enter delimited values string for Scatter Chart" : ""));

// etcetera etcetera etcetera

… but, as you can imagine, there will probably be small retweaks of this arrangement, which is holding out okay so far for Scatter Charts in our changed third draft image_venn.html Google Chart Image Chart Venn Chart or Scatter Chart interfacing web application you can also try below.

Did you know?

In this online world with so many platforms and devices and software choices, there is no need to ever be embarrassed by what might seem an obvious feature you’ve missed.

Take the way on macOS, but not iOS, using a web browser to get to YouTube, you can flag that a video should loop. Especially good for …

  • song obsessions …
  • earworms you need to salve

… and what about if your shower is taking an awfully long time?! Please be careful with moisture and devices, though, in the bathroom!

How does it happen? Right click the play button, and looping is there as the top option. Now back to that shower song obsession.


Previous relevant Google Chart Image Chart Venn Chart User Text Tutorial is shown below.

Google Chart Image Chart Venn Chart User Text Tutorial

Google Chart Image Chart Venn Chart User Text Tutorial

We think a way to improve on our interfacing web application start regarding yesterday’s Google Chart Image Chart Venn Chart Interfacing Primer Tutorial would be to offer the user the chance to enter their own text onto the Venn Diagrams …

But we would say that.

… given what we learnt in Primary school … or should we say …

“Gryffindor Slytherin Ravenclaw Hufflepuff Junior Business College”

… and, yes, is that you, Aoife? What did you want to point out? After you swallow those Rice Bubbles, that is?! Class is waiting …

.
.
.
.
.
.
.
.
.
.
.
.
.
.
.
.
.
.
.
.
.
.
.
.
.

Yes … miss something … and …

.
.
.
.
.
.
.
.
.
.
.
.
.
.
.
.
.
.
.
.
.
.
.
.
.

Use your words … okay … missing … don’t worry, the bus will wait … no … there’s no need to point … oh! …

… do you mean …

missing ewe … no … missing you … oh! … missing u … oh! … “Gryffindor Slytherin Ravenclaw Hufflepuff Juniour Business College” … quite so, Aiofe … 3 points for Hufflepuff!

Anyway we needed a fleshed out “function ask” to cater for potential onclick event logic catering for co-ordinates


function ask(evt) {
var answer='', answertherest='';
if (lasttext != '' && evt && normalcall) {
document.getElementById('ilp').placeholder='Enter text and later click place for it on Venn Diagram to left (line feed is ~~)';

elemLeft = document.getElementById('myvenn').offsetLeft;
elemTop = document.getElementById('myvenn').offsetTop;

if (evt.touches) {
if (evt.touches[0].pageX) {
x = evt.touches[0].pageX + document.body.scrollLeft - elemLeft;
y = evt.touches[0].pageY + document.body.scrollTop - elemTop;
} else {
x = evt.touches[0].clientX + document.body.scrollLeft - elemLeft;
y = evt.touches[0].clientY + document.body.scrollTop - elemTop;
}
} else if (evt.clientX || ev.clientY) {
x = evt.clientX + document.body.scrollLeft - elemLeft;
y = evt.clientY + document.body.scrollTop - elemTop;
} else {
x = evt.pageX + document.body.scrollLeft - elemLeft;
y = evt.pageY + document.body.scrollTop - elemTop;
}


document.getElementById('dtext').innerHTML+='<p style="position:absolute;font-size:10px;font-family:Arial;left:' + x + 'px;top:' + y + 'px;z-index:98;">' + lasttext + '</p>';

document.getElementById('aemail').href+='&text' + textnum + '=' + encodeURIComponent('' + x + ',' + y + ',') + encodeURIComponent(lasttext.replace(/\<br\>/g, String.fromCharCode(10)));
document.getElementById('asms').href+='&text' + textnum + '=' + encodeURIComponent('' + x + ',' + y + ',') + encodeURIComponent(lasttext.replace(/\<br\>/g, String.fromCharCode(10)));
arest+='&text' + textnum + '=' + encodeURIComponent('' + x + ',' + y + ',') + encodeURIComponent(lasttext.replace(/\<br\>/g, String.fromCharCode(10)));
therest+='&text' + textnum + '=' + encodeURIComponent('' + x + ',' + y + ',') + encodeURIComponent(lasttext.replace(/\<br\>/g, String.fromCharCode(10)));
asmsurl+='&text' + textnum + '=' + encodeURIComponent('' + x + ',' + y + ',') + encodeURIComponent(lasttext.replace(/\<br\>/g, String.fromCharCode(10)));
aemailurl+='&text' + textnum + '=' + encodeURIComponent('' + x + ',' + y + ',') + encodeURIComponent(lasttext.replace(/\<br\>/g, String.fromCharCode(10)));
document.getElementById('tdright').innerHTML="  <span id=spemail><a target=_blank href='mailto:?subject=My%20Venn%20Diagram%20...%20best%20viewed%20in%20landscape%20...&body=" + encodeURIComponent((document.getElementById('myvenn').src + arest).replace((document.getElementById('myvenn').src + arest).split('?')[0].split('#')[0], document.URL.split('?')[0].split('#')[0])) + "' id=aemail title=Email>&#128231;</a></span>      <span id=spsms><a target=_blank onmouseover=\"if (smsee.length == 0 && origsmsurl.indexOf('sms:&') != -1) { smsee=prompt('Please enter SMS number to send to.', ''); if (smsee == null) { smsee=''; } else { origsmsurl=origsmsurl.replace('sms:&','sms:' + smsee + '&'); asmsurl=asmsurl.replace('sms:&','sms:' + smsee + '&'); this.href=asmsurl; } }\" ontouchstart=\"if (smsee.length == 0 && origsmsurl.indexOf('sms:&') != -1) { smsee=prompt('Please enter SMS number to send to.', ''); if (smsee == null) { smsee=''; } else { origsmsurl=origsmsurl.replace('sms:&','sms:' + smsee + '&'); asmsurl=asmsurl.replace('sms:&','sms:' + smsee + '&'); this.href=asmsurl; } }\" href='sms:&body=" + encodeURIComponent((document.getElementById('myvenn').src + arest).replace(document.getElementById('myvenn').src.split('?')[0].split('#')[0], document.URL.split('?')[0].split('#')[0])) + "' id=asms title=SMS>&#128223;</a></span><br><br>  <input id=ilp onblur=\"lasttext=this.value.replace(/\~\~/g, '<br>'); this.value=''; this.placeholder='Click where you want ... ' + lasttext.replace(/\<br\>/g, String.fromCharCode(10)); mvp.setAttribute('content','initial-scale=1'); document.getElementById('myvenn').scrollIntoView();\" placeholder='Enter text and later click place for it on Venn Diagram to left (line feed is ~~)' type=text style=width:500px; value=''></input>";
//alert( document.getElementById('aemail').outerHTML );
//alert( document.getElementById('asms').outerHTML );
textnum++;
lasttext='';
} else if (!evt || !normalcall) {
if (chd == '') {
answer=prompt("Enter delimited values string for Venn Diagram such that ... " + String.fromCharCode(10) + "The first three values specify the sizes of three circles: A, B, & C. For chart with only two circles, specify zero for the third value." + String.fromCharCode(10) + "The fourth value specifies the size of the intersection of A and B." + String.fromCharCode(10) + "The fifth value specifies the size of the intersection of A and C. For a chart with only two circles, do not specify a value here." + String.fromCharCode(10) + "The sixth value specifies the size of the intersection of B and C. For a chart with only two circles, do not specify a value here." + String.fromCharCode(10) + "The seventh value specifies the size of the common intersection of A, B, and C. For a chart with only two circles, do not specify a value here." + String.fromCharCode(10) + String.fromCharCode(10) + "", (chd == '' ? "100,80,60,30,30,30,10" : (chd.replace('t:',''))));
} else {
answer=prompt("Enter delimited values string for your Venn Diagram collaborations, optionally, such that ... " + String.fromCharCode(10) + "The first three values specify the sizes of three circles: A, B, & C. For chart with only two circles, specify zero for the third value." + String.fromCharCode(10) + "The fourth value specifies the size of the intersection of A and B." + String.fromCharCode(10) + "The fifth value specifies the size of the intersection of A and C. For a chart with only two circles, do not specify a value here." + String.fromCharCode(10) + "The sixth value specifies the size of the intersection of B and C. For a chart with only two circles, do not specify a value here." + String.fromCharCode(10) + "The seventh value specifies the size of the common intersection of A, B, and C. For a chart with only two circles, do not specify a value here." + String.fromCharCode(10) + String.fromCharCode(10) + "", (chd == '' ? "100,80,60,30,30,30,10" : (chd.replace('t:',''))));
}
vals=[];
if (answer != null) {
answer=answer.trim();
if (answer.trim() != '') {
var delimis='';
for (var ii=0; ii<answer.length; ii++) {
if (delimis == '' && (answer.substring(ii).substring(0,1) < '0' || answer.substring(ii).substring(0,1) > '9')) {
delimis=answer.substring(ii).substring(0,1);
}
}
}
if (delimis != '') {
vals=answer.split(delimis);
}
if (vals.length == 6 || vals.length == 7) {
answertherest=prompt('Any optional legend or title argument snippets? Eg. &chdl=A|B|C&chtt=My%20Venn%20Diagram&chco=ff0000,00ff00,0000ff', therest);
if (answertherest == null) { answertherest=''; }
therest=answertherest.trim();
var aone=1;
var plotstring='';
var flds=[];
if (therest.indexOf('&text' + aone + '=') != -1) {
while (therest.indexOf('&text' + aone + '=') != -1) {
if (chd == '') {
plotstring=decodeURIComponent(therest.split('&text' + aone + '=')[1].split('&')[0]);
while (plotstring.indexOf(String.fromCharCode(10)) != -1) {
plotstring=plotstring.replace(String.fromCharCode(10), '<br>');
}
flds=plotstring.split(',');
if (eval('' + flds.length) >= 3) {
document.getElementById('dtext').innerHTML+='<p style="position:absolute;font-size:10px;font-family:Arial;left:' + flds[0] + 'px;top:' + flds[1] + 'px;z-index:98;">' + plotstring.split('' + flds[0] + ',' + flds[1] + ',')[1] + '</p>';
}
}
aone++;
textnum=aone;
}
}
//document.getElementById('myvenn').style.backgroundImage='URL(//www.rjmprogramming.com.au/ITblog/' + Math.min(550,window.innerWidth) + '/' + Math.min(350,window.innerHeight) + '/?cht=v&chd=t:' + encodeURIComponent(answer + therest) + ')';
document.getElementById('myvenn').src='//www.rjmprogramming.com.au/ITblog/' + Math.min(550,window.innerWidth) + '/' + Math.min(350,window.innerHeight) + '/?cht=v&chd=t:' + encodeURIComponent(answer) + therest + '';
if (document.getElementById('tdright').innerHTML == '') {
document.getElementById('tdright').innerHTML="  <span id=spemail><a target=_blank href='mailto:?subject=My%20Venn%20Diagram%20...%20best%20viewed%20in%20landscape%20...&body=" + encodeURIComponent((document.getElementById('myvenn').src + arest).replace(document.getElementById('myvenn').src.split('?')[0].split('#')[0], document.URL.split('?')[0].split('#')[0])) + "' id=aemail title=Email>&#128231;</a></span>      <span id=spsms><a target=_blank onmouseover=\"if (smsee.length == 0 && origsmsurl.indexOf('sms:&') != -1) { smsee=prompt('Please enter SMS number to send to.', ''); if (smsee == null) { smsee=''; } else { origsmsurl=origsmsurl.replace('sms:&','sms:' + smsee + '&'); asmsurl=asmsurl.replace('sms:&','sms:' + smsee + '&'); this.href=asmsurl; } }\" ontouchstart=\"if (smsee.length == 0 && origsmsurl.indexOf('sms:&') != -1) { smsee=prompt('Please enter SMS number to send to.', ''); if (smsee == null) { smsee=''; } else { origsmsurl=origsmsurl.replace('sms:&','sms:' + smsee + '&'); asmsurl=asmsurl.replace('sms:&','sms:' + smsee + '&'); this.href=asmsurl; } }\" href='sms:&body=" + encodeURIComponent((document.getElementById('myvenn').src + arest).replace(document.getElementById('myvenn').src.split('?')[0].split('#')[0], document.URL.split('?')[0].split('#')[0])) + "' id=asms title=SMS>&#128223;</a></span><br><br>  <input id=ilp onblur=\"lasttext=this.value.replace(/\~\~/g, '<br>'); this.value=''; this.placeholder='Click where you want ... ' + lasttext.replace(/\<br\>/g, String.fromCharCode(10));\" placeholder='Enter text and later click place for it on Venn Diagram to left (line feed is ~~)' type=text style=width:500px; value=''></input>";
}
} else {
alert('Try again.');
ask(null);
}
}
}
atstart=false;
normalcall=true;
}

… in our changed second draft image_venn.html Google Chart Image Chart Venn Chart interfacing web application you can also try below.

Did you know?

As far as this WordPress blog’s 404.php role goes in all this, we were keen to maintain Venn Diagrams that were purely image based data, because the web browser sharing mechanisms are so much better this way, else we were tempted to just construct a webpage HTML dataset positioning text in an absolute way with a Venn Chart background image. In order to do these purely image based Venn Diagrams we used PHP’s GD image library as per

<?php

if (strpos(('?' . $_SERVER['QUERY_STRING']), '?cht=') !== false || strpos(('?' . $_SERVER['QUERY_STRING']), '&cht=') !== false) {

$theqs=str_replace('??','?',('?' . $_SERVER['QUERY_STRING']));
if (strpos($theqs, '?chs=') === false && strpos($theqs, '&chs=') === false) {
$theqs='?chs=' . $newWidth . 'x' . $newHeight . '&' . explode('?', $theqs)[1];
}

if (strpos(('?' . $_SERVER['QUERY_STRING']), 'text1=') !== false) {
$theone=2;
$im = imagecreatefromstring(file_get_contents('ht
tp://chart.googleapis.com/chart' . explode('&text1=', $theqs)[0]));

if (7 == 7) {

$plotstring=str_replace('+',' ',urldecode($_GET['text1']));
$csv=explode(',', $plotstring);
$black = imagecolorallocatealpha($im, 1, 1, 1, 0);
if (sizeof($csv) >= 3) {
try {
if (function_exists('imagettftext')) {
if (explode('' . $csv[0] . ',' . $csv[1] . ',', $plotstring)[1] !== '') {
//echo explode('' . $csv[0] . ',' . $csv[1] . ',', $plotstring)[1];
//exit;
imagettftext($im, 10, 0, $csv[0], $csv[1], $black, realpath('arial.ttf'), explode('' . $csv[0] . ',' . $csv[1] . ',', $plotstring)[1]);
}
}
} catch (Exception $e) { }
while (isset($_GET['text' . $theone])) {
$plotstring=str_replace('+',' ',urldecode($_GET['text' . $theone]));
$csv=explode(',', $plotstring);
if (sizeof($csv) >= 3) {
try {
if (function_exists('imagettftext')) {
if (explode('' . $csv[0] . ',' . $csv[1] . ',', $plotstring)[1] !== '') {
imagettftext($im, 10, 0, $csv[0], $csv[1], $black, realpath('arial.ttf'), explode('' . $csv[0] . ',' . $csv[1] . ',', $plotstring)[1]);
}
}
} catch (Exception $e) { }
}
$theone++;
}
}

}


header('Content-Type: image/png');

imagepng($im);
imagedestroy($im);
} else {

header('Content-Type: image/png');
echo file_get_contents('http://chart.googleapis.com/chart' . $theqs);
}
exit;

}

?>


Previous relevant Google Chart Image Chart Venn Chart Interfacing Primer Tutorial is shown below.

Google Chart Image Chart Venn Chart Interfacing Primer Tutorial

Google Chart Image Chart Venn Chart Interfacing Primer Tutorial

So, moving on from Google Charts Image Chart Map Charts, today, let’s turn our attention to Google Charts Image Chart Venn Charts which we were dead set curious about given work we’d done in the past regarding Venn Diagrams, which we referenced when we presented Flowchart and Venn Diagram and Mind Map Token Subject Emoji Tutorial some time back. Gobsmackingly good is the Google approach, again, as you’d expect, but the approach covers different ground, so one feels one should go back to Primary School! You thought we were going to give away the answer to one of those security questions, didn’t you?! Didn’t you!?! Well, the answer is “Gryffindor Slytherin Ravenclaw Hufflepuff Junior Business College” … if you must know.

The sharing capabilities are good with the Google Charts approach too, given we are creating an HTML image, as our WordPress blog good ol’ 404.php has been woken up to address via …

<?php

if (strpos(('?' . $_SERVER['QUERY_STRING']), '?cht=') !== false || strpos(('?' . $_SERVER['QUERY_STRING']), '&cht=') !== false) {

$theqs=str_replace('??','?',('?' . $_SERVER['QUERY_STRING']));
if (strpos($theqs, '?chs=') === false && strpos($theqs, '&chs=') === false) {
$theqs='?chs=' . $newWidth . 'x' . $newHeight . '&' . explode('?', $theqs)[1];
}


header('Content-Type: image/png');
echo file_get_contents('http://chart.googleapis.com/chart' . $theqs);
exit;

}

?>

Yes, all these Image Chart smarts come, essentially, from a “one line” calling URL! Who’d have believed it! Shiver me timbers!

Well, it’s early days with this Venn Chart interfacing where we allow for …

  • circle (think up to three) definition … and the rest, in this first draft (hoping you’ve done some reading)
  • legend and title and colour selection user definitions dumped into a fairly unfriendly “the rest” Javascript prompt entry we ask of the user should they go ahead with the previous definition … and …
  • sharing and collaboration email and SMS functionality

… we hope you try via our “proof of concept” first draft image_venn.html Google Chart Image Chart Venn Chart interfacing web application you can also try below …


If this was interesting you may be interested in this too.


If this was interesting you may be interested in this too.

If this was interesting you may be interested in this too.
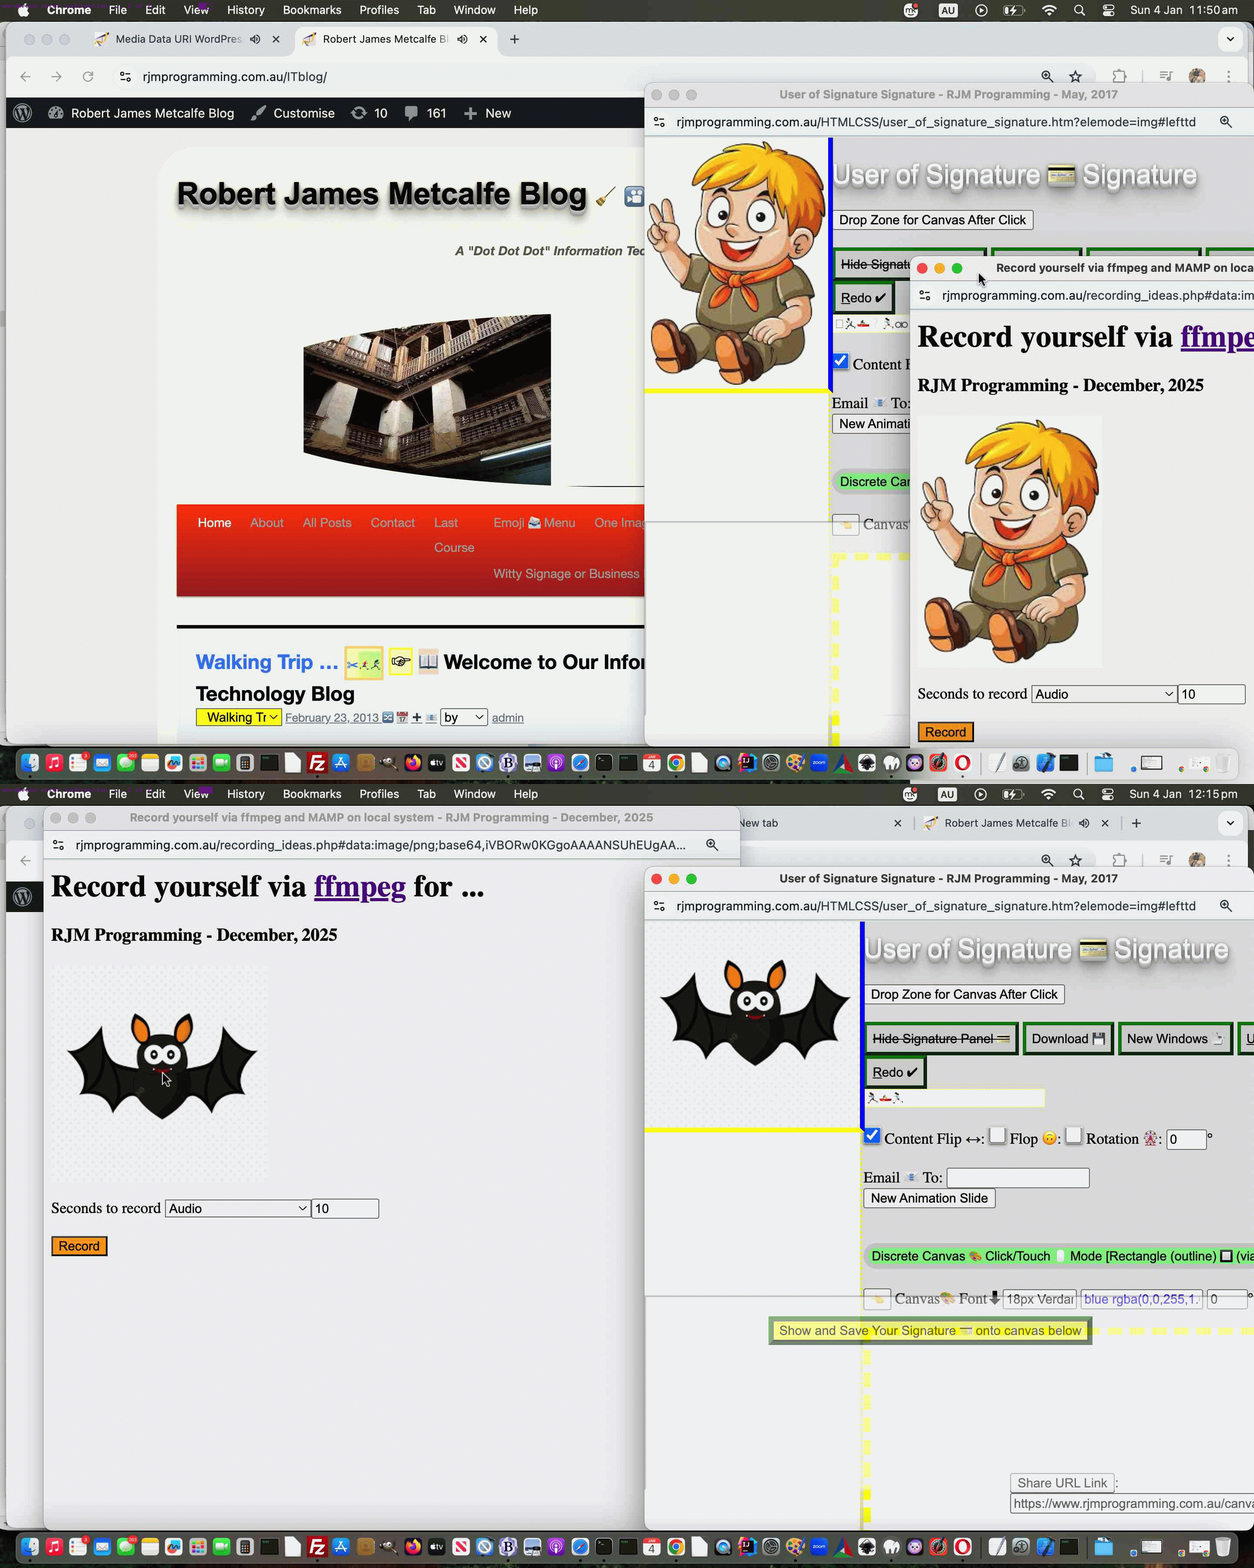

If this was interesting you may be interested in this too.
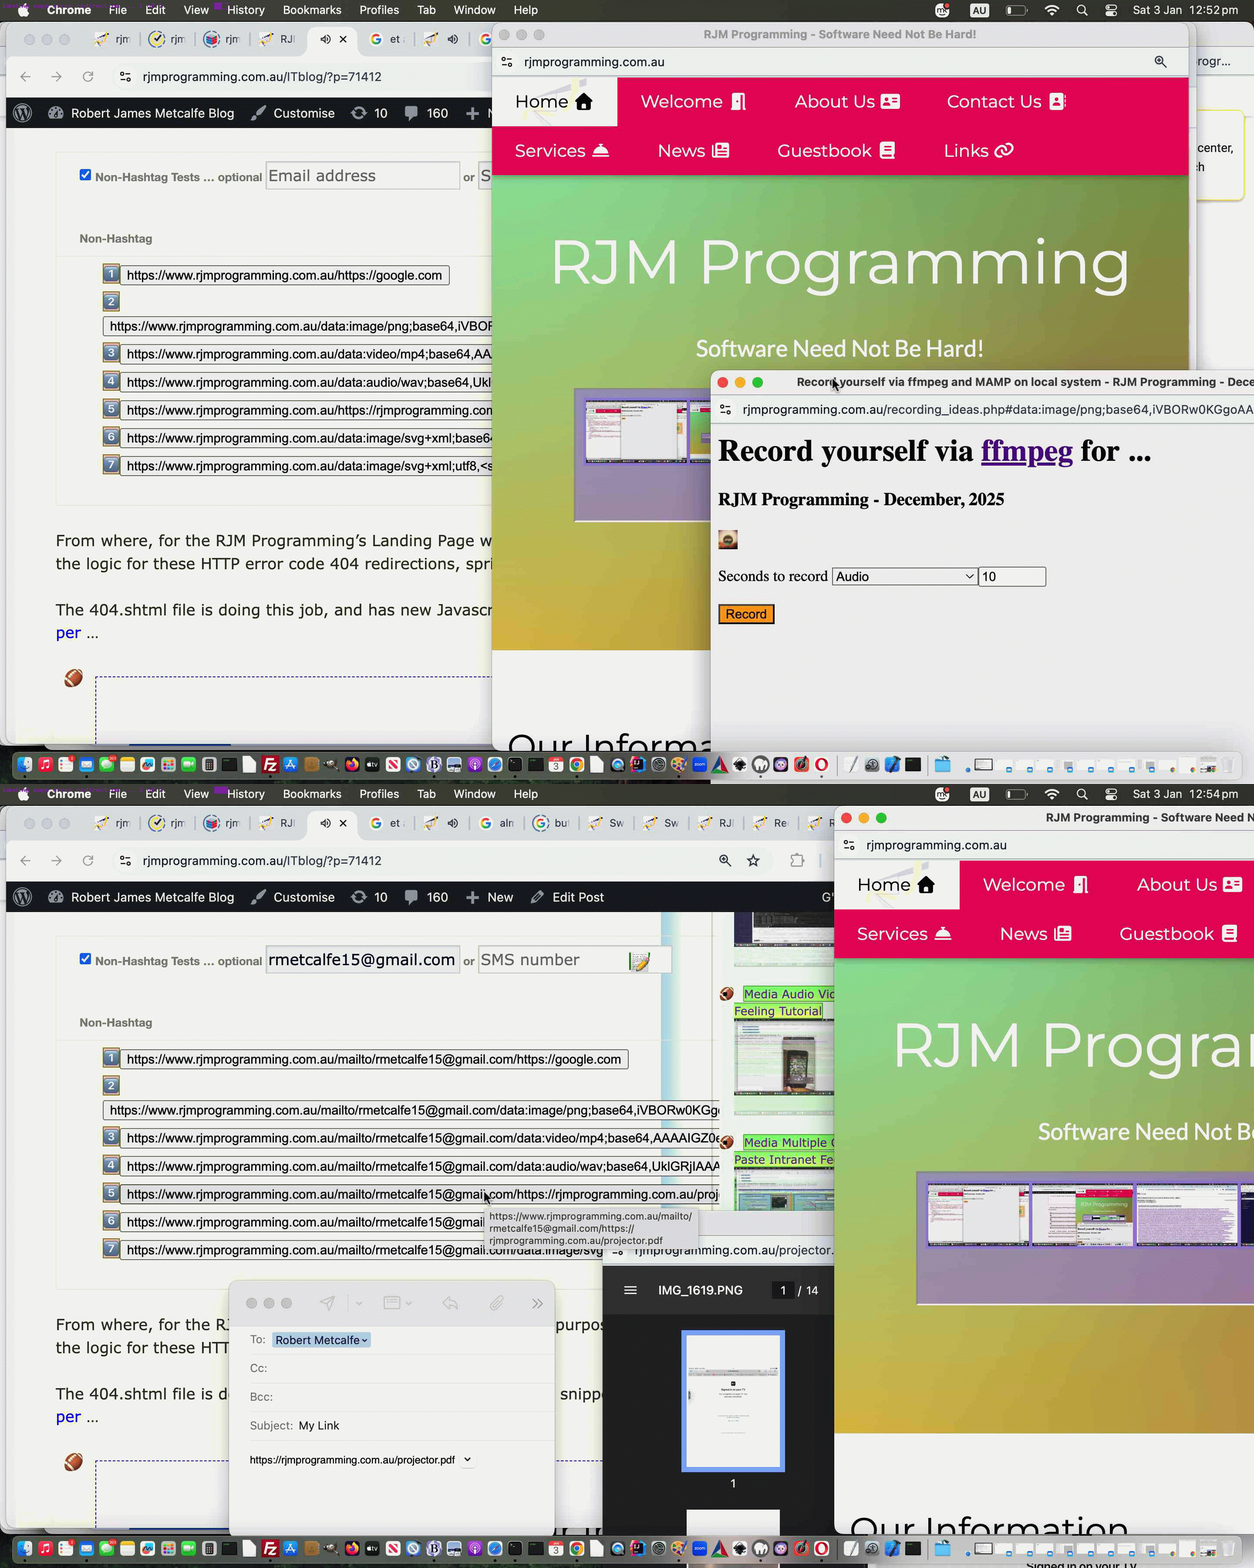

If this was interesting you may be interested in this too.
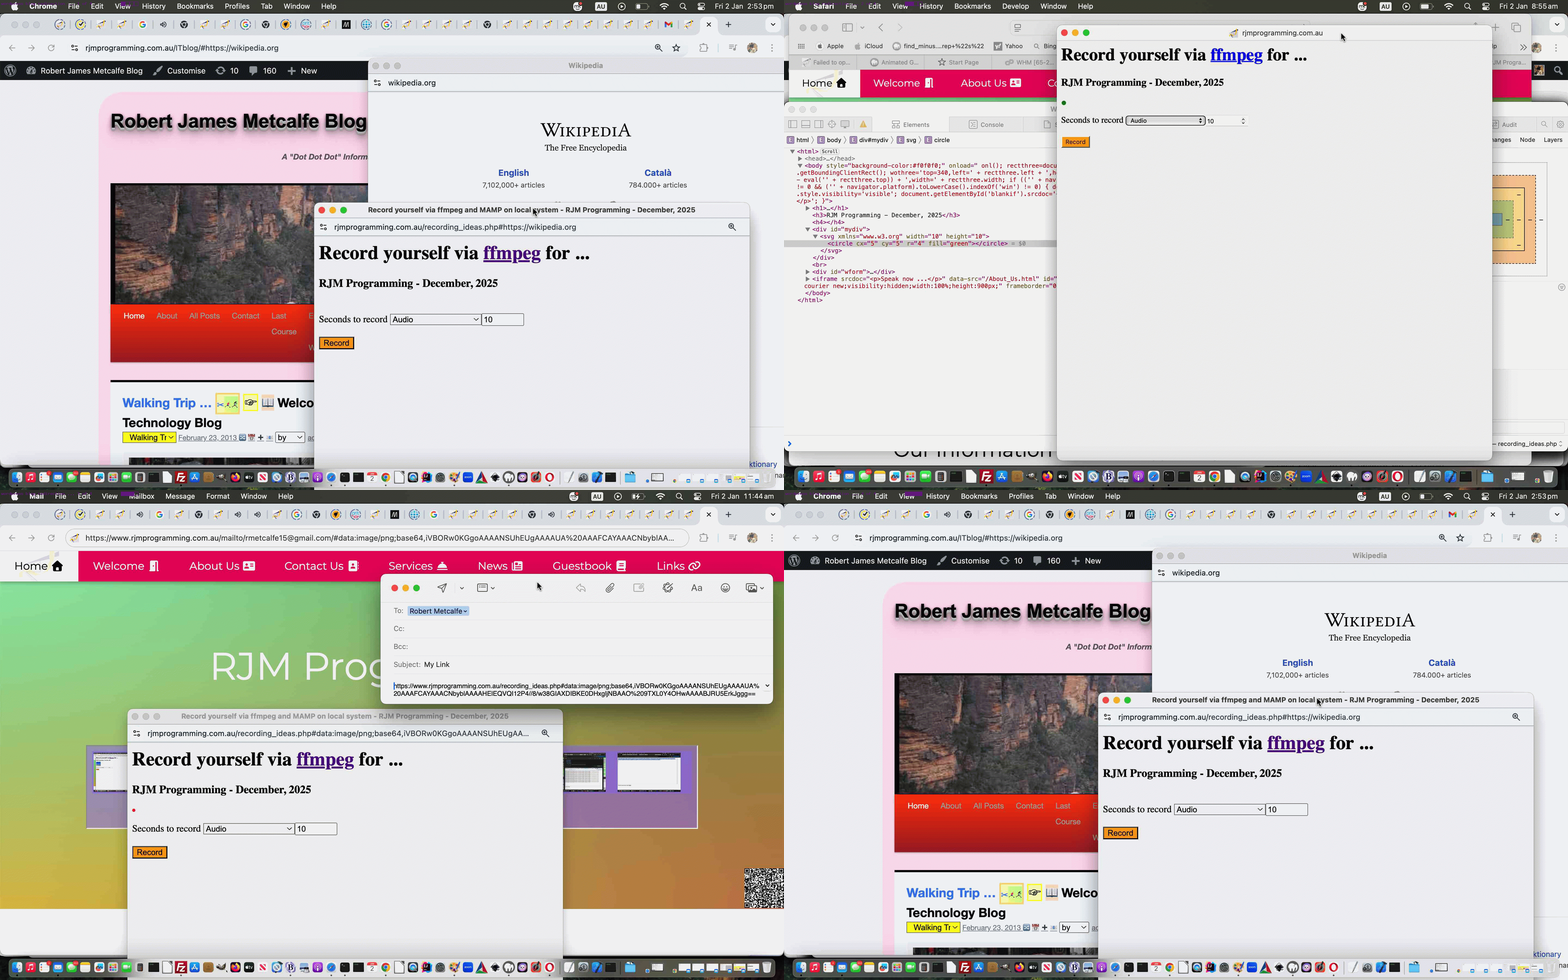

If this was interesting you may be interested in this too.
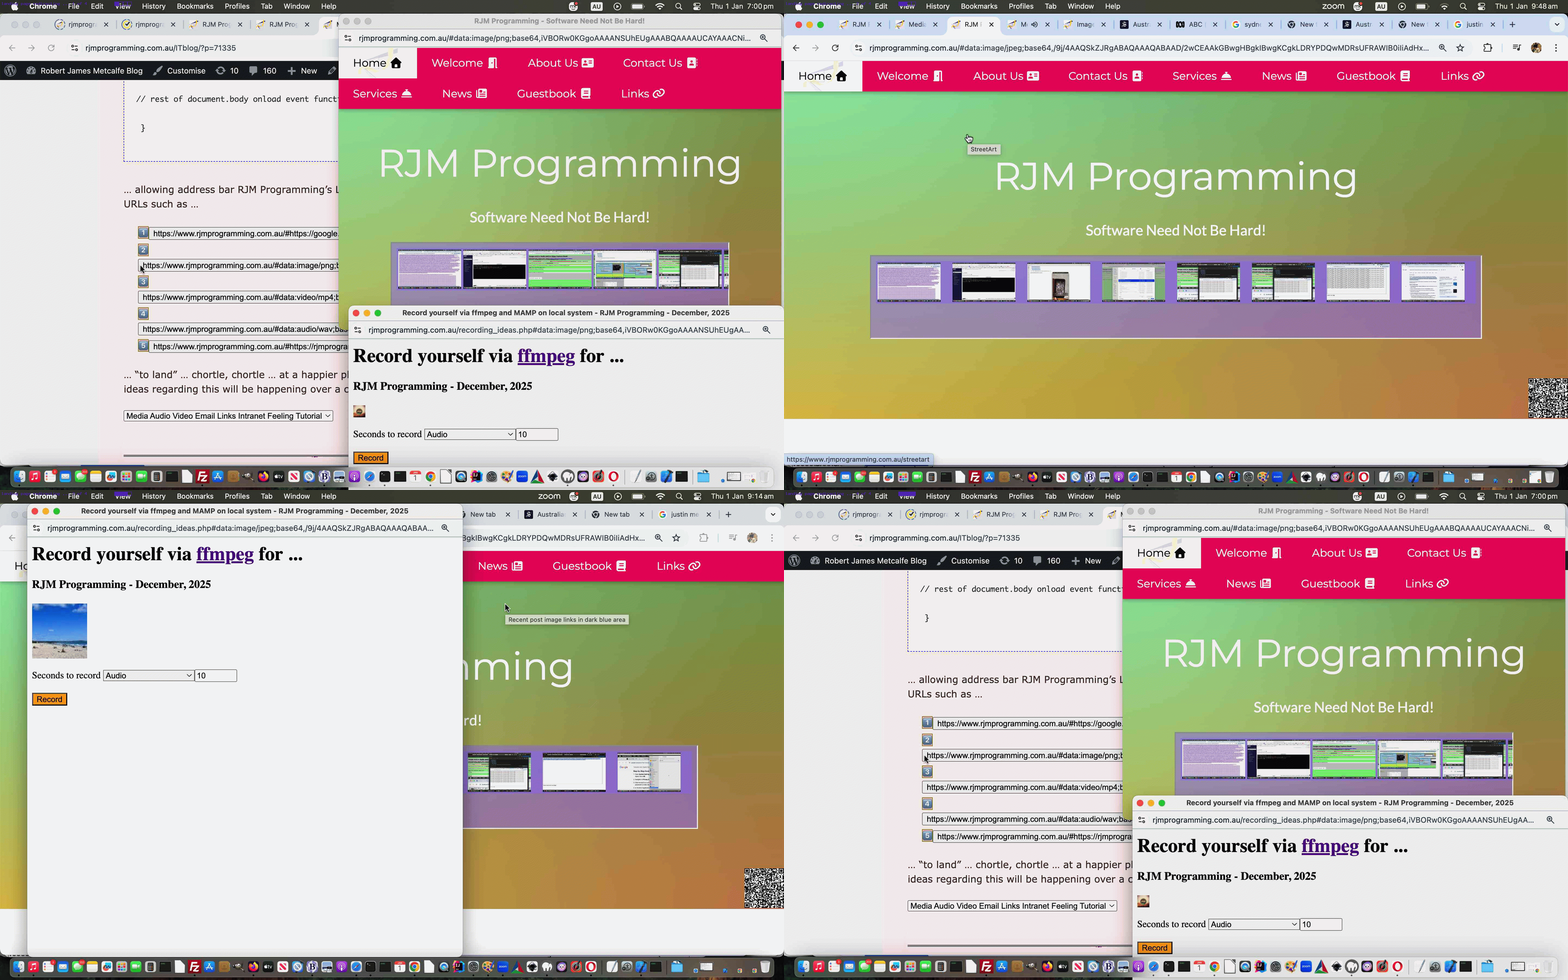

If this was interesting you may be interested in this too.

If this was interesting you may be interested in this too.
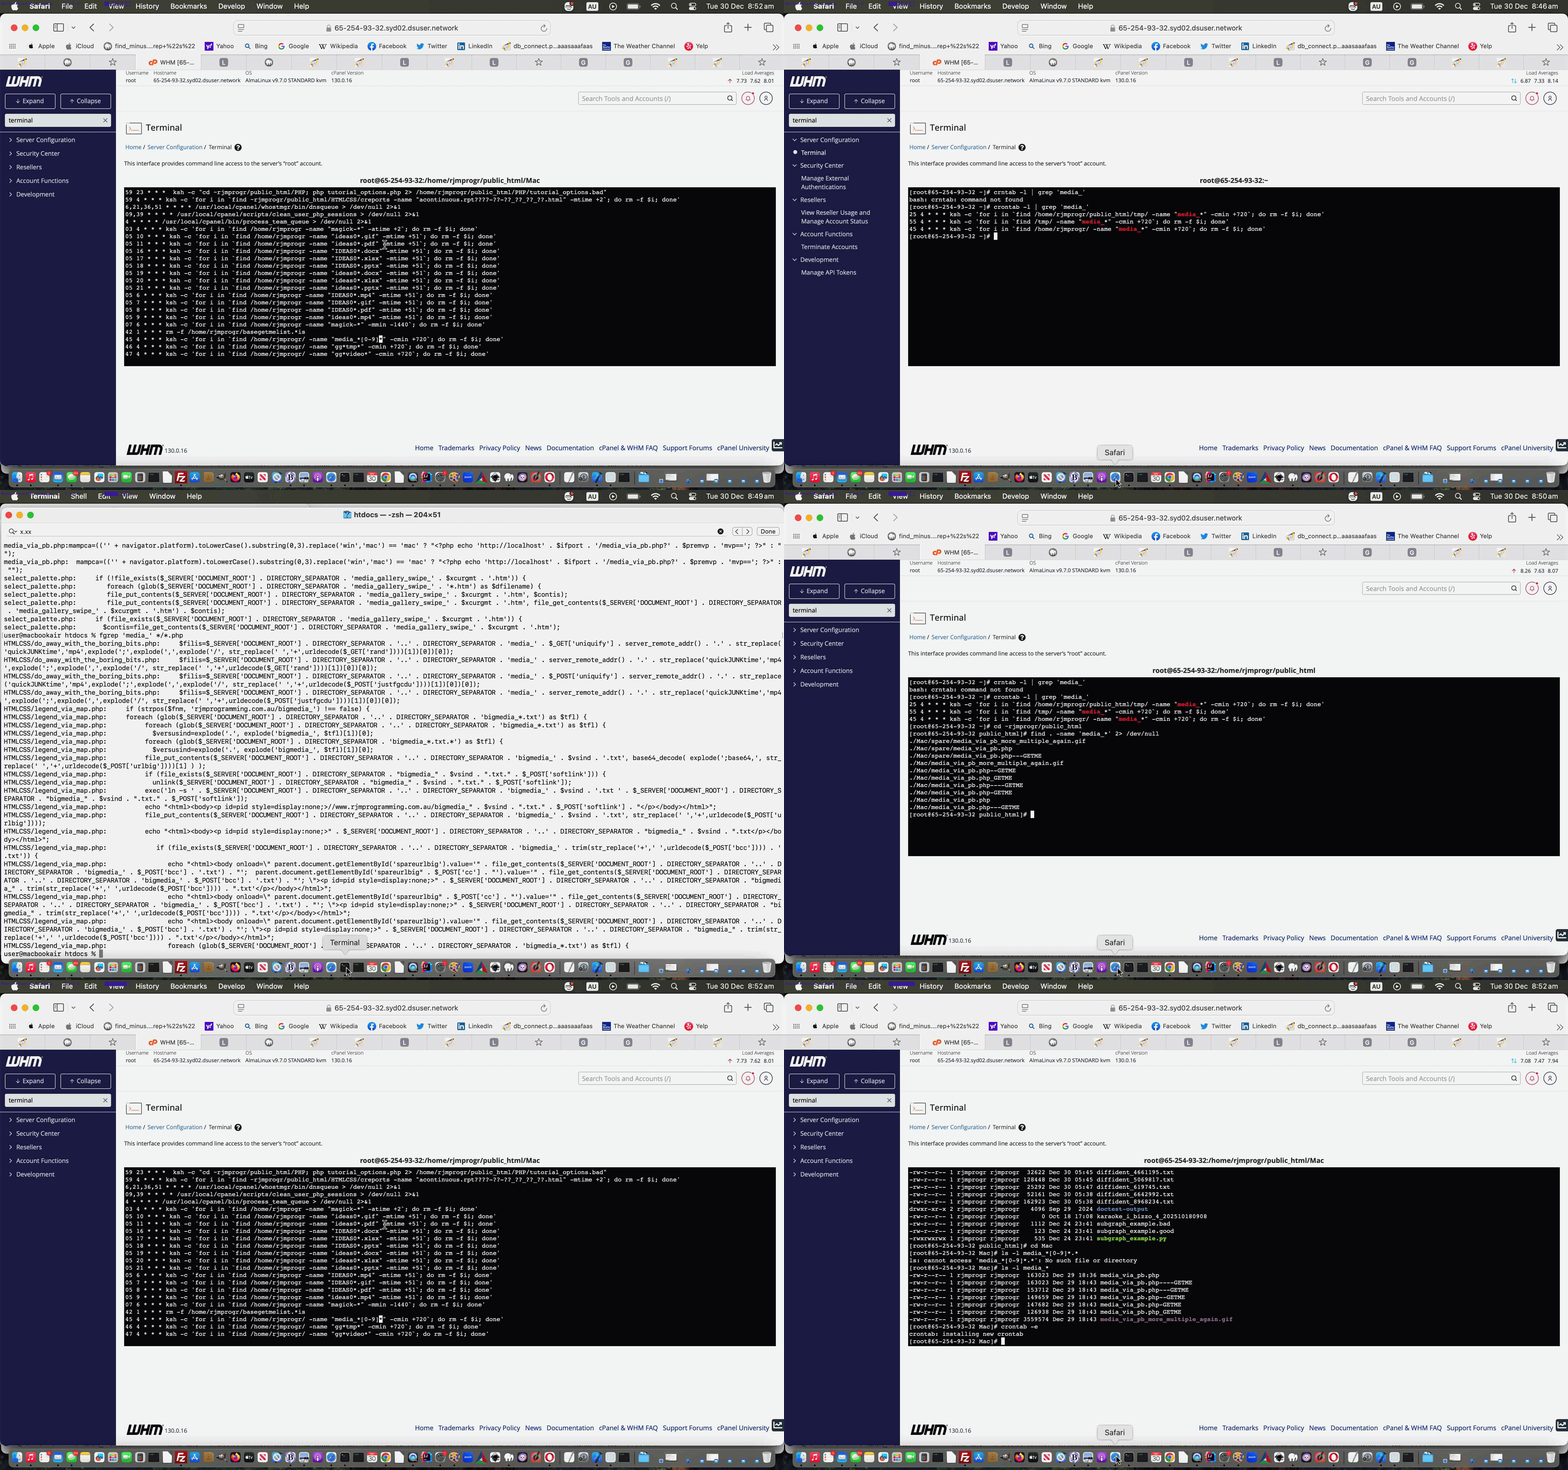

If this was interesting you may be interested in this too.

If this was interesting you may be interested in this too.

If this was interesting you may be interested in this too.

If this was interesting you may be interested in this too.

If this was interesting you may be interested in this too.


If this was interesting you may be interested in this too.
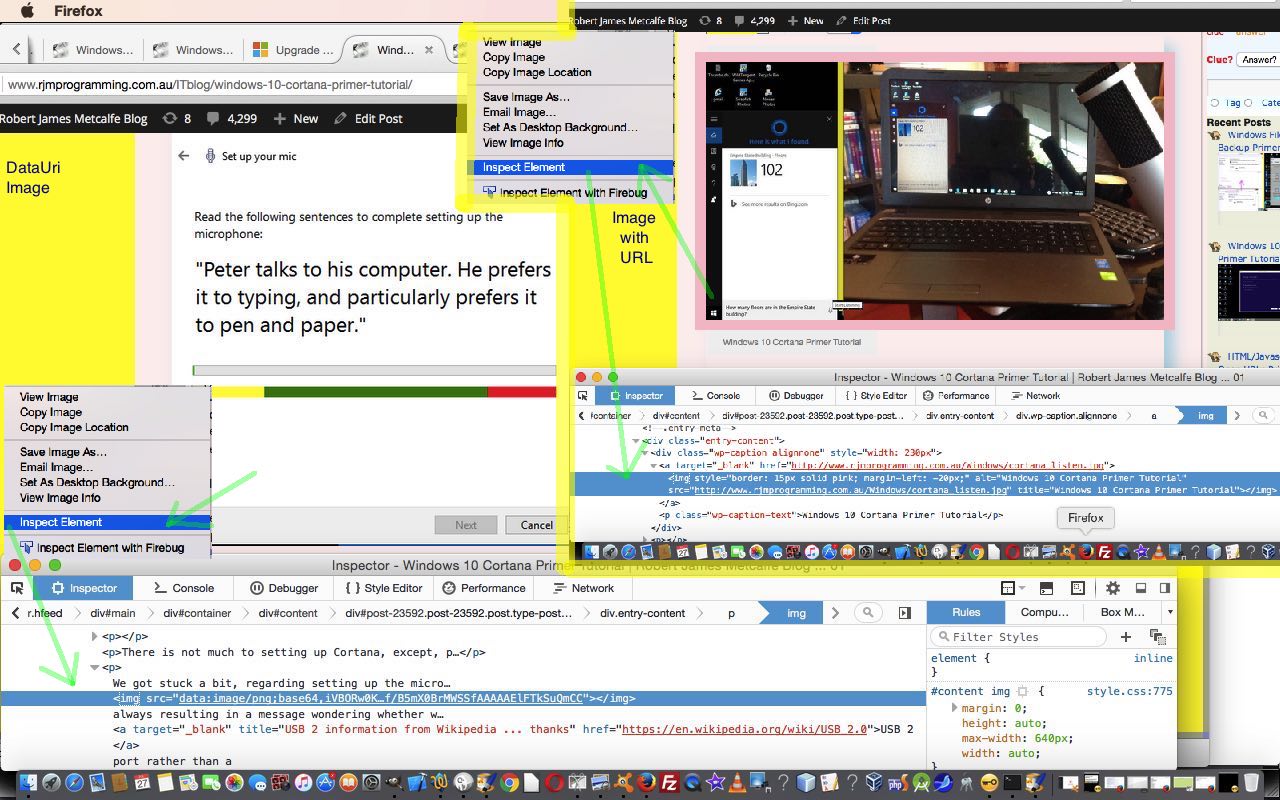

If this was interesting you may be interested in this too.

If this was interesting you may be interested in this too.
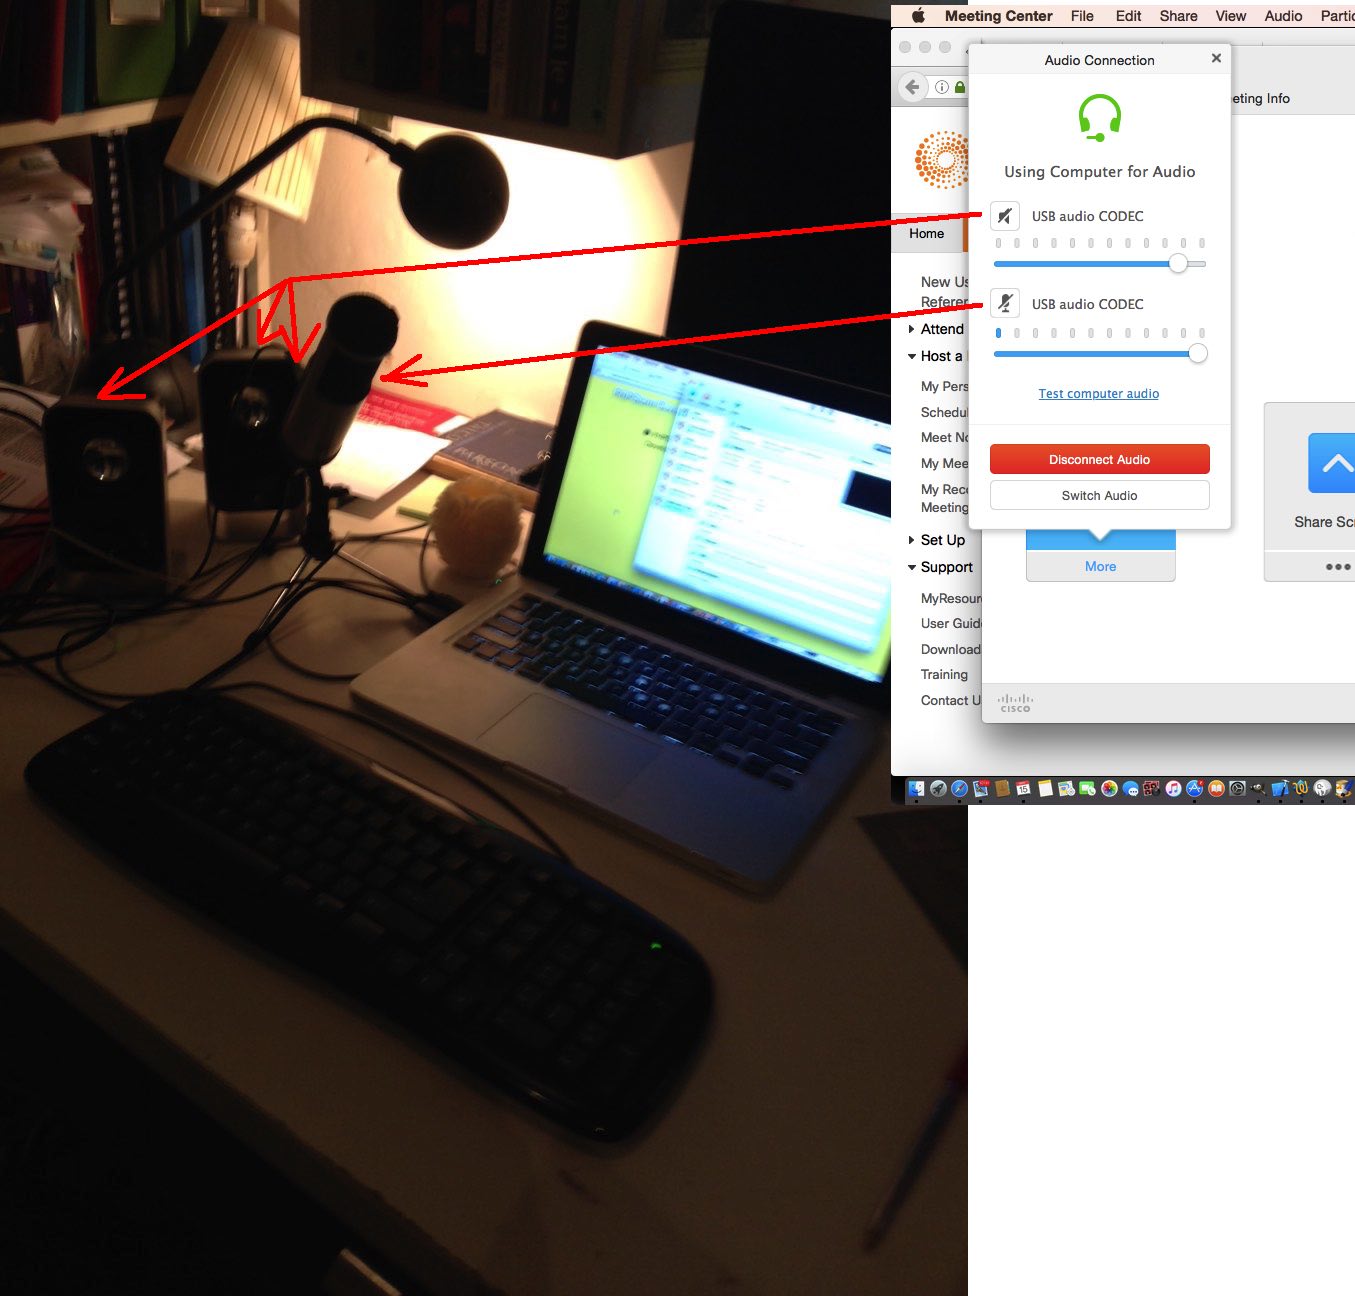

If this was interesting you may be interested in this too.


If this was interesting you may be interested in this too.


If this was interesting you may be interested in this too.


If this was interesting you may be interested in this too.


If this was interesting you may be interested in this too.


If this was interesting you may be interested in this too.


If this was interesting you may be interested in this too.


If this was interesting you may be interested in this too.


If this was interesting you may be interested in this too.


If this was interesting you may be interested in this too.


If this was interesting you may be interested in this too.


If this was interesting you may be interested in this too.


If this was interesting you may be interested in this too.

Posted in eLearning, Event-Driven Programming, Tutorials | Tagged , , , , , , , , , , , , , , , , , , , , , , , , , , , , , , , , , , , , , , , , , , , , , , , , , , , , , , , , , , , , , , | Leave a comment

Python GraphViz via PHP on AlmaLinux Family Tree Tutorial

Python GraphViz via PHP on AlmaLinux Family Tree Tutorial

Python GraphViz via PHP on AlmaLinux Family Tree Tutorial

Thinking on the hierarchical skills of GraphViz, it is not surprising that we turn to Family Tree functionality, as the follow up work onto yesterday’s Python GraphViz via PHP on AlmaLinux Organization Hierarchy Emoji Tutorial.

If you examine this how we got there link, you will see by how little has changed, how there is so much in common as we build on previous GraphViz work, rather than worrying about the differences … they soon become apparent as you test the https://forum.graphviz.org/t/emojis-not-working/1935/2 inspired family_tree.py Python code inspiration, thanks.

That last link’s Python code made us ditch the inhouse | and ; and . delimitation ideas in favour of the Python structure syntax, it being as self explanatory (or more, we daresay) as the inhouse delimiter ideas, and easier to implement …

<?php

// family_tree.php
// RJM Programming
// September, 2024
// Trying out Python GraphViz package ... thanks to https://forum.graphviz.org/t/emojis-not-working/1935/2

$abl=['my_family_tree',"\"Malik✅\", \"Cecil\", \"Sultan\"","\"Mehwish\", \"Miriam\", \"Sultana\"","\"Malik✅\": [\"Sultan\", \"Usman\"], \"Cecil\": [\"Margaret\", \"Christina\"], \"Sultan\": [\"Lilly\", \"Adam\"]"];
$newabl=['my-family-tree',"\"Malik✅\", \"Cecil\", \"Sultan\"","\"Mehwish\", \"Miriam\", \"Sultana\"","\"Malik✅\": [\"Sultan\", \"Usman\"], \"Cecil\": [\"Margaret\", \"Christina\"], \"Sultan\": [\"Lilly\", \"Adam\"]"];

// lots more PHP code follows
?>

It also served to remind us that users might want to embed emojis into their Family Tree names, so to leave SVG as our default output format would be advantageous, again. All the Stop Press ideas yesterday were relevant too, for the PHP family_tree.php Family Tree creation …

Calling cab (6754 – 6756 + 5).

… helper (of Python).

Sharing and collaboration concepts mean that we can share links such as The Simpsons Family Tree we gleaned from thanks to this great link to look like as shown in today’s animated GIF presentation.


Previous relevant Python GraphViz via PHP on AlmaLinux Organization Hierarchy Emoji Tutorial is shown below.

Python GraphViz via PHP on AlmaLinux Organization Hierarchy Emoji Tutorial

Python GraphViz via PHP on AlmaLinux Organization Hierarchy Emoji Tutorial

As far as the title of today’s tutorial goes, onto yesterday’s Python GraphViz via PHP on AlmaLinux Organization Hierarchy Tutorial, we figure “the new word” in the title could have come from …

  • Emoji … as we decided upon (as much as anything, because non-ascii characters for other non-English language requirements, might now be possible within the content of the GraphViz entity, as a result) … or …
  • Format … or …
  • Sharing … or …
  • Encoding … or …
  • Delimitation

We wanted to look back at yesterday to it’s “code architecture”, if you will, as a “lead in” to where we are coming at here. Yesterday, in the user definable textarea elements …

| … “edge” linkage record set delimiter
; … parent from rest delimiter
, … rest child name(s) delimiter

… this user usage delimiter characters “inhouse rules” architecture contributes to making it all the more crucial in the coding, to nail down how the + character is handled …

<?php echo ”

function contentfix(inid) {
document.getElementById('ititle').value=document.getElementById('ititle').value.replace(/\+/g,'-').replace(/\=/g,'-').replace(/\ /g,'-');
document.getElementById('none').value=various(document.getElementById('one').value.replace(/\+/g,String.fromCharCode(9)));
document.getElementById('ntwo').value=various(document.getElementById('two').value.replace(/\+/g,String.fromCharCode(9)));
document.getElementById('nthree').value=various(document.getElementById('three').value.replace(/\+/g,String.fromCharCode(9)));
return inid;
}

“; ?>

… which, as you can see with our HTML form onsubmit event fired Javascript function above, amounts to mapping real content + characters to horizontal tab to differentiate this mode of use from the use HTML form encoding uses for it to represent an encoded space character. Are you now getting a bit of an idea with today’s “tidying up” and “nuancing” feel?!

What about if any “edge” names contain one of those delimiters, as above? Well, we try …

<?php echo ”

function various(indi) {
var outdi=indi;
outdi=outdi.replace(/\|\;/g, encodeURIComponent('|') + ';');
outdi=outdi.replace(/\,\;/g, encodeURIComponent(',') + ';');
outdi=outdi.replace(/\;\;/g, encodeURIComponent(';') + ';');

outdi=outdi.replace(/\|\,/g, encodeURIComponent('|') + ',');
outdi=outdi.replace(/\,\,/g, encodeURIComponent(',') + ',');
outdi=outdi.replace(/\;\,/g, encodeURIComponent(';') + ',');

outdi=outdi.replace(/\|\|/g, encodeURIComponent('|') + '|');
outdi=outdi.replace(/\,\|/g, encodeURIComponent(',') + '|');
outdi=outdi.replace(/\;\|/g, encodeURIComponent(';') + '|');

return outdi;
}

“; ?>

… in that regard, and “double decode” (with a bit of nuance in between) on the other side, to try to account for this. We’ll see!

But the day started thinking about Emojis. What would happen in our PDF default output with Emoji content being introduced by the user within input textarea elements, as they go to Draw their Hierarchical Organization chart? Well, not so good. But, thanks to Graphviz not supporting UTF-8 encoding webpage, we got put onto the idea that an alternative, and now the default, format of output could be SVG … and trying it worked … thanks!

And then there’s Sharing (and collaboration) thoughts, again?! Email and SMS hashtagged URLs, again?! Well, here, we modelled ideas from the sharing ideas of the PDF to Images and Microsoft Office on AlmaLinux Tutorial thread of blog postings, ending up with …

<?php echo ”

function emailit(inais) {
event.stopPropagation();
var em=null;
em=prompt('Please enter email address to send output ' + document.getElementById('fmt').value + ' URL link to.', '');
if (em == null) { em=''; }
if (em.indexOf('@') != -1) {
document.getElementById('ititle').value=document.getElementById('ititle').value.replace(/\+/g,'-').replace(/\=/g,'-').replace(/\ /g,'-');
document.getElementById('none').value=various(document.getElementById('one').value.replace(/\+/g,String.fromCharCode(9)));
document.getElementById('ntwo').value=various(document.getElementById('two').value.replace(/\+/g,String.fromCharCode(9)));
document.getElementById('nthree').value=various(document.getElementById('three').value.replace(/\+/g,String.fromCharCode(9)));
em+='?subject=Hierarchy%20Organization&body=' + encodeURIComponent( (document.URL.split('?')[0].split('#')[0] + '?rand=' + Math.floor(Math.random() * 19897865) + '#title=' + encodeURIComponent(document.getElementById('ititle').value) + '#fmt=' + encodeURIComponent(document.getElementById('fmt').value) + '#one=' + encodeURIComponent(document.getElementById('none').value) + '#two=' + encodeURIComponent(document.getElementById('ntwo').value) + '#three=' + encodeURIComponent(document.getElementById('nthree').value)).replace('#fmt=svg#one=#','#fmt=pdf#one=#') );
document.getElementById('dimap').innerHTML=\"<a style=display:none; id=theaemail target=_blank href='mailto:\" + em + \"'>Email</a>\";
document.getElementById('theaemail').click();
}
return false;
}

function smsit(inais) {
event.stopPropagation();
var em=null;
em=prompt('Please enter SMS number to send output ' + document.getElementById('fmt').value + ' URL link to.', '');
if (em == null) { em=''; }
if (em.trim() != '') {
document.getElementById('ititle').value=document.getElementById('ititle').value.replace(/\+/g,'-').replace(/\=/g,'-').replace(/\ /g,'-');
document.getElementById('none').value=various(document.getElementById('one').value.replace(/\+/g,String.fromCharCode(9)));
document.getElementById('ntwo').value=various(document.getElementById('two').value.replace(/\+/g,String.fromCharCode(9)));
document.getElementById('nthree').value=various(document.getElementById('three').value.replace(/\+/g,String.fromCharCode(9)));
em+='&body=' + encodeURIComponent( (document.URL.split('?')[0].split('#')[0] + '?rand=' + Math.floor(Math.random() * 19897865) + '#title=' + encodeURIComponent(document.getElementById('ititle').value) + '#fmt=' + encodeURIComponent(document.getElementById('fmt').value) + '#one=' + encodeURIComponent(document.getElementById('none').value) + '#two=' + encodeURIComponent(document.getElementById('ntwo').value) + '#three=' + encodeURIComponent(document.getElementById('nthree').value)).replace('#fmt=svg#one=#','#fmt=pdf#one=#') );
document.getElementById('dimap').innerHTML=\"<a style=display:none; id=theasms target=_blank href='sms:\" + em + \"'>SMS</a>\";
if (!document.getElementById('theasms') && document.getElementById('psms')) {
document.getElementById('psms').click();
} else {
document.getElementById('theasms').click();
}
}
}
return false;
}

“; ?>

… within the changed hierarchy_organization.php Hierarchy Organization diagram “drawer”.

Stop Press

And then it occurred to us that there is also the GraphViz graph mode ( default Digraph versus Graph ), and it’s “edge” element background colour and shape and font size, as well as a resizing mechanism, that could be up for grabs, via user input in the tweaked hierarchy_organization.php Hierarchy Organization diagram “drawer”.


Previous relevant Python GraphViz via PHP on AlmaLinux Organization Hierarchy Tutorial is shown below.

Python GraphViz via PHP on AlmaLinux Organization Hierarchy Tutorial

Python GraphViz via PHP on AlmaLinux Organization Hierarchy Tutorial

Calling cab (6754 – 6756 + 4).

Huh?!

Calling the second cab off the rank.

Yes, now that we understand a bit more about file permission issues, after yesterday’s Python GraphViz via PHP on AlmaLinux Permissions Tutorial, having PHP hosting Python with GraphViz calls, let’s turn our attention to the issue of “lots of data”, today, with our …


Organization Hierarchyist

… what do you say?! It’s a bit embarrassingly easy a remedy because we are writing in PHP, to just …

  • make any $_GET[] (web browser address bar arguments) references become $_POST[] equivalents … and any …
  • HTML form method=GET should become HTML form method=POST

Calling log (6754 – 6756 + 4 – 1) … to fall off.

Python code wise, our hierarchy_organization.py inspiration came from https://graphviz.readthedocs.io/en/stable/examples.html thanks.

Then we worked on PHP hierarchy_organization.php to be as close to being a buddy with a Python as, well, Monty?!


Previous relevant Python GraphViz via PHP on AlmaLinux Permissions Tutorial is shown below.

Python GraphViz via PHP on AlmaLinux Permissions Tutorial

Python GraphViz via PHP on AlmaLinux Permissions Tutorial

Did you guess, regarding the Python Graphviz via PHP work of yesterday’s Python GraphViz via PHP on AlmaLinux Tutorial, we were experiencing File Permission issues?

Well, yesterday, regarding the Python Graphviz via PHP work of yesterday’s Python GraphViz via PHP on AlmaLinux Tutorial, we were experiencing File Permission issues.

We thought we’d move the Python, via PHP processing, totally into the purview of the web server administration owner, by involving a …

  1. Korn Shell *.ksh … supervised by …
  2. crontab … pointing to …

    ksh -c 'for i in `find /home/rjmprogr/public_html/ -name "subgraph_example_*.ksh"`; do ksh -c `echo $i`; done'

    … very regularly

… arrangement, but even that failed, in a first incarnation using /tmp/ placement of the Korn Shell file. “Permission denied”, again. Running a Korn Shell from /tmp/ on AlmaLinux must be a no-no, so moved the place to be AlmaLinux web server’s Document Root place, and then things started happening, in the changed subgraph_example.php Python GraphViz using web application.


Previous relevant Python GraphViz via PHP on AlmaLinux Tutorial is shown below.

Python GraphViz via PHP on AlmaLinux Tutorial

Python GraphViz via PHP on AlmaLinux Tutorial

Do you remember reading, with PHP Image GraphViz via Pear on AlmaLinux Primer Tutorial below, our outlining three known GraphViz guises …

  • the recent, alas now deprecated, Google Charts Image Charts GraphViz option means of drawing SVG graphics within an HTML image … we’ve known about before about yesterday
  • today’s interest, that being PHP Image GraphViz via Pear on AlmaLinux install, via the AlmaLinux cPanel “Module Installers” Pear installer page, means by which we can use GraphViz calls in PHP code … and, for the future …
  • GraphViz installs for Python via pip

…? Well, today, we start down the road of …

  1. installing Python GraphViz package via …

    pip install graphviz

    … then …
  2. getting great help from https://graphviz.readthedocs.io/en/stable/, thanks, as the Python code basis we call subgraph_example.py … and …
  3. used and remoulded by our overseeing PHP subgraph_example.php Python GraphViz using web application

… we need to work on more after this first draft start to another road of our GraphViz journey last talked about at PHP Image GraphViz via Pear on AlmaLinux Focus Tutorial.


Previous relevant PHP Image GraphViz via Pear on AlmaLinux Focus Tutorial is shown below.

PHP Image GraphViz via Pear on AlmaLinux Focus Tutorial

PHP Image GraphViz via Pear on AlmaLinux Focus Tutorial

It reared it’s ugly head with the Animated GIF Creator here at RJM Programming (helped out by the great Jeroen van Wissen open source work, thanks). And with yesterday’s PHP Image GraphViz via Pear on AlmaLinux Recallable Tutorial it reared up again.

On non-mobile focus goes to the address bar on many web browsers unless there is a (nominally) visible input type=text or textarea next in line.

It’s hard to keep in mind except as it “rears up” in an annoying way, but if we’d thought back, yes, we allow in the linked list feel of revealing textboxes (or textareas) only as they are needed scenarios we allow for two blank ones to be (nominally) visible at any given time … not one … but two, presumably because there is a tiny Javascript DOM “refresh period” not short enough to stop the web browser “desperation measure” (of placing focus in the address bar) happening?!

Why the non-mobile mention? Well, on mobile, a user programming [HTMLelement].focus(); call has no affect, as the touch operating systems need control of focus arrangements, presumably?!

How can we forget? My liege, please accept my humble apologies?!

Why the (nominally) mentions? Well, we have, successfully, in the past, just arranged a (statically HTML placed) textbox (ie. input type=text) that sits outside the viewing screen but not (nominally) invisible (eg. style=’position:absolute;top:-200px;left:-200px;’) can help you avoid the focus going up to the web browser address bar.

So that’s that, and other progress today is to allow the emailing or SMS of a recalled URL Step arrangement via more options on that “Recall Dropdown” we started allowing for yesterday.

Please see this happening in our changed PHP coded My Recipe Steps web application you can also try below.


Previous relevant PHP Image GraphViz via Pear on AlmaLinux Recallable Tutorial is shown below.

PHP Image GraphViz via Pear on AlmaLinux Recallable Tutorial

PHP Image GraphViz via Pear on AlmaLinux Recallable Tutorial

After yesterday’s PHP Image GraphViz via Pear on AlmaLinux Sharing Tutorial some readers may be curious to understand the distinction between …

  • email and SMS sharing … and …
  • inhouse intersessional sharing via window.localStorage (ie. like HTTP Cookies)

… over yesterday’s and today’s blog posting timings. Simply put, for us, we …

  • take a deep breath before starting intersessional window.localStorage work, as it is not to be sneezed at, as any sort of doddle (at least for us) … as well as …
  • since last intersessional window.localStorage work we’ve started using email and SMS sharing hashtagging arrangements that fit in, like a glove, with this intersessional window.localStorage work … so that …
  • even though, we write the code here in PHP, all this functionality is client based … which we like because …
  • get the idea correct, with careful forward planning and implementation, we’ll be able to apply similar such thinking into the future, whether that be for clientside only web applications and/or ones that call on serverside code (like PHP) … and …
  • if we can keep things just clientside more readers can be involved, we figure

If you’re wondering about the worry of any of this, it is to do with large title and/or URL link and/or ingredient type data whose data length could be huge, where most of our concern lies, and …

  • hashtagging (where data limits are so much longer) can help it remain as a clientside only solution environment (rather than relying on some form method=POST to a serverside (eg. PHP) receiver solution) …
  • window.localStorage is a step up from the HTTP Cookie style of intersessional (personal) storage as far as amounts that can be stored is concerned

What are we aiming for here, then, with our improvements?

  • extend the existant email and SMS functionality …
    <?php echo ”

    function emailit(insg) {
    var em='', ccok='';
    if (estitle == '') {
    if (cookb.split(' Or hash delimited appended string can ')[0] != '') {
    cookb=cookb.replace(cookb.split(' Or hash delimited appended string can ')[0], '');
    }
    }
    if (('' + insg).replace(/^null/g,'').replace(/^undefined/g,'').trim() != '') {
    em='' + insg;
    } else {

    em=prompt('Please enter Email address to share with. ' + cookb, '');
    }
    if (em != null) {
    if (em.trim() == '' && estitle != '') {
    em='#' + estitle;
    } else if (em == estitle && estitle != '') {
    em='#' + estitle;
    }
    }
    if (em.indexOf('#') != -1) {
    cook=em.substring(eval(1 + eval('' + em.indexOf('#'))));
    em=em.split('#')[0].trim();
    if (cook.trim() != '') {
    deleteAVal('steps_' + cook.replace(/\ /g,'-'),'');
    setAVal('steps_' + cook.replace(/\ /g,'-'), \"" . $hashurl . $hashurld . "\" + anyhashes);
    }
    }

    if (em == null) { em=''; }
    if (em.trim() != '') {
    if (em.trim().indexOf('@') != -1) {
    em+='?subject=Steps&body=' + encodeURIComponent(\"" . $hashurl . $hashurld . "\" + anyhashes);
    document.getElementById('dimap').innerHTML=\"<a style=display:none; id=theaemail target=_blank href='mailto:\" + em + \"'>Email</a>\";
    document.getElementById('theaemail').click();
    } else if (em.trim().replace(/0/g,'').replace(/1/g,'').replace(/2/g,'').replace(/3/g,'').replace(/4/g,'').replace(/5/g,'').replace(/6/g,'').replace(/7/g,'').replace(/8/g,'').replace(/9/g,'') == '') {
    em+='&body=' + encodeURIComponent(\"" . $hashurl . $hashurld . "\" + anyhashes);
    document.getElementById('dimap').innerHTML=\"<a style=display:none; id=theasms target=_blank href='sms:\" + em + \"'>SMS</a>\";
    document.getElementById('theasms').click();
    }
    }
    return false;

    }

    function smsit(insg) {
    var em='', cook='';
    if (estitle == '') {
    if (cookb.split(' Or hash delimited appended string can ')[0] != '') {
    cookb=cookb.replace(cookb.split(' Or hash delimited appended string can ')[0], '');
    }
    }
    if (('' + insg).replace(/^null/g,'').replace(/^undefined/g,'').trim() != '') {
    em='' + insg;
    } else {

    em=prompt('Please enter SMS number to share with. ' + cookb, '');
    }
    if (em != null) {
    if (em.trim() == '' && estitle != '') {
    em='#' + estitle;
    } else if (em == estitle && estitle != '') {
    em='#' + estitle;
    }
    }
    if (em.indexOf('#') != -1) {
    cook=em.substring(eval(1 + eval('' + em.indexOf('#'))));
    em=em.split('#')[0].trim();
    if (cook.trim() != '') {
    deleteAVal('steps_' + cook.replace(/\ /g,'-'),'');
    setAVal('steps_' + cook.replace(/\ /g,'-'), \"" . $hashurl . $hashurld . "\" + anyhashes);
    }
    }

    if (em == null) { em=''; }
    if (em.trim() != '') {
    if (em.trim().replace(/0/g,'').replace(/1/g,'').replace(/2/g,'').replace(/3/g,'').replace(/4/g,'').replace(/5/g,'').replace(/6/g,'').replace(/7/g,'').replace(/8/g,'').replace(/9/g,'') == '') {
    em+='&body=' + encodeURIComponent(\"" . $hashurl . $hashurld . "\" + anyhashes);
    document.getElementById('dimap').innerHTML=\"<a style=display:none; id=theasms target=_blank href='sms:\" + em + \"'>SMS</a>\";
    document.getElementById('theasms').click();
    } else if (em.trim().indexOf('@') != -1) {
    em+='?subject=Steps&body=' + encodeURIComponent(\"" . $hashurl . $hashurld . "\" + anyhashes);
    document.getElementById('dimap').innerHTML=\"<a style=display:none; id=theaemail target=_blank href='mailto:\" + em + \"'>Email</a>\";
    document.getElementById('theaemail').click();
    }
    }
    return false;
    }

    “; ?>
    … to cater for additional personalized Title (of steps) and Content of steps (using the hashtagging email and SMS URL methods set up yesterday)
    <?php echo ”

    var estitle=\"" . $estitle . "\";
    var cookb=\"" . $cookblurb . "\";
    var lssel='';
    var woo=null;

    function deleteAVal(goodname, aparticularvalue) {
    if (window.localStorage && goodname.indexOf('steps_') == 0) {
    if (('' + localStorage.getItem(goodname)).replace(/^undefined/g,'').replace(/^null/g,'') != '') {
    if (aparticularvalue == '') {
    localStorage.removeItem(goodname);
    } else {
    if (aparticularvalue.replace('HTTP','http').toLowerCase() == ('' + localStorage.getItem(goodname)).toLowerCase()) {
    localStorage.removeItem(goodname);
    }
    }
    }
    }
    }

    function setAVal(cName, cVal) {
    if (cName.indexOf('steps_') == 0) {
    if (window.localStorage) {
    localStorage.setItem(cName, encodeURIComponent(cVal));
    cookieAVal('steps_', true);
    return ' ';
    }
    return '';
    }
    return '';
    }

    function gotothis(inu) {
    if (inu.trim() != '') {
    if (inu.indexOf('HTTP') == 0) {
    //alert('2:' + inu);
    if (inu.indexOf('#steps_') != -1) {
    //alert('22:' + inu.split('#')[eval(-1 + inu.split('#').length)]);
    deleteAVal(inu.split('#')[eval(-1 + inu.split('#').length)], encodeURIComponent(inu.replace('#' + inu.split('#')[eval(-1 + inu.split('#').length)], '').replace('HTTP','http')));
    //alert('222:' + inu.split('#')[eval(-1 + inu.split('#').length)]);
    cookieAVal('steps_', true);
    //alert('2222:' + inu.split('#')[eval(-1 + inu.split('#').length)]);
    }
    } else {
    woo=window.open(inu, '_blank', 'top=50,left=50,width=800,height=800');
    }
    }
    }

    function cookieAVal(cName, selize) {
    var key=null;
    if (selize && window.localStorage) {
    lssel=' ';
    for (var i=0; i<localStorage.length; i++) { // thanks to https://stackoverflow.com/questions/41271092/how-to-loop-through-localstorage-values
    key = localStorage.key(i);
    if (('' + key).indexOf(cName) == 0) {
    if (lssel.trim() == '') {
    lssel='<select id=sells onchange=gotothis(this.value);><option value=\"\">Recallable Steps below ...</option></select>';
    }
    lssel=lssel.replace('</select>', '<option value=\"' + decodeURIComponent(localStorage.getItem('' + key)) + '\">' + ('' + key).substring(eval('' + cName.length)).replace(/\_/g,' ').replace(/\-/g,' ') + '</option>' + '<option value=\"' + decodeURIComponent(localStorage.getItem('' + key).replace('http','HTTP')) + '#steps_' + ('' + key).substring(eval('' + cName.length)) + '\">Remove ' + ('' + key).substring(eval('' + cName.length)).replace(/\_/g,' ').replace(/\-/g,' ') + '</option>' + '</select>');
    }
    }
    if (lssel != '') {
    document.getElementById('ssel').innerHTML=lssel.trim();
    }
    }
    if (cName.indexOf('steps_') == 0) {
    if (window.localStorage) {
    if (decodeURIComponent(('' + localStorage.getItem(cName)).replace(/^undefined/g,'').replace(/^null/g,'')) != '') {
    return decodeURIComponent(localStorage.getItem(cName));
    }
    if (decodeURIComponent(('' + sessionStorage.getItem(cName)).replace(/^undefined/g,'').replace(/^null/g,'')) != '') {
    return decodeURIComponent(sessionStorage.getItem(cName));
    }
    }
    return '';
    }
    return '';
    }

    “; ?>
  • add a new …

    <a id=pcookie title='Recall this' class=share onclick="return emailit(estitle);" style='display:none;text-decoration:none;cursor:pointer;'>🍪</a>

    … emoji link for intersessional window.localStorage work that calls the email functionality modified Javascript function …
  • allowing a window.localStorage.setItem([Title (of steps)], encodeURIComponent([Content of steps])) to add a personalized and recallable record be kept on the web browser of use … recallable via …
  • new dropdown populated with existant such records, as well as a dropdown option allowing the user to remove said records, too … which …
  • can navigate the user to this recallable Steps idea in a new webpage incarnation …
  • a dropdown arrangement which is intersessional as well as intrasessional by nature, and personalized to that user’s use of the web browser on that device in question

… in our changed PHP coded My Recipe Steps web application you can also try below.


Previous relevant PHP Image GraphViz via Pear on AlmaLinux Sharing Tutorial is shown below.

PHP Image GraphViz via Pear on AlmaLinux Sharing Tutorial

PHP Image GraphViz via Pear on AlmaLinux Sharing Tutorial

Adding to yesterday’s PHP Image GraphViz via Pear on AlmaLinux Primer Tutorial

  • on many mobile devices the horizontally spreading right cell arrangements has been improved by laying out these textarea elements vertically now …
  • hashtagged URL mailto: and/or sms: “a” links to email and/or SMS communication conduits, respectively …
    <?php echo ”

    var anyhashes='';
    var aone=1;
    var tdc=0;

    function checkforlh() {
    aone=1;
    if (('' + location.hash.indexOf('dtitle')) != -1) {
    if (('' + location.hash.indexOf('dtitle=')) != -1) {
    document.getElementById('therest').value=decodeURIComponent(('' + location.hash).split('dtitle=')[1].split('#')[0].split(encodeURIComponent('#'))[0]);
    document.getElementById('therest').name='dtitle';
    } else if (('' + location.hash.indexOf('dtitle' + encodeURIComponent('='))) != -1) {
    document.getElementById('therest').value=decodeURIComponent(('' + location.hash).split('dtitle' + encodeURIComponent('='))[1].split('#')[0].split(encodeURIComponent('#'))[0]);
    document.getElementById('therest').name='dtitle';
    }
    }
    var retv='';
    while (('' + location.hash.indexOf('step' + aone)) != -1) {
    if (('' + location.hash.indexOf('step' + aone + '=')) != -1) {
    if (aone <= 1) {
    document.getElementById('tdi' + aone).value=decodeURIComponent(('' + location.hash).split('step' + aone + '=')[1].split('#')[0].split(encodeURIComponent('#'))[0]);
    } else {
    document.getElementById('tdi' + aone).value=decodeURIComponent(('' + location.hash).split('step' + aone + '=')[1].split('#')[0].split(encodeURIComponent('#'))[0]);
    obl(document.getElementById('tdi' + aone), true); //document.getElementById('tdi' + aone).blur();
    if ( document.getElementById('tdi' + eval(1 + aone))) {
    document.getElementById('tdi' + eval(1 + aone)).focus();
    }
    }
    } else if (('' + location.hash.indexOf('step' + aone + encodeURIComponent('='))) != -1) {
    if (aone <= 1) {
    document.getElementById('tdi' + aone).value=decodeURIComponent(('' + location.hash).split('step' + aone + encodeURIComponent('='))[1].split('#')[0].split(encodeURIComponent('#'))[0]);
    } else {
    document.getElementById('tdi' + aone).value=decodeURIComponent(('' + location.hash).split('step' + aone + encodeURIComponent('='))[1].split('#')[0].split(encodeURIComponent('#'))[0]);
    obl(document.getElementById('tdi' + aone), true); //document.getElementById('tdi' + aone).blur();
    if ( document.getElementById('tdi' + eval(1 + aone))) {
    document.getElementById('tdi' + eval(1 + aone)).focus();
    }
    }
    }
    aone++;
    }
    if (aone > 1 || document.getElementById('therest').value != '') { anyhashes=('' + location.hash).replace(/\%23/g,'#'); setTimeout(function(){ if (confirm('Draw now (versus add more yourself)?') == true) { document.getElementById('mysub').click(); } }, 8000); }
    }

    “; ?>
    … help out with some new sharing functionalities

… so that “a procedure made up of steps” can now be shared and/or created collaboratively in our changed PHP coded My Recipe Steps web application.


Previous relevant PHP Image GraphViz via Pear on AlmaLinux Primer Tutorial is shown below.

PHP Image GraphViz via Pear on AlmaLinux Primer Tutorial

https://en.wikipedia.org/wiki/Graphviz

The term “GraphViz”

Graphviz (short for Graph Visualization Software) is a package of open-source tools initiated by AT&T Labs Research for drawing graphs (as in nodes and edges, not as in bar charts) specified in DOT language scripts having the file name extension “gv”. It also provides libraries for software applications to use the tools. Graphviz is free software licensed under the Eclipse Public License.

… we’ve learnt recently, means a lot of things, differently (nuanced) for a range of users, three that we’ve so far become aware of being …

  • the recent, alas now deprecated, Google Charts Image Charts GraphViz option means of drawing SVG graphics within an HTML image … we’ve known about before about yesterday
  • today’s interest, that being PHP Image GraphViz via Pear on AlmaLinux install, via the AlmaLinux cPanel “Module Installers” Pear installer page, means by which we can use GraphViz calls in PHP code … and, for the future …
  • GraphViz installs for Python via pip

… in amongst many others we’ve seen programmers using … totally cute, totally useful!

It seems with our PHP Image GraphViz via Pear on AlmaLinux as what looks like a very much “pared down” version of the last mode of use above, that we add constructed graph node or edge or cluster objects, and form them into SVG based HTML image elements. It’s look got me thinking “Steps”, then “Recipe Steps”, and back, quietly, to “Any Old Steps” as the day got more generic.

At first we got, as far as Recipes go (and here we thank Italian Wedding Soup for today’s inspiration), to …

  • cooking steps showing as Image GraphViz edge graphic components (having arrows connect ellipses containing text, a bit like Speech Bubbles) … and then trying to face the “real world” a user interested in recipes might want to see happen …
  • an Image GraphViz node graphic component whose wording could be a user supplied recipe Title along with a “URL” attribute link, optionally user supplied (via our HTML div SVG hosting ondblclick event allowing its contenteditable=true attribute and onblur event means by which these optional additional data items can enter the “mix”, if you’ll pardon the pun), probably pointing back to the original recipe information saucesource … and …
  • this title and/or “URL” and/or ingredient list (for example) can all be expressed as the “on hover” title attribute of the tailored user PHP webpage (yes, here we have PHP writing PHP) … and …
  • at least on Safari, given a recipe Title defined, we can arrange any browser context menu (ie. right click) over the HTML iframe hosted recipe content “Save Iframe As” option being able to download to a reasonably self explanatory download filename … and/or …
  • any web browser’s Add Bookmark functionality can be harnessed to help the user out in such a way that our PHP coded My Recipe Steps web application could end up being your one stop shop “Recipe Organizer” online?!

See what we mean below …


Previous relevant Google Chart Image Chart Angled Text Annotation Tutorial is shown below.

Google Chart Image Chart Angled Text Annotation Tutorial

Google Chart Image Chart Angled Text Annotation Tutorial

It’s Tuesday, in places around the world, looking back at yesterday’s Google Chart Image Chart Image Map Event Editing Tutorial. Can’t help but think we’ve forgotten something. Ah yes …

You talkin’ to me? You talkin’ to me? Meanwhile, back at the questions! Welcome back, Mr De Niro, sir. We hope your Tuesday is treating you well. (Rhetorical. Let it please be Rhetorical … oh dear God … it must be Rhetorical … it must be Rhetorical) We have news regarding “the dosh” (wink, wink) we were discussing the other day. You see …

Better to be king for a night than schmuck for a lifetime. Well, at least it’s not a question. … the thing is, silly us, it turns out that angled text issue was not a problem with [element].getBoundingClientRect() but how the PHP GD imagettftext text placement emanated from the bottom left of the text always, Mr De Niro sir.

Never rat on your friends and always keep your mouth shut. Really wish we could! Yes, Mr De Niro, sir, but, you see this means the rats are completely out of the picture, just leaving us with our money spinner. Right, Mr De Niro … sir.

There are three ways of doing things around here: the right way, the wrong way and the way that I do it. [Exeunt: Stage right] Well, that’s odd? Mr De Niro wasn’t interested in the quadrant nature to our problem solution …


var rectex=extents[eval(-1 + extents.length)].getBoundingClientRect();
if (document.URL.indexOf('debug=') != -1) {
document.body.innerHTML+='<div style="position:absolute;border:1px solid rgba(255,0,0,0.5);top:' + rectex.top + 'px;left:' + rectex.left + 'px;width:' + rectex.width + 'px;height:' + rectex.height + 'px;z-index:200;" title="position:absolute;border:1px solid rgba(255,0,0,0.5);top:' + rectex.top + 'px;left:' + rectex.left + 'px;width:' + rectex.width + 'px;height:' + rectex.height + 'px;z-index:200;"></div>';
}

var invs=inv.split('.'); // angled text origin depends on angle quadrant
var wasi=inv;
var theang=eval('' + fsx);
//alert('' + inv + ' ' + theang);

if (eval('' + invs.length) > 2 && inv.indexOf(',') != -1) {
//alert('' + rectex.width + 'x' + rectex.height + ' ' + ';' + rectex.top + 'vs' + rectex.bottom + ' ' + ';' + rectex.left + 'vs' + rectex.right + ' ' + inv + ' ' + extents[-1 + extents.length].outerHTML + ' ' + rectex.x + '+' + rectex.y);
if (7 == 8) {
inv=inv.replace(invs[0], '' + Math.floor(eval(rectex.left + rectex.width / 2)));
} else {
if (theang > (315 + 45) || theang < (45 + 45)) {
inv=inv.replace(invs[0], '' + Math.floor(eval(rectex.left * 1 + rectex.right * 0 + 0 * rectex.width / 2)));
} else if (theang >= (45 + 45) && theang <= (135 + 45)) {
inv=inv.replace(invs[0], '' + Math.floor(eval(rectex.left * 0 + rectex.right * 1 + 0 * rectex.width / 2)));
} else if (theang >= (225 + 45) && theang <= (315 + 45)) {
inv=inv.replace(invs[0], '' + Math.floor(eval(rectex.left * 1 + rectex.right * 0 + 0 * rectex.width / 2)));
} else {
inv=inv.replace(invs[0], '' + Math.floor(eval(rectex.left * 0 + rectex.right * 1 + 0 * rectex.width / 2)));
}
}


if (7 == 8) {
inv=inv.replace(',' + invs[1].split(',')[1], ',' + Math.floor(eval(rectex.top + rectex.height / 2)));
} else {
if (theang > (315 + 45) || theang < (45 + 45)) {
inv=inv.replace(',' + invs[1].split(',')[1], ',' + Math.floor(eval(rectex.top * 0 + rectex.bottom * 1 + 0 * rectex.height / 2)));
//alert('' + wasi + ' vs ' + inv + ' ' + invs.length);
} else if (theang >= (225 + 45) && theang <= (315 + 45)) {
inv=inv.replace(',' + invs[1].split(',')[1], ',' + Math.floor(eval(rectex.top * 1 + rectex.bottom * 0 + 0 * rectex.height / 2)));
} else if (theang >= (45 + 45) && theang < (135 + 45)) {
inv=inv.replace(',' + invs[1].split(',')[1], ',' + Math.floor(eval(rectex.top * 0 + rectex.bottom * 1 + 0 * rectex.height / 2)));
} else {
inv=inv.replace(',' + invs[1].split(',')[1], ',' + Math.floor(eval(rectex.top * 1 + rectex.bottom * 0 + 0 * rectex.height / 2)));
}
}


//alert('was=' + wasi + ' and now=' + inv);
} else if (eval('' + invs.length) == 2 && inv.indexOf(',') != -1) {
//alert('' + rectex.width + 'x' + rectex.height + ' ' + ';' + rectex.top + 'vs' + rectex.bottom + ' ' + ';' + rectex.left + 'vs' + rectex.right + ' ' + inv + ' ' + extents[-1 + extents.length].outerHTML + ' ' + rectex.x + '+' + rectex.y);
if (theang > (315 + 45) || theang < (45 + 45)) {
inv=inv.replace(invs[0], '' + Math.floor(eval(rectex.left * 1 + rectex.right * 0 + 0 * rectex.width / 2)));
} else if (theang >= (45 + 45) && theang <= (135 + 45)) {
inv=inv.replace(invs[0], '' + Math.floor(eval(rectex.left * 0 + rectex.right * 1 + 0 * rectex.width / 2)));
} else if (theang >= (225 + 45) && theang <= (315 + 45)) {
inv=inv.replace(invs[0], '' + Math.floor(eval(rectex.left * 1 + rectex.right * 0 + 0 * rectex.width / 2)));
} else {
inv=inv.replace(invs[0], '' + Math.floor(eval(rectex.left * 0 + rectex.right * 1 + 0 * rectex.width / 2)));
}
invs=inv.split(',');
if (theang > (315 + 45) || theang <= (45 + 45)) {
inv=inv.replace(',' + invs[1].split(',')[0].split('.')[0], ',' + Math.floor(eval(rectex.top * 0 + rectex.bottom * 1 + 0 * rectex.height / 2)));
//alert('' + wasi + ' vs ' + inv + ' ' + invs.length);
} else if (theang >= (225 + 45) && theang <= (315 + 45)) {
inv=inv.replace(',' + invs[1].split(',')[0].split('.')[0], ',' + Math.floor(eval(rectex.top * 1 + rectex.bottom * 0 + 0 * rectex.height / 2)));
} else if (theang >= (45 + 45) && theang < (135 + 45)) {
inv=inv.replace(',' + invs[1].split(',')[0].split('.')[0], ',' + Math.floor(eval(rectex.top * 0 + rectex.bottom * 1 + 0 * rectex.height / 2)));
} else {
inv=inv.replace(',' + invs[1].split(',')[0].split('.')[0], ',' + Math.floor(eval(rectex.top * 1 + rectex.bottom * 0 + 0 * rectex.height / 2)));
}
//alert('was=' + wasi + ' and now=' + inv);
}

… that temporary div element text border drawing, being the crucial way to find out what was happening, and showing us, at least on Google Chrome web browser, not to worry so much about [element].getBoundingClientRect() results for transformed HTML elements. And that is a huge relief in itself.

Also taking up a lot of today, we shored up Image Map Event Editing results bubbling through to an email or SMS recipient. The size of this data, and an analysis of …

  • client pre-emptive iframe … versus …
  • Ajax methodologies

… when it comes to complex and sizeable data such as “Javascript scripting” is, we should start swinging towards Ajax thinking, even pinching it off a client pre-emptive iframe onload event logic thought/start sometimes …


var myxhr=null, rawhtml='';
var zhr=null, zform=null;

function stateChanged() {
if (myxhr.readyState == 4) {
if (myxhr.status == 200) {
console.log('myxhr=' + myxhr);
rawhtml = myxhr.responseText.replace(/\\"/g, '"').replace(/\\'/g, "'");
if (document.getElementById('jdiv')) {
//alert('1:' + rawhtml);
//alert('21111 ' + rawhtml.split('<scr')[1]);
document.getElementById('jdiv').innerHTML=rawhtml.split('<scr')[0]; //xaconto.body.innerHTML;
//alert(31111);
if (document.getElementById('talkimg')) {
document.getElementById('talkimg').useMap='#mymap';
} else {
document.getElementById('myvenn').useMap='#mymap';
}
//alert(41111);
} else {
document.body.innerHTML+=rawhtml.split('<scr')[0]; //xaconto.body.innerHTML;
if (document.getElementById('talkimg')) {
document.getElementById('talkimg').useMap='#mymap';
} else {
document.getElementById('myvenn').useMap='#mymap';
}
}
if (rawhtml.indexOf('<scr') != -1) {

if (1 == 1) {
var tag = document.createElement('script');
var nextsep=rawhtml.split('<scr')[1].split('>')[0] + '>';
//var qw=prompt(rawhtml.split('<scr')[1].split(nextsep)[1].split('</scri')[0],rawhtml.split('<scr')[1].split(nextsep)[1].split('</scri')[0]);
//alert('2:' + rawhtml.split('<scr')[1].split(nextsep)[1].split('</scri')[0]);
tag.innerHTML = rawhtml.split('<scr')[1].split(nextsep)[1].split('</scri')[0];
var firstScriptTag = document.getElementsByTagName('script')[eval(-1 + document.getElementsByTagName('script').length)];
firstScriptTag.insertAdjacentElement("afterend", tag);
}

}
}
}
}

function prehrefcheck(inso) {
if (obsuffix != '') {
zhr = new XMLHttpRequest();
zform = new FormData();
if (decodeURIComponent(obsuffix.replace('&thescript=','')).indexOf('<scr') == -1) {
zform.append('scrstuff', ('<scr' + 'ipt type="text/javascript"> ' + decodeURIComponent(obsuffix.replace('&thescript=','')) + ' </scr' + 'ipt>').replace(/\ \ \ /g, String.fromCharCode(9)).replace(/\+\=/g, ' += '));
} else {
zform.append('scrstuff', ('<scr' + decodeURIComponent(obsuffix.replace('&thescript=','')).split('<scr')[1]).replace(/\ \ \ /g, String.fromCharCode(9)).replace(/\+\=/g, ' += '));
}
if (jufr == '') {
jufr='_' + Math.floor(Math.random() * 19878675);
}
zform.append('ufr', jufr);
zhr.responseType='Document';
zhr.open('post', '//www.rjmprogramming.com.au/ITblog/' + Math.min(550,window.innerWidth) + '/' + Math.min(350,window.innerHeight) + '/?cht=' + ctype, true);
zhr.send(zform);
}
}

function sofarpj(iois) {
var aname='', partsare=[], ipis=0, areabits='', repfrom='', repto='', iv=0, variety=String.fromCharCode(10) + ' var variety=[]; ' + String.fromCharCode(10);
while (thescript.indexOf(' var variety' + ('' + iv).replace(/^0$/g, '') + '=') != -1) {
repfrom='[' + thescript.split(' var variety' + ('' + iv).replace(/^0$/g, '') + '=[')[1].split('];')[0] + '];';
iv++;
}
if (iv > 0) { variety=String.fromCharCode(10) + ' var variety' + iv + '=[]; ' + String.fromCharCode(10); }
if (iois.src != '') {
var aconto = (iois.contentWindow || iois.contentDocument);
if (aconto != null) {
if (aconto.document) { aconto = aconto.document; }
if (aconto.body.innerHTML.indexOf('<scr') != -1 || document.URL.indexOf('ufr=') != -1) {
if (document.URL.indexOf('ufr=') != -1) {
if (!document.getElementById('jdiv')) {
document.body.innerHTML+='<div id=jdiv></div>';
}
//thescript='';
myxhr = new XMLHttpRequest();
myxhr.open('GET', '//www.rjmprogramming.com.au/presentation' + (location.search.split('ufr=')[1] ? decodeURIComponent(location.search.split('ufr=')[1].split('&')[0]) : '') + '.html', true);
myxhr.responseType = "text";
myxhr.onreadystatechange=stateChanged;
myxhr.send(null);
} else if (aconto.body.innerHTML.indexOf('<scr') != -1) {

thescript='<scr' + aconto.body.innerHTML.split('<scr')[1];
var tag = document.createElement('script');
var nextsep=thescript.split('<scr')[1].split('>')[0] + '>';
tag.innerHTML = thescript.split('<scr')[1].split(nextsep)[1].split('</scri')[0];
var firstScriptTag = document.getElementsByTagName('script')[eval(-1 + document.getElementsByTagName('script').length)];
firstScriptTag.insertAdjacentElement("afterend", tag);
}
}
pjsbih=aconto.body.innerHTML.split('<scr')[0];
if (lastpjsbih != '' && pjsbih != lastpjsbih.replace(/\ $/g,'')) {
//alert('Found new Image Map data of ' + pjsbih);
// {"chartshape":[{"name":"axis0_0","type":"RECT","coords":[21,336,28,344]},{"name":"axis0_1","type":"RECT","coords":[65,336,77,344]},{"name":"axis0_2","type":"RECT","coords":[111,336,124,344]},{"name":"axis0_3","type":"RECT","coords":[158,336,170,344]},{"name":"axis0_4","type":"RECT","coords":[204,336,217,344]},{"name":"axis0_5","type":"RECT","coords":[251,336,263,344]},{"name":"axis0_6","type":"RECT","coords":[297,336,310,344]},{"name":"axis0_7","type":"RECT","coords":[344,336,356,344]},{"name":"axis0_8","type":"RECT","coords":[390,336,403,344]},{"name":"axis0_9","type":"RECT","coords":[437,336,449,344]},{"name":"axis0_10","type":"RECT","coords":[480,336,499,344]},{"name":"axis1_0","type":"RECT","coords":[14,326,20,334]},{"name":"axis1_1","type":"RECT","coords":[8,297,20,305]},{"name":"axis1_2","type":"RECT","coords":[8,267,20,275]},{"name":"axis1_3","type":"RECT","coords":[8,237,20,245]},{"name":"axis1_4","type":"RECT","coords":[8,208,20,216]},{"name":"axis1_5","type":"RECT","coords":[8,178,20,186]},{"name":"axis1_6","type":"RECT","coords":[8,148,20,156]},{"name":"axis1_7","type":"RECT","coords":[8,119,20,127]},{"name":"axis1_8","type":"RECT","coords":[8,89,20,97]},{"name":"axis1_9","type":"RECT","coords":[8,59,20,67]},{"name":"axis1_10","type":"RECT","coords":[2,29,20,37]},{"name":"legend0","type":"RECT","coords":[500,167,512,179]},{"name":"legend1","type":"RECT","coords":[500,185,512,197]},{"name":"circle0","type":"CIRCLE","coords":[80,39,4]},{"name":"circle1","type":"CIRCLE","coords":[429,152,1]},{"name":"circle2","type":"CIRCLE","coords":[373,250,3]},{"name":"circle3","type":"CIRCLE","coords":[215,230,4]},{"name":"circle4","type":"CIRCLE","coords":[131,164,2]},{"name":"circle5","type":"CIRCLE","coords":[471,96,5]},{"name":"circle6","type":"CIRCLE","coords":[341,158,3]},{"name":"circle7","type":"CIRCLE","coords":[355,111,5]},{"name":"circle8","type":"CIRCLE","coords":[183,277,3]},{"name":"circle9","type":"CIRCLE","coords":[66,105,3]}]}
if (pjsbih.replace(/\[\]/g, '').indexOf('[') != -1) {
partsare=pjsbih.split('","coords":[');
for (ipis=1; ipis<partsare.length; ipis++) {
if (partsare[eval(-1 + ipis)].split('"')[eval(-1 + partsare[eval(-1 + ipis)].split('"').length)] == 'RECT') {
aname=partsare[eval(-1 + ipis)].split('"name":"')[eval(-1 + partsare[eval(-1 + ipis)].split('"name":"').length)].split('"')[0];
if (variety.indexOf(aname.split('_')[0].split('0')[0].split('1')[0].split('2')[0].split('3')[0].split('4')[0].split('5')[0].split('6')[0].split('7')[0].split('8')[0].split('9')[0] + '/rect') == -1) {
if (variety.indexOf('[]') != -1) {
variety=variety.replace("[]", "['" + aname.split('_')[0].split('0')[0].split('1')[0].split('2')[0].split('3')[0].split('4')[0].split('5')[0].split('6')[0].split('7')[0].split('8')[0].split('9')[0] + '/rect' + "']");
} else {
variety=variety.replace("]", ",'" + aname.split('_')[0].split('0')[0].split('1')[0].split('2')[0].split('3')[0].split('4')[0].split('5')[0].split('6')[0].split('7')[0].split('8')[0].split('9')[0] + '/rect' + "']");
}
repto='[' + variety.split('[')[1].split('];')[0] + '];';
}
areabits+='<area onmousedown=defclick(event); ondblclick=defclick(event); oncontextmenu=defclick(event); ontouchend=defclick(event); ontouchstart=defclick(event); onmouseout=defclick(event); onmousemove=defclick(event); ontouchdown=defclick(event); onmouseover=defclick(event); shape="rect" coords="' + partsare[ipis].split(']')[0] + '" id="' + aname + '" name="' + aname + '" alt="' + aname + '" onclick="' + "youralert(this,'This feature name is " + aname + "'" + ');" nohref>';
} else if (partsare[eval(-1 + ipis)].split('"')[eval(-1 + partsare[eval(-1 + ipis)].split('"').length)] == 'CIRCLE') {
aname=partsare[eval(-1 + ipis)].split('"name":"')[eval(-1 + partsare[eval(-1 + ipis)].split('"name":"').length)].split('"')[0];
if (variety.indexOf(aname.split('_')[0].split('0')[0].split('1')[0].split('2')[0].split('3')[0].split('4')[0].split('5')[0].split('6')[0].split('7')[0].split('8')[0].split('9')[0] + '/circle') == -1) {
if (variety.indexOf('[]') != -1) {
variety=variety.replace("[]", "['" + aname.split('_')[0].split('0')[0].split('1')[0].split('2')[0].split('3')[0].split('4')[0].split('5')[0].split('6')[0].split('7')[0].split('8')[0].split('9')[0] + '/circle' + "']");
} else {
variety=variety.replace("]", ",'" + aname.split('_')[0].split('0')[0].split('1')[0].split('2')[0].split('3')[0].split('4')[0].split('5')[0].split('6')[0].split('7')[0].split('8')[0].split('9')[0] + '/circle' + "']");
}
repto='[' + variety.split('[')[1].split('];')[0] + '];';
}
areabits+='<area onmousedown=defclick(event); ondblclick=defclick(event); oncontextmenu=defclick(event); ontouchend=defclick(event); ontouchstart=defclick(event); onmouseout=defclick(event); onmousemove=defclick(event); ontouchdown=defclick(event); onmouseover=defclick(event); shape="circle" coords="' + partsare[ipis].split(']')[0] + '" id="' + aname + '" name="' + aname + '" alt="' + aname + '" onclick="' + "youralert(this,'This feature name is " + aname + "'" + ');" nohref>';
} else if (partsare[eval(-1 + ipis)].split('"')[eval(-1 + partsare[eval(-1 + ipis)].split('"').length)] == 'POLY') {
aname=partsare[eval(-1 + ipis)].split('"name":"')[eval(-1 + partsare[eval(-1 + ipis)].split('"name":"').length)].split('"')[0];
if (variety.indexOf(aname.split('_')[0].split('0')[0].split('1')[0].split('2')[0].split('3')[0].split('4')[0].split('5')[0].split('6')[0].split('7')[0].split('8')[0].split('9')[0] + '/poly') == -1) {
if (variety.indexOf('[]') != -1) {
variety=variety.replace("[]", "['" + aname.split('_')[0].split('0')[0].split('1')[0].split('2')[0].split('3')[0].split('4')[0].split('5')[0].split('6')[0].split('7')[0].split('8')[0].split('9')[0] + '/poly' + "']");
} else {
variety=variety.replace("]", ",'" + aname.split('_')[0].split('0')[0].split('1')[0].split('2')[0].split('3')[0].split('4')[0].split('5')[0].split('6')[0].split('7')[0].split('8')[0].split('9')[0] + '/poly' + "']");
}
repto='[' + variety.split('[')[1].split('];')[0] + '];';
}
areabits+='<area onmousedown=defclick(event); ondblclick=defclick(event); oncontextmenu=defclick(event); ontouchend=defclick(event); ontouchstart=defclick(event); onmouseout=defclick(event); onmousemove=defclick(event); ontouchdown=defclick(event); onmouseover=defclick(event); shape="poly" coords="' + partsare[ipis].split(']')[0] + '" id="' + aname + '" name="' + aname + '" alt="' + aname + '" onclick="' + "youralert(this,'This feature name is " + aname + "'" + ');" nohref>';
}
}
document.getElementById('mymap').innerHTML=areabits + '<area' + atend.split('<area')[1].split('>')[0] + '>'; //"<area onclick=defclick(event); shape='default' nohref>";
if (repto.replace('[];','') != '' && repfrom != '') { thescript=thescript.replace(repfrom, repto); } else if (thescript.indexOf('[' + variety.split('[')[1]) == -1) { thescript=thescript.replace('>', '>' + variety); }
origmap=document.getElementById('mymap').outerHTML + thescript;
}
} else if (lastpjsbih != '') {
//alert('Found the same ' + pjsbih);
if (pjsbih.replace(/\[\]/g, '').indexOf('[') != -1) {
partsare=pjsbih.split('","coords":[');
for (ipis=1; ipis<partsare.length; ipis++) {
if (partsare[eval(-1 + ipis)].split('"')[eval(-1 + partsare[eval(-1 + ipis)].split('"').length)] == 'RECT') {
aname=partsare[eval(-1 + ipis)].split('"name":"')[eval(-1 + partsare[eval(-1 + ipis)].split('"name":"').length)].split('"')[0];
if (variety.indexOf(aname.split('_')[0].split('0')[0].split('1')[0].split('2')[0].split('3')[0].split('4')[0].split('5')[0].split('6')[0].split('7')[0].split('8')[0].split('9')[0] + '/rect') == -1) {
if (variety.indexOf('[]') != -1) {
variety=variety.replace("[]", "['" + aname.split('_')[0].split('0')[0].split('1')[0].split('2')[0].split('3')[0].split('4')[0].split('5')[0].split('6')[0].split('7')[0].split('8')[0].split('9')[0] + '/rect' + "']");
} else {
variety=variety.replace("]", ",'" + aname.split('_')[0].split('0')[0].split('1')[0].split('2')[0].split('3')[0].split('4')[0].split('5')[0].split('6')[0].split('7')[0].split('8')[0].split('9')[0] + '/rect' + "']");
}
repto='[' + variety.split('[')[1].split('];')[0] + '];';
}
areabits+='<area onmousedown=defclick(event); ondblclick=defclick(event); oncontextmenu=defclick(event); ontouchend=defclick(event); ontouchstart=defclick(event); onmouseout=defclick(event); onmousemove=defclick(event); ontouchdown=defclick(event); onmouseover=defclick(event); shape="rect" coords="' + partsare[ipis].split(']')[0] + '" id="' + aname + '" name="' + aname + '" alt="' + aname + '" onclick="' + "youralert(this,'This feature name is " + aname + "'" + ');" nohref>';
} else if (partsare[eval(-1 + ipis)].split('"')[eval(-1 + partsare[eval(-1 + ipis)].split('"').length)] == 'CIRCLE') {
aname=partsare[eval(-1 + ipis)].split('"name":"')[eval(-1 + partsare[eval(-1 + ipis)].split('"name":"').length)].split('"')[0];
if (variety.indexOf(aname.split('_')[0].split('0')[0].split('1')[0].split('2')[0].split('3')[0].split('4')[0].split('5')[0].split('6')[0].split('7')[0].split('8')[0].split('9')[0] + '/circle') == -1) {
if (variety.indexOf('[]') != -1) {
variety=variety.replace("[]", "['" + aname.split('_')[0].split('0')[0].split('1')[0].split('2')[0].split('3')[0].split('4')[0].split('5')[0].split('6')[0].split('7')[0].split('8')[0].split('9')[0] + '/circle' + "']");
} else {
variety=variety.replace("]", ",'" + aname.split('_')[0].split('0')[0].split('1')[0].split('2')[0].split('3')[0].split('4')[0].split('5')[0].split('6')[0].split('7')[0].split('8')[0].split('9')[0] + '/circle' + "']");
}
repto='[' + variety.split('[')[1].split('];')[0] + '];';
}
areabits+='<area onmousedown=defclick(event); ondblclick=defclick(event); oncontextmenu=defclick(event); ontouchend=defclick(event); ontouchstart=defclick(event); onmouseout=defclick(event); onmousemove=defclick(event); ontouchdown=defclick(event); onmouseover=defclick(event); shape="circle" coords="' + partsare[ipis].split(']')[0] + '" id="' + aname + '" name="' + aname + '" alt="' + aname + '" onclick="' + "youralert(this,'This feature name is " + aname + "'" + ');" nohref>';
} else if (partsare[eval(-1 + ipis)].split('"')[eval(-1 + partsare[eval(-1 + ipis)].split('"').length)] == 'POLY') {
aname=partsare[eval(-1 + ipis)].split('"name":"')[eval(-1 + partsare[eval(-1 + ipis)].split('"name":"').length)].split('"')[0];
if (variety.indexOf(aname.split('_')[0].split('0')[0].split('1')[0].split('2')[0].split('3')[0].split('4')[0].split('5')[0].split('6')[0].split('7')[0].split('8')[0].split('9')[0] + '/poly') == -1) {
if (variety.indexOf('[]') != -1) {
variety=variety.replace("[]", "['" + aname.split('_')[0].split('0')[0].split('1')[0].split('2')[0].split('3')[0].split('4')[0].split('5')[0].split('6')[0].split('7')[0].split('8')[0].split('9')[0] + '/poly' + "']");
} else {
variety=variety.replace("]", ",'" + aname.split('_')[0].split('0')[0].split('1')[0].split('2')[0].split('3')[0].split('4')[0].split('5')[0].split('6')[0].split('7')[0].split('8')[0].split('9')[0] + '/poly' + "']");
}
repto='[' + variety.split('[')[1].split('];')[0] + '];';
}
areabits+='<area onmousedown=defclick(event); ondblclick=defclick(event); oncontextmenu=defclick(event); ontouchend=defclick(event); ontouchstart=defclick(event); onmouseout=defclick(event); onmousemove=defclick(event); ontouchdown=defclick(event); onmouseover=defclick(event); shape="poly" coords="' + partsare[ipis].split(']')[0] + '" id="' + aname + '" name="' + aname + '" alt="' + aname + '" onclick="' + "youralert(this,'This feature name is " + aname + "'" + ');" nohref>';
}
}
document.getElementById('mymap').innerHTML=areabits + '<area' + atend.split('<area')[1].split('>')[0] + '>'; //"<area onclick=defclick(event); shape='default' nohref>";
if (repto.replace('[];','') != '' && repfrom != '') { thescript=thescript.replace(repfrom, repto); } else if (thescript.indexOf('[' + variety.split('[')[1]) == -1) { thescript=thescript.replace('>', '>' + variety); }
origmap=document.getElementById('mymap').outerHTML + thescript;
}
}
lastpjsbih=pjsbih;
}
}
}


cimg=new Image;

cimg.onload = function(){
var honebit="<h2><span onclick=\"location.href=document.URL.split('?')[0].split('#')[0];\" title=Reset style=cursor:pointer;>Interfacing</span> to <a target=_blank href='https://developers.google.com/chart/interactive/docs/index' title='Google Chart Tools provide a perfect way to visualize data on your website. From simple line charts to complex hierarchical tree maps, the chart galley provides a large number of well-designed chart types. Populating your data is easy using the provided client- and server-side tools.'>Google Charts</a> <a target=_blank title='Google Charts Image Chart' href='https://developers.google.com/chart/image/docs/gallery/chart_gall'>Image Chart</a></h2><h4 id=myh3>RJM Programming - November, 2023</h4>";
var hthreebit="";
document.body.style.backgroundColor='transparent';
document.body.innerHTML=agscript.replace("'';", "'" + cht.replace('_','') + "';").replace('<canvas ','<canvas width=' + cimg.width + ' height=' + cimg.height + ' ') + "<table><tr><td><img style='border-right:1px dotted pink;border-bottom:1px dotted pink;' ondblclick=\"window.open(document.URL.split('?')[0].split('#')[0],'_blank','top=50,left=50,width=600,height=600');\" title='Talk image that will update over time (double click for Google Chart Image Chart interfacing) ... " + ("" + (new Date())) + "' id=talkimg src='" + cimg.src + "?rand=" + Math.floor(Math.random() * 198786754) + "' usemap='#mymap'></img></td><td id=tdtr style=\"opacity:0.0;background-image:url(" + cimg.src.replace('presentation_', 'presentation__') + "),url(" + cimg.src + "?rand=0);background-position:0% 0%,50% 0%;background-size:50% 50%,50% 50%;background-repeat:no-repeat,no-repeat;\"></td></tr><tr><td id=tdbl>" + honebit + hthreebit + "</td><td><img style='border-right:1px dotted pink;border-bottom:1px dotted pink;' ondblclick=\"window.open(document.URL.split('?')[0].split('#')[0],'_blank','top=50,left=50,width=600,height=600');\" title='Talk first and last images that will update over time (double click for Google Chart Image Chart interfacing) ... " + ("" + (new Date())) + "' id=talkimgg src='" + cimg.src.replace('.png','.gif') + "?rand=" + Math.floor(Math.random() * 198786754) + "'></img></td></tr></table><div id=idiv></div><iframe onload=mapsofarpj(this); id=mappjs style=display:none; src=></iframe><div id=jdiv></div>";
document.body.style.cursor='progress';
if (cht.substring(0,1) == '_') {
//alert('//www.rjmprogramming.com.au/presentation' + cht + '.html_GETME');
if (1 == 1) {
myxhr = new XMLHttpRequest();
myxhr.open('GET', '//www.rjmprogramming.com.au/presentation' + cht + '.html', true);
myxhr.responseType = "text";
myxhr.onreadystatechange=stateChanged;
myxhr.send(null);
} else {

document.getElementById('mappjs').src='//www.rjmprogramming.com.au/presentation' + cht + '.html';
}
setTimeout(canvinit, 5000);
}
setTimeout(talkupdate, eightthousand);
};

cimg.src='//www.rjmprogramming.com.au/presentation' + cht + '.png';
return '';
}

… in the changed latest draft image_venn.html Google Chart Image Chart Venn Chart or Scatter Chart or GraphViz Chart or Pie Chart or Line Chart or Bar Chart or Candlestick/Box Chart or Google-O-Meter Chart or Radar Chart or Map Chart interfacing web application you can also try below.


Previous relevant Google Chart Image Chart Image Map Event Editing Tutorial is shown below.

Google Chart Image Chart Image Map Event Editing Tutorial

Google Chart Image Chart Image Map Event Editing Tutorial

If we are talking “layers” (of functionality) again, onto the progress that yesterday’s Google Chart Image Chart Image Map Events Tutorial represented, then , it is logical …

  • that if yesterday we presented some programmer defined image map event logic … then, today, we’d want to …
  • offer the user the chance to change that default programmer defined image map event logic, to that of their own design

… in the form of

  • user defined Javascript .. editable in a …
  • HTML textarea element

… and then the coding latching onto a document.createElement(‘script’) paradigm, to add Javascript clientside logic, on the fly.

There’s a first time we can remember aspect to how we present these possibilities to the user. We present it in …

  • amongst the inhouse annotation options … as a …
  • “reveal” pairing of HTML5 details/summary element combination look … the first time we can remember aspect to that being …
  • only initially displaying within the details element innerHTML is a summary element nesting a single “icon like” image (like the other “inhouse annotation” icon images) … but if clicked …
  • the details innerHTML has added to it a textarea element …

    function fillindetsed(odet) {
    if (odet.innerHTML.split('</summary>')[1] == '') {
    document.getElementById('tdleft').style.verticalAlign='top';
    var onls=thescript.split('<scr' + 'ipt type="text/javascript">');
    var onlstuff=onls[1].split('</sc' + 'ript>')[0];
    odet.innerHTML+='<scr' + 'ipt type="text/javascript">' + "<br><textarea onblur=tproc(this); id=tscript rows=100 cols=80 value=''>" + onlstuff + "</textarea><br></script>";
    //odet.innerHTML+='<scr' + 'ipt type="text/javascript">' + "<br><textarea onblur=tproc(this); id=tscript rows=100 cols=80 value=''>" + encodeURIComponent(onlstuff) + "</textarea><br></script>";
    //document.getElementById('tscript').value=decodeURIComponent(document.getElementById('tscript').innerHTML);
    }
    }

… from which document.createElement(‘script’) code onblur event logic emanates …


function tproc(ota) {
//alert(ota.value);
var tag = document.createElement('script');
if (1 == 1) {
obsuffix='&thescript=' + encodeURIComponent(ota.value);
if (document.getElementById('aemail')) {
hrefcheck(document.getElementById('aemail'));
}
//alert('<scr' + 'ipt type="text/javascript"> ' + String.fromCharCode(10) + ota.value + String.fromCharCode(10) + ' </scr' + 'ipt>');
tag.innerHTML = ' <scr'.substring(0,1) + 'ipt type="text/javascript"> '.slice(-1) + String.fromCharCode(10) + ota.value + String.fromCharCode(10) + ' </scr'.substring(0,1) + 'ipt> '.slice(-1);
document.getElementById('dmap').innerHTML=document.getElementById('mymap').outerHTML + ' <scr' + 'ipt type="text/javascript"> ' + String.fromCharCode(10) + ota.value + String.fromCharCode(10) + ' </scr' + 'ipt> ';
}
var firstScriptTag = document.getElementsByTagName('script')[eval(-1 + document.getElementsByTagName('script').length)];
//alert(tag.outerHTML);
firstScriptTag.insertAdjacentElement("afterend", tag);
//alert(ota.value);
document.getElementById('detsed').open=false;
}

… in the changed latest draft image_venn.html Google Chart Image Chart Venn Chart or Scatter Chart or GraphViz Chart or Pie Chart or Line Chart or Bar Chart or Candlestick/Box Chart or Google-O-Meter Chart or Radar Chart or Map Chart interfacing web application you can also try below.


Previous relevant Google Chart Image Chart Image Map Events Tutorial is shown below.

Google Chart Image Chart Image Map Events Tutorial

Google Chart Image Chart Image Map Events Tutorial

We really like HTML image maps, and it occurred to us with yesterday’s Google Chart Image Chart Image Map Tutorial we were hiding its light under some bushel somewhere, because …

  • yesterday we introduced with only the onclick event coded for in the HTML area subelements to the map parent element … linked to an …
  • associated img element … via an …
  • attribute called usemap … and two aspects, at the very least, to stuff under the bushel are …
    1. many more events than onclick can be defined as you define the area subelements … and here’s the kicker …
    2. you can add area subelement event logic that, on paper, would cause interference with other event logic (ie. the same event type in an event bubbling through scenario) but it won’t if you, as a programmer, turn that use of the usemap attribute on and off like a tap

… which, to our mind, represents the bee’s knees of event management. So useful!

To tip our toes into this woooorrrrrlllllddd we’ll show you some newly added area subelement event logics in a Google Chart Image Chart Radar Chart example below …


<map name="mymap" id="mymap"><area onmousedown="defclick(event);" ondblclick="defclick(event);" oncontextmenu="defclick(event);" ontouchend="defclick(event);" ontouchstart="defclick(event);" onmouseout="defclick(event);" onmousemove="defclick(event);" ontouchdown="defclick(event);" onmouseover="defclick(event);" shape="rect" coords="151,34,157,42" id="axis0_0" name="axis0_0" alt="axis0_0" onclick="youralert(this,'This feature name is axis0_0');" nohref=""><area onmousedown="defclick(event);" ondblclick="defclick(event);" oncontextmenu="defclick(event);" ontouchend="defclick(event);" ontouchstart="defclick(event);" onmouseout="defclick(event);" onmousemove="defclick(event);" ontouchdown="defclick(event);" onmouseover="defclick(event);" shape="rect" coords="281,110,288,118" id="axis0_1" name="axis0_1" alt="axis0_1" onclick="youralert(this,'This feature name is axis0_1');" nohref=""><area onmousedown="defclick(event);" ondblclick="defclick(event);" oncontextmenu="defclick(event);" ontouchend="defclick(event);" ontouchstart="defclick(event);" onmouseout="defclick(event);" onmousemove="defclick(event);" ontouchdown="defclick(event);" onmouseover="defclick(event);" shape="rect" coords="281,260,288,268" id="axis0_2" name="axis0_2" alt="axis0_2" onclick="youralert(this,'This feature name is axis0_2');" nohref=""><area onmousedown="defclick(event);" ondblclick="defclick(event);" oncontextmenu="defclick(event);" ontouchend="defclick(event);" ontouchstart="defclick(event);" onmouseout="defclick(event);" onmousemove="defclick(event);" ontouchdown="defclick(event);" onmouseover="defclick(event);" shape="rect" coords="151,336,157,344" id="axis0_3" name="axis0_3" alt="axis0_3" onclick="youralert(this,'This feature name is axis0_3');" nohref=""><area onmousedown="defclick(event);" ondblclick="defclick(event);" oncontextmenu="defclick(event);" ontouchend="defclick(event);" ontouchstart="defclick(event);" onmouseout="defclick(event);" onmousemove="defclick(event);" ontouchdown="defclick(event);" onmouseover="defclick(event);" shape="rect" coords="20,260,27,268" id="axis0_4" name="axis0_4" alt="axis0_4" onclick="youralert(this,'This feature name is axis0_4');" nohref=""><area onmousedown="defclick(event);" ondblclick="defclick(event);" oncontextmenu="defclick(event);" ontouchend="defclick(event);" ontouchstart="defclick(event);" onmouseout="defclick(event);" onmousemove="defclick(event);" ontouchdown="defclick(event);" onmouseover="defclick(event);" shape="rect" coords="20,110,27,118" id="axis0_5" name="axis0_5" alt="axis0_5" onclick="youralert(this,'This feature name is axis0_5');" nohref=""><area id="adef" onclick=" defclick(event); if (!done) { done=false; if (atstart) { normalcall=false; ask(null); normalcall=true; atstart=false; } else { ask(event); } } "
shape="default" nohref=""></map>

… with new relevant event code snippet to help add intelligence to the event logic of our Google Chart Image Chart interfacing web application …


function defclick(evt) {
switch ('' + evt.type) {
case 'click':

alert('Welcome to RJM Programming interfacing to Google Charts Image Chart ' + cname);
break;

default:
switch (('' + evt.type + ' ').substring(0,5)) {
case 'mouse':
document.getElementById('myh3').innerHTML='RJM Programming - November, 2023 ... non-mobile mouse event ' + evt.type + ' called by ' + ('' + evt.target.id);
break;

case 'touch':
document.getElementById('myh3').innerHTML='RJM Programming - November, 2023 ... mobile touch event ' + evt.type + ' called by ' + ('' + evt.target.id);
break;

default:
alert(evt.type);
break;
}
break;
}

}

Interesting, huh?!

Feel free to try this out in the changed latest draft image_venn.html Google Chart Image Chart Venn Chart or Scatter Chart or GraphViz Chart or Pie Chart or Line Chart or Bar Chart or Candlestick/Box Chart or Google-O-Meter Chart or Radar Chart or Map Chart interfacing web application you can also try below.


Previous relevant Google Chart Image Chart Image Map Tutorial is shown below.

Google Chart Image Chart Image Map Tutorial

Google Chart Image Chart Image Map Tutorial

Do you like to come at explaining things in layers? Sort of like the analogy …

  • you start a project thinking of it in terms of “2D” … and then to move forward …
  • you spend a day making it work for “3D” (and keep the “2D” working as well)

… or …

  • you start a web application project thinking of only working via a URL entered on the web browser address bar … and then to move forward …
  • you spend a day making it work for serving the same purpose and/or a difference purpose called within an HTML iframe (and keep it working for the address bar way as well)

And so we look at a “picturesque” but “kinda dumb” (as far as “action items” go) image we have coming off the interfacing to Google Charts Image Chart. Where can we go here? Well, it would be kind of you to take it to the beach, but that’s not always a possibility now, is it?! Were you pulling my leg?! Tee hee. No, we were thinking … oh no … we have a bad feeling about this … let’s open it up to the class … anyone, anyone? Yes, Louis, would you and Auguste like to share with the class what is so amusing to you?

.
.
.
.
.
.
.
.
.
.
.
.
.
.
.

Okay, thank you for your thoughts on this, and yes, you could take the “picture” to “a picture show”. Yes, very droll, indeed. Any other ideas? Okay, Johann, you say the idea just “clicked” with you. This sounds promising. Go on …

.
.
.
.
.
.
.
.
.
.
.
.
.
.
.

Indeed, a young “picturesque” might like to go tap dancing, that is true. Sheeeeesh! But given the lesson is a Computing one, rather than Drama or Dance or Music or the Arts, maybe we would be looking for a way to use the picture in an enhanced way. Okay Kevin, we’ll try you. What do you think?

.
.
.
.
.
.
.
.
.
.
.
.
.
.
.
.
.
.
.
.
.
.
.
.
.
.
.
.
.
.

Frankly, we are flabbergasted! It’s as if you invented HTML image maps (as a way to add position based event logic), or something … 93/4 points to Gryffindor!

Yes, helping out we image map enthusiasts regarding interfacing to Google Charts Image Charts is Google’s Image Map creation helping Json output tool. From that help, we can …

  • at the demonstrator’s webpage, create an Image Map … and as the user requires …
  • at the uniquifier definition phase of our WordPress 404.php’s contribution we accept the demonstrator’s image map HTML, and save it to a public resource
    <?php

    if (isset($_POST['canvcont'])) {
    if (isset($_POST['uniquifier'])) {
    $uniquifier=str_replace('+',' ',urldecode($_POST['uniquifier']));
    }
    if ($uniquifier == '') {
    $uniquifier='_' . rand(0,78654356);
    file_put_contents($_SERVER['DOCUMENT_ROOT'] . DIRECTORY_SEPARATOR . "presentation" . $uniquifier . ".png", base64_decode( explode('base64,', str_replace(' ','+',urldecode($_POST['canvcont'])))[1]));
    file_put_contents($_SERVER['DOCUMENT_ROOT'] . DIRECTORY_SEPARATOR . "presentation_" . $uniquifier . ".png", base64_decode( explode('base64,', str_replace(' ','+',urldecode($_POST['canvcont'])))[1]));
    file_put_contents($_SERVER['DOCUMENT_ROOT'] . DIRECTORY_SEPARATOR . "presentation__" . $uniquifier . ".png", base64_decode( explode('base64,', str_replace(' ','+',urldecode($_POST['canvcont'])))[1]));
    if (isset($_POST['mapstuff'])) {
    file_put_contents($_SERVER['DOCUMENT_ROOT'] . DIRECTORY_SEPARATOR . "presentation" . $uniquifier . ".html", '<html><body>' . str_replace('+',' ',urldecode($_POST['mapstuff'])) . '</body></html>');
    }

    exec("/usr/local/cpanel/3rdparty/bin/convert -delay 20 -loop 0 " . $_SERVER['DOCUMENT_ROOT'] . DIRECTORY_SEPARATOR . "presentation" . $uniquifier . ".png" . " " . $_SERVER['DOCUMENT_ROOT'] . DIRECTORY_SEPARATOR . "presentation" . $uniquifier . ".gif");
    echo "<html><body onload=\"if (parent.document.getElementById('uniquifier')) { if (parent.document.getElementById('uniquifier').value == '') { parent.document.getElementById('uniquifier').value='" . $uniquifier . "'; } }\"></body></html>";
    } else {
    file_put_contents($_SERVER['DOCUMENT_ROOT'] . DIRECTORY_SEPARATOR . "presentation" . $uniquifier . ".png", base64_decode( explode('base64,', str_replace(' ','+',urldecode($_POST['canvcont'])))[1]));
    if (file_exists($_SERVER['DOCUMENT_ROOT'] . DIRECTORY_SEPARATOR . "presentation__" . $uniquifier . ".png")) {
    $middelay='';
    $enddelay='';
    if (filesize($_SERVER['DOCUMENT_ROOT'] . DIRECTORY_SEPARATOR . "presentation__" . $uniquifier . ".png") < filesize($_SERVER['DOCUMENT_ROOT'] . DIRECTORY_SEPARATOR . "presentation_" . $uniquifier . ".png")) {
    $middelay=' -delay 800 ';
    $enddelay=' -delay 800 ';
    }
    exec("rm -f " . $_SERVER['DOCUMENT_ROOT'] . DIRECTORY_SEPARATOR . "presentation" . $uniquifier . ".gif ; /usr/local/cpanel/3rdparty/bin/convert -delay 600 -loop 0 " . $_SERVER['DOCUMENT_ROOT'] . DIRECTORY_SEPARATOR . "presentation_" . $uniquifier . ".png " . $middelay . $_SERVER['DOCUMENT_ROOT'] . DIRECTORY_SEPARATOR . "presentation__" . $uniquifier . ".png " . $enddelay . $_SERVER['DOCUMENT_ROOT'] . DIRECTORY_SEPARATOR . "presentation" . $uniquifier . ".png" . " " . $_SERVER['DOCUMENT_ROOT'] . DIRECTORY_SEPARATOR . "presentation" . $uniquifier . ".gif");
    } else {
    exec("rm -f " . $_SERVER['DOCUMENT_ROOT'] . DIRECTORY_SEPARATOR . "presentation" . $uniquifier . ".gif ; /usr/local/cpanel/3rdparty/bin/convert -delay 200 -loop 0 " . $_SERVER['DOCUMENT_ROOT'] . DIRECTORY_SEPARATOR . "presentation_" . $uniquifier . ".png " . $_SERVER['DOCUMENT_ROOT'] . DIRECTORY_SEPARATOR . "presentation" . $uniquifier . ".png" . " " . $_SERVER['DOCUMENT_ROOT'] . DIRECTORY_SEPARATOR . "presentation" . $uniquifier . ".gif");
    }
    }
    exit;
    }

    ?>
  • helping keep the image mapping going, even if the Image Chart is …
    1. shared via email or SMS … and/or …
    2. forms the basis of a Broadcast Talk demonstration session

We could use Ajax techniques for the Javascript client ways an emailee’s link’s webpage invocation can use this new resource, but we kind of like “client pre-emptive iframe” onload event thinking, for both sides of the ledger, to get this going, as per …


function htmlDecode(input) { // thanks to https://stackoverflow.com/questions/1912501/unescape-html-entities-in-javascript
var e = document.createElement('textarea');
e.innerHTML = input;
// handle case of empty input
return e.childNodes.length === 0 ? "" : e.childNodes[0].nodeValue;
}

function mapsofarpj(xiois) {
//alert(('' + xiois.src));
if (xiois.src != '' && ('' + xiois.src).indexOf('presentation') != -1) {
//alert(('' + xiois.src));
var xaconto = (xiois.contentWindow || xiois.contentDocument);
//alert(11);
if (xaconto != null) {
//alert(111);
if (xaconto.document) { xaconto = xaconto.document; }
//alert(1111);
if (xaconto.body.innerHTML.indexOf('<map') != -1) {
var ihis=xaconto.body.innerHTML;
//while (ihis.indexOf('\"') != -1) {
// ihis=ihis.replace('\"', '')
//}
ihis=htmlDecode(ihis).replace(/\\"/g,'').replace(/\\'/g,"'").replace(/\=\"\"/g,'').replace(/This\"/g,"This").replace(/\;\ nohref/g, ';" nohref');
//alert(ihis);
if (document.getElementById('jdiv')) {
//alert(21111);
document.getElementById('jdiv').innerHTML=ihis; //xaconto.body.innerHTML;
//alert(31111);
document.getElementById('talkimg').useMap='#mymap';
//alert(41111);
} else {
document.body.innerHTML+=ihis; //xaconto.body.innerHTML;
document.getElementById('talkimg').useMap='#mymap';
}
}
}
}
}

function sofarpj(iois) {
var aname='', partsare=[], ipis=0, areabits='';
if (iois.src != '') {
var aconto = (iois.contentWindow || iois.contentDocument);
if (aconto != null) {
if (aconto.document) { aconto = aconto.document; }
pjsbih=aconto.body.innerHTML;
if (lastpjsbih != '' && pjsbih != lastpjsbih.replace(/\ $/g,'')) {
//alert('Found new Image Map data of ' + pjsbih);
// {"chartshape":[{"name":"axis0_0","type":"RECT","coords":[21,336,28,344]},{"name":"axis0_1","type":"RECT","coords":[65,336,77,344]},{"name":"axis0_2","type":"RECT","coords":[111,336,124,344]},{"name":"axis0_3","type":"RECT","coords":[158,336,170,344]},{"name":"axis0_4","type":"RECT","coords":[204,336,217,344]},{"name":"axis0_5","type":"RECT","coords":[251,336,263,344]},{"name":"axis0_6","type":"RECT","coords":[297,336,310,344]},{"name":"axis0_7","type":"RECT","coords":[344,336,356,344]},{"name":"axis0_8","type":"RECT","coords":[390,336,403,344]},{"name":"axis0_9","type":"RECT","coords":[437,336,449,344]},{"name":"axis0_10","type":"RECT","coords":[480,336,499,344]},{"name":"axis1_0","type":"RECT","coords":[14,326,20,334]},{"name":"axis1_1","type":"RECT","coords":[8,297,20,305]},{"name":"axis1_2","type":"RECT","coords":[8,267,20,275]},{"name":"axis1_3","type":"RECT","coords":[8,237,20,245]},{"name":"axis1_4","type":"RECT","coords":[8,208,20,216]},{"name":"axis1_5","type":"RECT","coords":[8,178,20,186]},{"name":"axis1_6","type":"RECT","coords":[8,148,20,156]},{"name":"axis1_7","type":"RECT","coords":[8,119,20,127]},{"name":"axis1_8","type":"RECT","coords":[8,89,20,97]},{"name":"axis1_9","type":"RECT","coords":[8,59,20,67]},{"name":"axis1_10","type":"RECT","coords":[2,29,20,37]},{"name":"legend0","type":"RECT","coords":[500,167,512,179]},{"name":"legend1","type":"RECT","coords":[500,185,512,197]},{"name":"circle0","type":"CIRCLE","coords":[80,39,4]},{"name":"circle1","type":"CIRCLE","coords":[429,152,1]},{"name":"circle2","type":"CIRCLE","coords":[373,250,3]},{"name":"circle3","type":"CIRCLE","coords":[215,230,4]},{"name":"circle4","type":"CIRCLE","coords":[131,164,2]},{"name":"circle5","type":"CIRCLE","coords":[471,96,5]},{"name":"circle6","type":"CIRCLE","coords":[341,158,3]},{"name":"circle7","type":"CIRCLE","coords":[355,111,5]},{"name":"circle8","type":"CIRCLE","coords":[183,277,3]},{"name":"circle9","type":"CIRCLE","coords":[66,105,3]}]}
if (pjsbih.replace(/\[\]/g, '').indexOf('[') != -1) {
partsare=pjsbih.split('","coords":[');
for (ipis=1; ipis<partsare.length; ipis++) {
if (partsare[eval(-1 + ipis)].split('"')[eval(-1 + partsare[eval(-1 + ipis)].split('"').length)] == 'RECT') {
aname=partsare[eval(-1 + ipis)].split('"name":"')[eval(-1 + partsare[eval(-1 + ipis)].split('"name":"').length)].split('"')[0];
areabits+='<area shape="rect" coords="' + partsare[ipis].split(']')[0] + '" alt="' + aname + '" onclick="' + "alert('This feature name is " + aname + "'" + ');" nohref>';
} else if (partsare[eval(-1 + ipis)].split('"')[eval(-1 + partsare[eval(-1 + ipis)].split('"').length)] == 'CIRCLE') {
aname=partsare[eval(-1 + ipis)].split('"name":"')[eval(-1 + partsare[eval(-1 + ipis)].split('"name":"').length)].split('"')[0];
areabits+='<area shape="circle" coords="' + partsare[ipis].split(']')[0] + '" alt="' + aname + '" onclick="' + "alert('This feature name is " + aname + "'" + ');" nohref>';
} else if (partsare[eval(-1 + ipis)].split('"')[eval(-1 + partsare[eval(-1 + ipis)].split('"').length)] == 'POLY') {
aname=partsare[eval(-1 + ipis)].split('"name":"')[eval(-1 + partsare[eval(-1 + ipis)].split('"name":"').length)].split('"')[0];
areabits+='<area shape="poly" coords="' + partsare[ipis].split(']')[0] + '" alt="' + aname + '" onclick="' + "alert('This feature name is " + aname + "'" + ');" nohref>';
}
}
document.getElementById('mymap').innerHTML=areabits + '<area' + atend.split('<area')[1].split('>')[0] + '>'; //"<area onclick=defclick(event); shape='default' nohref>";
origmap=document.getElementById('mymap').outerHTML;
}
} else if (lastpjsbih != '') {
//alert('Found the same ' + pjsbih);
if (pjsbih.replace(/\[\]/g, '').indexOf('[') != -1) {
partsare=pjsbih.split('","coords":[');
for (ipis=1; ipis<partsare.length; ipis++) {
if (partsare[eval(-1 + ipis)].split('"')[eval(-1 + partsare[eval(-1 + ipis)].split('"').length)] == 'RECT') {
aname=partsare[eval(-1 + ipis)].split('"name":"')[eval(-1 + partsare[eval(-1 + ipis)].split('"name":"').length)].split('"')[0];
areabits+='<area shape="rect" coords="' + partsare[ipis].split(']')[0] + '" alt="' + aname + '" onclick="' + "alert('This feature name is " + aname + "'" + ');" nohref>';
} else if (partsare[eval(-1 + ipis)].split('"')[eval(-1 + partsare[eval(-1 + ipis)].split('"').length)] == 'CIRCLE') {
aname=partsare[eval(-1 + ipis)].split('"name":"')[eval(-1 + partsare[eval(-1 + ipis)].split('"name":"').length)].split('"')[0];
areabits+='<area shape="circle" coords="' + partsare[ipis].split(']')[0] + '" alt="' + aname + '" onclick="' + "alert('This feature name is " + aname + "'" + ');" nohref>';
} else if (partsare[eval(-1 + ipis)].split('"')[eval(-1 + partsare[eval(-1 + ipis)].split('"').length)] == 'POLY') {
aname=partsare[eval(-1 + ipis)].split('"name":"')[eval(-1 + partsare[eval(-1 + ipis)].split('"name":"').length)].split('"')[0];
areabits+='<area shape="poly" coords="' + partsare[ipis].split(']')[0] + '" alt="' + aname + '" onclick="' + "alert('This feature name is " + aname + "'" + ');" nohref>';
}
}
document.getElementById('mymap').innerHTML=areabits + '<area' + atend.split('<area')[1].split('>')[0] + '>'; //"<area onclick=defclick(event); shape='default' nohref>";
origmap=document.getElementById('mymap').outerHTML;
}
}
lastpjsbih=pjsbih;
}
}
}

… further to yesterday’s Google Chart Image Chart Dynamic Icons Tutorial in the changed latest draft image_venn.html Google Chart Image Chart Venn Chart or Scatter Chart or GraphViz Chart or Pie Chart or Line Chart or Bar Chart or Candlestick/Box Chart or Google-O-Meter Chart or Radar Chart or Map Chart interfacing web application you can also try below.


Previous relevant Google Chart Image Chart Dynamic Icons Tutorial is shown below.

Google Chart Image Chart Dynamic Icons Tutorial

Google Chart Image Chart Dynamic Icons Tutorial

Does statistics have to be staid and boring? Kitch and quiche?! Welcome to the wooorrrlllddd of Google Charts Image Chart Dynamic Icons!

Think of Dynamic Icons as a way to decorate one or more data points displayed in one of …

  • Line Chart
  • Bar Chart
  • Map Chart
  • Radar Chart

We had that certain “Wow! factor going as we remembered our state’s motto from some years back, and we tried out the Map Chart to see whether we could embellish the map with a Dynamic Icon relevant to New South Wales, as you can see with today’s tutorial picture.

We’ll show you the most recent snapshot of Javascript parameters a little later, but the change for this is an optional one up to the user to work out, with prompts such as the Map Chart one updated

Enter vertical bar separated country ISO Country and/or Region Code list. Please note that optional Dynamic Icons are available via a suffixing string example applied to the second data point such as &chem=y;s=bubble_icon_text_small;d=ski,bb,NSW%20State%20of%20Wow!,FFFFFF;dp=1;ds=0 eg. AU-NT|AU-NSW|AU-SA|NZ|IN’

And here is its relevance in a new snapshot of parameterizations …


var prefixandon='';
var dtextis='dtext';
var pretherest='';
var newtherest='';
var tmod='';
var colchange='';
var cht=location.search.split('cht=')[1] ? decodeURIComponent(location.search.split('cht=')[1].split('&')[0]) : "v";
if ((cht + ' ').substring(0,1) == 'p' && cht != 'p') { pretherest=cht.substring(1); }
//if ((cht + ' ').substring(0,2) == 'bv' && cht != 'bv') { pretherest=cht.substring(2); if (1 == 1) { cht='bv'; } }
if ((cht + ' ').substring(0,1) == 'bv'.substring(0,1) && cht != 'bv'.substring(0,1)) { pretherest=cht.substring(1); if (1 == 1) { cht='bv'.substring(0,1); } }
if ((cht + ' ').substring(0,1) == 'l' && cht != 'l') { pretherest=cht.substring(1); if (1 == 1) { cht='l'; } }
if ((cht + ' ').substring(0,1) == 'r' && cht != 'r') { pretherest=cht.substring(1); if (1 == 1) { cht='r'; } }
var ccode=location.search.split('chld=')[1] ? decodeURIComponent(location.search.split('chld=')[1].split('&')[0]) : "";
var ctype=location.search.split('type=')[1] ? decodeURIComponent(location.search.split('type=')[1].split('&')[0]) : cht;
var cname=(ctype == 'v' ? 'Venn Chart' : (ctype == 's' ? 'Scatter Chart' : (ctype == 'gv' ? 'GraphViz Chart' :
(ctype.substring(0,1) == 'p' ? 'Pie Chart' :
((ctype + ' ').substring(0,2).substring(0,1) == 'bv'.substring(0,1) ? 'Bar Chart' : (ctype.substring(0,1) == 'l' ? 'Line Chart' :
(ctype == 'map' ? 'Map Chart' :
(ctype == 'gom' ? 'Google-O-Meter Chart' :
(ctype == 'r' ? 'Radar Chart' :
'')))))))));
var cencodename=(ctype == 'v' ? 'Venn%20Diagram' : (ctype == 's' ? 'Scatter%20Chart' : (ctype == 'gv' ? 'GraphViz%20Chart' :
(ctype.substring(0,1) == 'p' ? 'Pie%20Chart' :
((ctype + ' ').substring(0,2).substring(0,1) == 'bv'.substring(0,1) ? 'Bar%20Chart' : (ctype.substring(0,1) == 'l' ? 'Line%20Chart' :
(ctype == 'map' ? 'Map%20Chart' :
(ctype == 'gom' ? 'Google-O-Meter%20Chart' :
(ctype == 'r' ? 'Radar%20Chart' :
'')))))))));
var chdt=(ctype == 'v' ? '&chd=t:' : (ctype == 's' ? '&chd=t:' : (ctype == 'gv' ? '&chl=' :
(ctype.substring(0,1) == 'p' ? pretherest + '&chd=t:' :
((ctype + ' ').substring(0,2).substring(0,1) == 'bv'.substring(0,1) ? '&chd=t:' : (ctype.substring(0,1) == 'l' ? '&chd=t:' :
(ctype == 'map' ? '' :
(ctype == 'gom' ? '&chd=t:' :
(ctype == 'r' ? pretherest + '&chd=t:' :
'')))))))));
var chdeq=(ctype == 'v' ? '&chd=' : (ctype == 's' ? '&chd=' : (ctype == 'gv' ? '&chl=' :
(ctype.substring(0,1) == 'p' ? '&chd=' :
((ctype + ' ').substring(0,2).substring(0,1) == 'bv'.substring(0,1) ? '&chd=' : (ctype.substring(0,1) == 'l' ? '&chd=' :
(ctype == 'map' ? '&chld=' :
(ctype == 'gom' ? '&chld=' :
(ctype == 'r' ? '&chd=' :
'')))))))));
var tc=(ctype == 'v' ? 't:' : (ctype == 's' ? 't:' : (ctype == 'gv' ? '' :
(ctype.substring(0,1) == 'p' ? 't:' :
((ctype + ' ').substring(0,2).substring(0,1) == 'bv'.substring(0,1) ? 't:' : (ctype.substring(0,1) == 'l' ? 't:' :
(ctype == 'map' ? '' :
(ctype == 'gom' ? 't:' :
(ctype == 'r' ? 't:' :
'')))))))));
var chdl=(ctype == 'v' ? '&chdl=' : (ctype == 's' ? '&chdl=' : (ctype == 'gv' ? '' :
(ctype.substring(0,1) == 'p' ? '&chdl=' :
((ctype + ' ').substring(0,2).substring(0,1) == 'bv'.substring(0,1) ? '&chbh=' : (ctype.substring(0,1) == 'l' ? '&chbh=' :
(ctype == 'map' ? '' :
(ctype == 'gom' ? '&chdl=' :
(ctype == 'r' ? '&chxt=x&chxl=' :
'')))))))));

var prenchtt=(ctype == 'v' ? '100,80,60,30,30,30,10' : (ctype == 's' ? '12,87,75,41,23,96,68,71,34,9|98,60,27,34,56,79,58,74,18,76|84,23,69,81,47,94,60,93,64,54' : (ctype == 'gv' ? 'graph{C_0--H_0[type=s];C_0--H_1[type=s];C_0--H_2[type=s];C_0--C_1[type=s];C_1--H_3[type=s];C_1--H_4[type=s];C_1--H_5[type=s]}' :
(ctype.substring(0,1) == 'p' ? '1,2,3,4' :
((ctype + ' ').substring(0,2).substring(0,1) == 'bv'.substring(0,1) ? '5,5,5|10,10,10|15,15,15' : (ctype.substring(0,1) == 'l' ? '5,45,5|10,60,10|15,85,15' :
(ctype == 'map' ? '' :
(ctype == 'gom' ? '20,40,60' :
(ctype == 'r' ? '10,20,30,40,50' :
'')))))))));
var preachtt=(ctype == 'v' ? 'A|B|C' : (ctype == 's' ? 'Cats|Dogs' : (ctype == 'gv' ? '' :
(ctype.substring(0,1) == 'p' ? 'January|February|March|April' :
((ctype + ' ').substring(0,2).substring(0,1) == 'bv'.substring(0,1) ? '15,4,15' : (ctype.substring(0,1) == 'l' ? '15,4,15' :
(ctype == 'map' ? '' :
(ctype == 'gom' ? 'A|B|C' :
(ctype == 'r' ? '0:|1|2|3|4|5|6' :
'')))))))));
var defchco=(ctype == 'v' ? 'ff0000,00ff00,0000ff' : (ctype == 's' ? 'FF0000|0000FF&chxt=x,y' : (ctype == 'gv' ? '' :
(ctype.substring(0,1) == 'p' ? 'ff0000,00ff00,0000ff,ff00ff' :
((ctype + ' ').substring(0,2).substring(0,1) == 'bv'.substring(0,1) ? '4D89F9,C6D9FD,C6FDD9&chxt=x,y' : (ctype.substring(0,1) == 'l' ? '3D89F9.B6D9FD,B6FDD9&chxt=x,y' :
(ctype == 'map' ? '' :
(ctype == 'gom' ? 'ff0000,00ff00,0000ff' :
(ctype == 'r' ? 'FF0000,FF9900,ff0a00,00ffb0,000cff' :
'')))))))));

var prechtt=(ctype == 'v' ? chdt + prenchtt + chdl + preachtt : (ctype == 's' ? chdt + prenchtt + chdl + preachtt + '&chxt=x,y' : (ctype == 'gv' ? chdt + prenchtt :
(ctype.substring(0,1) == 'p' ? chdt + prenchtt + chdl + preachtt :
((ctype + ' ').substring(0,2).substring(0,1) == 'bv'.substring(0,1) ? chdt + prenchtt + chdl + preachtt : (ctype.substring(0,1) == 'l' ? chdt + prenchtt + chdl + preachtt :
(ctype == 'map' ? '' :
(ctype == 'gom' ? chdt + prenchtt + chdl + preachtt :
(ctype == 'r' ? chdt + prenchtt + chdl + preachtt :
'')))))))));
var promptone=(ctype == 'v' ? "Enter delimited values string for Venn Diagram such that ... " + String.fromCharCode(10) + "The first three values specify the sizes of three circles: A, B, & C. For chart with only two circles, specify zero for the third value." + String.fromCharCode(10) + "The fourth value specifies the size of the intersection of A and B." + String.fromCharCode(10) + "The fifth value specifies the size of the intersection of A and C. For a chart with only two circles, do not specify a value here." + String.fromCharCode(10) + "The sixth value specifies the size of the intersection of B and C. For a chart with only two circles, do not specify a value here." + String.fromCharCode(10) + "The seventh value specifies the size of the common intersection of A, B, and C. For a chart with only two circles, do not specify a value here." + String.fromCharCode(10) + String.fromCharCode(10) + "" : (ctype == 's' ? "Enter delimited values string for Scatter Chart" : (ctype == 'gv' ? "Enter delimited values string for GraphViz Chart" :
(ctype.substring(0,1) == 'p' ? "Enter delimited values string for Pie Chart" :
((ctype + ' ').substring(0,2).substring(0,1) == 'bv'.substring(0,1) ? "Enter v for Vertical or h for Horizontal then one of g for Group or s for Stacked or o for Overlapped Bar Chart look then a space and then enter delimited values string for Bar Chart. Here is a Candlestick and horizontal Bar Chart idea eg. hg 1:20,10,15,25,17,30|0,5,10,7,12,6|35,25,45,47,24,46|15,40,30,27,39,54|70,55,63,59,80,6 Here is a vertical Bar Chart and Box Chart idea vs 1:-1,5,10,7,12,-1|-1,25,30,27,24,-1|-1,40,45,47,39,-1|-1,55,63,59,80,-1|-1,30,40,35,30,-1|-1,-1,5,70,90,-1|-1,-1,-1,80,5,-1&chm=F,FF9900,0,1:4,40|H,0CBF0B,0,1:4,1:20|H,000000,4,1:4,1:40|H,0000FF,3,1:4,1:20|o,FF0000,5,-1,7|o,FF0000,6,-1,7 Prefix just the delimited string you enter by 1: to additionally display Candlestick/Box Charts or by 0: to only display Candlestick/Box Chart" :
(ctype.substring(0,1) == 'l' ? "Enter c for Even or s for Sparklines or xy for Just XY Line Chart look then a space and then enter delimited values string for Line Chart. Here is a Candlestick and Line Chart idea eg. c 1:20,10,15,25,17,30|0,5,10,7,12,6|35,25,45,47,24,46|15,40,30,27,39,54|70,55,63,59,80,6 Here is a Line Chart and Box Chart idea s 1:-1,5,10,7,12,-1|-1,25,30,27,24,-1|-1,40,45,47,39,-1|-1,55,63,59,80,-1|-1,30,40,35,30,-1|-1,-1,5,70,90,-1|-1,-1,-1,80,5,-1&chm=F,FF9900,0,1:4,40|H,0CBF0B,0,1:4,1:20|H,000000,4,1:4,1:40|H,0000FF,3,1:4,1:20|o,FF0000,5,-1,7|o,FF0000,6,-1,7 Prefix just the delimited string you enter by 1: to additionally display Candlestick/Box Charts or by 0: to only display Candlestick/Box Chart" :
(ctype == 'map' ? "" :
(ctype == 'gom' ? "Enter delimited values string for Google-O-Meter Chart" :
(ctype == 'r' ? "Enter delimited values string for Radar Chart but prefix with an s for smooth lines" :
"")))))))));
var oneprompt=(ctype == 'v' ? "Enter delimited values string for your Venn Diagram collaborations, optionally, such that ... " + String.fromCharCode(10) + "The first three values specify the sizes of three circles: A, B, & C. For chart with only two circles, specify zero for the third value." + String.fromCharCode(10) + "The fourth value specifies the size of the intersection of A and B." + String.fromCharCode(10) + "The fifth value specifies the size of the intersection of A and C. For a chart with only two circles, do not specify a value here." + String.fromCharCode(10) + "The sixth value specifies the size of the intersection of B and C. For a chart with only two circles, do not specify a value here." + String.fromCharCode(10) + "The seventh value specifies the size of the common intersection of A, B, and C. For a chart with only two circles, do not specify a value here." + String.fromCharCode(10) + String.fromCharCode(10) + "" : (ctype == 's' ? "Enter delimited values string for Scatter Chart" : (ctype == 'gv' ? "Enter delimited values string for GraphViz Chart" :
(ctype.substring(0,1) == 'p' ? "Enter delimited values string for Pie Chart" :
((ctype + ' ').substring(0,2).substring(0,1) == 'bv'.substring(0,1) ? "Enter g for Grouped or s for Stacked or o for Overlapped Bar Chart look then a space and then enter delimited values string for Bar Chart. Here is a Candlestick and Bar Chart idea eg. g 1:20,10,15,25,17,30|0,5,10,7,12,6|35,25,45,47,24,46|15,40,30,27,39,54|70,55,63,59,80,6 Here is a vertical Bar Chart and Box Chart idea vs 1:-1,5,10,7,12,-1|-1,25,30,27,24,-1|-1,40,45,47,39,-1|-1,55,63,59,80,-1|-1,30,40,35,30,-1|-1,-1,5,70,90,-1|-1,-1,-1,80,5,-1&chm=F,FF9900,0,1:4,40|H,0CBF0B,0,1:4,1:20|H,000000,4,1:4,1:40|H,0000FF,3,1:4,1:20|o,FF0000,5,-1,7|o,FF0000,6,-1,7 Prefix just the delimited string you enter by 1: to additionally display Candlestick/Box Charts or by 0: to only display Candlestick/Box Chart" :
(ctype.substring(0,1) == 'l' ? "Enter c for Even or s for Sparklines or xy for Just XY Line Chart look then a space and then enter delimited values string for Line Chart. Here is a Candlestick and Line Chart idea eg. c 1:20,10,15,25,17,30|0,5,10,7,12,6|35,25,45,47,24,46|15,40,30,27,39,54|70,55,63,59,80,6 Here is a Line Chart and Box Chart idea s 1:-1,5,10,7,12,-1|-1,25,30,27,24,-1|-1,40,45,47,39,-1|-1,55,63,59,80,-1|-1,30,40,35,30,-1|-1,-1,5,70,90,-1|-1,-1,-1,80,5,-1&chm=F,FF9900,0,1:4,40|H,0CBF0B,0,1:4,1:20|H,000000,4,1:4,1:40|H,0000FF,3,1:4,1:20|o,FF0000,5,-1,7|o,FF0000,6,-1,7 Prefix just the delimited string you enter by 1: to additionally display Candlestick/Box Charts or by 0: to only display Candlestick/Box Chart" :
(ctype == 'map' ? "" :
(ctype == 'gom' ? "Enter delimited values string for Google-O-Meter Chart" :
(ctype == 'r' ? "Enter delimited values string for Radar Chart but prefix with an s for smooth lines" :
"")))))))));
var asktwo=(ctype == 'v' ? true : (ctype == 's' ? true : (ctype == 'gv' ? false :
(ctype.substring(0,1) == 'p' ? true :
((ctype + ' ').substring(0,2).substring(0,1) == 'bv'.substring(0,1) ? true : (ctype.substring(0,1) == 'l' ? true :
(ctype == 'map' ? false :
(ctype == 'gom' ? true :
(ctype == 'r' ? true :
false)))))))));

var answersuffix=(ctype.substring(0,1).replace('m','l').replace('b','l').replace('r','l') == 'l' ? '. Please note that optional Dynamic Icons are available via a suffixing string example applied to the second data point such as &chem=y;s=bubble_icon_text_small;d=ski,bb,Wheeee!,FFFFFF;dp=1;ds=0 ' : '');

var twopb=(ctype.substring(0,1) == 'p' ? 'Any optional legend or title argument snippets? Optionally prefix by 3 for 3d Pie Chart or by c for Concentric Pie Chart. Eg. 3' + chdl + preachtt + '&chtt=My%20' + cencodename + '&chco=' + defchco : 'Any optional legend or title argument snippets? Eg. ' + chdl + preachtt + '&chtt=My%20' + cencodename + '&chco=' + defchco);
var beforeanswer=(ctype.substring(0,1) == 'l' ? 'c ' : ((ctype + ' ').substring(0,2).substring(0,1) == 'bv'.substring(0,1) ? 'vg ' : ''));

var emsmlist='';

… further to yesterday’s Google Chart Image Chart Broadcast Talk Commentary Tutorial in the changed latest draft image_venn.html Google Chart Image Chart Venn Chart or Scatter Chart or GraphViz Chart or Pie Chart or Line Chart or Bar Chart or Candlestick/Box Chart or Google-O-Meter Chart or Radar Chart or Map Chart interfacing web application you can also try below.


Previous relevant Google Chart Image Chart Broadcast Talk Commentary Tutorial is shown below.

Google Chart Image Chart Broadcast Talk Commentary Tutorial

Google Chart Image Chart Broadcast Talk Commentary Tutorial

We’ll leave yesterday’s Google Chart Image Chart Radar Chart Tutorial angled text predilections for now, given we’ve got until Tuesday until tswhtf so to speak. Let’s today remedy the concern we had when we presented Google Chart Image Chart Broadcast Talk Context Tutorial regarding, the at the time new, “Broadcast Talk”, concept …

… even though it is only visual by nature, presented as an update image still presented and updated periodically. Go figure?!

… and offer a way to help the “Broadcast Talk” demonstrator “speak” during their demonstration, effectively. In so doing, we are going to add to …

  • the demonstrator’s visual inputs coming from that canvas annotator helper … with, today …
  • the demonstrator’s commentary, collected via an HTML textarea element (to optionally supplement the visuals) from that canvas annotator helper’s originator window (ie. the Google Charts Image Chart interfacing supervisor) … presented …

… via a new “middle of three slide” …

<?php

$uwidth=trim($uparts[$ioff - 2 + sizeof($uparts)]);
$uheight=trim(explode('#',explode('?',$uparts[$ioff - 1 + sizeof($uparts)])[0])[0]);
if (isset($_GET['canvcont']) && isset($_GET['uniquifier'])) {
$uniquifier=str_replace('+',' ',urldecode($_GET['uniquifier']));
if (file_exists($_SERVER['DOCUMENT_ROOT'] . DIRECTORY_SEPARATOR . "presentation__" . $uniquifier . ".png")) {
$im = imagecreatefromstring(file_get_contents($_SERVER['DOCUMENT_ROOT'] . DIRECTORY_SEPARATOR . "presentation__" . $uniquifier . ".png"));
$white = imagecolorallocate($im, 255, 255, 255);
$black = imagecolorallocate($im, 1, 1, 1);
imagefilledrectangle($im, 0, 0, $uwidth, $uheight, $white);
imagesavealpha($im, TRUE);
try {
if (function_exists('imagettftext')) {
imagettftext($im, 12, 0, 20, 20, $black, realpath('arial.ttf'), str_replace('+',' ',urldecode($_GET['canvcont'])));
}
} catch (Exception $e) { }

imagepng($im, $_SERVER['DOCUMENT_ROOT'] . DIRECTORY_SEPARATOR . "presentation__" . $uniquifier . ".png");
imagedestroy($im);
exit;
}
exit;
}


?>

… animated GIF (PHP 404.php helping) means of display in the viewer windows (off email invitation links they receive via the demonstrator) in the changed


function askaway() {
var waspis=prefixandon, nl='', newwaspis='';
if (document.getElementById('bcommentary')) {
if (document.getElementById('bcommentary').value.trim() != '') {
if (document.getElementById('bcommentary').value.trim().indexOf(String.fromCharCode(10)) == -1) {
nl=String.fromCharCode(10);
}
eightthousand=24000;
if ((' ' + document.getElementById('bcommentary').value.trim()).slice(-3) != '...' && (' ' + prefixandon.trim()).slice(-3) != '...' && (document.getElementById('bcommentary').value.trim() + ' ').substring(0,3) != '...') {
prefixandon='';
lastval='';
} else if ((document.getElementById('bcommentary').value.trim() + ' ').substring(0,3) == '...') {
if (waspis.indexOf(lastval.trim()) == -1) {
prefixandon=String.fromCharCode(10) + lastval.trim().replace(/\.\.\.NoWayJosE$/g, ' ' + nl + ('' + (new Date())) + ' ... ') + waspis;
newwaspis=prefixandon;
}
}
if ((' ' + document.getElementById('bcommentary').value.trim()).slice(-3) == '...') {
document.getElementById('ifco').src='//www.rjmprogramming.com.au/ITblog/' + Math.min(550,window.innerWidth) + '/' + Math.min(350,window.innerHeight) + '/?uniquifier=' + encodeURIComponent(document.getElementById('uniquifier').value) + '&canvcont=' + encodeURIComponent(document.getElementById('bcommentary').value.trim().replace(/\.\.\.$/g, ' ' + nl + ('' + (new Date())) + ' ... ' + String.fromCharCode(10) + String.fromCharCode(10) + prefixandon));
} else {
document.getElementById('ifco').src='//www.rjmprogramming.com.au/ITblog/' + Math.min(550,window.innerWidth) + '/' + Math.min(350,window.innerHeight) + '/?uniquifier=' + encodeURIComponent(document.getElementById('uniquifier').value) + '&canvcont=' + encodeURIComponent(document.getElementById('bcommentary').value + String.fromCharCode(10) + String.fromCharCode(10) + prefixandon);
}
document.getElementById('bcommentary').title=document.getElementById('bcommentary').value;
if ((document.getElementById('bcommentary').value.trim() + ' ').substring(0,3) == '...') {
if (newwaspis != '') { waspis=newwaspis; }
if (waspis.indexOf(document.getElementById('bcommentary').value.trim()) == -1) {
prefixandon=String.fromCharCode(10) + document.getElementById('bcommentary').value.trim().replace(/\.\.\.$/g, ' ' + nl + ('' + (new Date())) + ' ... ') + waspis;
}
}
lastval=document.getElementById('bcommentary').value;
document.getElementById('bcommentary').value='';
setTimeout(function(){ document.getElementById('subcc').click(); }, 2000);
}
}
}

function newfunction() {
if (document.getElementById('bshare')) {
document.getElementById('sbshare').innerHTML='<iframe id=ifco style=display:none; src=></iframe><br><br><textarea rows=2 cols=80 id=bcommentary placeholder="Commentary to Viewers can go here ... start with or end with ... for ongoing ..." onblur="askaway(this);" value=""></textarea><br><br>';
}
}

latest draft image_venn.html Google Chart Image Chart Venn Chart or Scatter Chart or GraphViz Chart or Pie Chart or Line Chart or Bar Chart or Candlestick/Box Chart or Google-O-Meter Chart or Radar Chart or Map Chart interfacing web application you can also try below.


Previous relevant Google Chart Image Chart Radar Chart Tutorial is shown below.

Google Chart Image Chart Radar Chart Tutorial

Google Chart Image Chart Radar Chart Tutorial

Onto yesterday’s Google Chart Image Chart Box Chart Tutorial, today we have a two part stepping forward via new …

Why the trepidation? Well, so far, when the text is angled we can’t understand what results we are getting back from a call to [element].getBoundingClientRect() just yet.

Why is this needed? Again, with the questions! Well, Mr De Niro, you see, well, somebody might want to go onto that more complex annotating.

And why would they do that? Sheesh. Well, Mr De Niro, sir, you see, sometimes things happen in life, and well, fingers slip on keyboards, and mice get awfullllly nervous around screens these days.

Yeh, well, show us the money, wiseguy. Who’s is that question? And what’s with the questions? Well, you see, Mr De Niro, the money is if we can get PHP text placement for text at an angle, where it rotates from the middle of the text, to get a similar positioning to good ol’ … pardon, Mr De Niro … good and well respected Javascript transform rotations … not with a triple pike, Mr De Niro, but you’re awfulllllly close, Mr De Niro, sir … rather, we throw in a couple of translations … no, not Latin, Mr De Niro … of co-ordinates, Mr De Niro.

And that will bring in how much by next Tuesday? Back to the questions? Why so many questions? We think it’s a pretty big money spinner, Mr De Niro, sir, and we think you should come back next Tuesday, and we can show you the ropes. Sweat, oozing from the brow, as Mr De Niro exits stage left.

And just while we have a few minutes, here’s the updated Javascript parameterization …


var dtextis='dtext';
var pretherest='';
var newtherest='';
var tmod='';
var colchange='';
var cht=location.search.split('cht=')[1] ? decodeURIComponent(location.search.split('cht=')[1].split('&')[0]) : "v";
if ((cht + ' ').substring(0,1) == 'p' && cht != 'p') { pretherest=cht.substring(1); }
//if ((cht + ' ').substring(0,2) == 'bv' && cht != 'bv') { pretherest=cht.substring(2); if (1 == 1) { cht='bv'; } }
if ((cht + ' ').substring(0,1) == 'bv'.substring(0,1) && cht != 'bv'.substring(0,1)) { pretherest=cht.substring(1); if (1 == 1) { cht='bv'.substring(0,1); } }
if ((cht + ' ').substring(0,1) == 'l' && cht != 'l') { pretherest=cht.substring(1); if (1 == 1) { cht='l'; } }
if ((cht + ' ').substring(0,1) == 'r' && cht != 'r') { pretherest=cht.substring(1); if (1 == 1) { cht='r'; } }
var ccode=location.search.split('chld=')[1] ? decodeURIComponent(location.search.split('chld=')[1].split('&')[0]) : "";
var ctype=location.search.split('type=')[1] ? decodeURIComponent(location.search.split('type=')[1].split('&')[0]) : cht;
var cname=(ctype == 'v' ? 'Venn Chart' : (ctype == 's' ? 'Scatter Chart' : (ctype == 'gv' ? 'GraphViz Chart' :
(ctype.substring(0,1) == 'p' ? 'Pie Chart' :
((ctype + ' ').substring(0,2).substring(0,1) == 'bv'.substring(0,1) ? 'Bar Chart' : (ctype.substring(0,1) == 'l' ? 'Line Chart' :
(ctype == 'map' ? 'Map Chart' :
(ctype == 'gom' ? 'Google-O-Meter Chart' :
(ctype == 'r' ? 'Radar Chart' :
'')))))))));
var cencodename=(ctype == 'v' ? 'Venn%20Diagram' : (ctype == 's' ? 'Scatter%20Chart' : (ctype == 'gv' ? 'GraphViz%20Chart' :
(ctype.substring(0,1) == 'p' ? 'Pie%20Chart' :
((ctype + ' ').substring(0,2).substring(0,1) == 'bv'.substring(0,1) ? 'Bar%20Chart' : (ctype.substring(0,1) == 'l' ? 'Line%20Chart' :
(ctype == 'map' ? 'Map%20Chart' :
(ctype == 'gom' ? 'Google-O-Meter%20Chart' :
(ctype == 'r' ? 'Radar%20Chart' :
'')))))))));
var chdt=(ctype == 'v' ? '&chd=t:' : (ctype == 's' ? '&chd=t:' : (ctype == 'gv' ? '&chl=' :
(ctype.substring(0,1) == 'p' ? pretherest + '&chd=t:' :
((ctype + ' ').substring(0,2).substring(0,1) == 'bv'.substring(0,1) ? '&chd=t:' : (ctype.substring(0,1) == 'l' ? '&chd=t:' :
(ctype == 'map' ? '' :
(ctype == 'gom' ? '&chd=t:' :
(ctype == 'r' ? pretherest + '&chd=t:' :
'')))))))));
var chdeq=(ctype == 'v' ? '&chd=' : (ctype == 's' ? '&chd=' : (ctype == 'gv' ? '&chl=' :
(ctype.substring(0,1) == 'p' ? '&chd=' :
((ctype + ' ').substring(0,2).substring(0,1) == 'bv'.substring(0,1) ? '&chd=' : (ctype.substring(0,1) == 'l' ? '&chd=' :
(ctype == 'map' ? '&chld=' :
(ctype == 'gom' ? '&chld=' :
(ctype == 'r' ? '&chd=' :
'')))))))));
var tc=(ctype == 'v' ? 't:' : (ctype == 's' ? 't:' : (ctype == 'gv' ? '' :
(ctype.substring(0,1) == 'p' ? 't:' :
((ctype + ' ').substring(0,2).substring(0,1) == 'bv'.substring(0,1) ? 't:' : (ctype.substring(0,1) == 'l' ? 't:' :
(ctype == 'map' ? '' :
(ctype == 'gom' ? 't:' :
(ctype == 'r' ? 't:' :
'')))))))));
var chdl=(ctype == 'v' ? '&chdl=' : (ctype == 's' ? '&chdl=' : (ctype == 'gv' ? '' :
(ctype.substring(0,1) == 'p' ? '&chdl=' :
((ctype + ' ').substring(0,2).substring(0,1) == 'bv'.substring(0,1) ? '&chbh=' : (ctype.substring(0,1) == 'l' ? '&chbh=' :
(ctype == 'map' ? '' :
(ctype == 'gom' ? '&chdl=' :
(ctype == 'r' ? '&chxt=x&chxl=' :
'')))))))));

var prenchtt=(ctype == 'v' ? '100,80,60,30,30,30,10' : (ctype == 's' ? '12,87,75,41,23,96,68,71,34,9|98,60,27,34,56,79,58,74,18,76|84,23,69,81,47,94,60,93,64,54' : (ctype == 'gv' ? 'graph{C_0--H_0[type=s];C_0--H_1[type=s];C_0--H_2[type=s];C_0--C_1[type=s];C_1--H_3[type=s];C_1--H_4[type=s];C_1--H_5[type=s]}' :
(ctype.substring(0,1) == 'p' ? '1,2,3,4' :
((ctype + ' ').substring(0,2).substring(0,1) == 'bv'.substring(0,1) ? '5,5,5|10,10,10|15,15,15' : (ctype.substring(0,1) == 'l' ? '5,45,5|10,60,10|15,85,15' :
(ctype == 'map' ? '' :
(ctype == 'gom' ? '20,40,60' :
(ctype == 'r' ? '10,20,30,40,50' :
'')))))))));
var preachtt=(ctype == 'v' ? 'A|B|C' : (ctype == 's' ? 'Cats|Dogs' : (ctype == 'gv' ? '' :
(ctype.substring(0,1) == 'p' ? 'January|February|March|April' :
((ctype + ' ').substring(0,2).substring(0,1) == 'bv'.substring(0,1) ? '15,4,15' : (ctype.substring(0,1) == 'l' ? '15,4,15' :
(ctype == 'map' ? '' :
(ctype == 'gom' ? 'A|B|C' :
(ctype == 'r' ? '0:|1|2|3|4|5|6' :
'')))))))));
var defchco=(ctype == 'v' ? 'ff0000,00ff00,0000ff' : (ctype == 's' ? 'FF0000|0000FF&chxt=x,y' : (ctype == 'gv' ? '' :
(ctype.substring(0,1) == 'p' ? 'ff0000,00ff00,0000ff,ff00ff' :
((ctype + ' ').substring(0,2).substring(0,1) == 'bv'.substring(0,1) ? '4D89F9,C6D9FD,C6FDD9&chxt=x,y' : (ctype.substring(0,1) == 'l' ? '3D89F9.B6D9FD,B6FDD9&chxt=x,y' :
(ctype == 'map' ? '' :
(ctype == 'gom' ? 'ff0000,00ff00,0000ff' :
(ctype == 'r' ? 'FF0000,FF9900,ff0a00,00ffb0,000cff' :
'')))))))));

var prechtt=(ctype == 'v' ? chdt + prenchtt + chdl + preachtt : (ctype == 's' ? chdt + prenchtt + chdl + preachtt + '&chxt=x,y' : (ctype == 'gv' ? chdt + prenchtt :
(ctype.substring(0,1) == 'p' ? chdt + prenchtt + chdl + preachtt :
((ctype + ' ').substring(0,2).substring(0,1) == 'bv'.substring(0,1) ? chdt + prenchtt + chdl + preachtt : (ctype.substring(0,1) == 'l' ? chdt + prenchtt + chdl + preachtt :
(ctype == 'map' ? '' :
(ctype == 'gom' ? chdt + prenchtt + chdl + preachtt :
(ctype == 'r' ? chdt + prenchtt + chdl + preachtt :
'')))))))));
var promptone=(ctype == 'v' ? "Enter delimited values string for Venn Diagram such that ... " + String.fromCharCode(10) + "The first three values specify the sizes of three circles: A, B, & C. For chart with only two circles, specify zero for the third value." + String.fromCharCode(10) + "The fourth value specifies the size of the intersection of A and B." + String.fromCharCode(10) + "The fifth value specifies the size of the intersection of A and C. For a chart with only two circles, do not specify a value here." + String.fromCharCode(10) + "The sixth value specifies the size of the intersection of B and C. For a chart with only two circles, do not specify a value here." + String.fromCharCode(10) + "The seventh value specifies the size of the common intersection of A, B, and C. For a chart with only two circles, do not specify a value here." + String.fromCharCode(10) + String.fromCharCode(10) + "" : (ctype == 's' ? "Enter delimited values string for Scatter Chart" : (ctype == 'gv' ? "Enter delimited values string for GraphViz Chart" :
(ctype.substring(0,1) == 'p' ? "Enter delimited values string for Pie Chart" :
((ctype + ' ').substring(0,2).substring(0,1) == 'bv'.substring(0,1) ? "Enter v for Vertical or h for Horizontal then one of g for Group or s for Stacked or o for Overlapped Bar Chart look then a space and then enter delimited values string for Bar Chart. Here is a Candlestick and horizontal Bar Chart idea eg. hg 1:20,10,15,25,17,30|0,5,10,7,12,6|35,25,45,47,24,46|15,40,30,27,39,54|70,55,63,59,80,6 Here is a vertical Bar Chart and Box Chart idea vs 1:-1,5,10,7,12,-1|-1,25,30,27,24,-1|-1,40,45,47,39,-1|-1,55,63,59,80,-1|-1,30,40,35,30,-1|-1,-1,5,70,90,-1|-1,-1,-1,80,5,-1&chm=F,FF9900,0,1:4,40|H,0CBF0B,0,1:4,1:20|H,000000,4,1:4,1:40|H,0000FF,3,1:4,1:20|o,FF0000,5,-1,7|o,FF0000,6,-1,7 Prefix just the delimited string you enter by 1: to additionally display Candlestick/Box Charts or by 0: to only display Candlestick/Box Chart" :
(ctype.substring(0,1) == 'l' ? "Enter c for Even or s for Sparklines or xy for Just XY Line Chart look then a space and then enter delimited values string for Line Chart. Here is a Candlestick and Line Chart idea eg. c 1:20,10,15,25,17,30|0,5,10,7,12,6|35,25,45,47,24,46|15,40,30,27,39,54|70,55,63,59,80,6 Here is a Line Chart and Box Chart idea s 1:-1,5,10,7,12,-1|-1,25,30,27,24,-1|-1,40,45,47,39,-1|-1,55,63,59,80,-1|-1,30,40,35,30,-1|-1,-1,5,70,90,-1|-1,-1,-1,80,5,-1&chm=F,FF9900,0,1:4,40|H,0CBF0B,0,1:4,1:20|H,000000,4,1:4,1:40|H,0000FF,3,1:4,1:20|o,FF0000,5,-1,7|o,FF0000,6,-1,7 Prefix just the delimited string you enter by 1: to additionally display Candlestick/Box Charts or by 0: to only display Candlestick/Box Chart" :
(ctype == 'map' ? "" :
(ctype == 'gom' ? "Enter delimited values string for Google-O-Meter Chart" :
(ctype == 'r' ? "Enter delimited values string for Radar Chart but prefix with an s for smooth lines" :
"")))))))));
var oneprompt=(ctype == 'v' ? "Enter delimited values string for your Venn Diagram collaborations, optionally, such that ... " + String.fromCharCode(10) + "The first three values specify the sizes of three circles: A, B, & C. For chart with only two circles, specify zero for the third value." + String.fromCharCode(10) + "The fourth value specifies the size of the intersection of A and B." + String.fromCharCode(10) + "The fifth value specifies the size of the intersection of A and C. For a chart with only two circles, do not specify a value here." + String.fromCharCode(10) + "The sixth value specifies the size of the intersection of B and C. For a chart with only two circles, do not specify a value here." + String.fromCharCode(10) + "The seventh value specifies the size of the common intersection of A, B, and C. For a chart with only two circles, do not specify a value here." + String.fromCharCode(10) + String.fromCharCode(10) + "" : (ctype == 's' ? "Enter delimited values string for Scatter Chart" : (ctype == 'gv' ? "Enter delimited values string for GraphViz Chart" :
(ctype.substring(0,1) == 'p' ? "Enter delimited values string for Pie Chart" :
((ctype + ' ').substring(0,2).substring(0,1) == 'bv'.substring(0,1) ? "Enter g for Grouped or s for Stacked or o for Overlapped Bar Chart look then a space and then enter delimited values string for Bar Chart. Here is a Candlestick and Bar Chart idea eg. g 1:20,10,15,25,17,30|0,5,10,7,12,6|35,25,45,47,24,46|15,40,30,27,39,54|70,55,63,59,80,6 Here is a vertical Bar Chart and Box Chart idea vs 1:-1,5,10,7,12,-1|-1,25,30,27,24,-1|-1,40,45,47,39,-1|-1,55,63,59,80,-1|-1,30,40,35,30,-1|-1,-1,5,70,90,-1|-1,-1,-1,80,5,-1&chm=F,FF9900,0,1:4,40|H,0CBF0B,0,1:4,1:20|H,000000,4,1:4,1:40|H,0000FF,3,1:4,1:20|o,FF0000,5,-1,7|o,FF0000,6,-1,7 Prefix just the delimited string you enter by 1: to additionally display Candlestick/Box Charts or by 0: to only display Candlestick/Box Chart" :
(ctype.substring(0,1) == 'l' ? "Enter c for Even or s for Sparklines or xy for Just XY Line Chart look then a space and then enter delimited values string for Line Chart. Here is a Candlestick and Line Chart idea eg. c 1:20,10,15,25,17,30|0,5,10,7,12,6|35,25,45,47,24,46|15,40,30,27,39,54|70,55,63,59,80,6 Here is a Line Chart and Box Chart idea s 1:-1,5,10,7,12,-1|-1,25,30,27,24,-1|-1,40,45,47,39,-1|-1,55,63,59,80,-1|-1,30,40,35,30,-1|-1,-1,5,70,90,-1|-1,-1,-1,80,5,-1&chm=F,FF9900,0,1:4,40|H,0CBF0B,0,1:4,1:20|H,000000,4,1:4,1:40|H,0000FF,3,1:4,1:20|o,FF0000,5,-1,7|o,FF0000,6,-1,7 Prefix just the delimited string you enter by 1: to additionally display Candlestick/Box Charts or by 0: to only display Candlestick/Box Chart" :
(ctype == 'map' ? "" :
(ctype == 'gom' ? "Enter delimited values string for Google-O-Meter Chart" :
(ctype == 'r' ? "Enter delimited values string for Radar Chart but prefix with an s for smooth lines" :
"")))))))));
var asktwo=(ctype == 'v' ? true : (ctype == 's' ? true : (ctype == 'gv' ? false :
(ctype.substring(0,1) == 'p' ? true :
((ctype + ' ').substring(0,2).substring(0,1) == 'bv'.substring(0,1) ? true : (ctype.substring(0,1) == 'l' ? true :
(ctype == 'map' ? false :
(ctype == 'gom' ? true :
(ctype == 'r' ? true :
false)))))))));

var twopb=(ctype.substring(0,1) == 'p' ? 'Any optional legend or title argument snippets? Optionally prefix by 3 for 3d Pie Chart or by c for Concentric Pie Chart. Eg. 3' + chdl + preachtt + '&chtt=My%20' + cencodename + '&chco=' + defchco : 'Any optional legend or title argument snippets? Eg. ' + chdl + preachtt + '&chtt=My%20' + cencodename + '&chco=' + defchco);
var beforeanswer=(ctype.substring(0,1) == 'l' ? 'c ' : ((ctype + ' ').substring(0,2).substring(0,1) == 'bv'.substring(0,1) ? 'vg ' : ''));


var emsmlist='';

… that goes into helping make the changed latest draft image_venn.html Google Chart Image Chart Venn Chart or Scatter Chart or GraphViz Chart or Pie Chart or Line Chart or Bar Chart or Candlestick/Box Chart or Google-O-Meter Chart or Radar Chart or Map Chart interfacing web application you can also try below, have regular sleepovers on cloud nine.

Did you know?

Did you notice the inclusion of CSS styling …

<style>

#fsangle { background-image: url("data:image/svg+xml;utf8,<svg xmlns='http://www.w3.org/2000/svg' width='24' height='24' viewport='0 0 100 100' style='font-family:Verdana;font-size:10px;'><text y='50%'> \00B0</text></svg>"); background-repeat: no-repeat; background-position: center right; }

</style>

? It styles an input type=number textbox where a placeholder is not really an option to explain a textbox’s purpose, and we do dislike set aside labels, these days. It’s also a way to explain the textbox for mobile users who do not get a hovering message to help. It’s also got an internationalization feel to it, using the degree sign emoji ° (ie. &#176; or that \u0080 UTF-16 Encoding style of definition suitable for CSS styling usage) to both associate the units we’d want, as well as that we are asking for an angle. Clockwise or anticlockwise, alas, comes down to user experience!


Previous relevant Google Chart Image Chart Box Chart Tutorial is shown below.

Google Chart Image Chart Box Chart Tutorial

Google Chart Image Chart Box Chart Tutorial

Today we offer new …

… interfacings, onto the progress up to yesterday’s Google Chart Image Chart Colour Tutorial.

As such, it’s probably timely to update you with the parameterization up the top of the Javascript code …


var pretherest='';
var newtherest='';
var tmod='';
var colchange='';
var cht=location.search.split('cht=')[1] ? decodeURIComponent(location.search.split('cht=')[1].split('&')[0]) : "v";
if ((cht + ' ').substring(0,1) == 'p' && cht != 'p') { pretherest=cht.substring(1); }
//if ((cht + ' ').substring(0,2) == 'bv' && cht != 'bv') { pretherest=cht.substring(2); if (1 == 1) { cht='bv'; } }
if ((cht + ' ').substring(0,1) == 'bv'.substring(0,1) && cht != 'bv'.substring(0,1)) { pretherest=cht.substring(1); if (1 == 1) { cht='bv'.substring(0,1); } }
if ((cht + ' ').substring(0,1) == 'l' && cht != 'l') { pretherest=cht.substring(1); if (1 == 1) { cht='l'; } }
var ccode=location.search.split('chld=')[1] ? decodeURIComponent(location.search.split('chld=')[1].split('&')[0]) : "";
var ctype=location.search.split('type=')[1] ? decodeURIComponent(location.search.split('type=')[1].split('&')[0]) : cht;
var cname=(ctype == 'v' ? 'Venn Chart' : (ctype == 's' ? 'Scatter Chart' : (ctype == 'gv' ? 'GraphViz Chart' :
(ctype.substring(0,1) == 'p' ? 'Pie Chart' :
((ctype + ' ').substring(0,2).substring(0,1) == 'bv'.substring(0,1) ? 'Bar Chart' : (ctype.substring(0,1) == 'l' ? 'Line Chart' :
(ctype == 'map' ? 'Map Chart' :
(ctype == 'gom' ? 'Google-O-Meter Chart' :
''))))))));
var cencodename=(ctype == 'v' ? 'Venn%20Diagram' : (ctype == 's' ? 'Scatter%20Chart' : (ctype == 'gv' ? 'GraphViz%20Chart' :
(ctype.substring(0,1) == 'p' ? 'Pie%20Chart' :
((ctype + ' ').substring(0,2).substring(0,1) == 'bv'.substring(0,1) ? 'Bar%20Chart' : (ctype.substring(0,1) == 'l' ? 'Line%20Chart' :
(ctype == 'map' ? 'Map%20Chart' :
(ctype == 'gom' ? 'Google-O-Meter%20Chart' :
''))))))));
var chdt=(ctype == 'v' ? '&chd=t:' : (ctype == 's' ? '&chd=t:' : (ctype == 'gv' ? '&chl=' :
(ctype.substring(0,1) == 'p' ? pretherest + '&chd=t:' :
((ctype + ' ').substring(0,2).substring(0,1) == 'bv'.substring(0,1) ? '&chd=t:' : (ctype.substring(0,1) == 'l' ? '&chd=t:' :
(ctype == 'map' ? '' :
(ctype == 'gom' ? '&chd=t:' :
''))))))));
var chdeq=(ctype == 'v' ? '&chd=' : (ctype == 's' ? '&chd=' : (ctype == 'gv' ? '&chl=' :
(ctype.substring(0,1) == 'p' ? '&chd=' :
((ctype + ' ').substring(0,2).substring(0,1) == 'bv'.substring(0,1) ? '&chd=' : (ctype.substring(0,1) == 'l' ? '&chd=' :
(ctype == 'map' ? '&chld=' :
(ctype == 'gom' ? '&chdl=' :
''))))))));
var tc=(ctype == 'v' ? 't:' : (ctype == 's' ? 't:' : (ctype == 'gv' ? '' :
(ctype.substring(0,1) == 'p' ? 't:' :
((ctype + ' ').substring(0,2).substring(0,1) == 'bv'.substring(0,1) ? 't:' : (ctype.substring(0,1) == 'l' ? 't:' :
(ctype == 'map' ? '' :
(ctype == 'gom' ? 't:' :
''))))))));
var chdl=(ctype == 'v' ? '&chdl=' : (ctype == 's' ? '&chdl=' : (ctype == 'gv' ? '' :
(ctype.substring(0,1) == 'p' ? '&chdl=' :
((ctype + ' ').substring(0,2).substring(0,1) == 'bv'.substring(0,1) ? '&chbh=' : (ctype.substring(0,1) == 'l' ? '&chbh=' :
(ctype == 'map' ? '' :
(ctype == 'gom' ? '&chdl=' :
''))))))));

var prenchtt=(ctype == 'v' ? '100,80,60,30,30,30,10' : (ctype == 's' ? '12,87,75,41,23,96,68,71,34,9|98,60,27,34,56,79,58,74,18,76|84,23,69,81,47,94,60,93,64,54' : (ctype == 'gv' ? 'graph{C_0--H_0[type=s];C_0--H_1[type=s];C_0--H_2[type=s];C_0--C_1[type=s];C_1--H_3[type=s];C_1--H_4[type=s];C_1--H_5[type=s]}' :
(ctype.substring(0,1) == 'p' ? '1,2,3,4' :
((ctype + ' ').substring(0,2).substring(0,1) == 'bv'.substring(0,1) ? '5,5,5|10,10,10|15,15,15' : (ctype.substring(0,1) == 'l' ? '5,45,5|10,60,10|15,85,15' :
(ctype == 'map' ? '' :
(ctype == 'gom' ? '20,40,60' :
''))))))));
var preachtt=(ctype == 'v' ? 'A|B|C' : (ctype == 's' ? 'Cats|Dogs' : (ctype == 'gv' ? '' :
(ctype.substring(0,1) == 'p' ? 'January|February|March|April' :
((ctype + ' ').substring(0,2).substring(0,1) == 'bv'.substring(0,1) ? '15,4,15' : (ctype.substring(0,1) == 'l' ? '15,4,15' :
(ctype == 'map' ? '' :
(ctype == 'gom' ? 'A|B|C' :
''))))))));
var defchco=(ctype == 'v' ? 'ff0000,00ff00,0000ff' : (ctype == 's' ? 'FF0000|0000FF&chxt=x,y' : (ctype == 'gv' ? '' :
(ctype.substring(0,1) == 'p' ? 'ff0000,00ff00,0000ff,ff00ff' :
((ctype + ' ').substring(0,2).substring(0,1) == 'bv'.substring(0,1) ? '4D89F9,C6D9FD,C6FDD9&chxt=x,y' : (ctype.substring(0,1) == 'l' ? '3D89F9.B6D9FD,B6FDD9&chxt=x,y' :
(ctype == 'map' ? '' :
(ctype == 'gom' ? 'ff0000,00ff00,0000ff' :
''))))))));

var prechtt=(ctype == 'v' ? chdt + prenchtt + chdl + preachtt : (ctype == 's' ? chdt + prenchtt + chdl + preachtt + '&chxt=x,y' : (ctype == 'gv' ? chdt + prenchtt :
(ctype.substring(0,1) == 'p' ? chdt + prenchtt + chdl + preachtt :
((ctype + ' ').substring(0,2).substring(0,1) == 'bv'.substring(0,1) ? chdt + prenchtt + chdl + preachtt : (ctype.substring(0,1) == 'l' ? chdt + prenchtt + chdl + preachtt :
(ctype == 'map' ? '' :
(ctype == 'gom' ? chdt + prenchtt + chdl + preachtt :
''))))))));
var promptone=(ctype == 'v' ? "Enter delimited values string for Venn Diagram such that ... " + String.fromCharCode(10) + "The first three values specify the sizes of three circles: A, B, & C. For chart with only two circles, specify zero for the third value." + String.fromCharCode(10) + "The fourth value specifies the size of the intersection of A and B." + String.fromCharCode(10) + "The fifth value specifies the size of the intersection of A and C. For a chart with only two circles, do not specify a value here." + String.fromCharCode(10) + "The sixth value specifies the size of the intersection of B and C. For a chart with only two circles, do not specify a value here." + String.fromCharCode(10) + "The seventh value specifies the size of the common intersection of A, B, and C. For a chart with only two circles, do not specify a value here." + String.fromCharCode(10) + String.fromCharCode(10) + "" : (ctype == 's' ? "Enter delimited values string for Scatter Chart" : (ctype == 'gv' ? "Enter delimited values string for GraphViz Chart" :
(ctype.substring(0,1) == 'p' ? "Enter delimited values string for Pie Chart" :
((ctype + ' ').substring(0,2).substring(0,1) == 'bv'.substring(0,1) ? "Enter v for Vertical or h for Horizontal then one of g for Group or s for Stacked or o for Overlapped Bar Chart look then a space and then enter delimited values string for Bar Chart. Here is a Candlestick and horizontal Bar Chart idea eg. hg 1:20,10,15,25,17,30|0,5,10,7,12,6|35,25,45,47,24,46|15,40,30,27,39,54|70,55,63,59,80,6 Here is a vertical Bar Chart and Box Chart idea vs 1:-1,5,10,7,12,-1|-1,25,30,27,24,-1|-1,40,45,47,39,-1|-1,55,63,59,80,-1|-1,30,40,35,30,-1|-1,-1,5,70,90,-1|-1,-1,-1,80,5,-1&chm=F,FF9900,0,1:4,40|H,0CBF0B,0,1:4,1:20|H,000000,4,1:4,1:40|H,0000FF,3,1:4,1:20|o,FF0000,5,-1,7|o,FF0000,6,-1,7 Prefix just the delimited string you enter by 1: to additionally display Candlestick/Box Charts or by 0: to only display Candlestick/Box Chart" :
(ctype.substring(0,1) == 'l' ? "Enter c for Even or s for Sparklines or xy for Just XY Line Chart look then a space and then enter delimited values string for Line Chart. Here is a Candlestick and Line Chart idea eg. c 1:20,10,15,25,17,30|0,5,10,7,12,6|35,25,45,47,24,46|15,40,30,27,39,54|70,55,63,59,80,6 Here is a Line Chart and Box Chart idea s 1:-1,5,10,7,12,-1|-1,25,30,27,24,-1|-1,40,45,47,39,-1|-1,55,63,59,80,-1|-1,30,40,35,30,-1|-1,-1,5,70,90,-1|-1,-1,-1,80,5,-1&chm=F,FF9900,0,1:4,40|H,0CBF0B,0,1:4,1:20|H,000000,4,1:4,1:40|H,0000FF,3,1:4,1:20|o,FF0000,5,-1,7|o,FF0000,6,-1,7 Prefix just the delimited string you enter by 1: to additionally display Candlestick/Box Charts or by 0: to only display Candlestick/Box Chart" :
(ctype == 'map' ? "" :
(ctype == 'gom' ? "Enter delimited values string for Google-O-Meter Chart" :
""))))))));
var oneprompt=(ctype == 'v' ? "Enter delimited values string for your Venn Diagram collaborations, optionally, such that ... " + String.fromCharCode(10) + "The first three values specify the sizes of three circles: A, B, & C. For chart with only two circles, specify zero for the third value." + String.fromCharCode(10) + "The fourth value specifies the size of the intersection of A and B." + String.fromCharCode(10) + "The fifth value specifies the size of the intersection of A and C. For a chart with only two circles, do not specify a value here." + String.fromCharCode(10) + "The sixth value specifies the size of the intersection of B and C. For a chart with only two circles, do not specify a value here." + String.fromCharCode(10) + "The seventh value specifies the size of the common intersection of A, B, and C. For a chart with only two circles, do not specify a value here." + String.fromCharCode(10) + String.fromCharCode(10) + "" : (ctype == 's' ? "Enter delimited values string for Scatter Chart" : (ctype == 'gv' ? "Enter delimited values string for GraphViz Chart" :
(ctype.substring(0,1) == 'p' ? "Enter delimited values string for Pie Chart" :
((ctype + ' ').substring(0,2).substring(0,1) == 'bv'.substring(0,1) ? "Enter g for Grouped or s for Stacked or o for Overlapped Bar Chart look then a space and then enter delimited values string for Bar Chart. Here is a Candlestick and Bar Chart idea eg. g 1:20,10,15,25,17,30|0,5,10,7,12,6|35,25,45,47,24,46|15,40,30,27,39,54|70,55,63,59,80,6 Here is a vertical Bar Chart and Box Chart idea vs 1:-1,5,10,7,12,-1|-1,25,30,27,24,-1|-1,40,45,47,39,-1|-1,55,63,59,80,-1|-1,30,40,35,30,-1|-1,-1,5,70,90,-1|-1,-1,-1,80,5,-1&chm=F,FF9900,0,1:4,40|H,0CBF0B,0,1:4,1:20|H,000000,4,1:4,1:40|H,0000FF,3,1:4,1:20|o,FF0000,5,-1,7|o,FF0000,6,-1,7 Prefix just the delimited string you enter by 1: to additionally display Candlestick/Box Charts or by 0: to only display Candlestick/Box Chart" :
(ctype.substring(0,1) == 'l' ? "Enter c for Even or s for Sparklines or xy for Just XY Line Chart look then a space and then enter delimited values string for Line Chart. Here is a Candlestick and Line Chart idea eg. c 1:20,10,15,25,17,30|0,5,10,7,12,6|35,25,45,47,24,46|15,40,30,27,39,54|70,55,63,59,80,6 Here is a Line Chart and Box Chart idea s 1:-1,5,10,7,12,-1|-1,25,30,27,24,-1|-1,40,45,47,39,-1|-1,55,63,59,80,-1|-1,30,40,35,30,-1|-1,-1,5,70,90,-1|-1,-1,-1,80,5,-1&chm=F,FF9900,0,1:4,40|H,0CBF0B,0,1:4,1:20|H,000000,4,1:4,1:40|H,0000FF,3,1:4,1:20|o,FF0000,5,-1,7|o,FF0000,6,-1,7 Prefix just the delimited string you enter by 1: to additionally display Candlestick/Box Charts or by 0: to only display Candlestick/Box Chart" :
(ctype == 'map' ? "" :
(ctype == 'gom' ? "Enter delimited values string for Google-O-Meter Chart" :
""))))))));
var asktwo=(ctype == 'v' ? true : (ctype == 's' ? true : (ctype == 'gv' ? false :
(ctype.substring(0,1) == 'p' ? true :
((ctype + ' ').substring(0,2).substring(0,1) == 'bv'.substring(0,1) ? true : (ctype.substring(0,1) == 'l' ? true :
(ctype == 'map' ? false :
(ctype == 'gom' ? true :
false))))))));

var twopb=(ctype.substring(0,1) == 'p' ? 'Any optional legend or title argument snippets? Optionally prefix by 3 for 3d Pie Chart or by c for Concentric Pie Chart. Eg. 3' + chdl + preachtt + '&chtt=My%20' + cencodename + '&chco=' + defchco : 'Any optional legend or title argument snippets? Eg. ' + chdl + preachtt + '&chtt=My%20' + cencodename + '&chco=' + defchco);
var beforeanswer=(ctype.substring(0,1) == 'l' ? 'c ' : ((ctype + ' ').substring(0,2).substring(0,1) == 'bv'.substring(0,1) ? 'vg ' : ''));

var emsmlist='';

… that goes into helping make the changed latest draft image_venn.html Google Chart Image Chart Venn Chart or Scatter Chart or GraphViz Chart or Pie Chart or Line Chart or Bar Chart or Candlestick/Box Chart or Google-O-Meter Chart or Map Chart interfacing web application you can also try below, one of the happiest little vegemites we know.


Previous relevant Google Chart Image Chart Colour Tutorial is shown below.

Google Chart Image Chart Colour Tutorial

Google Chart Image Chart Colour Tutorial

Restricting you creatives to “inhouse annotations” of the “gray variety” might be seen as a bit boooorrrriiiinnnngggg! And so, onto the progress up to yesterday’s Google Chart Image Chart Rubber Banding Tutorial, today we’ve added a …

  • colour picker … way user can define an “inhouse annotations” colour … and while we were at it …
  • as far as text “inhouse annotations” go we’ve added a counterclockwise from the horizon, in degrees, way to define an angle the text should be placed at … and …
  • we’ve stopped closing off the text font size dropdown too early, allowing the user to mix it up with their annotations, and so …

    We now recommend, for those users pushing the boundaries of functionality, to gather all their “inhouse annotations” together before any “graphical canvas annotations” are thought about.

Which begs the question …

Where do you get it?

Well, here, via … dare we say it?! … … via …

Mantissa Madness Monday

Both colour and degree counterclockwise angle became “Mantissa Madness Monday” tragics, a bit like moi, really?

How did we express these two measures?

  • colour can be derived at the 404.php end via mantissae that are 9 or more long where a number of the form rrrgggbbb is numerical and passed across to 404.php in the y co-ordinate mantissa … while … kind of crazily …
  • angle can be a set of zeros in the x co-ordinate mantissa represented by zero characters to the length of the angle from 1 to 359 in front of a pre-existant font size (in px) usage, from last “Mantissa Madness Monday” (us getting away with this because no font size should start with a zero)

Oh! We have such fun around here?! Below is PHP WordPress blog 404.php code …

<?php

// text placement
$black = imagecolorallocatealpha($im, 1, 1, 1, 0);
$blackish = imagecolorallocatealpha($im, 127, 127, 127, 64);
$yis=$csv[1];
$mantissae=explode('.', ('' . $csv[1]));
if (sizeof($mantissae) > 1) {
if (strlen($mantissae[1]) >= 9) {
$black = imagecolorallocatealpha($im, intval(substr($mantissae[1],0,3)), intval(substr(substr($mantissae[1],3),0,3)), intval(substr(substr($mantissae[1],6),0,3)), 0);
$blackish = imagecolorallocatealpha($im, intval(substr($mantissae[1],0,3)), intval(substr(substr($mantissae[1],3),0,3)), intval(substr(substr($mantissae[1],6),0,3)), 64);
}
$yis=$mantissae[0];
}

$za=0;
$xis=$csv[0];

$mantissae=explode('.', ('' . $csv[0]));
if (sizeof($mantissae) > 1) {
if (substr($mantissae[1],0,1) == '0') {
if (str_replace('0','',$mantissae[1]) != '') {
while (substr($mantissae[1],0,1) == '0') {
$za++;
$mantiss=substr($mantissae[1],1);
$mantissae[1]=$mantiss;
}
}
}

$tenpx=$mantissae[1];
$xis=$mantissae[0];
}
try {
if (function_exists('imagettftext')) {
if (explode('' . $csv[0] . ',' . $csv[1] . ',', $plotstring)[1] !== '') {
//echo explode('' . $csv[0] . ',' . $csv[1] . ',', $plotstring)[1];
//exit;
imagettftext($im, $tenpx, $za, $xis, $yis, $black, realpath('arial.ttf'), explode('' . $csv[0] . ',' . $csv[1] . ',', $plotstring)[1]);
}
}
} catch (Exception $e) { }

?>

… used by our changed latest draft image_venn.html Google Chart Image Chart Venn Chart or Scatter Chart or GraphViz Chart or Pie Chart or Line Chart or Bar Chart or Candlestick Chart or Map Chart interfacing web application you can also try below.


Previous relevant Google Chart Image Chart Rubber Banding Tutorial is shown below.

Google Chart Image Chart Rubber Banding Tutorial

Google Chart Image Chart Rubber Banding Tutorial

The Javascript clientside idea of “Rubber Banding”

Rubber banding is a popular technique of drawing geometric primitives such as line, polylines, rectangle, circle and ellipse on the computer screen.

… really appeals to our “inner programmer” … damn! … come, thou, out into the open, reveal thyself! … the sunshine is wonderful down here, and we’ve done away with death duties! … mostly! but it is …

  • only really a non-mobile prospect …

    function checkforaction(rubberbanding,nx,ny) {
    var bcbit='background-color:rgba(127,127,127,0.5);';
    var zeroes='';
    var classbit='';
    var brbit='';
    var ourdist=0;
    var ioff=(rubberbanding == true ? 1 : 0);
    var mone=1;

    curno=eval('' + xneeds.length);
    if (eval(ioff + curno) >= needtohave) {
    if (!rubberbanding) {
    document.getElementById('fauxdtext').innerHTML='';
    }
    if (curmode == 8) {
    zeroes='00000000';
    classbit=' class="crerect" ';
    } else if (curmode == -5) {
    //alert(1);
    bcbit='border:2px solid rgba(127,127,127,0.5);';
    if (rubberbanding) {
    ourdist=eval(2.0 * Math.sqrt((nx - xneeds[0]) * (nx - xneeds[0]) + (ny - yneeds[0]) * (ny - yneeds[0])));
    ourdist-=10;
    bcbit='border:2px solid gray;background-color:transparent;';
    } else {
    ourdist=eval(2.0 * Math.sqrt((xneeds[1] - xneeds[0]) * (xneeds[1] - xneeds[0]) + (yneeds[1] - yneeds[0]) * (yneeds[1] - yneeds[0])));
    }
    //alert(ourdist);
    //xneeds[1]=Math.floor('' + ourdist);
    //yneeds[1]=xneeds[1];
    brbit='border-radius:' + Math.floor(eval(ourdist / 2)) + 'px;';
    zeroes='00000';
    classbit=' class="ocirc" ';
    //alert('open circle');
    } else if (curmode == 6) {
    if (rubberbanding) {
    ourdist=eval(2.0 * Math.sqrt((nx - xneeds[0]) * (nx - xneeds[0]) + (ny - yneeds[0]) * (ny - yneeds[0])));
    ourdist-=10;
    } else {
    ourdist=eval(2.0 * Math.sqrt((xneeds[1] - xneeds[0]) * (xneeds[1] - xneeds[0]) + (yneeds[1] - yneeds[0]) * (yneeds[1] - yneeds[0])));
    }
    //xneeds[1]=Math.floor('' + ourdist);
    //yneeds[1]=xneeds[1];
    brbit='border-radius:' + Math.floor(eval(ourdist / 2)) + 'px;';
    //bcbit='border:2px solid rgba(127,127,127,0.5);';
    zeroes='000000';
    classbit=' class="ccirc" ';
    //alert('closed circle ' + bcbit);
    } else if (curmode == -4) {
    if (rubberbanding) {
    mone=0.90;
    bcbit='border:2px solid gray;background-color:transparent;';
    } else {
    bcbit='border:2px solid rgba(127,127,127,0.5);';
    }
    zeroes='00';
    classbit=' class="orect" ';
    } else if (curmode == 2) {
    zeroes='0';
    if (rubberbanding) {
    if (Math.min(xneeds[0],nx) == xneeds[0] && Math.min(yneeds[0],ny) == ny) { // thanks to https://stackoverflow.com/questions/18012420/draw-diagonal-lines-in-div-background-with-css
    classbit=' class="crossedtotl" ';
    } else if (Math.min(xneeds[0],nx) == nx && Math.min(yneeds[0],ny) == yneeds[0]) { // thanks to https://stackoverflow.com/questions/18012420/draw-diagonal-lines-in-div-background-with-css
    classbit=' class="crossedtotl" ';
    } else {
    classbit=' class="crossedtotr" ';
    }
    } else {
    if (Math.min(xneeds[0],xneeds[1]) == xneeds[0] && Math.min(yneeds[0],yneeds[1]) == yneeds[1]) { // thanks to https://stackoverflow.com/questions/18012420/draw-diagonal-lines-in-div-background-with-css
    classbit=' class="crossedtotl" ';
    } else if (Math.min(xneeds[0],xneeds[1]) == xneeds[1] && Math.min(yneeds[0],yneeds[1]) == yneeds[0]) { // thanks to https://stackoverflow.com/questions/18012420/draw-diagonal-lines-in-div-background-with-css
    classbit=' class="crossedtotl" ';
    } else {
    classbit=' class="crossedtotr" ';
    }
    }
    bcbit='';
    } else if (curmode == 4) {
    if (rubberbanding) {
    mone=0.90;
    }
    zeroes='0000';
    classbit=' class="crect" ';
    }
    if (!rubberbanding) {
    curno=-1;
    //if (brbit != '') {
    //document.getElementById('dtext').innerHTML+='<div' + classbit + ' style="' + brbit + 'position:absolute;left:' + Math.min(xneeds[0],nx) + 'px;top:' + Math.min(yneeds[0],ny) + 'px;width:' + Math.abs(xneeds[0] - nx) + 'px;height:' + Math.abs(yneeds[0] - ny) + 'px;z-index:98;' + bcbit + '"></div>';
    //} else {
    //document.getElementById('dtext').innerHTML+='<div' + classbit + ' style="' + brbit + 'position:absolute;left:' + Math.min(xneeds[0],xneeds[1]) + 'px;top:' + Math.min(yneeds[0],yneeds[1]) + 'px;width:' + Math.abs(xneeds[0] - xneeds[1]) + 'px;height:' + Math.abs(yneeds[0] - yneeds[1]) + 'px;z-index:98;' + bcbit + '"></div>';
    //}
    document.getElementById('aemail').href+='&text' + textnum + '=' + encodeURIComponent('' + xneeds[0] + '.' + zeroes + xneeds[1] + ',' + yneeds[0] + '.' + yneeds[1] + ',') + '';
    document.getElementById('asms').href+='&text' + textnum + '=' + encodeURIComponent('' + xneeds[0] + '.' + zeroes + xneeds[1] + ',' + yneeds[0] + '.' + yneeds[1] + ',') + '';
    aemailurl+='&text' + textnum + '=' + encodeURIComponent('' + xneeds[0] + '.' + zeroes + xneeds[1] + ',' + yneeds[0] + '.' + yneeds[1] + ',') + '';
    asmsurl+='&text' + textnum + '=' + encodeURIComponent('' + xneeds[0] + '.' + zeroes + xneeds[1] + ',' + yneeds[0] + '.' + yneeds[1] + ',') + '';
    arest+='&text' + textnum + '=' + encodeURIComponent('' + xneeds[0] + '.' + zeroes + xneeds[1] + ',' + yneeds[0] + '.' + yneeds[1] + ',') + '';
    }
    if (brbit != '') {
    //alert('brbit=' + brbit);
    //xneeds[0]-=(xneeds[1] - xneeds[0]);
    //yneeds[0]-=(yneeds[1] - yneeds[0]);
    //alert('xneeds[0]=' + xneeds[0]);
    if (rubberbanding) {
    document.getElementById('fauxdtext').innerHTML='<div' + classbit + ' style="' + brbit + 'z-index:-89;position:absolute;left:' + Math.floor(eval(Math.min(xneeds[0],xneeds[0]) - ourdist / 2)) + 'px;top:' + Math.floor(eval(Math.min(yneeds[0],yneeds[0]) - ourdist / 2)) + 'px;width:' + ourdist + 'px;height:' + ourdist + 'px;z-index:98;' + bcbit + '"></div>';
    } else {
    document.getElementById('dtext').innerHTML+='<div' + classbit + ' style="' + brbit + 'position:absolute;left:' + Math.floor(eval(Math.min(xneeds[0],xneeds[0]) - ourdist / 2)) + 'px;top:' + Math.floor(eval(Math.min(yneeds[0],yneeds[0]) - ourdist / 2)) + 'px;width:' + ourdist + 'px;height:' + ourdist + 'px;z-index:98;' + bcbit + '"></div>';
    }
    } else {
    if (rubberbanding) {
    document.getElementById('fauxdtext').innerHTML='<div' + classbit + ' style="' + brbit + 'z-index:-89;position:absolute;left:' + Math.min(xneeds[0],nx) + 'px;top:' + Math.min(yneeds[0],ny) + 'px;width:' + Math.max(Math.floor(eval(-30 + Math.abs(xneeds[0] - nx))),Math.floor(eval(mone * Math.abs(xneeds[0] - nx)))) + 'px;height:' + Math.max(Math.floor(eval(-30 + Math.abs(yneeds[0] - ny))),Math.floor(eval(mone * Math.abs(yneeds[0] - ny)))) + 'px;z-index:98;' + bcbit + '"></div>';
    } else {
    document.getElementById('dtext').innerHTML+='<div' + classbit + ' style="' + brbit + 'position:absolute;left:' + Math.min(xneeds[0],xneeds[1]) + 'px;top:' + Math.min(yneeds[0],yneeds[1]) + 'px;width:' + Math.abs(xneeds[0] - xneeds[1]) + 'px;height:' + Math.abs(yneeds[0] - yneeds[1]) + 'px;z-index:98;' + bcbit + '"></div>';
    }
    }
    if (!rubberbanding) {
    textnum++;
    xneeds=[];
    yneeds=[];
    //alert('arest=' + arest);
    document.getElementById('tdright').innerHTML="  <span id=spemail><a target=_blank href='mailto:?subject=My%20" + cencodename + "%20...%20best%20viewed%20in%20landscape%20...&body=" + encodeURIComponent((document.getElementById('myvenn').src + arest).replace((document.getElementById('myvenn').src + arest).split('?')[0].split('#')[0], document.URL.split('?')[0].split('#')[0])) + "' id=aemail title=Email>&#128231;</a></span>      <span id=spsms><a target=_blank onmouseover=\"if (smsee.length == 0 && origsmsurl.indexOf('sms:&') != -1) { smsee=prompt('Please enter SMS number to send to.', ''); if (smsee == null) { smsee=''; } else { origsmsurl=origsmsurl.replace('sms:&','sms:' + smsee + '&'); asmsurl=asmsurl.replace('sms:&','sms:' + smsee + '&'); this.href=asmsurl; } }\" ontouchstart=\"if (smsee.length == 0 && origsmsurl.indexOf('sms:&') != -1) { smsee=prompt('Please enter SMS number to send to.', ''); if (smsee == null) { smsee=''; } else { origsmsurl=origsmsurl.replace('sms:&','sms:' + smsee + '&'); asmsurl=asmsurl.replace('sms:&','sms:' + smsee + '&'); this.href=asmsurl; } }\" href='sms:&body=" + encodeURIComponent((document.getElementById('myvenn').src + arest).replace(document.getElementById('myvenn').src.split('?')[0].split('#')[0], document.URL.split('?')[0].split('#')[0])) + "' id=asms title=SMS>&#128223;</a></span><br><br>  <input title=\"\" onclick=\"event.stopPropagation();\" id=ilp onblur=\"waitfortwo(0); lasttext=this.value.replace(/\~\~/g, '<br>'); this.title=lasttext; if (!navigator.userAgent.match(/Android|BlackBerry|iPhone|iPad|iPod|Opera Mini|IEMobile/i)) { this.value=''; } this.placeholder='Click where you want ... ' + lasttext.replace(/\<br\>/g, String.fromCharCode(10)); mvp.setAttribute('content','initial-scale=1'); document.getElementById('myvenn').scrollIntoView();\" placeholder='Enter text and later click place for it on " + decodeURIComponent(cencodename) + " to left (line feed is ~~)' type=text style=width:500px; value=''></input>" + fszbit + "<br><br>  <img id=line src='/MarkItUp/line.png' onclick=\"event.stopPropagation(); this.style.border='1px dotted red'; waitfortwo(2);\"></img>  <img id=rectangle src='/MarkItUp/rectangle.png' onclick=\"event.stopPropagation(); this.style.border='1px dotted red'; waitfortwo(4);\"></img>  <img id=orectangle src='/MarkItUp/orectangle.png' onclick=\"event.stopPropagation(); this.style.border='1px dotted red'; waitfortwo(-4);\"></img>  <img id=circle src='/MarkItUp/circlefill.png' onclick=\"event.stopPropagation(); this.style.border='1px dotted red'; waitfortwo(6);\"></img>  <img id=ocircle src='/MarkItUp/circle.png' onclick=\"event.stopPropagation(); this.style.border='1px dotted red'; waitfortwo(-5);\"></img>  <button id=orerect onclick=\"event.stopPropagation(); this.style.border='1px dotted red'; waitfortwo(8);\" title=\"Zoom in on rectangle you define via two clicks\" style=display:none;>&#128270;</button>" + lastbit + atend;
    //alert(1);
    if (!navigator.userAgent.match(/Android|BlackBerry|iPhone|iPad|iPod|Opera Mini|IEMobile/i)) { document.getElementById('ilp').focus(); }
    document.getElementById('ilp').placeholder='Enter text and later click place for it on ' + decodeURIComponent(cencodename) + ' to left (line feed is ~~)';
    }
    } else if (curmode == 2 && !rubberbanding) {
    document.getElementById('line').style.border='1px dashed yellow';
    } else if (curmode == -4 && !rubberbanding) {
    document.getElementById('orectangle').style.border='1px dashed yellow';
    } else if (curmode == 4 && !rubberbanding) {
    document.getElementById('rectangle').style.border='1px dashed yellow';
    } else if (curmode == -5 && !rubberbanding) {
    document.getElementById('ocircle').style.border='1px dashed yellow';
    } else if (curmode == 6 && !rubberbanding) {
    document.getElementById('circle').style.border='1px dashed yellow';
    } else if (curmode == 8 && !rubberbanding) {
    document.getElementById('orerect').style.border='1px dashed yellow';
    }
    }

    // Rubber banding
    document.body.addEventListener('mousemove', function(evt){
    evt = evt || window.event;

    evt.preventDefault();

    elemLeft = document.getElementById('myvenn').offsetLeft;
    elemTop = document.getElementById('myvenn').offsetTop;

    //document.getElementById('myh3').innerHTML+=' ' + elemLeft + ':' + elemTop;
    //document.getElementById('myh3').innerHTML+=' ' + document.body.scrollLeft + '.' + document.body.scrollTop;

    if (evt.touches) {
    if (evt.touches[0].pageX) {
    //alert('here');
    xx = evt.touches[0].pageX + document.body.scrollLeft - elemLeft;
    yy = evt.touches[0].pageY + document.body.scrollTop - elemTop;
    if (xx >= 0 && xx <= eval(('' + document.getElementById('myvenn').width).replace('px','')) && yy >= 0 && yy <= eval(('' + document.getElementById('myvenn').height).replace('px',''))) {
    if (curno == 1 && (lastx != xx || lasty != yy)) {
    checkforaction(true,xx,yy);
    }
    //lastx=xx;
    //lasty=yy;
    //alert('x:' + x + ' and y:' + y);
    }
    } else {
    //alert('Here');
    xx = evt.touches[0].clientX + document.body.scrollLeft - elemLeft;
    yy = evt.touches[0].clientY + document.body.scrollTop - elemTop;
    if (xx >= 0 && xx <= eval(('' + document.getElementById('myvenn').width).replace('px','')) && yy >= 0 && yy <= eval(('' + document.getElementById('myvenn').height).replace('px',''))) {
    if (curno == 1 && (lastx != xx || lasty != yy)) {
    checkforaction(true,xx,yy);
    }
    //lastx=xx;
    //lasty=yy;
    //alert('x:' + x + ' and y:' + y);
    }
    }
    } else if (evt.clientX || ev.clientY) {
    //alert('HERE');
    xx = evt.clientX + document.body.scrollLeft - elemLeft;
    yy = evt.clientY + document.body.scrollTop - elemTop;
    if (xx >= 0 && xx <= eval(('' + document.getElementById('myvenn').width).replace('px','')) && yy >= 0 && yy <= eval(('' + document.getElementById('myvenn').height).replace('px',''))) {
    if (curno == 1 && (lastx != xx || lasty != yy)) {
    checkforaction(true,xx,yy);
    }
    //lastx=xx;
    //lasty=yy;
    }
    } else {
    //alert('HEre');
    xx = evt.pageX + document.body.scrollLeft - elemLeft;
    yy = evt.pageY + document.body.scrollTop - elemTop;
    if (xx >= 0 && xx <= eval(('' + document.getElementById('myvenn').width).replace('px','')) && yy >= 0 && yy <= eval(('' + document.getElementById('myvenn').height).replace('px',''))) {
    if (curno == 1 && (lastx != xx || lasty != yy)) {
    checkforaction(true,xx,yy);
    }
    //lastx=xx;
    //lasty=yy;
    }
    }
    });

    … at least for us (being as we do not want to clobber any pinch or spread gesture ideas, for the user)
  • is only a really, “nice to have” functionality idea

Even so, achieving even a 95% percent working “rubber band” is like … is like …

Barracking for Hairtie United …
You little beauty, Untied!

And so, further to yesterday’s Google Chart Image Chart Circle Annotation Tutorial we have this non-mobile “Rubber Banding” inhouse annotation functionality included in our changed latest draft image_venn.html Google Chart Image Chart Venn Chart or Scatter Chart or GraphViz Chart or Pie Chart or Line Chart or Bar Chart or Candlestick Chart or Map Chart interfacing web application you can also try below.

But there’s more! Despite how long out of the day it takes to barrack for Hairtie United, there was a mobile matter we resolved. A slide in today’s animated GIF presentation shows the issue. On mobile platforms, with these inhouse annotations, it would immediately show a tiny annotation. There panned out to be two event programming related issues we needed to fix related to this problem …

  1. change looking for a “touchstart” event, and instead look for a “touchdown” event for a document.body scope (else we might have restricted the “scope” to just document.getEleementById(‘myvenn’) as another approach (and you should note our event.stopPropagation() statements in lots of places as another research point for you)) because we are talking “discrete click” user behaviour we are targeting … as well as …
  2. start checking that the co-ordinates calculated fall into the range of the Google Charts Image Chart image dimensions … doh!


document.body.addEventListener('touchdown', function(evt){
//alert(8);
evt = evt || window.event;

evt.preventDefault();

elemLeft = document.getElementById('myvenn').offsetLeft;
elemTop = document.getElementById('myvenn').offsetTop;

//document.getElementById('myh3').innerHTML+=' ' + elemLeft + ';' + elemTop;

if (evt.touches) {
if (evt.touches[0].pageX) {
//alert('here');
x = evt.touches[0].pageX + document.body.scrollLeft - elemLeft;
y = evt.touches[0].pageY + document.body.scrollTop - elemTop;
if (x >= 0 && x <= eval(('' + document.getElementById('myvenn').width).replace('px','')) && y >= 0 && y <= eval(('' + document.getElementById('myvenn').height).replace('px',''))) {
if (curno >= 0 && (lastx != x || lasty != y)) {
xneeds.push(x);
yneeds.push(y);
checkforaction(false,-1,-1);
}
lastx=x;
lasty=y;
}
//alert('x:' + x + ' and y:' + y);
} else {
//alert('Here');
x = evt.touches[0].clientX + document.body.scrollLeft - elemLeft;
y = evt.touches[0].clientY + document.body.scrollTop - elemTop;
if (x >= 0 && x <= eval(('' + document.getElementById('myvenn').width).replace('px','')) && y >= 0 && y <= eval(('' + document.getElementById('myvenn').height).replace('px',''))) {
if (curno >= 0 && (lastx != x || lasty != y)) {
xneeds.push(x);
yneeds.push(y);
checkforaction(false,-1,-1);
}
lastx=x;
lasty=y;
}
//alert('x:' + x + ' and y:' + y);
}
} else if (evt.clientX || ev.clientY) {
//alert('HERE');
x = evt.clientX + document.body.scrollLeft - elemLeft;
y = evt.clientY + document.body.scrollTop - elemTop;
if (x >= 0 && x <= eval(('' + document.getElementById('myvenn').width).replace('px','')) && y >= 0 && y <= eval(('' + document.getElementById('myvenn').height).replace('px',''))) {
if (curno >= 0 && (lastx != x || lasty != y)) {
xneeds.push(x);
yneeds.push(y);
checkforaction(false,-1,-1);
}
lastx=x;
lasty=y;
}
} else {
//alert('HEre');
x = evt.pageX + document.body.scrollLeft - elemLeft;
y = evt.pageY + document.body.scrollTop - elemTop;
if (x >= 0 && x <= eval(('' + document.getElementById('myvenn').width).replace('px','')) && y >= 0 && y <= eval(('' + document.getElementById('myvenn').height).replace('px',''))) {
if (curno >= 0 && (lastx != x || lasty != y)) {
xneeds.push(x);
yneeds.push(y);
checkforaction(false,-1,-1);
}
lastx=x;
lasty=y;
}
}
});

Did you know?

Well … we didn’t?! We happened to try the web application above on a tiny iPad and saw that HTML button elements with an innerHTML label containing a line feed ( ie. <br> ) only showed the top line, and, alas, for that button in question, the vital new information used to be on the second line. Hence our fix …


//document.getElementById('bshare').innerHTML='Repainting Top Left Image Periodically ... <br>Click here to Broadcast this session to other interested parties ...';
document.getElementById('bshare').innerHTML='Click here to Broadcast this session to other interested parties ...<br>Repainting Top Left Image Periodically ...';


Previous relevant Google Chart Image Chart Circle Annotation Tutorial is shown below.

Google Chart Image Chart Circle Annotation Tutorial

Google Chart Image Chart Circle Annotation Tutorial

Today, we add …

  • open circle
  • filled circle

… annotation possibilities onto the “Broadcast Talk” work in yesterday’s Google Chart Image Chart Broadcast Talk Context Tutorial.

The CSS border-radius property has come to the rescue of many a programmer, saving us from resorting to SVG to display circle or ellipses or arcs of various sorts …


function checkforaction() {
var bcbit='background-color:rgba(127,127,127,0.5);';
var zeroes='';
var classbit='';
var brbit='';
var ourdist=0;


curno=eval('' + xneeds.length);
if (curno >= needtohave) {
if (curmode == 8) {
zeroes='00000000';
classbit=' class="crerect" ';
} else if (curmode == -5) {
//alert(1);
ourdist=eval(2.0 * Math.sqrt((xneeds[1] - xneeds[0]) * (xneeds[1] - xneeds[0]) + (yneeds[1] - yneeds[0]) * (yneeds[1] - yneeds[0])));
//alert(ourdist);
//xneeds[1]=Math.floor('' + ourdist);
//yneeds[1]=xneeds[1];
brbit='border-radius:' + Math.floor(eval(ourdist / 2)) + 'px;';
bcbit='border:2px solid rgba(127,127,127,0.5);';
zeroes='00000';
classbit=' class="ocirc" ';
//alert('open circle');
} else if (curmode == 6) {
ourdist=eval(2.0 * Math.sqrt((xneeds[1] - xneeds[0]) * (xneeds[1] - xneeds[0]) + (yneeds[1] - yneeds[0]) * (yneeds[1] - yneeds[0])));
//xneeds[1]=Math.floor('' + ourdist);
//yneeds[1]=xneeds[1];
brbit='border-radius:' + Math.floor(eval(ourdist / 2)) + 'px;';
//bcbit='border:2px solid rgba(127,127,127,0.5);';
zeroes='000000';
classbit=' class="ccirc" ';
//alert('closed circle ' + bcbit);
}
else if (curmode == -4) {
bcbit='border:2px solid rgba(127,127,127,0.5);';
zeroes='00';
classbit=' class="orect" ';
} else if (curmode == 2) {
zeroes='0';
if (Math.min(xneeds[0],xneeds[1]) == xneeds[0] && Math.min(yneeds[0],yneeds[1]) == yneeds[1]) { // thanks to https://stackoverflow.com/questions/18012420/draw-diagonal-lines-in-div-background-with-css
classbit=' class="crossedtotl" ';
} else if (Math.min(xneeds[0],xneeds[1]) == xneeds[1] && Math.min(yneeds[0],yneeds[1]) == yneeds[0]) { // thanks to https://stackoverflow.com/questions/18012420/draw-diagonal-lines-in-div-background-with-css
classbit=' class="crossedtotl" ';
} else {
classbit=' class="crossedtotr" ';
}
bcbit='';
} else if (curmode == 4) {
zeroes='0000';
classbit=' class="crect" ';
}
curno=-1;
//if (brbit != '') {
//document.getElementById('dtext').innerHTML+='<div' + classbit + ' style="' + brbit + 'position:absolute;left:' + Math.min(xneeds[0],xneeds[1]) + 'px;top:' + Math.min(yneeds[0],yneeds[1]) + 'px;width:' + Math.abs(xneeds[0] - xneeds[1]) + 'px;height:' + Math.abs(yneeds[0] - yneeds[1]) + 'px;z-index:98;' + bcbit + '"></div>';
//} else {
//document.getElementById('dtext').innerHTML+='<div' + classbit + ' style="' + brbit + 'position:absolute;left:' + Math.min(xneeds[0],xneeds[1]) + 'px;top:' + Math.min(yneeds[0],yneeds[1]) + 'px;width:' + Math.abs(xneeds[0] - xneeds[1]) + 'px;height:' + Math.abs(yneeds[0] - yneeds[1]) + 'px;z-index:98;' + bcbit + '"></div>';
//}
document.getElementById('aemail').href+='&text' + textnum + '=' + encodeURIComponent('' + xneeds[0] + '.' + zeroes + xneeds[1] + ',' + yneeds[0] + '.' + yneeds[1] + ',') + '';
document.getElementById('asms').href+='&text' + textnum + '=' + encodeURIComponent('' + xneeds[0] + '.' + zeroes + xneeds[1] + ',' + yneeds[0] + '.' + yneeds[1] + ',') + '';
aemailurl+='&text' + textnum + '=' + encodeURIComponent('' + xneeds[0] + '.' + zeroes + xneeds[1] + ',' + yneeds[0] + '.' + yneeds[1] + ',') + '';
asmsurl+='&text' + textnum + '=' + encodeURIComponent('' + xneeds[0] + '.' + zeroes + xneeds[1] + ',' + yneeds[0] + '.' + yneeds[1] + ',') + '';
arest+='&text' + textnum + '=' + encodeURIComponent('' + xneeds[0] + '.' + zeroes + xneeds[1] + ',' + yneeds[0] + '.' + yneeds[1] + ',') + '';
if (brbit != '') {
//alert('brbit=' + brbit);
//xneeds[0]-=(xneeds[1] - xneeds[0]);
//yneeds[0]-=(yneeds[1] - yneeds[0]);
//alert('xneeds[0]=' + xneeds[0]);
document.getElementById('dtext').innerHTML+='<div' + classbit + ' style="' + brbit + 'position:absolute;left:' + Math.floor(eval(Math.min(xneeds[0],xneeds[0]) - ourdist / 2)) + 'px;top:' + Math.floor(eval(Math.min(yneeds[0],yneeds[0]) - ourdist / 2)) + 'px;width:' + ourdist + 'px;height:' + ourdist + 'px;z-index:98;' + bcbit + '"></div>';
} else {

document.getElementById('dtext').innerHTML+='<div' + classbit + ' style="' + brbit + 'position:absolute;left:' + Math.min(xneeds[0],xneeds[1]) + 'px;top:' + Math.min(yneeds[0],yneeds[1]) + 'px;width:' + Math.abs(xneeds[0] - xneeds[1]) + 'px;height:' + Math.abs(yneeds[0] - yneeds[1]) + 'px;z-index:98;' + bcbit + '"></div>';
}
textnum++;
xneeds=[];
yneeds=[];
//alert('arest=' + arest);
document.getElementById('tdright').innerHTML="  <span id=spemail><a target=_blank href='mailto:?subject=My%20" + cencodename + "%20...%20best%20viewed%20in%20landscape%20...&body=" + encodeURIComponent((document.getElementById('myvenn').src + arest).replace((document.getElementById('myvenn').src + arest).split('?')[0].split('#')[0], document.URL.split('?')[0].split('#')[0])) + "' id=aemail title=Email>&#128231;</a></span>      <span id=spsms><a target=_blank onmouseover=\"if (smsee.length == 0 && origsmsurl.indexOf('sms:&') != -1) { smsee=prompt('Please enter SMS number to send to.', ''); if (smsee == null) { smsee=''; } else { origsmsurl=origsmsurl.replace('sms:&','sms:' + smsee + '&'); asmsurl=asmsurl.replace('sms:&','sms:' + smsee + '&'); this.href=asmsurl; } }\" ontouchstart=\"if (smsee.length == 0 && origsmsurl.indexOf('sms:&') != -1) { smsee=prompt('Please enter SMS number to send to.', ''); if (smsee == null) { smsee=''; } else { origsmsurl=origsmsurl.replace('sms:&','sms:' + smsee + '&'); asmsurl=asmsurl.replace('sms:&','sms:' + smsee + '&'); this.href=asmsurl; } }\" href='sms:&body=" + encodeURIComponent((document.getElementById('myvenn').src + arest).replace(document.getElementById('myvenn').src.split('?')[0].split('#')[0], document.URL.split('?')[0].split('#')[0])) + "' id=asms title=SMS>&#128223;</a></span><br><br>  <input title=\"\" onclick=\"event.stopPropagation();\" id=ilp onblur=\"waitfortwo(0); lasttext=this.value.replace(/\~\~/g, '<br>'); this.title=lasttext; if (!navigator.userAgent.match(/Android|BlackBerry|iPhone|iPad|iPod|Opera Mini|IEMobile/i)) { this.value=''; } this.placeholder='Click where you want ... ' + lasttext.replace(/\<br\>/g, String.fromCharCode(10)); mvp.setAttribute('content','initial-scale=1'); document.getElementById('myvenn').scrollIntoView();\" placeholder='Enter text and later click place for it on " + decodeURIComponent(cencodename) + " to left (line feed is ~~)' type=text style=width:500px; value=''></input>" + fszbit + "<br><br>  <img id=line src='/MarkItUp/line.png' onclick=\"event.stopPropagation(); this.style.border='1px dotted red'; waitfortwo(2);\"></img>  <img id=rectangle src='/MarkItUp/rectangle.png' onclick=\"event.stopPropagation(); this.style.border='1px dotted red'; waitfortwo(4);\"></img>  <img id=orectangle src='/MarkItUp/orectangle.png' onclick=\"event.stopPropagation(); this.style.border='1px dotted red'; waitfortwo(-4);\"></img>  <img id=circle src='/MarkItUp/circlefill.png' onclick=\"event.stopPropagation(); this.style.border='1px dotted red'; waitfortwo(6);\"></img>  <img id=ocircle src='/MarkItUp/circle.png' onclick=\"event.stopPropagation(); this.style.border='1px dotted red'; waitfortwo(-5);\"></img>  <button id=orerect onclick=\"event.stopPropagation(); this.style.border='1px dotted red'; waitfortwo(8);\" title=\"Zoom in on rectangle you define via two clicks\" style=display:none;>&#128270;</button>" + lastbit + atend;
//alert(1);
if (!navigator.userAgent.match(/Android|BlackBerry|iPhone|iPad|iPod|Opera Mini|IEMobile/i)) { document.getElementById('ilp').focus(); }
document.getElementById('ilp').placeholder='Enter text and later click place for it on ' + decodeURIComponent(cencodename) + ' to left (line feed is ~~)';
} else if (curmode == 2) {
document.getElementById('line').style.border='1px dashed yellow';
} else if (curmode == -4) {
document.getElementById('orectangle').style.border='1px dashed yellow';
} else if (curmode == 4) {
document.getElementById('rectangle').style.border='1px dashed yellow';
} else if (curmode == -5) {
document.getElementById('ocircle').style.border='1px dashed yellow';
} else if (curmode == 6) {
document.getElementById('circle').style.border='1px dashed yellow';
} else if (curmode == 8) {
document.getElementById('orerect').style.border='1px dashed yellow';
}
}

… to team up with WordPress blog 404.php changes …

<?php

if (strlen($zeroesbit) == 6) { // filled in circle
if (sizeof($csv) == 3) {
array_push($csv, $csv[2]);
} else if (sizeof($csv) >= 4) {
$dist=(2.0 * sqrt(($csv[0] - $csv[2]) * ($csv[0] - $csv[2]) + ($csv[1] - $csv[3]) * ($csv[1] - $csv[3])));
$csv[2]=$dist;
$csv[3]=$dist;
}
imagefilledellipse($im, $csv[0], $csv[1], $csv[2], $csv[3], $blackish);
} else if (strlen($zeroesbit) == 5) { // circle
if (sizeof($csv) == 3) {
array_push($csv, $csv[2]);
} else if (sizeof($csv) >= 4) {
$dist=(2.0 * sqrt(($csv[0] - $csv[2]) * ($csv[0] - $csv[2]) + ($csv[1] - $csv[3]) * ($csv[1] - $csv[3])));
$csv[2]=$dist;
$csv[3]=$dist;
}
imageellipse($im, $csv[0], $csv[1], $csv[2], $csv[3], $black);
}

?>

… with our changed ninth draft image_venn.html Google Chart Image Chart Venn Chart or Scatter Chart or GraphViz Chart or Pie Chart or Line Chart or Bar Chart or Candlestick Chart or Map Chart interfacing web application you can also try below.


Previous relevant Google Chart Image Chart Broadcast Talk Context Tutorial is shown below.

Google Chart Image Chart Broadcast Talk Context Tutorial

Google Chart Image Chart Broadcast Talk Context Tutorial

The progress, today, along the same lines as yesterday’s Google Chart Image Chart Broadcast Talk Tutorial‘s introduction of a “Broadcast Talk” functionality, was to …

  • improve “Broadcast Talk” context, by adding onto yesterday’s …

    presented as an update image still presented and updated periodically

    … only display option, with, as of today …

  • a presenter’s first snapshotted image retained for user display (in case they arrive late to the lesson … tutt tutt) … and …
  • ImageMagick created animated GIF with slides for just this first image and the most recent image, updated periodically, in bottom right cell of user display …
    <?php

    if (isset($_POST['canvcont']) && isset($_POST['uniquifier']) && strpos(('?' . $_SERVER['QUERY_STRING']), 'cht=') === false) {
    if (isset($_POST['uniquifier'])) {
    $uniquifier=str_replace('+',' ',urldecode($_POST['uniquifier']));
    }
    if ($uniquifier == '') {
    $uniquifier='_' . rand(0,78654356);
    file_put_contents($_SERVER['DOCUMENT_ROOT'] . DIRECTORY_SEPARATOR . "presentation" . $uniquifier . ".png", base64_decode( explode('base64,', str_replace(' ','+',urldecode($_POST['canvcont'])))[1]));
    exec("/usr/local/cpanel/3rdparty/bin/convert -delay 20 -loop 0 " . $_SERVER['DOCUMENT_ROOT'] . DIRECTORY_SEPARATOR . "presentation" . $uniquifier . ".png" . " " . $_SERVER['DOCUMENT_ROOT'] . DIRECTORY_SEPARATOR . "presentation" . $uniquifier . ".gif");
    echo "<html><body onload=\"if (parent.document.getElementById('uniquifier')) { if (parent.document.getElementById('uniquifier').value == '') { parent.document.getElementById('uniquifier').value='" . $uniquifier . "'; } }\"></body></html>";
    } else {
    file_put_contents($_SERVER['DOCUMENT_ROOT'] . DIRECTORY_SEPARATOR . "presentation" . $uniquifier . ".png", base64_decode( explode('base64,', str_replace(' ','+',urldecode($_POST['canvcont'])))[1]));
    exec("rm -f " . $_SERVER['DOCUMENT_ROOT'] . DIRECTORY_SEPARATOR . "presentation" . $uniquifier . ".gif ; /usr/local/cpanel/3rdparty/bin/convert -delay 200 -loop 0 " . $_SERVER['DOCUMENT_ROOT'] . DIRECTORY_SEPARATOR . "presentation_" . $uniquifier . ".png " . $_SERVER['DOCUMENT_ROOT'] . DIRECTORY_SEPARATOR . "presentation" . $uniquifier . ".png" . " " . $_SERVER['DOCUMENT_ROOT'] . DIRECTORY_SEPARATOR . "presentation" . $uniquifier . ".gif");
    }
    exit;
    }

    ?>
    … and …
  • images saved as changes are detected gathered, as ever smaller thumbnails, in the top right of four table cells of the user display …

    var iijk=0, uniquif=''; snapshots=[], elem=null, elemcontext=null, oimg=null, checkforsquare=2;

    function canvinit() {
    var kkii=0, wpx=0, hpx=0;
    var tdr=document.getElementById('tdtr').getBoundingClientRect();
    wpx=eval('' + tdr.width);
    hpx=eval('' + tdr.height);
    elem=document.getElementById('agcanvas');
    elemcontext=elem.getContext('2d');
    elem.width=elem.width;
    elemcontext.drawImage(document.getElementById('talkimg'),0,0);
    if (iijk == 0 || ('' + document.getElementById('tdtr').style.backgroundImage).indexOf('rand=0') != -1) {
    //alert('89 ' + elem.toDataURL().length);
    //snapshots.push(elem.toDataURL());
    iijk=eval(-1 + eval('' + ('' + document.getElementById('tdtr').style.backgroundImage).split('),').length));
    document.getElementById('tdtr').style.backgroundImage=('' + document.getElementById('tdtr').style.backgroundImage).replace(('' + document.getElementById('tdtr').style.backgroundImage).split('),')[iijk], '' + 'url(' + elem.toDataURL() + '),' + ('' + document.getElementById('tdtr').style.backgroundImage).split('),')[iijk]).replace('rand=0', 'rand=x');
    iijk=eval(0 + eval('' + ('' + document.getElementById('tdtr').style.backgroundImage).split('),').length));
    setInterval(canvinit, 9000);
    } else {
    elem.width=elem.width;
    elemcontext.drawImage(document.getElementById('talkimg'),0,0);
    if (document.body.innerHTML.indexOf(elem.toDataURL()) == -1) {
    //snapshots.push(elem.toDataURL());
    iijk=eval(-1 + eval('' + ('' + document.getElementById('tdtr').style.backgroundImage).split('),').length));
    document.getElementById('tdtr').style.backgroundImage=('' + document.getElementById('tdtr').style.backgroundImage).replace(('' + document.getElementById('tdtr').style.backgroundImage).split('),')[iijk], '' + 'url(' + elem.toDataURL() + '),' + ('' + document.getElementById('tdtr').style.backgroundImage).split('),')[iijk]).replace('rand=x','rand=x' + Math.floor(Math.random() * 9));
    iijk=eval(0 + eval('' + ('' + document.getElementById('tdtr').style.backgroundImage).split('),').length));
    }
    }
    var bpx='background-position:;';
    var bbpx='background-position:;';
    var bsx='background-size:;';
    var brx='background-repeat:;';
    var xstart=0;
    var ystart=0;
    var xxstart=eval('' + tdr.left);
    var yystart=eval('' + tdr.top);
    if (iijk > eval(checkforsquare * checkforsquare)) { checkforsquare++; }
    for (kkii=1; kkii<=iijk; kkii++) {
    if (bsx.indexOf(':;') != -1) {
    bsx=bsx.replace(':;', ':' + Math.round(eval(wpx / checkforsquare)) + 'px ' + Math.round(eval(hpx /checkforsquare)) + 'px;');
    brx=brx.replace(':;', ':no-repeat;');
    bpx=bpx.replace(':;', ':' + Math.round(xstart) + 'px ' + Math.round(ystart) + 'px;');
    bbpx=bbpx.replace(':;', ':' + Math.round(xxstart) + 'px ' + Math.round(yystart) + 'px;');
    } else {
    bsx=bsx.replace(';', ',' + Math.round(eval(wpx / checkforsquare)) + 'px ' + Math.round(eval(hpx /checkforsquare)) + 'px;');
    brx=brx.replace(';', ',no-repeat;');
    bpx=bpx.replace(';', ',' + Math.round(xstart) + 'px ' + Math.round(ystart) + 'px;');
    bbpx=bbpx.replace(';', ',' + Math.round(xxstart) + 'px ' + Math.round(yystart) + 'px;');
    }
    if (eval(kkii % checkforsquare) == 0) {
    xstart=0;
    xxstart=eval('' + tdr.left);
    ystart+=eval(hpx / checkforsquare);
    yystart+=eval(hpx / checkforsquare);
    } else {
    xstart+=eval(wpx / checkforsquare);
    xxstart+=eval(wpx / checkforsquare);
    }
    }
    //alert('iijk=' + iijk + ' ' + bbpx + ' ' + bpx + ' ' + bsx + ' ' + brx);
    document.getElementById('tdtr').style.backgroundRepeat=brx.split(':')[1];
    document.getElementById('tdtr').style.backgroundSize=bsx.split(':')[1];
    document.getElementById('tdtr').style.backgroundPosition=bpx.split(':')[1];
    //document.body.style.backgroundImage=('' + document.getElementById('tdtr').style.backgroundImage);
    //document.body.style.backgroundRepeat=brx.split(':')[1];
    //document.body.style.backgroundSize=bsx.split(':')[1];

    document.body.style.backgroundPosition=bbpx.split(':')[1];
    var kdss=bsx.split(':')[1].replace(/\;/g,'').split(',');
    var idss=bbpx.split(':')[1].replace(/\;/g,'').split(',');
    var jdss=(('' + document.getElementById('tdtr').style.backgroundImage) + ',').replace(';,',',').replace(/url\(/g,'').replace(/URL\(/g,'').replace(/\"\;/g,'').replace(/\"/g,'').split('),');
    document.getElementById('idiv').innerHTML='';
    var istuff='', laststuff='';
    for (var iop=0; iop<idss.length; iop++) {
    //while (istuff == laststuff) {
    if (('' + jdss[iop]) != 'undefined' && ('' + jdss[iop]).trim() != '') {
    if (jdss[iop].trim().indexOf('iVBOR') != -1) {
    istuff+='<img style="position:absolute;width:' + kdss[iop].split(' ')[0] + ';height:' + kdss[iop].split(' ')[1] + ';left:' + idss[iop].split(' ')[0] + ';top:' + idss[iop].split(' ')[1] + ';" src="data:image/png;base64,iVBOR' + jdss[iop].trim().split('iVBOR')[1] + '"></img>';
    } else if (jdss[iop].trim() .indexOf('//') != -1) {
    istuff+='<img style="position:absolute;width:' + kdss[iop].split(' ')[0] + ';height:' + kdss[iop].split(' ')[1] + ';left:' + idss[iop].split(' ')[0] + ';top:' + idss[iop].split(' ')[1] + ';" src="' + jdss[iop].trim() + '"></img>';
    }
    //}
    laststuff=istuff;
    }
    }
    document.getElementById('idiv').innerHTML=istuff;
    }

We hope you try new functionality in our changed eighth draft image_venn.html Google Chart Image Chart Venn Chart or Scatter Chart or GraphViz Chart or Pie Chart or Line Chart or Bar Chart or Candlestick Chart or Map Chart interfacing web application you can also try below.


Previous relevant Google Chart Image Chart Broadcast Talk Tutorial is shown below.

Google Chart Image Chart Broadcast Talk Tutorial

Google Chart Image Chart Broadcast Talk Tutorial

Onto yesterday’s Google Chart Image Chart Statistical Charts Tutorial progress we want to offer …

  • once a user has that “More Annotation” annotating happening … offer the chance to …
  • Broadcast … their work as it happens, dynamically …
  • to an emailee list audience

… and we’re calling this …

Broadcast Talk

… even though it is only visual by nature, presented as an update image still presented and updated periodically. Go figure?! We’re blaming that supper time two back. We’re not sure?!

Anyway, we hope you try out the new arrangements in our changed seventh draft image_venn.html Google Chart Image Chart Venn Chart or Scatter Chart or GraphViz Chart or Pie Chart or Line Chart or Bar Chart or Candlestick Chart or Map Chart interfacing web application you can also try below, and helped out by a WordPress blog good ol’ TwentyTen theme 404.php which now includes …

<?php

if (isset($_POST['canvcont']) && isset($_POST['uniquifier']) && strpos(('?' . $_SERVER['QUERY_STRING']), 'cht=') === false) {
if (isset($_POST['uniquifier'])) {
$uniquifier=str_replace('+',' ',urldecode($_POST['uniquifier']));
}
if ($uniquifier == '') {
$uniquifier='_' . rand(0,78654356);
file_put_contents($_SERVER['DOCUMENT_ROOT'] . DIRECTORY_SEPARATOR . "presentation" . $uniquifier . ".png", base64_decode( explode('base64,', str_replace(' ','+',urldecode($_POST['canvcont'])))[1]));
echo "<html><body onload=\"if (parent.document.getElementById('uniquifier')) { if (parent.document.getElementById('uniquifier').value == '') { parent.document.getElementById('uniquifier').value='" . $uniquifier . "'; } }\"></body></html>";
} else {
file_put_contents($_SERVER['DOCUMENT_ROOT'] . DIRECTORY_SEPARATOR . "presentation" . $uniquifier . ".png", base64_decode( explode('base64,', str_replace(' ','+',urldecode($_POST['canvcont'])))[1]));
}
exit;
}

?>

… featuring our first use of this 404.php in response to a method=POST form call. Verrrrrryyyy interesting!


Previous relevant Google Chart Image Chart Statistical Charts Tutorial is shown below.

Google Chart Image Chart Statistical Charts Tutorial

Google Chart Image Chart Statistical Charts Tutorial

Further to yesterday’s Google Chart Image Chart Pie Chart Tutorial, today, we embark on our first ventures into composite charts, along what we like to think of as “statistical lines”, regarding interfacing to Google Charts Image Chart

… the latter being like a “parasite” display idea off the more conventional Statistical Graph favourites, the Line Chart and Bar Chart, where you have a relationship between a numerical concept (eg. sales) and another type of concept (eg. month of the year), and you want to present the data in a graphical form.

Again, we haven’t stopped our “retweaking”. We might “retweak” in the morning or we might “retweak” over a coffee break or we might “retweak” at supper time, but the end result is, well, you’re reading it now!


var pretherest='';
var newtherest='';
var tmod='';
var cht=location.search.split('cht=')[1] ? decodeURIComponent(location.search.split('cht=')[1].split('&')[0]) : "v";
if ((cht + ' ').substring(0,1) == 'p' && cht != 'p') { pretherest=cht.substring(1); }
if ((cht + ' ').substring(0,2) == 'bv' && cht != 'bv') { pretherest=cht.substring(2); if (1 == 1) { cht='bv'; } }
if ((cht + ' ').substring(0,1) == 'l' && cht != 'l') { pretherest=cht.substring(1); if (1 == 1) { cht='l'; } }
var ctype=location.search.split('type=')[1] ? decodeURIComponent(location.search.split('type=')[1].split('&')[0]) : cht;
var cname=(ctype == 'v' ? 'Venn Chart' : (ctype == 's' ? 'Scatter Chart' : (ctype == 'gv' ? 'GraphViz Chart' :
(ctype.substring(0,1) == 'p' ? 'Pie Chart' :
((ctype + ' ').substring(0,2) == 'bv' ? 'Bar Chart' : (ctype.substring(0,1) == 'l' ? 'Line Chart' : ''))))));
var cencodename=(ctype == 'v' ? 'Venn%20Diagram' : (ctype == 's' ? 'Scatter%20Chart' : (ctype == 'gv' ? 'GraphViz%20Chart' :
(ctype.substring(0,1) == 'p' ? 'Pie%20Chart' :
((ctype + ' ').substring(0,2) == 'bv' ? 'Bar%20Chart' : (ctype.substring(0,1) == 'l' ? 'Line%20Chart' : ''))))));
var chdt=(ctype == 'v' ? '&chd=t:' : (ctype == 's' ? '&chd=t:' : (ctype == 'gv' ? '&chl=' :
(ctype.substring(0,1) == 'p' ? pretherest + '&chd=t:' :
((ctype + ' ').substring(0,2) == 'bv' ? '&chd=t:' : (ctype.substring(0,1) == 'l' ? '&chd=t:' : ''))))));
var chdeq=(ctype == 'v' ? '&chd=' : (ctype == 's' ? '&chd=' : (ctype == 'gv' ? '&chl=' :
(ctype.substring(0,1) == 'p' ? '&chd=' :
((ctype + ' ').substring(0,2) == 'bv' ? '&chd=' : (ctype.substring(0,1) == 'l' ? '&chd=' : ''))))));
var tc=(ctype == 'v' ? 't:' : (ctype == 's' ? 't:' : (ctype == 'gv' ? '' :
(ctype.substring(0,1) == 'p' ? 't:' :
((ctype + ' ').substring(0,2) == 'bv' ? 't:' : (ctype.substring(0,1) == 'l' ? 't:' : ''))))));
var chdl=(ctype == 'v' ? '&chdl=' : (ctype == 's' ? '&chdl=' : (ctype == 'gv' ? '' :
(ctype.substring(0,1) == 'p' ? '&chdl=' :
((ctype + ' ').substring(0,2) == 'bv' ? '&chbh=' : (ctype.substring(0,1) == 'l' ? '&chbh=' : ''))))));

var prenchtt=(ctype == 'v' ? '100,80,60,30,30,30,10' : (ctype == 's' ? '12,87,75,41,23,96,68,71,34,9|98,60,27,34,56,79,58,74,18,76|84,23,69,81,47,94,60,93,64,54' : (ctype == 'gv' ? 'graph{C_0--H_0[type=s];C_0--H_1[type=s];C_0--H_2[type=s];C_0--C_1[type=s];C_1--H_3[type=s];C_1--H_4[type=s];C_1--H_5[type=s]}' :
(ctype.substring(0,1) == 'p' ? '1,2,3,4' :
((ctype + ' ').substring(0,2) == 'bv' ? '5,5,5|10,10,10|15,15,15' : (ctype.substring(0,1) == 'l' ? '5,45,5|10,60,10|15,85,15' : ''))))));
var preachtt=(ctype == 'v' ? 'A|B|C' : (ctype == 's' ? 'Cats|Dogs' : (ctype == 'gv' ? '' :
(ctype.substring(0,1) == 'p' ? 'January|February|March|April' :
((ctype + ' ').substring(0,2) == 'bv' ? '15,4,15' : (ctype.substring(0,1) == 'l' ? '15,4,15' : ''))))));
var defchco=(ctype == 'v' ? 'ff0000,00ff00,0000ff' : (ctype == 's' ? 'FF0000|0000FF&chxt=x,y' : (ctype == 'gv' ? '' :
(ctype.substring(0,1) == 'p' ? 'ff0000,00ff00,0000ff,ff00ff' :
((ctype + ' ').substring(0,2) == 'bv' ? '4D89F9,C6D9FD,C6FDD9&chxt=x,y' : (ctype.substring(0,1) == 'l' ? '3D89F9.B6D9FD,B6FDD9&chxt=x,y' : ''))))));

var prechtt=(ctype == 'v' ? chdt + prenchtt + chdl + preachtt : (ctype == 's' ? chdt + prenchtt + chdl + preachtt + '&chxt=x,y' : (ctype == 'gv' ? chdt + prenchtt :
(ctype.substring(0,1) == 'p' ? chdt + prenchtt + chdl + preachtt :
((ctype + ' ').substring(0,2) == 'bv' ? chdt + prenchtt + chdl + preachtt : (ctype.substring(0,1) == 'l' ? chdt + prenchtt + chdl + preachtt : ''))))));
var promptone=(ctype == 'v' ? "Enter delimited values string for Venn Diagram such that ... " + String.fromCharCode(10) + "The first three values specify the sizes of three circles: A, B, & C. For chart with only two circles, specify zero for the third value." + String.fromCharCode(10) + "The fourth value specifies the size of the intersection of A and B." + String.fromCharCode(10) + "The fifth value specifies the size of the intersection of A and C. For a chart with only two circles, do not specify a value here." + String.fromCharCode(10) + "The sixth value specifies the size of the intersection of B and C. For a chart with only two circles, do not specify a value here." + String.fromCharCode(10) + "The seventh value specifies the size of the common intersection of A, B, and C. For a chart with only two circles, do not specify a value here." + String.fromCharCode(10) + String.fromCharCode(10) + "" : (ctype == 's' ? "Enter delimited values string for Scatter Chart" : (ctype == 'gv' ? "Enter delimited values string for GraphViz Chart" :
(ctype.substring(0,1) == 'p' ? "Enter delimited values string for Pie Chart" :
((ctype + ' ').substring(0,2) == 'bv' ? "Enter g for Group or s for Stacked or o for Overlapped Bar Chart look then a space and then enter delimited values string for Bar Chart. Here is a Candlestick and Bar Chart idea eg. g 1:20,10,15,25,17,30|0,5,10,7,12,6|35,25,45,47,24,46|15,40,30,27,39,54|70,55,63,59,80,6 Prefix just the delimited string you enter by 1: to additionally display Candlestick Charts or by 0: to only display Candlestick Chart" :
(ctype.substring(0,1) == 'l' ? "Enter c for Even or s for Sparklines or xy for Just XY Line Chart look then a space and then enter delimited values string for Line Chart. Here is a Candlestick and Line Chart idea eg. c 1:20,10,15,25,17,30|0,5,10,7,12,6|35,25,45,47,24,46|15,40,30,27,39,54|70,55,63,59,80,6 Prefix just the delimited string you enter by 1: to additionally display Candlestick Charts or by 0: to only display Candlestick Chart" : ""))))));
var oneprompt=(ctype == 'v' ? "Enter delimited values string for your Venn Diagram collaborations, optionally, such that ... " + String.fromCharCode(10) + "The first three values specify the sizes of three circles: A, B, & C. For chart with only two circles, specify zero for the third value." + String.fromCharCode(10) + "The fourth value specifies the size of the intersection of A and B." + String.fromCharCode(10) + "The fifth value specifies the size of the intersection of A and C. For a chart with only two circles, do not specify a value here." + String.fromCharCode(10) + "The sixth value specifies the size of the intersection of B and C. For a chart with only two circles, do not specify a value here." + String.fromCharCode(10) + "The seventh value specifies the size of the common intersection of A, B, and C. For a chart with only two circles, do not specify a value here." + String.fromCharCode(10) + String.fromCharCode(10) + "" : (ctype == 's' ? "Enter delimited values string for Scatter Chart" : (ctype == 'gv' ? "Enter delimited values string for GraphViz Chart" :
(ctype.substring(0,1) == 'p' ? "Enter delimited values string for Pie Chart" :
((ctype + ' ').substring(0,2) == 'bv' ? "Enter g for Grouped or s for Stacked or o for Overlapped Bar Chart look then a space and then enter delimited values string for Bar Chart. Here is a Candlestick and Bar Chart idea eg. g 1:20,10,15,25,17,30|0,5,10,7,12,6|35,25,45,47,24,46|15,40,30,27,39,54|70,55,63,59,80,6 Prefix just the delimited string you enter by 1: to additionally display Candlestick Charts or by 0: to only display Candlestick Chart" :
(ctype.substring(0,1) == 'l' ? "Enter c for Even or s for Sparklines or xy for Just XY Line Chart look then a space and then enter delimited values string for Line Chart. Here is a Candlestick and Line Chart idea eg. c 1:20,10,15,25,17,30|0,5,10,7,12,6|35,25,45,47,24,46|15,40,30,27,39,54|70,55,63,59,80,6 Prefix just the delimited string you enter by 1: to additionally display Candlestick Charts or by 0: to only display Candlestick Chart" : ""))))));
var asktwo=(ctype == 'v' ? true : (ctype == 's' ? true : (ctype == 'gv' ? false :
(ctype.substring(0,1) == 'p' ? true :
((ctype + ' ').substring(0,2) == 'bv' ? true : (ctype.substring(0,1) == 'l' ? true : false))))));
var twopb=(ce.substring(0,1) == 'p' ? 'Any optional legend or title argument snippets? Optionally prefix by 3 for 3d Pie Chart or by c for Concentric Pie Chart. Eg. 3' + chdl + preachtt + '&chtt=My%20' + cencodename + '&chco=' + defchco : 'Any optional legend or title argument snippets? Eg. ' + chdl + preachtt + '&chtt=My%20' + cencodename + '&chco=' + defchco);
var beforeanswer=(ctype.substring(0,1) == 'l' ? 'c ' : ((ctype + ' ').substring(0,2) == 'bv' ? 'g ' : ''));

if ((document.URL.toLowerCase().indexOf('chd=t%3a') == -1 && document.URL.toLowerCase().indexOf('chd=t:') == -1) && document.URL.toLowerCase().indexOf('chd=t') != -1 && document.URL.toLowerCase().indexOf('%3a') != -1) {
tmod=document.URL.toLowerCase().split('chd=t')[1].split('%3')[0];
//tc='t' + tmod + ':';
//chdt=chdt.replace('t:', 't' + tmod + ':');
//answer=answer.trim().replace(tmod + ':','');
//therest+='&chm=F,,1,1:4,20';
} else if ((document.URL.toLowerCase().indexOf('chd=t%3a') == -1 && document.URL.toLowerCase().indexOf('chd=t:') == -1) && document.URL.toLowerCase().indexOf('chd=t') != -1 && document.URL.toLowerCase().substring(8).indexOf(':') != -1) {
tmod=document.URL.toLowerCase().split('chd=t')[1].split(':')[0];
//tc='t' + tmod + ':';
//chdt=chdt.replace('t:', 't' + tmod + ':');
//answer=answer.trim().replace(tmod + ':','');
//therest+='&chm=F,,1,1:4,20';
}

var atend="<canvas id=sharecanvas style=display:none;></canvas><div style=display:none;><label for='shareurl'><input type=button onclick='downloadmaybe(); shareurl();' id='sbut' value='Share URL Link'></input>: </label><input onblur=changeu(this.value); title='Suffix by hashtag 1 is text and hashtag 2 is title' style='width:45%;' type=url value='' placeholder='https://www.rjmprogramming.com.au/ITblog/#RJM Programming Blog#IT Blog' id=shareurl ondblclick='this.value=trythis(this.placeholder);'></input><br><br><span> ... and/or ... </span><br><br><label for='files'><input type=button onclick=document.getElementById('share').click(); value='Share media or document files'></input>: </label><input id='files' type='file' accept='image/*,video/*,audio/*,application/*,text/*' multiple></div><br><br><button id='share' type='button'>Share your media or documents or link!</button><output id='output'></output><scr" + "ipt type='text/javascript' src='/web_share_api_test.js?canv" + "asshare=as_necessary9867654' defer></scr" + "ipt>";
atend='';

var vals=[], annowin=null;


var lastbit="<br><br><br><br>  <button title='Other complex canvas annotation functionalities (forgoes the simpler ones above) ...' id=annobut onclick=\"document.getElementById('tdleft').style.verticalAlign='top'; setTimeout(prerepaint, 12000); if (arest.length != 0) { alert('arest=' + arest); if (document.getElementById('myvenn').src.indexOf(arest) == -1) { pdivhide(); document.getElementById('myvenn').src=document.getElementById('myvenn').src.split(arest.substring(0,5))[0] + arest; document.getElementById('tdleft').style.verticalAlign='top'; } } annowin=window.open('/HTMLCSS/user_of_signature_signature.htm?elemode=img','_blank','top=420,left=620,width=900,height=420'); \" style=\"background-color:yellow;\">More Annotations</button>  <button id=bshare onclick=repaint(); style=display:none;>Repaint <font size=1>(but lose sharing emojis above)</font></button><br><div id=divcanvas style=display:none;><canvas id=bottomcanvas></canvas></div>";
var fszbit='  <span id=spanfsz><select id=fsz onchange="fsz=this.value;"><option value=".10">10px</option><option value=".6">6px</option><option value=".8">8px</option><option value=".9">9px</option><option value=".11">11px</option><option value=".12">12px</option><option value=".14">14px</option><option value=".16">16px</option><option value=".18">18px</option><option value=".20">20px</option><option value=".24">24px</option><option value=".30">30px</option><option value=".36">36px</option><option value=".40">40px</option><option value=".48">48px</option><option value=".50">50px</option><option value=".64">64px</option></select></span>';
var origemailurl='mailto:?subject=My%20' + cencodename + '%20...%20best%20viewed%20in%20landscape%20...&body=';
var origsmsurl='sms:&body=My%20' + cencodename + '%20...%20best%20viewed%20in%20landscape%20...';
var smsee='';
var chd=location.search.split(chdeq)[1] ? (tc + dectypodeURIComponent(location.search.split(chdeq)[1].split('&')[0])).replace('t:t:', 't:').replace(/^t\:$/g, '') : "";
var therest=location.search.split(chdeq)[1] ? (pretherest + document.URL.split(document.URL.split('#')[0].split(chdeq)[1].split('&')[0])[1].split('#')[0]) : "";
newtherest=((ctype + ' ').substring(0,2) == 'bv' ? therest : '');

And yes, you can, and we did, put line feeds into those ternery statements to help with their readability as we add complexity to the parameterization, as we go along, in our changed sixth draft image_venn.html Google Chart Image Chart Venn Chart or Scatter Chart or GraphViz Chart or Pie Chart or Line Chart or Bar Chart or Candlestick Chart interfacing web application you can also try below.


Previous relevant Google Chart Image Chart Pie Chart Tutorial is shown below.

Google Chart Image Chart Pie Chart Tutorial

Google Chart Image Chart Pie Chart Tutorial

As we intimated in yesterday’s Google Chart Image Chart GraphViz Chart Tutorial

start with an at least two part “inhouse phase” of additional “extra to text” annotation functionality possibilities …

… we would return! And so, here thou lingers. It’s “part two” day, even bigger than “Ben Hur” in certain outback towns we’re a little bit shy to divulge until we get to know our readers that little bit better.

Yes, we are dovetailing with work we’ve done in the past using the excellent …

  • canvas … element introduced with HTML5 … whereby …
  • annotations like …
    1. scribble … as the default, and various other …
    2. discrete click shapes … and …
    3. text … including emojis … and …
    4. image

    … annotating modus operandi

… can be part of the arrangements. It works that the Annotation Helper is opened …

  • in a new “known about” popup window … looking out for …
  • parent based “img” element (in the modus operandi we use, calling it, regarding the parent top left image) … so as to be able to …
  • populate its canvas element with a clone of that calling “img” graphical content … but add into the mix …
  • menu driven annotation functionality which can change that canvas look and underlying data … and …
  • the caller can keep track of this and arrange, or not, for these changes to be reflected back at its top left “img” element … the catch being …
  • the “within range of GET argument” limits are ruined by this introduction of graphical data, and so in agreeing to this, a user forgoes those simpler sharing and annotating functionalities of yesterday’s (and before) work … though your normal image sharing capabilities via the web browser remain in the caller and the called

As well, today, we are introducing new Google Charts Image Chart Pie Chart interfacing, and because this chart type can have the three …

  • Normal
  • 3D
  • Concentric

… guises, there was some work to keep us off this street (okay … so we divulgedagain)


var pretherest='';
var cht=location.search.split('cht=')[1] ? decodeURIComponent(location.search.split('cht=')[1].split('&')[0]) : "v";
if ((cht + ' ').substring(0,1) == 'p' && cht != 'p') { pretherest=cht.substring(1); }
var ctype=location.search.split('type=')[1] ? decodeURIComponent(location.search.split('type=')[1].split('&')[0]) : cht;
var cname=(ctype == 'v' ? 'Venn Chart' : (ctype == 's' ? 'Scatter Chart' : (ctype == 'gv' ? 'GraphViz Chart' : (ctype.substring(0,1) == 'p' ? 'Pie Chart' : ''))));
var cencodename=(ctype == 'v' ? 'Venn%20Diagram' : (ctype == 's' ? 'Scatter%20Chart' : (ctype == 'gv' ? 'GraphViz%20Chart' : (ctype.substring(0,1) == 'p' ? 'Pie%20Chart' : ''))));
var chdt=(ctype == 'v' ? '&chd=t:' : (ctype == 's' ? '&chd=t:' : (ctype == 'gv' ? '&chl=' : (ctype.substring(0,1) == 'p' ? pretherest + '&chd=t:' : ''))));
var chdeq=(ctype == 'v' ? '&chd=' : (ctype == 's' ? '&chd=' : (ctype == 'gv' ? '&chl=' : (ctype.substring(0,1) == 'p' ? '&chd=' : ''))));
var tc=(ctype == 'v' ? 't:' : (ctype == 's' ? 't:' : (ctype == 'gv' ? '' : (ctype.substring(0,1) == 'p' ? 't:' : ''))));
var chdl=(ctype == 'v' ? '&chdl=' : (ctype == 's' ? '&chdl=' : (ctype == 'gv' ? '' : (ctype.substring(0,1) == 'p' ? '&chdl=' : ''))));
var prenchtt=(ctype == 'v' ? '100,80,60,30,30,30,10' : (ctype == 's' ? '12,87,75,41,23,96,68,71,34,9|98,60,27,34,56,79,58,74,18,76|84,23,69,81,47,94,60,93,64,54' : (ctype == 'gv' ? 'graph{C_0--H_0[type=s];C_0--H_1[type=s];C_0--H_2[type=s];C_0--C_1[type=s];C_1--H_3[type=s];C_1--H_4[type=s];C_1--H_5[type=s]}' : (ctype.substring(0,1) == 'p' ? '1,2,3,4' : ''))));
var preachtt=(ctype == 'v' ? 'A|B|C' : (ctype == 's' ? 'Cats|Dogs' : (ctype == 'gv' ? '' : (ctype.substring(0,1) == 'p' ? 'January|February|March|April' : ''))));
var prechtt=(ctype == 'v' ? chdt + prenchtt + chdl + preachtt : (ctype == 's' ? chdt + prenchtt + chdl + preachtt + '&chxt=x,y' : (ctype == 'gv' ? chdt + prenchtt : (ctype.substring(0,1) == 'p' ? chdt + prenchtt + chdl + preachtt : ''))));
var defchco=(ctype == 'v' ? 'ff0000,00ff00,0000ff' : (ctype == 's' ? 'FF0000|0000FF&chxt=x,y' : (ctype == 'gv' ? '' : (ctype.substring(0,1) == 'p' ? 'ff0000,00ff00,0000ff,ff00ff' : ''))));
var promptone=(ctype == 'v' ? "Enter delimited values string for Venn Diagram such that ... " + String.fromCharCode(10) + "The first three values specify the sizes of three circles: A, B, & C. For chart with only two circles, specify zero for the third value." + String.fromCharCode(10) + "The fourth value specifies the size of the intersection of A and B." + String.fromCharCode(10) + "The fifth value specifies the size of the intersection of A and C. For a chart with only two circles, do not specify a value here." + String.fromCharCode(10) + "The sixth value specifies the size of the intersection of B and C. For a chart with only two circles, do not specify a value here." + String.fromCharCode(10) + "The seventh value specifies the size of the common intersection of A, B, and C. For a chart with only two circles, do not specify a value here." + String.fromCharCode(10) + String.fromCharCode(10) + "" : (ctype == 's' ? "Enter delimited values string for Scatter Chart" : (ctype == 'gv' ? "Enter delimited values string for GraphViz Chart" : (ctype.substring(0,1) == 'p' ? "Enter delimited values string for Pie Chart" : ""))));
var oneprompt=(ctype == 'v' ? "Enter delimited values string for your Venn Diagram collaborations, optionally, such that ... " + String.fromCharCode(10) + "The first three values specify the sizes of three circles: A, B, & C. For chart with only two circles, specify zero for the third value." + String.fromCharCode(10) + "The fourth value specifies the size of the intersection of A and B." + String.fromCharCode(10) + "The fifth value specifies the size of the intersection of A and C. For a chart with only two circles, do not specify a value here." + String.fromCharCode(10) + "The sixth value specifies the size of the intersection of B and C. For a chart with only two circles, do not specify a value here." + String.fromCharCode(10) + "The seventh value specifies the size of the common intersection of A, B, and C. For a chart with only two circles, do not specify a value here." + String.fromCharCode(10) + String.fromCharCode(10) + "" : (ctype == 's' ? "Enter delimited values string for Scatter Chart" : (ctype == 'gv' ? "Enter delimited values string for GraphViz Chart" : (ctype.substring(0,1) == 'p' ? "Enter delimited values string for Pie Chart" : ""))));
var asktwo=(ctype == 'v' ? true : (ctype == 's' ? true : (ctype == 'gv' ? false : (ctype.substring(0,1) == 'p' ? true : false))));
var twopb=(ctype.substring(0,1) == 'p' ? 'Any optional legend or title argument snippets? Optionally prefix by 3 for 3d Pie Chart or by c for Concentric Pie Chart. Eg. 3' + chdl + preachtt + '&chtt=My%20' + cencodename + '&chco=' + defchco : 'Any optional legend or title argument snippets? Eg. ' + chdl + preachtt + '&chtt=My%20' + cencodename + '&chco=' + defchco);

var atend="<canvas id=sharecanvas style=display:none;></canvas><div style=display:none;><label for='shareurl'><input type=button onclick='downloadmaybe(); shareurl();' id='sbut' value='Share URL Link'></input>: </label><input onblur=changeu(this.value); title='Suffix by hashtag 1 is text and hashtag 2 is title' style='width:45%;' type=url value='' placeholder='https://www.rjmprogramming.com.au/ITblog/#RJM Programming Blog#IT Blog' id=shareurl ondblclick='this.value=trythis(this.placeholder);'></input><br><br><span> ... and/or ... </span><br><br><label for='files'><input type=button onclick=document.getElementById('share').click(); value='Share media or document files'></input>: </label><input id='files' type='file' accept='image/*,video/*,audio/*,application/*,text/*' multiple></div><br><br><button id='share' type='button'>Share your media or documents or link!</button><output id='output'></output><scr" + "ipt type='text/javascript' src='/web_share_api_test.js?canv" + "asshare=as_necessary9867654' defer></scr" + "ipt>";
atend='';

var vals=[], annowin=null;
var lastbit="<br><br><br><br>  <button title='Other complex canvas annotation functionalities (forgoes the simpler ones above) ...' id=annobut onclick=\"document.getElementById('tdleft').style.verticalAlign='top'; setTimeout(prerepaint, 12000); if (arest.length != 0) { if (document.getElementById('myvenn').src.indexOf(arest) == -1) { pdivhide(); document.getElementById('myvenn').src=document.getElementById('myvenn').src.split(arest.substring(0,5))[0] + arest; document.getElementById('tdleft').style.verticalAlign='top'; } } annowin=window.open('/HTMLCSS/user_of_signature_signature.htm?elemode=img','_blank','top=420,left=620,width=900,height=420'); \" style=\"background-color:yellow;\">More Annotations</button>  <button id=bshare onclick=repaint(); style=display:none;>Repaint <font size=1>(but lose sharing emojis above)</font></button><br><div id=divcanvas style=display:none;><canvas id=bottomcanvas></canvas></div>";
var fszbit='  <span id=spanfsz><select id=fsz onchange="fsz=this.value;"><option value=".10">10px</option><option value=".6">6px</option><option value=".8">8px</option><option value=".9">9px</option><option value=".11">11px</option><option value=".12">12px</option><option value=".14">14px</option><option value=".16">16px</option><option value=".18">18px</option><option value=".20">20px</option><option value=".24">24px</option><option value=".30">30px</option><option value=".36">36px</option><option value=".40">40px</option><option value=".48">48px</option><option value=".50">50px</option><option value=".64">64px</option></select></span>';
var origemailurl='mailto:?subject=My%20' + cencodename + '%20...%20best%20viewed%20in%20landscape%20...&body=';
var origsmsurl='sms:&body=My%20' + cencodename + '%20...%20best%20viewed%20in%20landscape%20...';
var smsee='';
var chd=location.search.split(chdeq)[1] ? (tc + decodeURIComponent(location.search.split(chdeq)[1].split('&')[0])).replace('t:t:', 't:').replace(/^t\:$/g, '') : "";
var therest=location.search.split(chdeq)[1] ? (pretherest + document.URL.split(document.URL.split('#')[0].split(chdeq)[1].split('&')[0])[1].split('#')[0]) : "";

Please acquaint yourself with these new annotating features in our changed fifth draft image_venn.html Google Chart Image Chart Venn Chart or Scatter Chart or GraphViz Chart or Pie Chart interfacing web application you can also try below.


Previous relevant Google Chart Image Chart GraphViz Chart Tutorial is shown below.

Google Chart Image Chart GraphViz Chart Tutorial

Google Chart Image Chart GraphViz Chart Tutorial

Today we have two strands of forward progress, onto the progress up to yesterday’s Google Chart Image Chart Scatter Chart Tutorial, they being …

  • establish a new interfacing to GraphViz Chart

    GraphViz is a package of open source tools for visualizing connectivity graphs. You can create GraphViz graphs using the DOT language and your choice of layout engines.

    … a chart looking a bit like Organization Charts

    Org charts are diagrams of a hierarchy of nodes, commonly used to portray superior/subordinate relationships in an organization. A family tree is a type of org chart.


  • start with an at least two part “inhouse phase” of additional “extra to text” annotation functionality possibilities … just starting with …
    1. line
    2. open rectangle
    3. filled rectangle

… additional functionality, that we may well add to, but being as we feel a change we’ll leave that for another time.

The WordPress blog “404.php” code snippet becomes …

<?php

if (strpos(('?' . $_SERVER['QUERY_STRING']), '?cht=') !== false || strpos(('?' . $_SERVER['QUERY_STRING']), '&cht=') !== false) {

$theqs=str_replace('??','?',('?' . $_SERVER['QUERY_STRING']));
if (strpos($theqs, '?chs=') === false && strpos($theqs, '&chs=') === false) {
$theqs='?chs=' . $newWidth . 'x' . $newHeight . '&' . explode('?', $theqs)[1];
}


if (strpos(('?' . $_SERVER['QUERY_STRING']), 'text1=') !== false) {
$theone=2;
$im = imagecreatefromstring(file_get_contents('http://chart.googleapis.com/chart' . explode('&text1=', $theqs)[0]));

if (7 == 7) {

$plotstring=str_replace('+',' ',urldecode($_GET['text1']));
$csv=explode(',', $plotstring);
$black = imagecolorallocatealpha($im, 1, 1, 1, 0);
$blackish = imagecolorallocatealpha($im, 127, 127, 127, 64);
if (sizeof($csv) >= 3) {
if (trim($csv[2]) == '') { // non text annotations

$zeroesbit='';
$izeroes=0;
$xmantissae=explode('.', ('' . $csv[0]));
if (sizeof($xmantissae) > 1) {
$csv[0]=$xmantissae[0];
while (substr($xmantissae[1],0,1) == '0') {
$zeroesbit.='0';
$xmantissae[1]=substr($xmantissae[1],1);
}
$csv[2]=$xmantissae[1];
}
$ymantissae=explode('.', ('' . $csv[1]));
if (sizeof($ymantissae) > 1) {
$csv[1]=$ymantissae[0];
if (sizeof($csv) > 3) {
$csv[3]=$ymantissae[1];
} else {
array_push($csv, $ymantissae[1]);
}
}


if (strlen($zeroesbit) == 4) { // filled in rectangle
imagefilledrectangle($im, $csv[0], $csv[1], $csv[2], $csv[3], $blackish);
} else if (strlen($zeroesbit) == 2) { // rectangle
imagerectangle($im, $csv[0], $csv[1], $csv[2], $csv[3], $black);
} else if (strlen($zeroesbit) == 1) { // line
imageline($im, $csv[0], $csv[1], $csv[2], $csv[3], $black);
}

} else { // text placement
$xis=$csv[0];
$mantissae=explode('.', ('' . $csv[0]));
if (sizeof($mantissae) > 1) {
$tenpx=$mantissae[1];
$xis=$mantissae[0];
}
try {
if (function_exists('imagettftext')) {
if (explode('' . $csv[0] . ',' . $csv[1] . ',', $plotstring)[1] !== '') {
//echo explode('' . $csv[0] . ',' . $csv[1] . ',', $plotstring)[1];
//exit;
imagettftext($im, $tenpx, 0, $xis, $csv[1], $black, realpath('arial.ttf'), explode('' . $csv[0] . ',' . $csv[1] . ',', $plotstring)[1]);
}
}
} catch (Exception $e) { }
}
while (isset($_GET['text' . $theone])) {
$plotstring=str_replace('+',' ',urldecode($_GET['text' . $theone]));
$csv=explode(',', $plotstring);
if (sizeof($csv) >= 3) {
if (trim($csv[2]) == '') { // non text annotations

$zeroesbit='';
$izeroes=0;
$xmantissae=explode('.', ('' . $csv[0]));
if (sizeof($xmantissae) > 1) {
$csv[0]=$xmantissae[0];
while (substr($xmantissae[1],0,1) == '0') {
$zeroesbit.='0';
$xmantissae[1]=substr($xmantissae[1],1);
}
$csv[2]=$xmantissae[1];
}
$ymantissae=explode('.', ('' . $csv[1]));
if (sizeof($ymantissae) > 1) {
$csv[1]=$ymantissae[0];
if (sizeof($csv) > 3) {
$csv[3]=$ymantissae[1];
} else {
array_push($csv, $ymantissae[1]);
}
}


if (strlen($zeroesbit) == 4) { // filled in rectangle
imagefilledrectangle($im, $csv[0], $csv[1], $csv[2], $csv[3], $blackish);
} else if (strlen($zeroesbit) == 2) { // rectangle
imagerectangle($im, $csv[0], $csv[1], $csv[2], $csv[3], $black);
} else if (strlen($zeroesbit) == 1) { // line
imageline($im, $csv[0], $csv[1], $csv[2], $csv[3], $black);
}

} else { // text placement
try {
$xis=$csv[0];
$mantissae=explode('.', ('' . $csv[0]));
if (sizeof($mantissae) > 1) {
$tenpx=$mantissae[1];
$xis=$mantissae[0];
}
if (function_exists('imagettftext')) {
if (explode('' . $csv[0] . ',' . $csv[1] . ',', $plotstring)[1] !== '') {
imagettftext($im, $tenpx, 0, $xis, $csv[1], $black, realpath('arial.ttf'), explode('' . $csv[0] . ',' . $csv[1] . ',', $plotstring)[1]);
}
}
} catch (Exception $e) { }
}
$theone++;
}
}
//}
}


}

header('Content-Type: image/png');

imagepng($im);
imagedestroy($im);
} else {
header('Content-Type: image/png');
echo file_get_contents('http://chart.googleapis.com/chart' . $theqs);
}
exit;

}

?>

… utilizing that good ol’ PHP GD image library.

We hope you enjoy the …

Mantissa Madness Monday

… coding feel utilized to retain yesterday’s …


&textn=x,y,Text

… argument snippet basis, adding “x” and “y” mantissa arrangement smarts with a “nothing” Text in our changed fourth draft image_venn.html Google Chart Image Chart Venn Chart or Scatter Chart or GraphViz Chart interfacing web application you can also try below.

Did you know?

Would you believe, at least to us, it is far less obvious how to display a straight line (that is perhaps not horizontal nor vertical) within a webpage, than it is to display a rectangle, filled or not?! Talk about irony! Over time, we have developed …

  • HTML hr elements (with a rotation) … and the less kludgy …
  • HTML div (defining a box with defined dimensions) for a nested SVG element containing the line definition using percentage dimensions

… in the past, for when we needed to do this. But, today, we’d like to thank this great webpage for its suggestion to involve linear gradients …


<style>

.crossedtotl {
background:
linear-gradient(to top left,
rgba(0,0,0,0) 0%,
rgba(0,0,0,0) calc(50% - 0.8px),
rgba(0,0,0,1) 50%,
rgba(0,0,0,0) calc(50% + 0.8px),
rgba(0,0,0,0) 100%);
}
.crossedtotr {
background:
linear-gradient(to top right,
rgba(0,0,0,0) 0%,
rgba(0,0,0,0) calc(50% - 0.8px),
rgba(0,0,0,1) 50%,
rgba(0,0,0,0) calc(50% + 0.8px),
rgba(0,0,0,0) 100%);
}
</style>

… in a, basically, CSS solution. Great stuff, thanks!


Previous relevant Google Chart Image Chart Scatter Chart Tutorial is shown below.

Google Chart Image Chart Scatter Chart Tutorial

Google Chart Image Chart Scatter Chart Tutorial

Today, we bring the Google Charts Image Chart

… making distributing “Venn Chart” hardcodings into a dropdown selectable arrangement, because there are more commonalities than differences, really, and we do like to parameterize … even in the shower, with a fairly loud rendition of this, perhaps.

Here is our framework for parameterization, here, and into the future


<title>Interfacing to Google Charts Image Chart Venn Chart or Scatter Chart - RJM Programming - November, 2023</title>
<script type=text/javascript>
var cht=location.search.split('cht=')[1] ? decodeURIComponent(location.search.split('cht=')[1].split('&')[0]) : "v";
var ctype=location.search.split('type=')[1] ? decodeURIComponent(location.search.split('type=')[1].split('&')[0]) : cht;
var cname=(ctype == 'v' ? 'Venn Chart' : (ctype == 's' ? 'Scatter Chart' : ''));
var cencodename=(ctype == 'v' ? 'Venn%20Diagram' : (ctype == 's' ? 'Scatter%20Chart' : ''));
var prenchtt=(ctype == 'v' ? '100,80,60,30,30,30,10' : (ctype == 's' ? '12,87,75,41,23,96,68,71,34,9|98,60,27,34,56,79,58,74,18,76|84,23,69,81,47,94,60,93,64,54' : ''));
var preachtt=(ctype == 'v' ? 'A|B|C' : (ctype == 's' ? 'Cats|Dogs' : ''));
var prechtt=(ctype == 'v' ? '&chd=t:' + prenchtt + '&chdl=' + preachtt : (ctype == 's' ? '&chd=t:' + prenchtt + '&chdl=' + preachtt + '&chxt=x,y' : ''));
var defchco=(ctype == 'v' ? 'ff0000,00ff00,0000ff' : (ctype == 's' ? 'FF0000|0000FF&chxt=x,y' : ''));
var promptone=(ctype == 'v' ? "Enter delimited values string for Venn Diagram such that ... " + String.fromCharCode(10) + "The first three values specify the sizes of three circles: A, B, & C. For chart with only two circles, specify zero for the third value." + String.fromCharCode(10) + "The fourth value specifies the size of the intersection of A and B." + String.fromCharCode(10) + "The fifth value specifies the size of the intersection of A and C. For a chart with only two circles, do not specify a value here." + String.fromCharCode(10) + "The sixth value specifies the size of the intersection of B and C. For a chart with only two circles, do not specify a value here." + String.fromCharCode(10) + "The seventh value specifies the size of the common intersection of A, B, and C. For a chart with only two circles, do not specify a value here." + String.fromCharCode(10) + String.fromCharCode(10) + "" : (ctype == 's' ? "Enter delimited values string for Scatter Chart" : ""));
var oneprompt=(ctype == 'v' ? "Enter delimited values string for your Venn Diagram collaborations, optionally, such that ... " + String.fromCharCode(10) + "The first three values specify the sizes of three circles: A, B, & C. For chart with only two circles, specify zero for the third value." + String.fromCharCode(10) + "The fourth value specifies the size of the intersection of A and B." + String.fromCharCode(10) + "The fifth value specifies the size of the intersection of A and C. For a chart with only two circles, do not specify a value here." + String.fromCharCode(10) + "The sixth value specifies the size of the intersection of B and C. For a chart with only two circles, do not specify a value here." + String.fromCharCode(10) + "The seventh value specifies the size of the common intersection of A, B, and C. For a chart with only two circles, do not specify a value here." + String.fromCharCode(10) + String.fromCharCode(10) + "" : (ctype == 's' ? "Enter delimited values string for Scatter Chart" : ""));

// etcetera etcetera etcetera

… but, as you can imagine, there will probably be small retweaks of this arrangement, which is holding out okay so far for Scatter Charts in our changed third draft image_venn.html Google Chart Image Chart Venn Chart or Scatter Chart interfacing web application you can also try below.

Did you know?

In this online world with so many platforms and devices and software choices, there is no need to ever be embarrassed by what might seem an obvious feature you’ve missed.

Take the way on macOS, but not iOS, using a web browser to get to YouTube, you can flag that a video should loop. Especially good for …

  • song obsessions …
  • earworms you need to salve

… and what about if your shower is taking an awfully long time?! Please be careful with moisture and devices, though, in the bathroom!

How does it happen? Right click the play button, and looping is there as the top option. Now back to that shower song obsession.


Previous relevant Google Chart Image Chart Venn Chart User Text Tutorial is shown below.

Google Chart Image Chart Venn Chart User Text Tutorial

Google Chart Image Chart Venn Chart User Text Tutorial

We think a way to improve on our interfacing web application start regarding yesterday’s Google Chart Image Chart Venn Chart Interfacing Primer Tutorial would be to offer the user the chance to enter their own text onto the Venn Diagrams …

But we would say that.

… given what we learnt in Primary school … or should we say …

“Gryffindor Slytherin Ravenclaw Hufflepuff Junior Business College”

… and, yes, is that you, Aoife? What did you want to point out? After you swallow those Rice Bubbles, that is?! Class is waiting …

.
.
.
.
.
.
.
.
.
.
.
.
.
.
.
.
.
.
.
.
.
.
.
.
.

Yes … miss something … and …

.
.
.
.
.
.
.
.
.
.
.
.
.
.
.
.
.
.
.
.
.
.
.
.
.

Use your words … okay … missing … don’t worry, the bus will wait … no … there’s no need to point … oh! …

… do you mean …

missing ewe … no … missing you … oh! … missing u … oh! … “Gryffindor Slytherin Ravenclaw Hufflepuff Juniour Business College” … quite so, Aiofe … 3 points for Hufflepuff!

Anyway we needed a fleshed out “function ask” to cater for potential onclick event logic catering for co-ordinates


function ask(evt) {
var answer='', answertherest='';
if (lasttext != '' && evt && normalcall) {
document.getElementById('ilp').placeholder='Enter text and later click place for it on Venn Diagram to left (line feed is ~~)';

elemLeft = document.getElementById('myvenn').offsetLeft;
elemTop = document.getElementById('myvenn').offsetTop;

if (evt.touches) {
if (evt.touches[0].pageX) {
x = evt.touches[0].pageX + document.body.scrollLeft - elemLeft;
y = evt.touches[0].pageY + document.body.scrollTop - elemTop;
} else {
x = evt.touches[0].clientX + document.body.scrollLeft - elemLeft;
y = evt.touches[0].clientY + document.body.scrollTop - elemTop;
}
} else if (evt.clientX || ev.clientY) {
x = evt.clientX + document.body.scrollLeft - elemLeft;
y = evt.clientY + document.body.scrollTop - elemTop;
} else {
x = evt.pageX + document.body.scrollLeft - elemLeft;
y = evt.pageY + document.body.scrollTop - elemTop;
}


document.getElementById('dtext').innerHTML+='<p style="position:absolute;font-size:10px;font-family:Arial;left:' + x + 'px;top:' + y + 'px;z-index:98;">' + lasttext + '</p>';

document.getElementById('aemail').href+='&text' + textnum + '=' + encodeURIComponent('' + x + ',' + y + ',') + encodeURIComponent(lasttext.replace(/\<br\>/g, String.fromCharCode(10)));
document.getElementById('asms').href+='&text' + textnum + '=' + encodeURIComponent('' + x + ',' + y + ',') + encodeURIComponent(lasttext.replace(/\<br\>/g, String.fromCharCode(10)));
arest+='&text' + textnum + '=' + encodeURIComponent('' + x + ',' + y + ',') + encodeURIComponent(lasttext.replace(/\<br\>/g, String.fromCharCode(10)));
therest+='&text' + textnum + '=' + encodeURIComponent('' + x + ',' + y + ',') + encodeURIComponent(lasttext.replace(/\<br\>/g, String.fromCharCode(10)));
asmsurl+='&text' + textnum + '=' + encodeURIComponent('' + x + ',' + y + ',') + encodeURIComponent(lasttext.replace(/\<br\>/g, String.fromCharCode(10)));
aemailurl+='&text' + textnum + '=' + encodeURIComponent('' + x + ',' + y + ',') + encodeURIComponent(lasttext.replace(/\<br\>/g, String.fromCharCode(10)));
document.getElementById('tdright').innerHTML="  <span id=spemail><a target=_blank href='mailto:?subject=My%20Venn%20Diagram%20...%20best%20viewed%20in%20landscape%20...&body=" + encodeURIComponent((document.getElementById('myvenn').src + arest).replace((document.getElementById('myvenn').src + arest).split('?')[0].split('#')[0], document.URL.split('?')[0].split('#')[0])) + "' id=aemail title=Email>&#128231;</a></span>      <span id=spsms><a target=_blank onmouseover=\"if (smsee.length == 0 && origsmsurl.indexOf('sms:&') != -1) { smsee=prompt('Please enter SMS number to send to.', ''); if (smsee == null) { smsee=''; } else { origsmsurl=origsmsurl.replace('sms:&','sms:' + smsee + '&'); asmsurl=asmsurl.replace('sms:&','sms:' + smsee + '&'); this.href=asmsurl; } }\" ontouchstart=\"if (smsee.length == 0 && origsmsurl.indexOf('sms:&') != -1) { smsee=prompt('Please enter SMS number to send to.', ''); if (smsee == null) { smsee=''; } else { origsmsurl=origsmsurl.replace('sms:&','sms:' + smsee + '&'); asmsurl=asmsurl.replace('sms:&','sms:' + smsee + '&'); this.href=asmsurl; } }\" href='sms:&body=" + encodeURIComponent((document.getElementById('myvenn').src + arest).replace(document.getElementById('myvenn').src.split('?')[0].split('#')[0], document.URL.split('?')[0].split('#')[0])) + "' id=asms title=SMS>&#128223;</a></span><br><br>  <input id=ilp onblur=\"lasttext=this.value.replace(/\~\~/g, '<br>'); this.value=''; this.placeholder='Click where you want ... ' + lasttext.replace(/\<br\>/g, String.fromCharCode(10)); mvp.setAttribute('content','initial-scale=1'); document.getElementById('myvenn').scrollIntoView();\" placeholder='Enter text and later click place for it on Venn Diagram to left (line feed is ~~)' type=text style=width:500px; value=''></input>";
//alert( document.getElementById('aemail').outerHTML );
//alert( document.getElementById('asms').outerHTML );
textnum++;
lasttext='';
} else if (!evt || !normalcall) {
if (chd == '') {
answer=prompt("Enter delimited values string for Venn Diagram such that ... " + String.fromCharCode(10) + "The first three values specify the sizes of three circles: A, B, & C. For chart with only two circles, specify zero for the third value." + String.fromCharCode(10) + "The fourth value specifies the size of the intersection of A and B." + String.fromCharCode(10) + "The fifth value specifies the size of the intersection of A and C. For a chart with only two circles, do not specify a value here." + String.fromCharCode(10) + "The sixth value specifies the size of the intersection of B and C. For a chart with only two circles, do not specify a value here." + String.fromCharCode(10) + "The seventh value specifies the size of the common intersection of A, B, and C. For a chart with only two circles, do not specify a value here." + String.fromCharCode(10) + String.fromCharCode(10) + "", (chd == '' ? "100,80,60,30,30,30,10" : (chd.replace('t:',''))));
} else {
answer=prompt("Enter delimited values string for your Venn Diagram collaborations, optionally, such that ... " + String.fromCharCode(10) + "The first three values specify the sizes of three circles: A, B, & C. For chart with only two circles, specify zero for the third value." + String.fromCharCode(10) + "The fourth value specifies the size of the intersection of A and B." + String.fromCharCode(10) + "The fifth value specifies the size of the intersection of A and C. For a chart with only two circles, do not specify a value here." + String.fromCharCode(10) + "The sixth value specifies the size of the intersection of B and C. For a chart with only two circles, do not specify a value here." + String.fromCharCode(10) + "The seventh value specifies the size of the common intersection of A, B, and C. For a chart with only two circles, do not specify a value here." + String.fromCharCode(10) + String.fromCharCode(10) + "", (chd == '' ? "100,80,60,30,30,30,10" : (chd.replace('t:',''))));
}
vals=[];
if (answer != null) {
answer=answer.trim();
if (answer.trim() != '') {
var delimis='';
for (var ii=0; ii<answer.length; ii++) {
if (delimis == '' && (answer.substring(ii).substring(0,1) < '0' || answer.substring(ii).substring(0,1) > '9')) {
delimis=answer.substring(ii).substring(0,1);
}
}
}
if (delimis != '') {
vals=answer.split(delimis);
}
if (vals.length == 6 || vals.length == 7) {
answertherest=prompt('Any optional legend or title argument snippets? Eg. &chdl=A|B|C&chtt=My%20Venn%20Diagram&chco=ff0000,00ff00,0000ff', therest);
if (answertherest == null) { answertherest=''; }
therest=answertherest.trim();
var aone=1;
var plotstring='';
var flds=[];
if (therest.indexOf('&text' + aone + '=') != -1) {
while (therest.indexOf('&text' + aone + '=') != -1) {
if (chd == '') {
plotstring=decodeURIComponent(therest.split('&text' + aone + '=')[1].split('&')[0]);
while (plotstring.indexOf(String.fromCharCode(10)) != -1) {
plotstring=plotstring.replace(String.fromCharCode(10), '<br>');
}
flds=plotstring.split(',');
if (eval('' + flds.length) >= 3) {
document.getElementById('dtext').innerHTML+='<p style="position:absolute;font-size:10px;font-family:Arial;left:' + flds[0] + 'px;top:' + flds[1] + 'px;z-index:98;">' + plotstring.split('' + flds[0] + ',' + flds[1] + ',')[1] + '</p>';
}
}
aone++;
textnum=aone;
}
}
//document.getElementById('myvenn').style.backgroundImage='URL(//www.rjmprogramming.com.au/ITblog/' + Math.min(550,window.innerWidth) + '/' + Math.min(350,window.innerHeight) + '/?cht=v&chd=t:' + encodeURIComponent(answer + therest) + ')';
document.getElementById('myvenn').src='//www.rjmprogramming.com.au/ITblog/' + Math.min(550,window.innerWidth) + '/' + Math.min(350,window.innerHeight) + '/?cht=v&chd=t:' + encodeURIComponent(answer) + therest + '';
if (document.getElementById('tdright').innerHTML == '') {
document.getElementById('tdright').innerHTML="  <span id=spemail><a target=_blank href='mailto:?subject=My%20Venn%20Diagram%20...%20best%20viewed%20in%20landscape%20...&body=" + encodeURIComponent((document.getElementById('myvenn').src + arest).replace(document.getElementById('myvenn').src.split('?')[0].split('#')[0], document.URL.split('?')[0].split('#')[0])) + "' id=aemail title=Email>&#128231;</a></span>      <span id=spsms><a target=_blank onmouseover=\"if (smsee.length == 0 && origsmsurl.indexOf('sms:&') != -1) { smsee=prompt('Please enter SMS number to send to.', ''); if (smsee == null) { smsee=''; } else { origsmsurl=origsmsurl.replace('sms:&','sms:' + smsee + '&'); asmsurl=asmsurl.replace('sms:&','sms:' + smsee + '&'); this.href=asmsurl; } }\" ontouchstart=\"if (smsee.length == 0 && origsmsurl.indexOf('sms:&') != -1) { smsee=prompt('Please enter SMS number to send to.', ''); if (smsee == null) { smsee=''; } else { origsmsurl=origsmsurl.replace('sms:&','sms:' + smsee + '&'); asmsurl=asmsurl.replace('sms:&','sms:' + smsee + '&'); this.href=asmsurl; } }\" href='sms:&body=" + encodeURIComponent((document.getElementById('myvenn').src + arest).replace(document.getElementById('myvenn').src.split('?')[0].split('#')[0], document.URL.split('?')[0].split('#')[0])) + "' id=asms title=SMS>&#128223;</a></span><br><br>  <input id=ilp onblur=\"lasttext=this.value.replace(/\~\~/g, '<br>'); this.value=''; this.placeholder='Click where you want ... ' + lasttext.replace(/\<br\>/g, String.fromCharCode(10));\" placeholder='Enter text and later click place for it on Venn Diagram to left (line feed is ~~)' type=text style=width:500px; value=''></input>";
}
} else {
alert('Try again.');
ask(null);
}
}
}
atstart=false;
normalcall=true;
}

… in our changed second draft image_venn.html Google Chart Image Chart Venn Chart interfacing web application you can also try below.

Did you know?

As far as this WordPress blog’s 404.php role goes in all this, we were keen to maintain Venn Diagrams that were purely image based data, because the web browser sharing mechanisms are so much better this way, else we were tempted to just construct a webpage HTML dataset positioning text in an absolute way with a Venn Chart background image. In order to do these purely image based Venn Diagrams we used PHP’s GD image library as per

<?php

if (strpos(('?' . $_SERVER['QUERY_STRING']), '?cht=') !== false || strpos(('?' . $_SERVER['QUERY_STRING']), '&cht=') !== false) {

$theqs=str_replace('??','?',('?' . $_SERVER['QUERY_STRING']));
if (strpos($theqs, '?chs=') === false && strpos($theqs, '&chs=') === false) {
$theqs='?chs=' . $newWidth . 'x' . $newHeight . '&' . explode('?', $theqs)[1];
}

if (strpos(('?' . $_SERVER['QUERY_STRING']), 'text1=') !== false) {
$theone=2;
$im = imagecreatefromstring(file_get_contents('ht
tp://chart.googleapis.com/chart' . explode('&text1=', $theqs)[0]));

if (7 == 7) {

$plotstring=str_replace('+',' ',urldecode($_GET['text1']));
$csv=explode(',', $plotstring);
$black = imagecolorallocatealpha($im, 1, 1, 1, 0);
if (sizeof($csv) >= 3) {
try {
if (function_exists('imagettftext')) {
if (explode('' . $csv[0] . ',' . $csv[1] . ',', $plotstring)[1] !== '') {
//echo explode('' . $csv[0] . ',' . $csv[1] . ',', $plotstring)[1];
//exit;
imagettftext($im, 10, 0, $csv[0], $csv[1], $black, realpath('arial.ttf'), explode('' . $csv[0] . ',' . $csv[1] . ',', $plotstring)[1]);
}
}
} catch (Exception $e) { }
while (isset($_GET['text' . $theone])) {
$plotstring=str_replace('+',' ',urldecode($_GET['text' . $theone]));
$csv=explode(',', $plotstring);
if (sizeof($csv) >= 3) {
try {
if (function_exists('imagettftext')) {
if (explode('' . $csv[0] . ',' . $csv[1] . ',', $plotstring)[1] !== '') {
imagettftext($im, 10, 0, $csv[0], $csv[1], $black, realpath('arial.ttf'), explode('' . $csv[0] . ',' . $csv[1] . ',', $plotstring)[1]);
}
}
} catch (Exception $e) { }
}
$theone++;
}
}

}


header('Content-Type: image/png');

imagepng($im);
imagedestroy($im);
} else {

header('Content-Type: image/png');
echo file_get_contents('http://chart.googleapis.com/chart' . $theqs);
}
exit;

}

?>


Previous relevant Google Chart Image Chart Venn Chart Interfacing Primer Tutorial is shown below.

Google Chart Image Chart Venn Chart Interfacing Primer Tutorial

Google Chart Image Chart Venn Chart Interfacing Primer Tutorial

So, moving on from Google Charts Image Chart Map Charts, today, let’s turn our attention to Google Charts Image Chart Venn Charts which we were dead set curious about given work we’d done in the past regarding Venn Diagrams, which we referenced when we presented Flowchart and Venn Diagram and Mind Map Token Subject Emoji Tutorial some time back. Gobsmackingly good is the Google approach, again, as you’d expect, but the approach covers different ground, so one feels one should go back to Primary School! You thought we were going to give away the answer to one of those security questions, didn’t you?! Didn’t you!?! Well, the answer is “Gryffindor Slytherin Ravenclaw Hufflepuff Junior Business College” … if you must know.

The sharing capabilities are good with the Google Charts approach too, given we are creating an HTML image, as our WordPress blog good ol’ 404.php has been woken up to address via …

<?php

if (strpos(('?' . $_SERVER['QUERY_STRING']), '?cht=') !== false || strpos(('?' . $_SERVER['QUERY_STRING']), '&cht=') !== false) {

$theqs=str_replace('??','?',('?' . $_SERVER['QUERY_STRING']));
if (strpos($theqs, '?chs=') === false && strpos($theqs, '&chs=') === false) {
$theqs='?chs=' . $newWidth . 'x' . $newHeight . '&' . explode('?', $theqs)[1];
}


header('Content-Type: image/png');
echo file_get_contents('http://chart.googleapis.com/chart' . $theqs);
exit;

}

?>

Yes, all these Image Chart smarts come, essentially, from a “one line” calling URL! Who’d have believed it! Shiver me timbers!

Well, it’s early days with this Venn Chart interfacing where we allow for …

  • circle (think up to three) definition … and the rest, in this first draft (hoping you’ve done some reading)
  • legend and title and colour selection user definitions dumped into a fairly unfriendly “the rest” Javascript prompt entry we ask of the user should they go ahead with the previous definition … and …
  • sharing and collaboration email and SMS functionality

… we hope you try via our “proof of concept” first draft image_venn.html Google Chart Image Chart Venn Chart interfacing web application you can also try below …


If this was interesting you may be interested in this too.


If this was interesting you may be interested in this too.


If this was interesting you may be interested in this too.


If this was interesting you may be interested in this too.


If this was interesting you may be interested in this too.


If this was interesting you may be interested in this too.


If this was interesting you may be interested in this too.


If this was interesting you may be interested in this too.


If this was interesting you may be interested in this too.


If this was interesting you may be interested in this too.


If this was interesting you may be interested in this too.


If this was interesting you may be interested in this too.


If this was interesting you may be interested in this too.


If this was interesting you may be interested in this too.


If this was interesting you may be interested in this too.


If this was interesting you may be interested in this too.


If this was interesting you may be interested in this too.


If this was interesting you may be interested in this too.


If this was interesting you may be interested in this too.


If this was interesting you may be interested in this too.


If this was interesting you may be interested in this too.


If this was interesting you may be interested in this too.


If this was interesting you may be interested in this too.


If this was interesting you may be interested in this too.


If this was interesting you may be interested in this too.


If this was interesting you may be interested in this too.


If this was interesting you may be interested in this too.


If this was interesting you may be interested in this too.

Posted in eLearning, Event-Driven Programming, Tutorials | Tagged , , , , , , , , , , , , , , , , , , , , , , , , , , , , , , , , , , , , , , , , , , , , , , , , , , , , , , | Leave a comment

Python GraphViz via PHP on AlmaLinux Organization Hierarchy Emoji Tutorial

Python GraphViz via PHP on AlmaLinux Organization Hierarchy Emoji Tutorial

Python GraphViz via PHP on AlmaLinux Organization Hierarchy Emoji Tutorial

As far as the title of today’s tutorial goes, onto yesterday’s Python GraphViz via PHP on AlmaLinux Organization Hierarchy Tutorial, we figure “the new word” in the title could have come from …

  • Emoji … as we decided upon (as much as anything, because non-ascii characters for other non-English language requirements, might now be possible within the content of the GraphViz entity, as a result) … or …
  • Format … or …
  • Sharing … or …
  • Encoding … or …
  • Delimitation

We wanted to look back at yesterday to it’s “code architecture”, if you will, as a “lead in” to where we are coming at here. Yesterday, in the user definable textarea elements …

| … “edge” linkage record set delimiter
; … parent from rest delimiter
, … rest child name(s) delimiter

… this user usage delimiter characters “inhouse rules” architecture contributes to making it all the more crucial in the coding, to nail down how the + character is handled …

<?php echo ”

function contentfix(inid) {
document.getElementById('ititle').value=document.getElementById('ititle').value.replace(/\+/g,'-').replace(/\=/g,'-').replace(/\ /g,'-');
document.getElementById('none').value=various(document.getElementById('one').value.replace(/\+/g,String.fromCharCode(9)));
document.getElementById('ntwo').value=various(document.getElementById('two').value.replace(/\+/g,String.fromCharCode(9)));
document.getElementById('nthree').value=various(document.getElementById('three').value.replace(/\+/g,String.fromCharCode(9)));
return inid;
}

“; ?>

… which, as you can see with our HTML form onsubmit event fired Javascript function above, amounts to mapping real content + characters to horizontal tab to differentiate this mode of use from the use HTML form encoding uses for it to represent an encoded space character. Are you now getting a bit of an idea with today’s “tidying up” and “nuancing” feel?!

What about if any “edge” names contain one of those delimiters, as above? Well, we try …

<?php echo ”

function various(indi) {
var outdi=indi;
outdi=outdi.replace(/\|\;/g, encodeURIComponent('|') + ';');
outdi=outdi.replace(/\,\;/g, encodeURIComponent(',') + ';');
outdi=outdi.replace(/\;\;/g, encodeURIComponent(';') + ';');

outdi=outdi.replace(/\|\,/g, encodeURIComponent('|') + ',');
outdi=outdi.replace(/\,\,/g, encodeURIComponent(',') + ',');
outdi=outdi.replace(/\;\,/g, encodeURIComponent(';') + ',');

outdi=outdi.replace(/\|\|/g, encodeURIComponent('|') + '|');
outdi=outdi.replace(/\,\|/g, encodeURIComponent(',') + '|');
outdi=outdi.replace(/\;\|/g, encodeURIComponent(';') + '|');

return outdi;
}

“; ?>

… in that regard, and “double decode” (with a bit of nuance in between) on the other side, to try to account for this. We’ll see!

But the day started thinking about Emojis. What would happen in our PDF default output with Emoji content being introduced by the user within input textarea elements, as they go to Draw their Hierarchical Organization chart? Well, not so good. But, thanks to Graphviz not supporting UTF-8 encoding webpage, we got put onto the idea that an alternative, and now the default, format of output could be SVG … and trying it worked … thanks!

And then there’s Sharing (and collaboration) thoughts, again?! Email and SMS hashtagged URLs, again?! Well, here, we modelled ideas from the sharing ideas of the PDF to Images and Microsoft Office on AlmaLinux Tutorial thread of blog postings, ending up with …

<?php echo ”

function emailit(inais) {
event.stopPropagation();
var em=null;
em=prompt('Please enter email address to send output ' + document.getElementById('fmt').value + ' URL link to.', '');
if (em == null) { em=''; }
if (em.indexOf('@') != -1) {
document.getElementById('ititle').value=document.getElementById('ititle').value.replace(/\+/g,'-').replace(/\=/g,'-').replace(/\ /g,'-');
document.getElementById('none').value=various(document.getElementById('one').value.replace(/\+/g,String.fromCharCode(9)));
document.getElementById('ntwo').value=various(document.getElementById('two').value.replace(/\+/g,String.fromCharCode(9)));
document.getElementById('nthree').value=various(document.getElementById('three').value.replace(/\+/g,String.fromCharCode(9)));
em+='?subject=Hierarchy%20Organization&body=' + encodeURIComponent( (document.URL.split('?')[0].split('#')[0] + '?rand=' + Math.floor(Math.random() * 19897865) + '#title=' + encodeURIComponent(document.getElementById('ititle').value) + '#fmt=' + encodeURIComponent(document.getElementById('fmt').value) + '#one=' + encodeURIComponent(document.getElementById('none').value) + '#two=' + encodeURIComponent(document.getElementById('ntwo').value) + '#three=' + encodeURIComponent(document.getElementById('nthree').value)).replace('#fmt=svg#one=#','#fmt=pdf#one=#') );
document.getElementById('dimap').innerHTML=\"<a style=display:none; id=theaemail target=_blank href='mailto:\" + em + \"'>Email</a>\";
document.getElementById('theaemail').click();
}
return false;
}

function smsit(inais) {
event.stopPropagation();
var em=null;
em=prompt('Please enter SMS number to send output ' + document.getElementById('fmt').value + ' URL link to.', '');
if (em == null) { em=''; }
if (em.trim() != '') {
document.getElementById('ititle').value=document.getElementById('ititle').value.replace(/\+/g,'-').replace(/\=/g,'-').replace(/\ /g,'-');
document.getElementById('none').value=various(document.getElementById('one').value.replace(/\+/g,String.fromCharCode(9)));
document.getElementById('ntwo').value=various(document.getElementById('two').value.replace(/\+/g,String.fromCharCode(9)));
document.getElementById('nthree').value=various(document.getElementById('three').value.replace(/\+/g,String.fromCharCode(9)));
em+='&body=' + encodeURIComponent( (document.URL.split('?')[0].split('#')[0] + '?rand=' + Math.floor(Math.random() * 19897865) + '#title=' + encodeURIComponent(document.getElementById('ititle').value) + '#fmt=' + encodeURIComponent(document.getElementById('fmt').value) + '#one=' + encodeURIComponent(document.getElementById('none').value) + '#two=' + encodeURIComponent(document.getElementById('ntwo').value) + '#three=' + encodeURIComponent(document.getElementById('nthree').value)).replace('#fmt=svg#one=#','#fmt=pdf#one=#') );
document.getElementById('dimap').innerHTML=\"<a style=display:none; id=theasms target=_blank href='sms:\" + em + \"'>SMS</a>\";
if (!document.getElementById('theasms') && document.getElementById('psms')) {
document.getElementById('psms').click();
} else {
document.getElementById('theasms').click();
}
}
}
return false;
}

“; ?>

… within the changed hierarchy_organization.php Hierarchy Organization diagram “drawer”.

Stop Press

And then it occurred to us that there is also the GraphViz graph mode ( default Digraph versus Graph ), and it’s “edge” element background colour and shape and font size, as well as a resizing mechanism, that could be up for grabs, via user input in the tweaked hierarchy_organization.php Hierarchy Organization diagram “drawer”.


Previous relevant Python GraphViz via PHP on AlmaLinux Organization Hierarchy Tutorial is shown below.

Python GraphViz via PHP on AlmaLinux Organization Hierarchy Tutorial

Python GraphViz via PHP on AlmaLinux Organization Hierarchy Tutorial

Calling cab (6754 – 6756 + 4).

Huh?!

Calling the second cab off the rank.

Yes, now that we understand a bit more about file permission issues, after yesterday’s Python GraphViz via PHP on AlmaLinux Permissions Tutorial, having PHP hosting Python with GraphViz calls, let’s turn our attention to the issue of “lots of data”, today, with our …


Organization Hierarchyist

… what do you say?! It’s a bit embarrassingly easy a remedy because we are writing in PHP, to just …

  • make any $_GET[] (web browser address bar arguments) references become $_POST[] equivalents … and any …
  • HTML form method=GET should become HTML form method=POST

Calling log (6754 – 6756 + 4 – 1) … to fall off.

Python code wise, our hierarchy_organization.py inspiration came from https://graphviz.readthedocs.io/en/stable/examples.html thanks.

Then we worked on PHP hierarchy_organization.php to be as close to being a buddy with a Python as, well, Monty?!


Previous relevant Python GraphViz via PHP on AlmaLinux Permissions Tutorial is shown below.

Python GraphViz via PHP on AlmaLinux Permissions Tutorial

Python GraphViz via PHP on AlmaLinux Permissions Tutorial

Did you guess, regarding the Python Graphviz via PHP work of yesterday’s Python GraphViz via PHP on AlmaLinux Tutorial, we were experiencing File Permission issues?

Well, yesterday, regarding the Python Graphviz via PHP work of yesterday’s Python GraphViz via PHP on AlmaLinux Tutorial, we were experiencing File Permission issues.

We thought we’d move the Python, via PHP processing, totally into the purview of the web server administration owner, by involving a …

  1. Korn Shell *.ksh … supervised by …
  2. crontab … pointing to …

    ksh -c 'for i in `find /home/rjmprogr/public_html/ -name "subgraph_example_*.ksh"`; do ksh -c `echo $i`; done'

    … very regularly

… arrangement, but even that failed, in a first incarnation using /tmp/ placement of the Korn Shell file. “Permission denied”, again. Running a Korn Shell from /tmp/ on AlmaLinux must be a no-no, so moved the place to be AlmaLinux web server’s Document Root place, and then things started happening, in the changed subgraph_example.php Python GraphViz using web application.


Previous relevant Python GraphViz via PHP on AlmaLinux Tutorial is shown below.

Python GraphViz via PHP on AlmaLinux Tutorial

Python GraphViz via PHP on AlmaLinux Tutorial

Do you remember reading, with PHP Image GraphViz via Pear on AlmaLinux Primer Tutorial below, our outlining three known GraphViz guises …

  • the recent, alas now deprecated, Google Charts Image Charts GraphViz option means of drawing SVG graphics within an HTML image … we’ve known about before about yesterday
  • today’s interest, that being PHP Image GraphViz via Pear on AlmaLinux install, via the AlmaLinux cPanel “Module Installers” Pear installer page, means by which we can use GraphViz calls in PHP code … and, for the future …
  • GraphViz installs for Python via pip

…? Well, today, we start down the road of …

  1. installing Python GraphViz package via …

    pip install graphviz

    … then …
  2. getting great help from https://graphviz.readthedocs.io/en/stable/, thanks, as the Python code basis we call subgraph_example.py … and …
  3. used and remoulded by our overseeing PHP subgraph_example.php Python GraphViz using web application

… we need to work on more after this first draft start to another road of our GraphViz journey last talked about at PHP Image GraphViz via Pear on AlmaLinux Focus Tutorial.


Previous relevant PHP Image GraphViz via Pear on AlmaLinux Focus Tutorial is shown below.

PHP Image GraphViz via Pear on AlmaLinux Focus Tutorial

PHP Image GraphViz via Pear on AlmaLinux Focus Tutorial

It reared it’s ugly head with the Animated GIF Creator here at RJM Programming (helped out by the great Jeroen van Wissen open source work, thanks). And with yesterday’s PHP Image GraphViz via Pear on AlmaLinux Recallable Tutorial it reared up again.

On non-mobile focus goes to the address bar on many web browsers unless there is a (nominally) visible input type=text or textarea next in line.

It’s hard to keep in mind except as it “rears up” in an annoying way, but if we’d thought back, yes, we allow in the linked list feel of revealing textboxes (or textareas) only as they are needed scenarios we allow for two blank ones to be (nominally) visible at any given time … not one … but two, presumably because there is a tiny Javascript DOM “refresh period” not short enough to stop the web browser “desperation measure” (of placing focus in the address bar) happening?!

Why the non-mobile mention? Well, on mobile, a user programming [HTMLelement].focus(); call has no affect, as the touch operating systems need control of focus arrangements, presumably?!

How can we forget? My liege, please accept my humble apologies?!

Why the (nominally) mentions? Well, we have, successfully, in the past, just arranged a (statically HTML placed) textbox (ie. input type=text) that sits outside the viewing screen but not (nominally) invisible (eg. style=’position:absolute;top:-200px;left:-200px;’) can help you avoid the focus going up to the web browser address bar.

So that’s that, and other progress today is to allow the emailing or SMS of a recalled URL Step arrangement via more options on that “Recall Dropdown” we started allowing for yesterday.

Please see this happening in our changed PHP coded My Recipe Steps web application you can also try below.


Previous relevant PHP Image GraphViz via Pear on AlmaLinux Recallable Tutorial is shown below.

PHP Image GraphViz via Pear on AlmaLinux Recallable Tutorial

PHP Image GraphViz via Pear on AlmaLinux Recallable Tutorial

After yesterday’s PHP Image GraphViz via Pear on AlmaLinux Sharing Tutorial some readers may be curious to understand the distinction between …

  • email and SMS sharing … and …
  • inhouse intersessional sharing via window.localStorage (ie. like HTTP Cookies)

… over yesterday’s and today’s blog posting timings. Simply put, for us, we …

  • take a deep breath before starting intersessional window.localStorage work, as it is not to be sneezed at, as any sort of doddle (at least for us) … as well as …
  • since last intersessional window.localStorage work we’ve started using email and SMS sharing hashtagging arrangements that fit in, like a glove, with this intersessional window.localStorage work … so that …
  • even though, we write the code here in PHP, all this functionality is client based … which we like because …
  • get the idea correct, with careful forward planning and implementation, we’ll be able to apply similar such thinking into the future, whether that be for clientside only web applications and/or ones that call on serverside code (like PHP) … and …
  • if we can keep things just clientside more readers can be involved, we figure

If you’re wondering about the worry of any of this, it is to do with large title and/or URL link and/or ingredient type data whose data length could be huge, where most of our concern lies, and …

  • hashtagging (where data limits are so much longer) can help it remain as a clientside only solution environment (rather than relying on some form method=POST to a serverside (eg. PHP) receiver solution) …
  • window.localStorage is a step up from the HTTP Cookie style of intersessional (personal) storage as far as amounts that can be stored is concerned

What are we aiming for here, then, with our improvements?

  • extend the existant email and SMS functionality …
    <?php echo ”

    function emailit(insg) {
    var em='', ccok='';
    if (estitle == '') {
    if (cookb.split(' Or hash delimited appended string can ')[0] != '') {
    cookb=cookb.replace(cookb.split(' Or hash delimited appended string can ')[0], '');
    }
    }
    if (('' + insg).replace(/^null/g,'').replace(/^undefined/g,'').trim() != '') {
    em='' + insg;
    } else {

    em=prompt('Please enter Email address to share with. ' + cookb, '');
    }
    if (em != null) {
    if (em.trim() == '' && estitle != '') {
    em='#' + estitle;
    } else if (em == estitle && estitle != '') {
    em='#' + estitle;
    }
    }
    if (em.indexOf('#') != -1) {
    cook=em.substring(eval(1 + eval('' + em.indexOf('#'))));
    em=em.split('#')[0].trim();
    if (cook.trim() != '') {
    deleteAVal('steps_' + cook.replace(/\ /g,'-'),'');
    setAVal('steps_' + cook.replace(/\ /g,'-'), \"" . $hashurl . $hashurld . "\" + anyhashes);
    }
    }

    if (em == null) { em=''; }
    if (em.trim() != '') {
    if (em.trim().indexOf('@') != -1) {
    em+='?subject=Steps&body=' + encodeURIComponent(\"" . $hashurl . $hashurld . "\" + anyhashes);
    document.getElementById('dimap').innerHTML=\"<a style=display:none; id=theaemail target=_blank href='mailto:\" + em + \"'>Email</a>\";
    document.getElementById('theaemail').click();
    } else if (em.trim().replace(/0/g,'').replace(/1/g,'').replace(/2/g,'').replace(/3/g,'').replace(/4/g,'').replace(/5/g,'').replace(/6/g,'').replace(/7/g,'').replace(/8/g,'').replace(/9/g,'') == '') {
    em+='&body=' + encodeURIComponent(\"" . $hashurl . $hashurld . "\" + anyhashes);
    document.getElementById('dimap').innerHTML=\"<a style=display:none; id=theasms target=_blank href='sms:\" + em + \"'>SMS</a>\";
    document.getElementById('theasms').click();
    }
    }
    return false;

    }

    function smsit(insg) {
    var em='', cook='';
    if (estitle == '') {
    if (cookb.split(' Or hash delimited appended string can ')[0] != '') {
    cookb=cookb.replace(cookb.split(' Or hash delimited appended string can ')[0], '');
    }
    }
    if (('' + insg).replace(/^null/g,'').replace(/^undefined/g,'').trim() != '') {
    em='' + insg;
    } else {

    em=prompt('Please enter SMS number to share with. ' + cookb, '');
    }
    if (em != null) {
    if (em.trim() == '' && estitle != '') {
    em='#' + estitle;
    } else if (em == estitle && estitle != '') {
    em='#' + estitle;
    }
    }
    if (em.indexOf('#') != -1) {
    cook=em.substring(eval(1 + eval('' + em.indexOf('#'))));
    em=em.split('#')[0].trim();
    if (cook.trim() != '') {
    deleteAVal('steps_' + cook.replace(/\ /g,'-'),'');
    setAVal('steps_' + cook.replace(/\ /g,'-'), \"" . $hashurl . $hashurld . "\" + anyhashes);
    }
    }

    if (em == null) { em=''; }
    if (em.trim() != '') {
    if (em.trim().replace(/0/g,'').replace(/1/g,'').replace(/2/g,'').replace(/3/g,'').replace(/4/g,'').replace(/5/g,'').replace(/6/g,'').replace(/7/g,'').replace(/8/g,'').replace(/9/g,'') == '') {
    em+='&body=' + encodeURIComponent(\"" . $hashurl . $hashurld . "\" + anyhashes);
    document.getElementById('dimap').innerHTML=\"<a style=display:none; id=theasms target=_blank href='sms:\" + em + \"'>SMS</a>\";
    document.getElementById('theasms').click();
    } else if (em.trim().indexOf('@') != -1) {
    em+='?subject=Steps&body=' + encodeURIComponent(\"" . $hashurl . $hashurld . "\" + anyhashes);
    document.getElementById('dimap').innerHTML=\"<a style=display:none; id=theaemail target=_blank href='mailto:\" + em + \"'>Email</a>\";
    document.getElementById('theaemail').click();
    }
    }
    return false;
    }

    “; ?>
    … to cater for additional personalized Title (of steps) and Content of steps (using the hashtagging email and SMS URL methods set up yesterday)
    <?php echo ”

    var estitle=\"" . $estitle . "\";
    var cookb=\"" . $cookblurb . "\";
    var lssel='';
    var woo=null;

    function deleteAVal(goodname, aparticularvalue) {
    if (window.localStorage && goodname.indexOf('steps_') == 0) {
    if (('' + localStorage.getItem(goodname)).replace(/^undefined/g,'').replace(/^null/g,'') != '') {
    if (aparticularvalue == '') {
    localStorage.removeItem(goodname);
    } else {
    if (aparticularvalue.replace('HTTP','http').toLowerCase() == ('' + localStorage.getItem(goodname)).toLowerCase()) {
    localStorage.removeItem(goodname);
    }
    }
    }
    }
    }

    function setAVal(cName, cVal) {
    if (cName.indexOf('steps_') == 0) {
    if (window.localStorage) {
    localStorage.setItem(cName, encodeURIComponent(cVal));
    cookieAVal('steps_', true);
    return ' ';
    }
    return '';
    }
    return '';
    }

    function gotothis(inu) {
    if (inu.trim() != '') {
    if (inu.indexOf('HTTP') == 0) {
    //alert('2:' + inu);
    if (inu.indexOf('#steps_') != -1) {
    //alert('22:' + inu.split('#')[eval(-1 + inu.split('#').length)]);
    deleteAVal(inu.split('#')[eval(-1 + inu.split('#').length)], encodeURIComponent(inu.replace('#' + inu.split('#')[eval(-1 + inu.split('#').length)], '').replace('HTTP','http')));
    //alert('222:' + inu.split('#')[eval(-1 + inu.split('#').length)]);
    cookieAVal('steps_', true);
    //alert('2222:' + inu.split('#')[eval(-1 + inu.split('#').length)]);
    }
    } else {
    woo=window.open(inu, '_blank', 'top=50,left=50,width=800,height=800');
    }
    }
    }

    function cookieAVal(cName, selize) {
    var key=null;
    if (selize && window.localStorage) {
    lssel=' ';
    for (var i=0; i<localStorage.length; i++) { // thanks to https://stackoverflow.com/questions/41271092/how-to-loop-through-localstorage-values
    key = localStorage.key(i);
    if (('' + key).indexOf(cName) == 0) {
    if (lssel.trim() == '') {
    lssel='<select id=sells onchange=gotothis(this.value);><option value=\"\">Recallable Steps below ...</option></select>';
    }
    lssel=lssel.replace('</select>', '<option value=\"' + decodeURIComponent(localStorage.getItem('' + key)) + '\">' + ('' + key).substring(eval('' + cName.length)).replace(/\_/g,' ').replace(/\-/g,' ') + '</option>' + '<option value=\"' + decodeURIComponent(localStorage.getItem('' + key).replace('http','HTTP')) + '#steps_' + ('' + key).substring(eval('' + cName.length)) + '\">Remove ' + ('' + key).substring(eval('' + cName.length)).replace(/\_/g,' ').replace(/\-/g,' ') + '</option>' + '</select>');
    }
    }
    if (lssel != '') {
    document.getElementById('ssel').innerHTML=lssel.trim();
    }
    }
    if (cName.indexOf('steps_') == 0) {
    if (window.localStorage) {
    if (decodeURIComponent(('' + localStorage.getItem(cName)).replace(/^undefined/g,'').replace(/^null/g,'')) != '') {
    return decodeURIComponent(localStorage.getItem(cName));
    }
    if (decodeURIComponent(('' + sessionStorage.getItem(cName)).replace(/^undefined/g,'').replace(/^null/g,'')) != '') {
    return decodeURIComponent(sessionStorage.getItem(cName));
    }
    }
    return '';
    }
    return '';
    }

    “; ?>
  • add a new …

    <a id=pcookie title='Recall this' class=share onclick="return emailit(estitle);" style='display:none;text-decoration:none;cursor:pointer;'>🍪</a>

    … emoji link for intersessional window.localStorage work that calls the email functionality modified Javascript function …
  • allowing a window.localStorage.setItem([Title (of steps)], encodeURIComponent([Content of steps])) to add a personalized and recallable record be kept on the web browser of use … recallable via …
  • new dropdown populated with existant such records, as well as a dropdown option allowing the user to remove said records, too … which …
  • can navigate the user to this recallable Steps idea in a new webpage incarnation …
  • a dropdown arrangement which is intersessional as well as intrasessional by nature, and personalized to that user’s use of the web browser on that device in question

… in our changed PHP coded My Recipe Steps web application you can also try below.


Previous relevant PHP Image GraphViz via Pear on AlmaLinux Sharing Tutorial is shown below.

PHP Image GraphViz via Pear on AlmaLinux Sharing Tutorial

PHP Image GraphViz via Pear on AlmaLinux Sharing Tutorial

Adding to yesterday’s PHP Image GraphViz via Pear on AlmaLinux Primer Tutorial

  • on many mobile devices the horizontally spreading right cell arrangements has been improved by laying out these textarea elements vertically now …
  • hashtagged URL mailto: and/or sms: “a” links to email and/or SMS communication conduits, respectively …
    <?php echo ”

    var anyhashes='';
    var aone=1;
    var tdc=0;

    function checkforlh() {
    aone=1;
    if (('' + location.hash.indexOf('dtitle')) != -1) {
    if (('' + location.hash.indexOf('dtitle=')) != -1) {
    document.getElementById('therest').value=decodeURIComponent(('' + location.hash).split('dtitle=')[1].split('#')[0].split(encodeURIComponent('#'))[0]);
    document.getElementById('therest').name='dtitle';
    } else if (('' + location.hash.indexOf('dtitle' + encodeURIComponent('='))) != -1) {
    document.getElementById('therest').value=decodeURIComponent(('' + location.hash).split('dtitle' + encodeURIComponent('='))[1].split('#')[0].split(encodeURIComponent('#'))[0]);
    document.getElementById('therest').name='dtitle';
    }
    }
    var retv='';
    while (('' + location.hash.indexOf('step' + aone)) != -1) {
    if (('' + location.hash.indexOf('step' + aone + '=')) != -1) {
    if (aone <= 1) {
    document.getElementById('tdi' + aone).value=decodeURIComponent(('' + location.hash).split('step' + aone + '=')[1].split('#')[0].split(encodeURIComponent('#'))[0]);
    } else {
    document.getElementById('tdi' + aone).value=decodeURIComponent(('' + location.hash).split('step' + aone + '=')[1].split('#')[0].split(encodeURIComponent('#'))[0]);
    obl(document.getElementById('tdi' + aone), true); //document.getElementById('tdi' + aone).blur();
    if ( document.getElementById('tdi' + eval(1 + aone))) {
    document.getElementById('tdi' + eval(1 + aone)).focus();
    }
    }
    } else if (('' + location.hash.indexOf('step' + aone + encodeURIComponent('='))) != -1) {
    if (aone <= 1) {
    document.getElementById('tdi' + aone).value=decodeURIComponent(('' + location.hash).split('step' + aone + encodeURIComponent('='))[1].split('#')[0].split(encodeURIComponent('#'))[0]);
    } else {
    document.getElementById('tdi' + aone).value=decodeURIComponent(('' + location.hash).split('step' + aone + encodeURIComponent('='))[1].split('#')[0].split(encodeURIComponent('#'))[0]);
    obl(document.getElementById('tdi' + aone), true); //document.getElementById('tdi' + aone).blur();
    if ( document.getElementById('tdi' + eval(1 + aone))) {
    document.getElementById('tdi' + eval(1 + aone)).focus();
    }
    }
    }
    aone++;
    }
    if (aone > 1 || document.getElementById('therest').value != '') { anyhashes=('' + location.hash).replace(/\%23/g,'#'); setTimeout(function(){ if (confirm('Draw now (versus add more yourself)?') == true) { document.getElementById('mysub').click(); } }, 8000); }
    }

    “; ?>
    … help out with some new sharing functionalities

… so that “a procedure made up of steps” can now be shared and/or created collaboratively in our changed PHP coded My Recipe Steps web application.


Previous relevant PHP Image GraphViz via Pear on AlmaLinux Primer Tutorial is shown below.

PHP Image GraphViz via Pear on AlmaLinux Primer Tutorial

https://en.wikipedia.org/wiki/Graphviz

The term “GraphViz”

Graphviz (short for Graph Visualization Software) is a package of open-source tools initiated by AT&T Labs Research for drawing graphs (as in nodes and edges, not as in bar charts) specified in DOT language scripts having the file name extension “gv”. It also provides libraries for software applications to use the tools. Graphviz is free software licensed under the Eclipse Public License.

… we’ve learnt recently, means a lot of things, differently (nuanced) for a range of users, three that we’ve so far become aware of being …

  • the recent, alas now deprecated, Google Charts Image Charts GraphViz option means of drawing SVG graphics within an HTML image … we’ve known about before about yesterday
  • today’s interest, that being PHP Image GraphViz via Pear on AlmaLinux install, via the AlmaLinux cPanel “Module Installers” Pear installer page, means by which we can use GraphViz calls in PHP code … and, for the future …
  • GraphViz installs for Python via pip

… in amongst many others we’ve seen programmers using … totally cute, totally useful!

It seems with our PHP Image GraphViz via Pear on AlmaLinux as what looks like a very much “pared down” version of the last mode of use above, that we add constructed graph node or edge or cluster objects, and form them into SVG based HTML image elements. It’s look got me thinking “Steps”, then “Recipe Steps”, and back, quietly, to “Any Old Steps” as the day got more generic.

At first we got, as far as Recipes go (and here we thank Italian Wedding Soup for today’s inspiration), to …

  • cooking steps showing as Image GraphViz edge graphic components (having arrows connect ellipses containing text, a bit like Speech Bubbles) … and then trying to face the “real world” a user interested in recipes might want to see happen …
  • an Image GraphViz node graphic component whose wording could be a user supplied recipe Title along with a “URL” attribute link, optionally user supplied (via our HTML div SVG hosting ondblclick event allowing its contenteditable=true attribute and onblur event means by which these optional additional data items can enter the “mix”, if you’ll pardon the pun), probably pointing back to the original recipe information saucesource … and …
  • this title and/or “URL” and/or ingredient list (for example) can all be expressed as the “on hover” title attribute of the tailored user PHP webpage (yes, here we have PHP writing PHP) … and …
  • at least on Safari, given a recipe Title defined, we can arrange any browser context menu (ie. right click) over the HTML iframe hosted recipe content “Save Iframe As” option being able to download to a reasonably self explanatory download filename … and/or …
  • any web browser’s Add Bookmark functionality can be harnessed to help the user out in such a way that our PHP coded My Recipe Steps web application could end up being your one stop shop “Recipe Organizer” online?!

See what we mean below …


Previous relevant Google Chart Image Chart Angled Text Annotation Tutorial is shown below.

Google Chart Image Chart Angled Text Annotation Tutorial

Google Chart Image Chart Angled Text Annotation Tutorial

It’s Tuesday, in places around the world, looking back at yesterday’s Google Chart Image Chart Image Map Event Editing Tutorial. Can’t help but think we’ve forgotten something. Ah yes …

You talkin’ to me? You talkin’ to me? Meanwhile, back at the questions! Welcome back, Mr De Niro, sir. We hope your Tuesday is treating you well. (Rhetorical. Let it please be Rhetorical … oh dear God … it must be Rhetorical … it must be Rhetorical) We have news regarding “the dosh” (wink, wink) we were discussing the other day. You see …

Better to be king for a night than schmuck for a lifetime. Well, at least it’s not a question. … the thing is, silly us, it turns out that angled text issue was not a problem with [element].getBoundingClientRect() but how the PHP GD imagettftext text placement emanated from the bottom left of the text always, Mr De Niro sir.

Never rat on your friends and always keep your mouth shut. Really wish we could! Yes, Mr De Niro, sir, but, you see this means the rats are completely out of the picture, just leaving us with our money spinner. Right, Mr De Niro … sir.

There are three ways of doing things around here: the right way, the wrong way and the way that I do it. [Exeunt: Stage right] Well, that’s odd? Mr De Niro wasn’t interested in the quadrant nature to our problem solution …


var rectex=extents[eval(-1 + extents.length)].getBoundingClientRect();
if (document.URL.indexOf('debug=') != -1) {
document.body.innerHTML+='<div style="position:absolute;border:1px solid rgba(255,0,0,0.5);top:' + rectex.top + 'px;left:' + rectex.left + 'px;width:' + rectex.width + 'px;height:' + rectex.height + 'px;z-index:200;" title="position:absolute;border:1px solid rgba(255,0,0,0.5);top:' + rectex.top + 'px;left:' + rectex.left + 'px;width:' + rectex.width + 'px;height:' + rectex.height + 'px;z-index:200;"></div>';
}

var invs=inv.split('.'); // angled text origin depends on angle quadrant
var wasi=inv;
var theang=eval('' + fsx);
//alert('' + inv + ' ' + theang);

if (eval('' + invs.length) > 2 && inv.indexOf(',') != -1) {
//alert('' + rectex.width + 'x' + rectex.height + ' ' + ';' + rectex.top + 'vs' + rectex.bottom + ' ' + ';' + rectex.left + 'vs' + rectex.right + ' ' + inv + ' ' + extents[-1 + extents.length].outerHTML + ' ' + rectex.x + '+' + rectex.y);
if (7 == 8) {
inv=inv.replace(invs[0], '' + Math.floor(eval(rectex.left + rectex.width / 2)));
} else {
if (theang > (315 + 45) || theang < (45 + 45)) {
inv=inv.replace(invs[0], '' + Math.floor(eval(rectex.left * 1 + rectex.right * 0 + 0 * rectex.width / 2)));
} else if (theang >= (45 + 45) && theang <= (135 + 45)) {
inv=inv.replace(invs[0], '' + Math.floor(eval(rectex.left * 0 + rectex.right * 1 + 0 * rectex.width / 2)));
} else if (theang >= (225 + 45) && theang <= (315 + 45)) {
inv=inv.replace(invs[0], '' + Math.floor(eval(rectex.left * 1 + rectex.right * 0 + 0 * rectex.width / 2)));
} else {
inv=inv.replace(invs[0], '' + Math.floor(eval(rectex.left * 0 + rectex.right * 1 + 0 * rectex.width / 2)));
}
}


if (7 == 8) {
inv=inv.replace(',' + invs[1].split(',')[1], ',' + Math.floor(eval(rectex.top + rectex.height / 2)));
} else {
if (theang > (315 + 45) || theang < (45 + 45)) {
inv=inv.replace(',' + invs[1].split(',')[1], ',' + Math.floor(eval(rectex.top * 0 + rectex.bottom * 1 + 0 * rectex.height / 2)));
//alert('' + wasi + ' vs ' + inv + ' ' + invs.length);
} else if (theang >= (225 + 45) && theang <= (315 + 45)) {
inv=inv.replace(',' + invs[1].split(',')[1], ',' + Math.floor(eval(rectex.top * 1 + rectex.bottom * 0 + 0 * rectex.height / 2)));
} else if (theang >= (45 + 45) && theang < (135 + 45)) {
inv=inv.replace(',' + invs[1].split(',')[1], ',' + Math.floor(eval(rectex.top * 0 + rectex.bottom * 1 + 0 * rectex.height / 2)));
} else {
inv=inv.replace(',' + invs[1].split(',')[1], ',' + Math.floor(eval(rectex.top * 1 + rectex.bottom * 0 + 0 * rectex.height / 2)));
}
}


//alert('was=' + wasi + ' and now=' + inv);
} else if (eval('' + invs.length) == 2 && inv.indexOf(',') != -1) {
//alert('' + rectex.width + 'x' + rectex.height + ' ' + ';' + rectex.top + 'vs' + rectex.bottom + ' ' + ';' + rectex.left + 'vs' + rectex.right + ' ' + inv + ' ' + extents[-1 + extents.length].outerHTML + ' ' + rectex.x + '+' + rectex.y);
if (theang > (315 + 45) || theang < (45 + 45)) {
inv=inv.replace(invs[0], '' + Math.floor(eval(rectex.left * 1 + rectex.right * 0 + 0 * rectex.width / 2)));
} else if (theang >= (45 + 45) && theang <= (135 + 45)) {
inv=inv.replace(invs[0], '' + Math.floor(eval(rectex.left * 0 + rectex.right * 1 + 0 * rectex.width / 2)));
} else if (theang >= (225 + 45) && theang <= (315 + 45)) {
inv=inv.replace(invs[0], '' + Math.floor(eval(rectex.left * 1 + rectex.right * 0 + 0 * rectex.width / 2)));
} else {
inv=inv.replace(invs[0], '' + Math.floor(eval(rectex.left * 0 + rectex.right * 1 + 0 * rectex.width / 2)));
}
invs=inv.split(',');
if (theang > (315 + 45) || theang <= (45 + 45)) {
inv=inv.replace(',' + invs[1].split(',')[0].split('.')[0], ',' + Math.floor(eval(rectex.top * 0 + rectex.bottom * 1 + 0 * rectex.height / 2)));
//alert('' + wasi + ' vs ' + inv + ' ' + invs.length);
} else if (theang >= (225 + 45) && theang <= (315 + 45)) {
inv=inv.replace(',' + invs[1].split(',')[0].split('.')[0], ',' + Math.floor(eval(rectex.top * 1 + rectex.bottom * 0 + 0 * rectex.height / 2)));
} else if (theang >= (45 + 45) && theang < (135 + 45)) {
inv=inv.replace(',' + invs[1].split(',')[0].split('.')[0], ',' + Math.floor(eval(rectex.top * 0 + rectex.bottom * 1 + 0 * rectex.height / 2)));
} else {
inv=inv.replace(',' + invs[1].split(',')[0].split('.')[0], ',' + Math.floor(eval(rectex.top * 1 + rectex.bottom * 0 + 0 * rectex.height / 2)));
}
//alert('was=' + wasi + ' and now=' + inv);
}

… that temporary div element text border drawing, being the crucial way to find out what was happening, and showing us, at least on Google Chrome web browser, not to worry so much about [element].getBoundingClientRect() results for transformed HTML elements. And that is a huge relief in itself.

Also taking up a lot of today, we shored up Image Map Event Editing results bubbling through to an email or SMS recipient. The size of this data, and an analysis of …

  • client pre-emptive iframe … versus …
  • Ajax methodologies

… when it comes to complex and sizeable data such as “Javascript scripting” is, we should start swinging towards Ajax thinking, even pinching it off a client pre-emptive iframe onload event logic thought/start sometimes …


var myxhr=null, rawhtml='';
var zhr=null, zform=null;

function stateChanged() {
if (myxhr.readyState == 4) {
if (myxhr.status == 200) {
console.log('myxhr=' + myxhr);
rawhtml = myxhr.responseText.replace(/\\"/g, '"').replace(/\\'/g, "'");
if (document.getElementById('jdiv')) {
//alert('1:' + rawhtml);
//alert('21111 ' + rawhtml.split('<scr')[1]);
document.getElementById('jdiv').innerHTML=rawhtml.split('<scr')[0]; //xaconto.body.innerHTML;
//alert(31111);
if (document.getElementById('talkimg')) {
document.getElementById('talkimg').useMap='#mymap';
} else {
document.getElementById('myvenn').useMap='#mymap';
}
//alert(41111);
} else {
document.body.innerHTML+=rawhtml.split('<scr')[0]; //xaconto.body.innerHTML;
if (document.getElementById('talkimg')) {
document.getElementById('talkimg').useMap='#mymap';
} else {
document.getElementById('myvenn').useMap='#mymap';
}
}
if (rawhtml.indexOf('<scr') != -1) {

if (1 == 1) {
var tag = document.createElement('script');
var nextsep=rawhtml.split('<scr')[1].split('>')[0] + '>';
//var qw=prompt(rawhtml.split('<scr')[1].split(nextsep)[1].split('</scri')[0],rawhtml.split('<scr')[1].split(nextsep)[1].split('</scri')[0]);
//alert('2:' + rawhtml.split('<scr')[1].split(nextsep)[1].split('</scri')[0]);
tag.innerHTML = rawhtml.split('<scr')[1].split(nextsep)[1].split('</scri')[0];
var firstScriptTag = document.getElementsByTagName('script')[eval(-1 + document.getElementsByTagName('script').length)];
firstScriptTag.insertAdjacentElement("afterend", tag);
}

}
}
}
}

function prehrefcheck(inso) {
if (obsuffix != '') {
zhr = new XMLHttpRequest();
zform = new FormData();
if (decodeURIComponent(obsuffix.replace('&thescript=','')).indexOf('<scr') == -1) {
zform.append('scrstuff', ('<scr' + 'ipt type="text/javascript"> ' + decodeURIComponent(obsuffix.replace('&thescript=','')) + ' </scr' + 'ipt>').replace(/\ \ \ /g, String.fromCharCode(9)).replace(/\+\=/g, ' += '));
} else {
zform.append('scrstuff', ('<scr' + decodeURIComponent(obsuffix.replace('&thescript=','')).split('<scr')[1]).replace(/\ \ \ /g, String.fromCharCode(9)).replace(/\+\=/g, ' += '));
}
if (jufr == '') {
jufr='_' + Math.floor(Math.random() * 19878675);
}
zform.append('ufr', jufr);
zhr.responseType='Document';
zhr.open('post', '//www.rjmprogramming.com.au/ITblog/' + Math.min(550,window.innerWidth) + '/' + Math.min(350,window.innerHeight) + '/?cht=' + ctype, true);
zhr.send(zform);
}
}

function sofarpj(iois) {
var aname='', partsare=[], ipis=0, areabits='', repfrom='', repto='', iv=0, variety=String.fromCharCode(10) + ' var variety=[]; ' + String.fromCharCode(10);
while (thescript.indexOf(' var variety' + ('' + iv).replace(/^0$/g, '') + '=') != -1) {
repfrom='[' + thescript.split(' var variety' + ('' + iv).replace(/^0$/g, '') + '=[')[1].split('];')[0] + '];';
iv++;
}
if (iv > 0) { variety=String.fromCharCode(10) + ' var variety' + iv + '=[]; ' + String.fromCharCode(10); }
if (iois.src != '') {
var aconto = (iois.contentWindow || iois.contentDocument);
if (aconto != null) {
if (aconto.document) { aconto = aconto.document; }
if (aconto.body.innerHTML.indexOf('<scr') != -1 || document.URL.indexOf('ufr=') != -1) {
if (document.URL.indexOf('ufr=') != -1) {
if (!document.getElementById('jdiv')) {
document.body.innerHTML+='<div id=jdiv></div>';
}
//thescript='';
myxhr = new XMLHttpRequest();
myxhr.open('GET', '//www.rjmprogramming.com.au/presentation' + (location.search.split('ufr=')[1] ? decodeURIComponent(location.search.split('ufr=')[1].split('&')[0]) : '') + '.html', true);
myxhr.responseType = "text";
myxhr.onreadystatechange=stateChanged;
myxhr.send(null);
} else if (aconto.body.innerHTML.indexOf('<scr') != -1) {

thescript='<scr' + aconto.body.innerHTML.split('<scr')[1];
var tag = document.createElement('script');
var nextsep=thescript.split('<scr')[1].split('>')[0] + '>';
tag.innerHTML = thescript.split('<scr')[1].split(nextsep)[1].split('</scri')[0];
var firstScriptTag = document.getElementsByTagName('script')[eval(-1 + document.getElementsByTagName('script').length)];
firstScriptTag.insertAdjacentElement("afterend", tag);
}
}
pjsbih=aconto.body.innerHTML.split('<scr')[0];
if (lastpjsbih != '' && pjsbih != lastpjsbih.replace(/\ $/g,'')) {
//alert('Found new Image Map data of ' + pjsbih);
// {"chartshape":[{"name":"axis0_0","type":"RECT","coords":[21,336,28,344]},{"name":"axis0_1","type":"RECT","coords":[65,336,77,344]},{"name":"axis0_2","type":"RECT","coords":[111,336,124,344]},{"name":"axis0_3","type":"RECT","coords":[158,336,170,344]},{"name":"axis0_4","type":"RECT","coords":[204,336,217,344]},{"name":"axis0_5","type":"RECT","coords":[251,336,263,344]},{"name":"axis0_6","type":"RECT","coords":[297,336,310,344]},{"name":"axis0_7","type":"RECT","coords":[344,336,356,344]},{"name":"axis0_8","type":"RECT","coords":[390,336,403,344]},{"name":"axis0_9","type":"RECT","coords":[437,336,449,344]},{"name":"axis0_10","type":"RECT","coords":[480,336,499,344]},{"name":"axis1_0","type":"RECT","coords":[14,326,20,334]},{"name":"axis1_1","type":"RECT","coords":[8,297,20,305]},{"name":"axis1_2","type":"RECT","coords":[8,267,20,275]},{"name":"axis1_3","type":"RECT","coords":[8,237,20,245]},{"name":"axis1_4","type":"RECT","coords":[8,208,20,216]},{"name":"axis1_5","type":"RECT","coords":[8,178,20,186]},{"name":"axis1_6","type":"RECT","coords":[8,148,20,156]},{"name":"axis1_7","type":"RECT","coords":[8,119,20,127]},{"name":"axis1_8","type":"RECT","coords":[8,89,20,97]},{"name":"axis1_9","type":"RECT","coords":[8,59,20,67]},{"name":"axis1_10","type":"RECT","coords":[2,29,20,37]},{"name":"legend0","type":"RECT","coords":[500,167,512,179]},{"name":"legend1","type":"RECT","coords":[500,185,512,197]},{"name":"circle0","type":"CIRCLE","coords":[80,39,4]},{"name":"circle1","type":"CIRCLE","coords":[429,152,1]},{"name":"circle2","type":"CIRCLE","coords":[373,250,3]},{"name":"circle3","type":"CIRCLE","coords":[215,230,4]},{"name":"circle4","type":"CIRCLE","coords":[131,164,2]},{"name":"circle5","type":"CIRCLE","coords":[471,96,5]},{"name":"circle6","type":"CIRCLE","coords":[341,158,3]},{"name":"circle7","type":"CIRCLE","coords":[355,111,5]},{"name":"circle8","type":"CIRCLE","coords":[183,277,3]},{"name":"circle9","type":"CIRCLE","coords":[66,105,3]}]}
if (pjsbih.replace(/\[\]/g, '').indexOf('[') != -1) {
partsare=pjsbih.split('","coords":[');
for (ipis=1; ipis<partsare.length; ipis++) {
if (partsare[eval(-1 + ipis)].split('"')[eval(-1 + partsare[eval(-1 + ipis)].split('"').length)] == 'RECT') {
aname=partsare[eval(-1 + ipis)].split('"name":"')[eval(-1 + partsare[eval(-1 + ipis)].split('"name":"').length)].split('"')[0];
if (variety.indexOf(aname.split('_')[0].split('0')[0].split('1')[0].split('2')[0].split('3')[0].split('4')[0].split('5')[0].split('6')[0].split('7')[0].split('8')[0].split('9')[0] + '/rect') == -1) {
if (variety.indexOf('[]') != -1) {
variety=variety.replace("[]", "['" + aname.split('_')[0].split('0')[0].split('1')[0].split('2')[0].split('3')[0].split('4')[0].split('5')[0].split('6')[0].split('7')[0].split('8')[0].split('9')[0] + '/rect' + "']");
} else {
variety=variety.replace("]", ",'" + aname.split('_')[0].split('0')[0].split('1')[0].split('2')[0].split('3')[0].split('4')[0].split('5')[0].split('6')[0].split('7')[0].split('8')[0].split('9')[0] + '/rect' + "']");
}
repto='[' + variety.split('[')[1].split('];')[0] + '];';
}
areabits+='<area onmousedown=defclick(event); ondblclick=defclick(event); oncontextmenu=defclick(event); ontouchend=defclick(event); ontouchstart=defclick(event); onmouseout=defclick(event); onmousemove=defclick(event); ontouchdown=defclick(event); onmouseover=defclick(event); shape="rect" coords="' + partsare[ipis].split(']')[0] + '" id="' + aname + '" name="' + aname + '" alt="' + aname + '" onclick="' + "youralert(this,'This feature name is " + aname + "'" + ');" nohref>';
} else if (partsare[eval(-1 + ipis)].split('"')[eval(-1 + partsare[eval(-1 + ipis)].split('"').length)] == 'CIRCLE') {
aname=partsare[eval(-1 + ipis)].split('"name":"')[eval(-1 + partsare[eval(-1 + ipis)].split('"name":"').length)].split('"')[0];
if (variety.indexOf(aname.split('_')[0].split('0')[0].split('1')[0].split('2')[0].split('3')[0].split('4')[0].split('5')[0].split('6')[0].split('7')[0].split('8')[0].split('9')[0] + '/circle') == -1) {
if (variety.indexOf('[]') != -1) {
variety=variety.replace("[]", "['" + aname.split('_')[0].split('0')[0].split('1')[0].split('2')[0].split('3')[0].split('4')[0].split('5')[0].split('6')[0].split('7')[0].split('8')[0].split('9')[0] + '/circle' + "']");
} else {
variety=variety.replace("]", ",'" + aname.split('_')[0].split('0')[0].split('1')[0].split('2')[0].split('3')[0].split('4')[0].split('5')[0].split('6')[0].split('7')[0].split('8')[0].split('9')[0] + '/circle' + "']");
}
repto='[' + variety.split('[')[1].split('];')[0] + '];';
}
areabits+='<area onmousedown=defclick(event); ondblclick=defclick(event); oncontextmenu=defclick(event); ontouchend=defclick(event); ontouchstart=defclick(event); onmouseout=defclick(event); onmousemove=defclick(event); ontouchdown=defclick(event); onmouseover=defclick(event); shape="circle" coords="' + partsare[ipis].split(']')[0] + '" id="' + aname + '" name="' + aname + '" alt="' + aname + '" onclick="' + "youralert(this,'This feature name is " + aname + "'" + ');" nohref>';
} else if (partsare[eval(-1 + ipis)].split('"')[eval(-1 + partsare[eval(-1 + ipis)].split('"').length)] == 'POLY') {
aname=partsare[eval(-1 + ipis)].split('"name":"')[eval(-1 + partsare[eval(-1 + ipis)].split('"name":"').length)].split('"')[0];
if (variety.indexOf(aname.split('_')[0].split('0')[0].split('1')[0].split('2')[0].split('3')[0].split('4')[0].split('5')[0].split('6')[0].split('7')[0].split('8')[0].split('9')[0] + '/poly') == -1) {
if (variety.indexOf('[]') != -1) {
variety=variety.replace("[]", "['" + aname.split('_')[0].split('0')[0].split('1')[0].split('2')[0].split('3')[0].split('4')[0].split('5')[0].split('6')[0].split('7')[0].split('8')[0].split('9')[0] + '/poly' + "']");
} else {
variety=variety.replace("]", ",'" + aname.split('_')[0].split('0')[0].split('1')[0].split('2')[0].split('3')[0].split('4')[0].split('5')[0].split('6')[0].split('7')[0].split('8')[0].split('9')[0] + '/poly' + "']");
}
repto='[' + variety.split('[')[1].split('];')[0] + '];';
}
areabits+='<area onmousedown=defclick(event); ondblclick=defclick(event); oncontextmenu=defclick(event); ontouchend=defclick(event); ontouchstart=defclick(event); onmouseout=defclick(event); onmousemove=defclick(event); ontouchdown=defclick(event); onmouseover=defclick(event); shape="poly" coords="' + partsare[ipis].split(']')[0] + '" id="' + aname + '" name="' + aname + '" alt="' + aname + '" onclick="' + "youralert(this,'This feature name is " + aname + "'" + ');" nohref>';
}
}
document.getElementById('mymap').innerHTML=areabits + '<area' + atend.split('<area')[1].split('>')[0] + '>'; //"<area onclick=defclick(event); shape='default' nohref>";
if (repto.replace('[];','') != '' && repfrom != '') { thescript=thescript.replace(repfrom, repto); } else if (thescript.indexOf('[' + variety.split('[')[1]) == -1) { thescript=thescript.replace('>', '>' + variety); }
origmap=document.getElementById('mymap').outerHTML + thescript;
}
} else if (lastpjsbih != '') {
//alert('Found the same ' + pjsbih);
if (pjsbih.replace(/\[\]/g, '').indexOf('[') != -1) {
partsare=pjsbih.split('","coords":[');
for (ipis=1; ipis<partsare.length; ipis++) {
if (partsare[eval(-1 + ipis)].split('"')[eval(-1 + partsare[eval(-1 + ipis)].split('"').length)] == 'RECT') {
aname=partsare[eval(-1 + ipis)].split('"name":"')[eval(-1 + partsare[eval(-1 + ipis)].split('"name":"').length)].split('"')[0];
if (variety.indexOf(aname.split('_')[0].split('0')[0].split('1')[0].split('2')[0].split('3')[0].split('4')[0].split('5')[0].split('6')[0].split('7')[0].split('8')[0].split('9')[0] + '/rect') == -1) {
if (variety.indexOf('[]') != -1) {
variety=variety.replace("[]", "['" + aname.split('_')[0].split('0')[0].split('1')[0].split('2')[0].split('3')[0].split('4')[0].split('5')[0].split('6')[0].split('7')[0].split('8')[0].split('9')[0] + '/rect' + "']");
} else {
variety=variety.replace("]", ",'" + aname.split('_')[0].split('0')[0].split('1')[0].split('2')[0].split('3')[0].split('4')[0].split('5')[0].split('6')[0].split('7')[0].split('8')[0].split('9')[0] + '/rect' + "']");
}
repto='[' + variety.split('[')[1].split('];')[0] + '];';
}
areabits+='<area onmousedown=defclick(event); ondblclick=defclick(event); oncontextmenu=defclick(event); ontouchend=defclick(event); ontouchstart=defclick(event); onmouseout=defclick(event); onmousemove=defclick(event); ontouchdown=defclick(event); onmouseover=defclick(event); shape="rect" coords="' + partsare[ipis].split(']')[0] + '" id="' + aname + '" name="' + aname + '" alt="' + aname + '" onclick="' + "youralert(this,'This feature name is " + aname + "'" + ');" nohref>';
} else if (partsare[eval(-1 + ipis)].split('"')[eval(-1 + partsare[eval(-1 + ipis)].split('"').length)] == 'CIRCLE') {
aname=partsare[eval(-1 + ipis)].split('"name":"')[eval(-1 + partsare[eval(-1 + ipis)].split('"name":"').length)].split('"')[0];
if (variety.indexOf(aname.split('_')[0].split('0')[0].split('1')[0].split('2')[0].split('3')[0].split('4')[0].split('5')[0].split('6')[0].split('7')[0].split('8')[0].split('9')[0] + '/circle') == -1) {
if (variety.indexOf('[]') != -1) {
variety=variety.replace("[]", "['" + aname.split('_')[0].split('0')[0].split('1')[0].split('2')[0].split('3')[0].split('4')[0].split('5')[0].split('6')[0].split('7')[0].split('8')[0].split('9')[0] + '/circle' + "']");
} else {
variety=variety.replace("]", ",'" + aname.split('_')[0].split('0')[0].split('1')[0].split('2')[0].split('3')[0].split('4')[0].split('5')[0].split('6')[0].split('7')[0].split('8')[0].split('9')[0] + '/circle' + "']");
}
repto='[' + variety.split('[')[1].split('];')[0] + '];';
}
areabits+='<area onmousedown=defclick(event); ondblclick=defclick(event); oncontextmenu=defclick(event); ontouchend=defclick(event); ontouchstart=defclick(event); onmouseout=defclick(event); onmousemove=defclick(event); ontouchdown=defclick(event); onmouseover=defclick(event); shape="circle" coords="' + partsare[ipis].split(']')[0] + '" id="' + aname + '" name="' + aname + '" alt="' + aname + '" onclick="' + "youralert(this,'This feature name is " + aname + "'" + ');" nohref>';
} else if (partsare[eval(-1 + ipis)].split('"')[eval(-1 + partsare[eval(-1 + ipis)].split('"').length)] == 'POLY') {
aname=partsare[eval(-1 + ipis)].split('"name":"')[eval(-1 + partsare[eval(-1 + ipis)].split('"name":"').length)].split('"')[0];
if (variety.indexOf(aname.split('_')[0].split('0')[0].split('1')[0].split('2')[0].split('3')[0].split('4')[0].split('5')[0].split('6')[0].split('7')[0].split('8')[0].split('9')[0] + '/poly') == -1) {
if (variety.indexOf('[]') != -1) {
variety=variety.replace("[]", "['" + aname.split('_')[0].split('0')[0].split('1')[0].split('2')[0].split('3')[0].split('4')[0].split('5')[0].split('6')[0].split('7')[0].split('8')[0].split('9')[0] + '/poly' + "']");
} else {
variety=variety.replace("]", ",'" + aname.split('_')[0].split('0')[0].split('1')[0].split('2')[0].split('3')[0].split('4')[0].split('5')[0].split('6')[0].split('7')[0].split('8')[0].split('9')[0] + '/poly' + "']");
}
repto='[' + variety.split('[')[1].split('];')[0] + '];';
}
areabits+='<area onmousedown=defclick(event); ondblclick=defclick(event); oncontextmenu=defclick(event); ontouchend=defclick(event); ontouchstart=defclick(event); onmouseout=defclick(event); onmousemove=defclick(event); ontouchdown=defclick(event); onmouseover=defclick(event); shape="poly" coords="' + partsare[ipis].split(']')[0] + '" id="' + aname + '" name="' + aname + '" alt="' + aname + '" onclick="' + "youralert(this,'This feature name is " + aname + "'" + ');" nohref>';
}
}
document.getElementById('mymap').innerHTML=areabits + '<area' + atend.split('<area')[1].split('>')[0] + '>'; //"<area onclick=defclick(event); shape='default' nohref>";
if (repto.replace('[];','') != '' && repfrom != '') { thescript=thescript.replace(repfrom, repto); } else if (thescript.indexOf('[' + variety.split('[')[1]) == -1) { thescript=thescript.replace('>', '>' + variety); }
origmap=document.getElementById('mymap').outerHTML + thescript;
}
}
lastpjsbih=pjsbih;
}
}
}


cimg=new Image;

cimg.onload = function(){
var honebit="<h2><span onclick=\"location.href=document.URL.split('?')[0].split('#')[0];\" title=Reset style=cursor:pointer;>Interfacing</span> to <a target=_blank href='https://developers.google.com/chart/interactive/docs/index' title='Google Chart Tools provide a perfect way to visualize data on your website. From simple line charts to complex hierarchical tree maps, the chart galley provides a large number of well-designed chart types. Populating your data is easy using the provided client- and server-side tools.'>Google Charts</a> <a target=_blank title='Google Charts Image Chart' href='https://developers.google.com/chart/image/docs/gallery/chart_gall'>Image Chart</a></h2><h4 id=myh3>RJM Programming - November, 2023</h4>";
var hthreebit="";
document.body.style.backgroundColor='transparent';
document.body.innerHTML=agscript.replace("'';", "'" + cht.replace('_','') + "';").replace('<canvas ','<canvas width=' + cimg.width + ' height=' + cimg.height + ' ') + "<table><tr><td><img style='border-right:1px dotted pink;border-bottom:1px dotted pink;' ondblclick=\"window.open(document.URL.split('?')[0].split('#')[0],'_blank','top=50,left=50,width=600,height=600');\" title='Talk image that will update over time (double click for Google Chart Image Chart interfacing) ... " + ("" + (new Date())) + "' id=talkimg src='" + cimg.src + "?rand=" + Math.floor(Math.random() * 198786754) + "' usemap='#mymap'></img></td><td id=tdtr style=\"opacity:0.0;background-image:url(" + cimg.src.replace('presentation_', 'presentation__') + "),url(" + cimg.src + "?rand=0);background-position:0% 0%,50% 0%;background-size:50% 50%,50% 50%;background-repeat:no-repeat,no-repeat;\"></td></tr><tr><td id=tdbl>" + honebit + hthreebit + "</td><td><img style='border-right:1px dotted pink;border-bottom:1px dotted pink;' ondblclick=\"window.open(document.URL.split('?')[0].split('#')[0],'_blank','top=50,left=50,width=600,height=600');\" title='Talk first and last images that will update over time (double click for Google Chart Image Chart interfacing) ... " + ("" + (new Date())) + "' id=talkimgg src='" + cimg.src.replace('.png','.gif') + "?rand=" + Math.floor(Math.random() * 198786754) + "'></img></td></tr></table><div id=idiv></div><iframe onload=mapsofarpj(this); id=mappjs style=display:none; src=></iframe><div id=jdiv></div>";
document.body.style.cursor='progress';
if (cht.substring(0,1) == '_') {
//alert('//www.rjmprogramming.com.au/presentation' + cht + '.html_GETME');
if (1 == 1) {
myxhr = new XMLHttpRequest();
myxhr.open('GET', '//www.rjmprogramming.com.au/presentation' + cht + '.html', true);
myxhr.responseType = "text";
myxhr.onreadystatechange=stateChanged;
myxhr.send(null);
} else {

document.getElementById('mappjs').src='//www.rjmprogramming.com.au/presentation' + cht + '.html';
}
setTimeout(canvinit, 5000);
}
setTimeout(talkupdate, eightthousand);
};

cimg.src='//www.rjmprogramming.com.au/presentation' + cht + '.png';
return '';
}

… in the changed latest draft image_venn.html Google Chart Image Chart Venn Chart or Scatter Chart or GraphViz Chart or Pie Chart or Line Chart or Bar Chart or Candlestick/Box Chart or Google-O-Meter Chart or Radar Chart or Map Chart interfacing web application you can also try below.


Previous relevant Google Chart Image Chart Image Map Event Editing Tutorial is shown below.

Google Chart Image Chart Image Map Event Editing Tutorial

Google Chart Image Chart Image Map Event Editing Tutorial

If we are talking “layers” (of functionality) again, onto the progress that yesterday’s Google Chart Image Chart Image Map Events Tutorial represented, then , it is logical …

  • that if yesterday we presented some programmer defined image map event logic … then, today, we’d want to …
  • offer the user the chance to change that default programmer defined image map event logic, to that of their own design

… in the form of

  • user defined Javascript .. editable in a …
  • HTML textarea element

… and then the coding latching onto a document.createElement(‘script’) paradigm, to add Javascript clientside logic, on the fly.

There’s a first time we can remember aspect to how we present these possibilities to the user. We present it in …

  • amongst the inhouse annotation options … as a …
  • “reveal” pairing of HTML5 details/summary element combination look … the first time we can remember aspect to that being …
  • only initially displaying within the details element innerHTML is a summary element nesting a single “icon like” image (like the other “inhouse annotation” icon images) … but if clicked …
  • the details innerHTML has added to it a textarea element …

    function fillindetsed(odet) {
    if (odet.innerHTML.split('</summary>')[1] == '') {
    document.getElementById('tdleft').style.verticalAlign='top';
    var onls=thescript.split('<scr' + 'ipt type="text/javascript">');
    var onlstuff=onls[1].split('</sc' + 'ript>')[0];
    odet.innerHTML+='<scr' + 'ipt type="text/javascript">' + "<br><textarea onblur=tproc(this); id=tscript rows=100 cols=80 value=''>" + onlstuff + "</textarea><br></script>";
    //odet.innerHTML+='<scr' + 'ipt type="text/javascript">' + "<br><textarea onblur=tproc(this); id=tscript rows=100 cols=80 value=''>" + encodeURIComponent(onlstuff) + "</textarea><br></script>";
    //document.getElementById('tscript').value=decodeURIComponent(document.getElementById('tscript').innerHTML);
    }
    }

… from which document.createElement(‘script’) code onblur event logic emanates …


function tproc(ota) {
//alert(ota.value);
var tag = document.createElement('script');
if (1 == 1) {
obsuffix='&thescript=' + encodeURIComponent(ota.value);
if (document.getElementById('aemail')) {
hrefcheck(document.getElementById('aemail'));
}
//alert('<scr' + 'ipt type="text/javascript"> ' + String.fromCharCode(10) + ota.value + String.fromCharCode(10) + ' </scr' + 'ipt>');
tag.innerHTML = ' <scr'.substring(0,1) + 'ipt type="text/javascript"> '.slice(-1) + String.fromCharCode(10) + ota.value + String.fromCharCode(10) + ' </scr'.substring(0,1) + 'ipt> '.slice(-1);
document.getElementById('dmap').innerHTML=document.getElementById('mymap').outerHTML + ' <scr' + 'ipt type="text/javascript"> ' + String.fromCharCode(10) + ota.value + String.fromCharCode(10) + ' </scr' + 'ipt> ';
}
var firstScriptTag = document.getElementsByTagName('script')[eval(-1 + document.getElementsByTagName('script').length)];
//alert(tag.outerHTML);
firstScriptTag.insertAdjacentElement("afterend", tag);
//alert(ota.value);
document.getElementById('detsed').open=false;
}

… in the changed latest draft image_venn.html Google Chart Image Chart Venn Chart or Scatter Chart or GraphViz Chart or Pie Chart or Line Chart or Bar Chart or Candlestick/Box Chart or Google-O-Meter Chart or Radar Chart or Map Chart interfacing web application you can also try below.


Previous relevant Google Chart Image Chart Image Map Events Tutorial is shown below.

Google Chart Image Chart Image Map Events Tutorial

Google Chart Image Chart Image Map Events Tutorial

We really like HTML image maps, and it occurred to us with yesterday’s Google Chart Image Chart Image Map Tutorial we were hiding its light under some bushel somewhere, because …

  • yesterday we introduced with only the onclick event coded for in the HTML area subelements to the map parent element … linked to an …
  • associated img element … via an …
  • attribute called usemap … and two aspects, at the very least, to stuff under the bushel are …
    1. many more events than onclick can be defined as you define the area subelements … and here’s the kicker …
    2. you can add area subelement event logic that, on paper, would cause interference with other event logic (ie. the same event type in an event bubbling through scenario) but it won’t if you, as a programmer, turn that use of the usemap attribute on and off like a tap

… which, to our mind, represents the bee’s knees of event management. So useful!

To tip our toes into this woooorrrrrlllllddd we’ll show you some newly added area subelement event logics in a Google Chart Image Chart Radar Chart example below …


<map name="mymap" id="mymap"><area onmousedown="defclick(event);" ondblclick="defclick(event);" oncontextmenu="defclick(event);" ontouchend="defclick(event);" ontouchstart="defclick(event);" onmouseout="defclick(event);" onmousemove="defclick(event);" ontouchdown="defclick(event);" onmouseover="defclick(event);" shape="rect" coords="151,34,157,42" id="axis0_0" name="axis0_0" alt="axis0_0" onclick="youralert(this,'This feature name is axis0_0');" nohref=""><area onmousedown="defclick(event);" ondblclick="defclick(event);" oncontextmenu="defclick(event);" ontouchend="defclick(event);" ontouchstart="defclick(event);" onmouseout="defclick(event);" onmousemove="defclick(event);" ontouchdown="defclick(event);" onmouseover="defclick(event);" shape="rect" coords="281,110,288,118" id="axis0_1" name="axis0_1" alt="axis0_1" onclick="youralert(this,'This feature name is axis0_1');" nohref=""><area onmousedown="defclick(event);" ondblclick="defclick(event);" oncontextmenu="defclick(event);" ontouchend="defclick(event);" ontouchstart="defclick(event);" onmouseout="defclick(event);" onmousemove="defclick(event);" ontouchdown="defclick(event);" onmouseover="defclick(event);" shape="rect" coords="281,260,288,268" id="axis0_2" name="axis0_2" alt="axis0_2" onclick="youralert(this,'This feature name is axis0_2');" nohref=""><area onmousedown="defclick(event);" ondblclick="defclick(event);" oncontextmenu="defclick(event);" ontouchend="defclick(event);" ontouchstart="defclick(event);" onmouseout="defclick(event);" onmousemove="defclick(event);" ontouchdown="defclick(event);" onmouseover="defclick(event);" shape="rect" coords="151,336,157,344" id="axis0_3" name="axis0_3" alt="axis0_3" onclick="youralert(this,'This feature name is axis0_3');" nohref=""><area onmousedown="defclick(event);" ondblclick="defclick(event);" oncontextmenu="defclick(event);" ontouchend="defclick(event);" ontouchstart="defclick(event);" onmouseout="defclick(event);" onmousemove="defclick(event);" ontouchdown="defclick(event);" onmouseover="defclick(event);" shape="rect" coords="20,260,27,268" id="axis0_4" name="axis0_4" alt="axis0_4" onclick="youralert(this,'This feature name is axis0_4');" nohref=""><area onmousedown="defclick(event);" ondblclick="defclick(event);" oncontextmenu="defclick(event);" ontouchend="defclick(event);" ontouchstart="defclick(event);" onmouseout="defclick(event);" onmousemove="defclick(event);" ontouchdown="defclick(event);" onmouseover="defclick(event);" shape="rect" coords="20,110,27,118" id="axis0_5" name="axis0_5" alt="axis0_5" onclick="youralert(this,'This feature name is axis0_5');" nohref=""><area id="adef" onclick=" defclick(event); if (!done) { done=false; if (atstart) { normalcall=false; ask(null); normalcall=true; atstart=false; } else { ask(event); } } "
shape="default" nohref=""></map>

… with new relevant event code snippet to help add intelligence to the event logic of our Google Chart Image Chart interfacing web application …


function defclick(evt) {
switch ('' + evt.type) {
case 'click':

alert('Welcome to RJM Programming interfacing to Google Charts Image Chart ' + cname);
break;

default:
switch (('' + evt.type + ' ').substring(0,5)) {
case 'mouse':
document.getElementById('myh3').innerHTML='RJM Programming - November, 2023 ... non-mobile mouse event ' + evt.type + ' called by ' + ('' + evt.target.id);
break;

case 'touch':
document.getElementById('myh3').innerHTML='RJM Programming - November, 2023 ... mobile touch event ' + evt.type + ' called by ' + ('' + evt.target.id);
break;

default:
alert(evt.type);
break;
}
break;
}

}

Interesting, huh?!

Feel free to try this out in the changed latest draft image_venn.html Google Chart Image Chart Venn Chart or Scatter Chart or GraphViz Chart or Pie Chart or Line Chart or Bar Chart or Candlestick/Box Chart or Google-O-Meter Chart or Radar Chart or Map Chart interfacing web application you can also try below.


Previous relevant Google Chart Image Chart Image Map Tutorial is shown below.

Google Chart Image Chart Image Map Tutorial

Google Chart Image Chart Image Map Tutorial

Do you like to come at explaining things in layers? Sort of like the analogy …

  • you start a project thinking of it in terms of “2D” … and then to move forward …
  • you spend a day making it work for “3D” (and keep the “2D” working as well)

… or …

  • you start a web application project thinking of only working via a URL entered on the web browser address bar … and then to move forward …
  • you spend a day making it work for serving the same purpose and/or a difference purpose called within an HTML iframe (and keep it working for the address bar way as well)

And so we look at a “picturesque” but “kinda dumb” (as far as “action items” go) image we have coming off the interfacing to Google Charts Image Chart. Where can we go here? Well, it would be kind of you to take it to the beach, but that’s not always a possibility now, is it?! Were you pulling my leg?! Tee hee. No, we were thinking … oh no … we have a bad feeling about this … let’s open it up to the class … anyone, anyone? Yes, Louis, would you and Auguste like to share with the class what is so amusing to you?

.
.
.
.
.
.
.
.
.
.
.
.
.
.
.

Okay, thank you for your thoughts on this, and yes, you could take the “picture” to “a picture show”. Yes, very droll, indeed. Any other ideas? Okay, Johann, you say the idea just “clicked” with you. This sounds promising. Go on …

.
.
.
.
.
.
.
.
.
.
.
.
.
.
.

Indeed, a young “picturesque” might like to go tap dancing, that is true. Sheeeeesh! But given the lesson is a Computing one, rather than Drama or Dance or Music or the Arts, maybe we would be looking for a way to use the picture in an enhanced way. Okay Kevin, we’ll try you. What do you think?

.
.
.
.
.
.
.
.
.
.
.
.
.
.
.
.
.
.
.
.
.
.
.
.
.
.
.
.
.
.

Frankly, we are flabbergasted! It’s as if you invented HTML image maps (as a way to add position based event logic), or something … 93/4 points to Gryffindor!

Yes, helping out we image map enthusiasts regarding interfacing to Google Charts Image Charts is Google’s Image Map creation helping Json output tool. From that help, we can …

  • at the demonstrator’s webpage, create an Image Map … and as the user requires …
  • at the uniquifier definition phase of our WordPress 404.php’s contribution we accept the demonstrator’s image map HTML, and save it to a public resource
    <?php

    if (isset($_POST['canvcont'])) {
    if (isset($_POST['uniquifier'])) {
    $uniquifier=str_replace('+',' ',urldecode($_POST['uniquifier']));
    }
    if ($uniquifier == '') {
    $uniquifier='_' . rand(0,78654356);
    file_put_contents($_SERVER['DOCUMENT_ROOT'] . DIRECTORY_SEPARATOR . "presentation" . $uniquifier . ".png", base64_decode( explode('base64,', str_replace(' ','+',urldecode($_POST['canvcont'])))[1]));
    file_put_contents($_SERVER['DOCUMENT_ROOT'] . DIRECTORY_SEPARATOR . "presentation_" . $uniquifier . ".png", base64_decode( explode('base64,', str_replace(' ','+',urldecode($_POST['canvcont'])))[1]));
    file_put_contents($_SERVER['DOCUMENT_ROOT'] . DIRECTORY_SEPARATOR . "presentation__" . $uniquifier . ".png", base64_decode( explode('base64,', str_replace(' ','+',urldecode($_POST['canvcont'])))[1]));
    if (isset($_POST['mapstuff'])) {
    file_put_contents($_SERVER['DOCUMENT_ROOT'] . DIRECTORY_SEPARATOR . "presentation" . $uniquifier . ".html", '<html><body>' . str_replace('+',' ',urldecode($_POST['mapstuff'])) . '</body></html>');
    }

    exec("/usr/local/cpanel/3rdparty/bin/convert -delay 20 -loop 0 " . $_SERVER['DOCUMENT_ROOT'] . DIRECTORY_SEPARATOR . "presentation" . $uniquifier . ".png" . " " . $_SERVER['DOCUMENT_ROOT'] . DIRECTORY_SEPARATOR . "presentation" . $uniquifier . ".gif");
    echo "<html><body onload=\"if (parent.document.getElementById('uniquifier')) { if (parent.document.getElementById('uniquifier').value == '') { parent.document.getElementById('uniquifier').value='" . $uniquifier . "'; } }\"></body></html>";
    } else {
    file_put_contents($_SERVER['DOCUMENT_ROOT'] . DIRECTORY_SEPARATOR . "presentation" . $uniquifier . ".png", base64_decode( explode('base64,', str_replace(' ','+',urldecode($_POST['canvcont'])))[1]));
    if (file_exists($_SERVER['DOCUMENT_ROOT'] . DIRECTORY_SEPARATOR . "presentation__" . $uniquifier . ".png")) {
    $middelay='';
    $enddelay='';
    if (filesize($_SERVER['DOCUMENT_ROOT'] . DIRECTORY_SEPARATOR . "presentation__" . $uniquifier . ".png") < filesize($_SERVER['DOCUMENT_ROOT'] . DIRECTORY_SEPARATOR . "presentation_" . $uniquifier . ".png")) {
    $middelay=' -delay 800 ';
    $enddelay=' -delay 800 ';
    }
    exec("rm -f " . $_SERVER['DOCUMENT_ROOT'] . DIRECTORY_SEPARATOR . "presentation" . $uniquifier . ".gif ; /usr/local/cpanel/3rdparty/bin/convert -delay 600 -loop 0 " . $_SERVER['DOCUMENT_ROOT'] . DIRECTORY_SEPARATOR . "presentation_" . $uniquifier . ".png " . $middelay . $_SERVER['DOCUMENT_ROOT'] . DIRECTORY_SEPARATOR . "presentation__" . $uniquifier . ".png " . $enddelay . $_SERVER['DOCUMENT_ROOT'] . DIRECTORY_SEPARATOR . "presentation" . $uniquifier . ".png" . " " . $_SERVER['DOCUMENT_ROOT'] . DIRECTORY_SEPARATOR . "presentation" . $uniquifier . ".gif");
    } else {
    exec("rm -f " . $_SERVER['DOCUMENT_ROOT'] . DIRECTORY_SEPARATOR . "presentation" . $uniquifier . ".gif ; /usr/local/cpanel/3rdparty/bin/convert -delay 200 -loop 0 " . $_SERVER['DOCUMENT_ROOT'] . DIRECTORY_SEPARATOR . "presentation_" . $uniquifier . ".png " . $_SERVER['DOCUMENT_ROOT'] . DIRECTORY_SEPARATOR . "presentation" . $uniquifier . ".png" . " " . $_SERVER['DOCUMENT_ROOT'] . DIRECTORY_SEPARATOR . "presentation" . $uniquifier . ".gif");
    }
    }
    exit;
    }

    ?>
  • helping keep the image mapping going, even if the Image Chart is …
    1. shared via email or SMS … and/or …
    2. forms the basis of a Broadcast Talk demonstration session

We could use Ajax techniques for the Javascript client ways an emailee’s link’s webpage invocation can use this new resource, but we kind of like “client pre-emptive iframe” onload event thinking, for both sides of the ledger, to get this going, as per …


function htmlDecode(input) { // thanks to https://stackoverflow.com/questions/1912501/unescape-html-entities-in-javascript
var e = document.createElement('textarea');
e.innerHTML = input;
// handle case of empty input
return e.childNodes.length === 0 ? "" : e.childNodes[0].nodeValue;
}

function mapsofarpj(xiois) {
//alert(('' + xiois.src));
if (xiois.src != '' && ('' + xiois.src).indexOf('presentation') != -1) {
//alert(('' + xiois.src));
var xaconto = (xiois.contentWindow || xiois.contentDocument);
//alert(11);
if (xaconto != null) {
//alert(111);
if (xaconto.document) { xaconto = xaconto.document; }
//alert(1111);
if (xaconto.body.innerHTML.indexOf('<map') != -1) {
var ihis=xaconto.body.innerHTML;
//while (ihis.indexOf('\"') != -1) {
// ihis=ihis.replace('\"', '')
//}
ihis=htmlDecode(ihis).replace(/\\"/g,'').replace(/\\'/g,"'").replace(/\=\"\"/g,'').replace(/This\"/g,"This").replace(/\;\ nohref/g, ';" nohref');
//alert(ihis);
if (document.getElementById('jdiv')) {
//alert(21111);
document.getElementById('jdiv').innerHTML=ihis; //xaconto.body.innerHTML;
//alert(31111);
document.getElementById('talkimg').useMap='#mymap';
//alert(41111);
} else {
document.body.innerHTML+=ihis; //xaconto.body.innerHTML;
document.getElementById('talkimg').useMap='#mymap';
}
}
}
}
}

function sofarpj(iois) {
var aname='', partsare=[], ipis=0, areabits='';
if (iois.src != '') {
var aconto = (iois.contentWindow || iois.contentDocument);
if (aconto != null) {
if (aconto.document) { aconto = aconto.document; }
pjsbih=aconto.body.innerHTML;
if (lastpjsbih != '' && pjsbih != lastpjsbih.replace(/\ $/g,'')) {
//alert('Found new Image Map data of ' + pjsbih);
// {"chartshape":[{"name":"axis0_0","type":"RECT","coords":[21,336,28,344]},{"name":"axis0_1","type":"RECT","coords":[65,336,77,344]},{"name":"axis0_2","type":"RECT","coords":[111,336,124,344]},{"name":"axis0_3","type":"RECT","coords":[158,336,170,344]},{"name":"axis0_4","type":"RECT","coords":[204,336,217,344]},{"name":"axis0_5","type":"RECT","coords":[251,336,263,344]},{"name":"axis0_6","type":"RECT","coords":[297,336,310,344]},{"name":"axis0_7","type":"RECT","coords":[344,336,356,344]},{"name":"axis0_8","type":"RECT","coords":[390,336,403,344]},{"name":"axis0_9","type":"RECT","coords":[437,336,449,344]},{"name":"axis0_10","type":"RECT","coords":[480,336,499,344]},{"name":"axis1_0","type":"RECT","coords":[14,326,20,334]},{"name":"axis1_1","type":"RECT","coords":[8,297,20,305]},{"name":"axis1_2","type":"RECT","coords":[8,267,20,275]},{"name":"axis1_3","type":"RECT","coords":[8,237,20,245]},{"name":"axis1_4","type":"RECT","coords":[8,208,20,216]},{"name":"axis1_5","type":"RECT","coords":[8,178,20,186]},{"name":"axis1_6","type":"RECT","coords":[8,148,20,156]},{"name":"axis1_7","type":"RECT","coords":[8,119,20,127]},{"name":"axis1_8","type":"RECT","coords":[8,89,20,97]},{"name":"axis1_9","type":"RECT","coords":[8,59,20,67]},{"name":"axis1_10","type":"RECT","coords":[2,29,20,37]},{"name":"legend0","type":"RECT","coords":[500,167,512,179]},{"name":"legend1","type":"RECT","coords":[500,185,512,197]},{"name":"circle0","type":"CIRCLE","coords":[80,39,4]},{"name":"circle1","type":"CIRCLE","coords":[429,152,1]},{"name":"circle2","type":"CIRCLE","coords":[373,250,3]},{"name":"circle3","type":"CIRCLE","coords":[215,230,4]},{"name":"circle4","type":"CIRCLE","coords":[131,164,2]},{"name":"circle5","type":"CIRCLE","coords":[471,96,5]},{"name":"circle6","type":"CIRCLE","coords":[341,158,3]},{"name":"circle7","type":"CIRCLE","coords":[355,111,5]},{"name":"circle8","type":"CIRCLE","coords":[183,277,3]},{"name":"circle9","type":"CIRCLE","coords":[66,105,3]}]}
if (pjsbih.replace(/\[\]/g, '').indexOf('[') != -1) {
partsare=pjsbih.split('","coords":[');
for (ipis=1; ipis<partsare.length; ipis++) {
if (partsare[eval(-1 + ipis)].split('"')[eval(-1 + partsare[eval(-1 + ipis)].split('"').length)] == 'RECT') {
aname=partsare[eval(-1 + ipis)].split('"name":"')[eval(-1 + partsare[eval(-1 + ipis)].split('"name":"').length)].split('"')[0];
areabits+='<area shape="rect" coords="' + partsare[ipis].split(']')[0] + '" alt="' + aname + '" onclick="' + "alert('This feature name is " + aname + "'" + ');" nohref>';
} else if (partsare[eval(-1 + ipis)].split('"')[eval(-1 + partsare[eval(-1 + ipis)].split('"').length)] == 'CIRCLE') {
aname=partsare[eval(-1 + ipis)].split('"name":"')[eval(-1 + partsare[eval(-1 + ipis)].split('"name":"').length)].split('"')[0];
areabits+='<area shape="circle" coords="' + partsare[ipis].split(']')[0] + '" alt="' + aname + '" onclick="' + "alert('This feature name is " + aname + "'" + ');" nohref>';
} else if (partsare[eval(-1 + ipis)].split('"')[eval(-1 + partsare[eval(-1 + ipis)].split('"').length)] == 'POLY') {
aname=partsare[eval(-1 + ipis)].split('"name":"')[eval(-1 + partsare[eval(-1 + ipis)].split('"name":"').length)].split('"')[0];
areabits+='<area shape="poly" coords="' + partsare[ipis].split(']')[0] + '" alt="' + aname + '" onclick="' + "alert('This feature name is " + aname + "'" + ');" nohref>';
}
}
document.getElementById('mymap').innerHTML=areabits + '<area' + atend.split('<area')[1].split('>')[0] + '>'; //"<area onclick=defclick(event); shape='default' nohref>";
origmap=document.getElementById('mymap').outerHTML;
}
} else if (lastpjsbih != '') {
//alert('Found the same ' + pjsbih);
if (pjsbih.replace(/\[\]/g, '').indexOf('[') != -1) {
partsare=pjsbih.split('","coords":[');
for (ipis=1; ipis<partsare.length; ipis++) {
if (partsare[eval(-1 + ipis)].split('"')[eval(-1 + partsare[eval(-1 + ipis)].split('"').length)] == 'RECT') {
aname=partsare[eval(-1 + ipis)].split('"name":"')[eval(-1 + partsare[eval(-1 + ipis)].split('"name":"').length)].split('"')[0];
areabits+='<area shape="rect" coords="' + partsare[ipis].split(']')[0] + '" alt="' + aname + '" onclick="' + "alert('This feature name is " + aname + "'" + ');" nohref>';
} else if (partsare[eval(-1 + ipis)].split('"')[eval(-1 + partsare[eval(-1 + ipis)].split('"').length)] == 'CIRCLE') {
aname=partsare[eval(-1 + ipis)].split('"name":"')[eval(-1 + partsare[eval(-1 + ipis)].split('"name":"').length)].split('"')[0];
areabits+='<area shape="circle" coords="' + partsare[ipis].split(']')[0] + '" alt="' + aname + '" onclick="' + "alert('This feature name is " + aname + "'" + ');" nohref>';
} else if (partsare[eval(-1 + ipis)].split('"')[eval(-1 + partsare[eval(-1 + ipis)].split('"').length)] == 'POLY') {
aname=partsare[eval(-1 + ipis)].split('"name":"')[eval(-1 + partsare[eval(-1 + ipis)].split('"name":"').length)].split('"')[0];
areabits+='<area shape="poly" coords="' + partsare[ipis].split(']')[0] + '" alt="' + aname + '" onclick="' + "alert('This feature name is " + aname + "'" + ');" nohref>';
}
}
document.getElementById('mymap').innerHTML=areabits + '<area' + atend.split('<area')[1].split('>')[0] + '>'; //"<area onclick=defclick(event); shape='default' nohref>";
origmap=document.getElementById('mymap').outerHTML;
}
}
lastpjsbih=pjsbih;
}
}
}

… further to yesterday’s Google Chart Image Chart Dynamic Icons Tutorial in the changed latest draft image_venn.html Google Chart Image Chart Venn Chart or Scatter Chart or GraphViz Chart or Pie Chart or Line Chart or Bar Chart or Candlestick/Box Chart or Google-O-Meter Chart or Radar Chart or Map Chart interfacing web application you can also try below.


Previous relevant Google Chart Image Chart Dynamic Icons Tutorial is shown below.

Google Chart Image Chart Dynamic Icons Tutorial

Google Chart Image Chart Dynamic Icons Tutorial

Does statistics have to be staid and boring? Kitch and quiche?! Welcome to the wooorrrlllddd of Google Charts Image Chart Dynamic Icons!

Think of Dynamic Icons as a way to decorate one or more data points displayed in one of …

  • Line Chart
  • Bar Chart
  • Map Chart
  • Radar Chart

We had that certain “Wow! factor going as we remembered our state’s motto from some years back, and we tried out the Map Chart to see whether we could embellish the map with a Dynamic Icon relevant to New South Wales, as you can see with today’s tutorial picture.

We’ll show you the most recent snapshot of Javascript parameters a little later, but the change for this is an optional one up to the user to work out, with prompts such as the Map Chart one updated

Enter vertical bar separated country ISO Country and/or Region Code list. Please note that optional Dynamic Icons are available via a suffixing string example applied to the second data point such as &chem=y;s=bubble_icon_text_small;d=ski,bb,NSW%20State%20of%20Wow!,FFFFFF;dp=1;ds=0 eg. AU-NT|AU-NSW|AU-SA|NZ|IN’

And here is its relevance in a new snapshot of parameterizations …


var prefixandon='';
var dtextis='dtext';
var pretherest='';
var newtherest='';
var tmod='';
var colchange='';
var cht=location.search.split('cht=')[1] ? decodeURIComponent(location.search.split('cht=')[1].split('&')[0]) : "v";
if ((cht + ' ').substring(0,1) == 'p' && cht != 'p') { pretherest=cht.substring(1); }
//if ((cht + ' ').substring(0,2) == 'bv' && cht != 'bv') { pretherest=cht.substring(2); if (1 == 1) { cht='bv'; } }
if ((cht + ' ').substring(0,1) == 'bv'.substring(0,1) && cht != 'bv'.substring(0,1)) { pretherest=cht.substring(1); if (1 == 1) { cht='bv'.substring(0,1); } }
if ((cht + ' ').substring(0,1) == 'l' && cht != 'l') { pretherest=cht.substring(1); if (1 == 1) { cht='l'; } }
if ((cht + ' ').substring(0,1) == 'r' && cht != 'r') { pretherest=cht.substring(1); if (1 == 1) { cht='r'; } }
var ccode=location.search.split('chld=')[1] ? decodeURIComponent(location.search.split('chld=')[1].split('&')[0]) : "";
var ctype=location.search.split('type=')[1] ? decodeURIComponent(location.search.split('type=')[1].split('&')[0]) : cht;
var cname=(ctype == 'v' ? 'Venn Chart' : (ctype == 's' ? 'Scatter Chart' : (ctype == 'gv' ? 'GraphViz Chart' :
(ctype.substring(0,1) == 'p' ? 'Pie Chart' :
((ctype + ' ').substring(0,2).substring(0,1) == 'bv'.substring(0,1) ? 'Bar Chart' : (ctype.substring(0,1) == 'l' ? 'Line Chart' :
(ctype == 'map' ? 'Map Chart' :
(ctype == 'gom' ? 'Google-O-Meter Chart' :
(ctype == 'r' ? 'Radar Chart' :
'')))))))));
var cencodename=(ctype == 'v' ? 'Venn%20Diagram' : (ctype == 's' ? 'Scatter%20Chart' : (ctype == 'gv' ? 'GraphViz%20Chart' :
(ctype.substring(0,1) == 'p' ? 'Pie%20Chart' :
((ctype + ' ').substring(0,2).substring(0,1) == 'bv'.substring(0,1) ? 'Bar%20Chart' : (ctype.substring(0,1) == 'l' ? 'Line%20Chart' :
(ctype == 'map' ? 'Map%20Chart' :
(ctype == 'gom' ? 'Google-O-Meter%20Chart' :
(ctype == 'r' ? 'Radar%20Chart' :
'')))))))));
var chdt=(ctype == 'v' ? '&chd=t:' : (ctype == 's' ? '&chd=t:' : (ctype == 'gv' ? '&chl=' :
(ctype.substring(0,1) == 'p' ? pretherest + '&chd=t:' :
((ctype + ' ').substring(0,2).substring(0,1) == 'bv'.substring(0,1) ? '&chd=t:' : (ctype.substring(0,1) == 'l' ? '&chd=t:' :
(ctype == 'map' ? '' :
(ctype == 'gom' ? '&chd=t:' :
(ctype == 'r' ? pretherest + '&chd=t:' :
'')))))))));
var chdeq=(ctype == 'v' ? '&chd=' : (ctype == 's' ? '&chd=' : (ctype == 'gv' ? '&chl=' :
(ctype.substring(0,1) == 'p' ? '&chd=' :
((ctype + ' ').substring(0,2).substring(0,1) == 'bv'.substring(0,1) ? '&chd=' : (ctype.substring(0,1) == 'l' ? '&chd=' :
(ctype == 'map' ? '&chld=' :
(ctype == 'gom' ? '&chld=' :
(ctype == 'r' ? '&chd=' :
'')))))))));
var tc=(ctype == 'v' ? 't:' : (ctype == 's' ? 't:' : (ctype == 'gv' ? '' :
(ctype.substring(0,1) == 'p' ? 't:' :
((ctype + ' ').substring(0,2).substring(0,1) == 'bv'.substring(0,1) ? 't:' : (ctype.substring(0,1) == 'l' ? 't:' :
(ctype == 'map' ? '' :
(ctype == 'gom' ? 't:' :
(ctype == 'r' ? 't:' :
'')))))))));
var chdl=(ctype == 'v' ? '&chdl=' : (ctype == 's' ? '&chdl=' : (ctype == 'gv' ? '' :
(ctype.substring(0,1) == 'p' ? '&chdl=' :
((ctype + ' ').substring(0,2).substring(0,1) == 'bv'.substring(0,1) ? '&chbh=' : (ctype.substring(0,1) == 'l' ? '&chbh=' :
(ctype == 'map' ? '' :
(ctype == 'gom' ? '&chdl=' :
(ctype == 'r' ? '&chxt=x&chxl=' :
'')))))))));

var prenchtt=(ctype == 'v' ? '100,80,60,30,30,30,10' : (ctype == 's' ? '12,87,75,41,23,96,68,71,34,9|98,60,27,34,56,79,58,74,18,76|84,23,69,81,47,94,60,93,64,54' : (ctype == 'gv' ? 'graph{C_0--H_0[type=s];C_0--H_1[type=s];C_0--H_2[type=s];C_0--C_1[type=s];C_1--H_3[type=s];C_1--H_4[type=s];C_1--H_5[type=s]}' :
(ctype.substring(0,1) == 'p' ? '1,2,3,4' :
((ctype + ' ').substring(0,2).substring(0,1) == 'bv'.substring(0,1) ? '5,5,5|10,10,10|15,15,15' : (ctype.substring(0,1) == 'l' ? '5,45,5|10,60,10|15,85,15' :
(ctype == 'map' ? '' :
(ctype == 'gom' ? '20,40,60' :
(ctype == 'r' ? '10,20,30,40,50' :
'')))))))));
var preachtt=(ctype == 'v' ? 'A|B|C' : (ctype == 's' ? 'Cats|Dogs' : (ctype == 'gv' ? '' :
(ctype.substring(0,1) == 'p' ? 'January|February|March|April' :
((ctype + ' ').substring(0,2).substring(0,1) == 'bv'.substring(0,1) ? '15,4,15' : (ctype.substring(0,1) == 'l' ? '15,4,15' :
(ctype == 'map' ? '' :
(ctype == 'gom' ? 'A|B|C' :
(ctype == 'r' ? '0:|1|2|3|4|5|6' :
'')))))))));
var defchco=(ctype == 'v' ? 'ff0000,00ff00,0000ff' : (ctype == 's' ? 'FF0000|0000FF&chxt=x,y' : (ctype == 'gv' ? '' :
(ctype.substring(0,1) == 'p' ? 'ff0000,00ff00,0000ff,ff00ff' :
((ctype + ' ').substring(0,2).substring(0,1) == 'bv'.substring(0,1) ? '4D89F9,C6D9FD,C6FDD9&chxt=x,y' : (ctype.substring(0,1) == 'l' ? '3D89F9.B6D9FD,B6FDD9&chxt=x,y' :
(ctype == 'map' ? '' :
(ctype == 'gom' ? 'ff0000,00ff00,0000ff' :
(ctype == 'r' ? 'FF0000,FF9900,ff0a00,00ffb0,000cff' :
'')))))))));

var prechtt=(ctype == 'v' ? chdt + prenchtt + chdl + preachtt : (ctype == 's' ? chdt + prenchtt + chdl + preachtt + '&chxt=x,y' : (ctype == 'gv' ? chdt + prenchtt :
(ctype.substring(0,1) == 'p' ? chdt + prenchtt + chdl + preachtt :
((ctype + ' ').substring(0,2).substring(0,1) == 'bv'.substring(0,1) ? chdt + prenchtt + chdl + preachtt : (ctype.substring(0,1) == 'l' ? chdt + prenchtt + chdl + preachtt :
(ctype == 'map' ? '' :
(ctype == 'gom' ? chdt + prenchtt + chdl + preachtt :
(ctype == 'r' ? chdt + prenchtt + chdl + preachtt :
'')))))))));
var promptone=(ctype == 'v' ? "Enter delimited values string for Venn Diagram such that ... " + String.fromCharCode(10) + "The first three values specify the sizes of three circles: A, B, & C. For chart with only two circles, specify zero for the third value." + String.fromCharCode(10) + "The fourth value specifies the size of the intersection of A and B." + String.fromCharCode(10) + "The fifth value specifies the size of the intersection of A and C. For a chart with only two circles, do not specify a value here." + String.fromCharCode(10) + "The sixth value specifies the size of the intersection of B and C. For a chart with only two circles, do not specify a value here." + String.fromCharCode(10) + "The seventh value specifies the size of the common intersection of A, B, and C. For a chart with only two circles, do not specify a value here." + String.fromCharCode(10) + String.fromCharCode(10) + "" : (ctype == 's' ? "Enter delimited values string for Scatter Chart" : (ctype == 'gv' ? "Enter delimited values string for GraphViz Chart" :
(ctype.substring(0,1) == 'p' ? "Enter delimited values string for Pie Chart" :
((ctype + ' ').substring(0,2).substring(0,1) == 'bv'.substring(0,1) ? "Enter v for Vertical or h for Horizontal then one of g for Group or s for Stacked or o for Overlapped Bar Chart look then a space and then enter delimited values string for Bar Chart. Here is a Candlestick and horizontal Bar Chart idea eg. hg 1:20,10,15,25,17,30|0,5,10,7,12,6|35,25,45,47,24,46|15,40,30,27,39,54|70,55,63,59,80,6 Here is a vertical Bar Chart and Box Chart idea vs 1:-1,5,10,7,12,-1|-1,25,30,27,24,-1|-1,40,45,47,39,-1|-1,55,63,59,80,-1|-1,30,40,35,30,-1|-1,-1,5,70,90,-1|-1,-1,-1,80,5,-1&chm=F,FF9900,0,1:4,40|H,0CBF0B,0,1:4,1:20|H,000000,4,1:4,1:40|H,0000FF,3,1:4,1:20|o,FF0000,5,-1,7|o,FF0000,6,-1,7 Prefix just the delimited string you enter by 1: to additionally display Candlestick/Box Charts or by 0: to only display Candlestick/Box Chart" :
(ctype.substring(0,1) == 'l' ? "Enter c for Even or s for Sparklines or xy for Just XY Line Chart look then a space and then enter delimited values string for Line Chart. Here is a Candlestick and Line Chart idea eg. c 1:20,10,15,25,17,30|0,5,10,7,12,6|35,25,45,47,24,46|15,40,30,27,39,54|70,55,63,59,80,6 Here is a Line Chart and Box Chart idea s 1:-1,5,10,7,12,-1|-1,25,30,27,24,-1|-1,40,45,47,39,-1|-1,55,63,59,80,-1|-1,30,40,35,30,-1|-1,-1,5,70,90,-1|-1,-1,-1,80,5,-1&chm=F,FF9900,0,1:4,40|H,0CBF0B,0,1:4,1:20|H,000000,4,1:4,1:40|H,0000FF,3,1:4,1:20|o,FF0000,5,-1,7|o,FF0000,6,-1,7 Prefix just the delimited string you enter by 1: to additionally display Candlestick/Box Charts or by 0: to only display Candlestick/Box Chart" :
(ctype == 'map' ? "" :
(ctype == 'gom' ? "Enter delimited values string for Google-O-Meter Chart" :
(ctype == 'r' ? "Enter delimited values string for Radar Chart but prefix with an s for smooth lines" :
"")))))))));
var oneprompt=(ctype == 'v' ? "Enter delimited values string for your Venn Diagram collaborations, optionally, such that ... " + String.fromCharCode(10) + "The first three values specify the sizes of three circles: A, B, & C. For chart with only two circles, specify zero for the third value." + String.fromCharCode(10) + "The fourth value specifies the size of the intersection of A and B." + String.fromCharCode(10) + "The fifth value specifies the size of the intersection of A and C. For a chart with only two circles, do not specify a value here." + String.fromCharCode(10) + "The sixth value specifies the size of the intersection of B and C. For a chart with only two circles, do not specify a value here." + String.fromCharCode(10) + "The seventh value specifies the size of the common intersection of A, B, and C. For a chart with only two circles, do not specify a value here." + String.fromCharCode(10) + String.fromCharCode(10) + "" : (ctype == 's' ? "Enter delimited values string for Scatter Chart" : (ctype == 'gv' ? "Enter delimited values string for GraphViz Chart" :
(ctype.substring(0,1) == 'p' ? "Enter delimited values string for Pie Chart" :
((ctype + ' ').substring(0,2).substring(0,1) == 'bv'.substring(0,1) ? "Enter g for Grouped or s for Stacked or o for Overlapped Bar Chart look then a space and then enter delimited values string for Bar Chart. Here is a Candlestick and Bar Chart idea eg. g 1:20,10,15,25,17,30|0,5,10,7,12,6|35,25,45,47,24,46|15,40,30,27,39,54|70,55,63,59,80,6 Here is a vertical Bar Chart and Box Chart idea vs 1:-1,5,10,7,12,-1|-1,25,30,27,24,-1|-1,40,45,47,39,-1|-1,55,63,59,80,-1|-1,30,40,35,30,-1|-1,-1,5,70,90,-1|-1,-1,-1,80,5,-1&chm=F,FF9900,0,1:4,40|H,0CBF0B,0,1:4,1:20|H,000000,4,1:4,1:40|H,0000FF,3,1:4,1:20|o,FF0000,5,-1,7|o,FF0000,6,-1,7 Prefix just the delimited string you enter by 1: to additionally display Candlestick/Box Charts or by 0: to only display Candlestick/Box Chart" :
(ctype.substring(0,1) == 'l' ? "Enter c for Even or s for Sparklines or xy for Just XY Line Chart look then a space and then enter delimited values string for Line Chart. Here is a Candlestick and Line Chart idea eg. c 1:20,10,15,25,17,30|0,5,10,7,12,6|35,25,45,47,24,46|15,40,30,27,39,54|70,55,63,59,80,6 Here is a Line Chart and Box Chart idea s 1:-1,5,10,7,12,-1|-1,25,30,27,24,-1|-1,40,45,47,39,-1|-1,55,63,59,80,-1|-1,30,40,35,30,-1|-1,-1,5,70,90,-1|-1,-1,-1,80,5,-1&chm=F,FF9900,0,1:4,40|H,0CBF0B,0,1:4,1:20|H,000000,4,1:4,1:40|H,0000FF,3,1:4,1:20|o,FF0000,5,-1,7|o,FF0000,6,-1,7 Prefix just the delimited string you enter by 1: to additionally display Candlestick/Box Charts or by 0: to only display Candlestick/Box Chart" :
(ctype == 'map' ? "" :
(ctype == 'gom' ? "Enter delimited values string for Google-O-Meter Chart" :
(ctype == 'r' ? "Enter delimited values string for Radar Chart but prefix with an s for smooth lines" :
"")))))))));
var asktwo=(ctype == 'v' ? true : (ctype == 's' ? true : (ctype == 'gv' ? false :
(ctype.substring(0,1) == 'p' ? true :
((ctype + ' ').substring(0,2).substring(0,1) == 'bv'.substring(0,1) ? true : (ctype.substring(0,1) == 'l' ? true :
(ctype == 'map' ? false :
(ctype == 'gom' ? true :
(ctype == 'r' ? true :
false)))))))));

var answersuffix=(ctype.substring(0,1).replace('m','l').replace('b','l').replace('r','l') == 'l' ? '. Please note that optional Dynamic Icons are available via a suffixing string example applied to the second data point such as &chem=y;s=bubble_icon_text_small;d=ski,bb,Wheeee!,FFFFFF;dp=1;ds=0 ' : '');

var twopb=(ctype.substring(0,1) == 'p' ? 'Any optional legend or title argument snippets? Optionally prefix by 3 for 3d Pie Chart or by c for Concentric Pie Chart. Eg. 3' + chdl + preachtt + '&chtt=My%20' + cencodename + '&chco=' + defchco : 'Any optional legend or title argument snippets? Eg. ' + chdl + preachtt + '&chtt=My%20' + cencodename + '&chco=' + defchco);
var beforeanswer=(ctype.substring(0,1) == 'l' ? 'c ' : ((ctype + ' ').substring(0,2).substring(0,1) == 'bv'.substring(0,1) ? 'vg ' : ''));

var emsmlist='';

… further to yesterday’s Google Chart Image Chart Broadcast Talk Commentary Tutorial in the changed latest draft image_venn.html Google Chart Image Chart Venn Chart or Scatter Chart or GraphViz Chart or Pie Chart or Line Chart or Bar Chart or Candlestick/Box Chart or Google-O-Meter Chart or Radar Chart or Map Chart interfacing web application you can also try below.


Previous relevant Google Chart Image Chart Broadcast Talk Commentary Tutorial is shown below.

Google Chart Image Chart Broadcast Talk Commentary Tutorial

Google Chart Image Chart Broadcast Talk Commentary Tutorial

We’ll leave yesterday’s Google Chart Image Chart Radar Chart Tutorial angled text predilections for now, given we’ve got until Tuesday until tswhtf so to speak. Let’s today remedy the concern we had when we presented Google Chart Image Chart Broadcast Talk Context Tutorial regarding, the at the time new, “Broadcast Talk”, concept …

… even though it is only visual by nature, presented as an update image still presented and updated periodically. Go figure?!

… and offer a way to help the “Broadcast Talk” demonstrator “speak” during their demonstration, effectively. In so doing, we are going to add to …

  • the demonstrator’s visual inputs coming from that canvas annotator helper … with, today …
  • the demonstrator’s commentary, collected via an HTML textarea element (to optionally supplement the visuals) from that canvas annotator helper’s originator window (ie. the Google Charts Image Chart interfacing supervisor) … presented …

… via a new “middle of three slide” …

<?php

$uwidth=trim($uparts[$ioff - 2 + sizeof($uparts)]);
$uheight=trim(explode('#',explode('?',$uparts[$ioff - 1 + sizeof($uparts)])[0])[0]);
if (isset($_GET['canvcont']) && isset($_GET['uniquifier'])) {
$uniquifier=str_replace('+',' ',urldecode($_GET['uniquifier']));
if (file_exists($_SERVER['DOCUMENT_ROOT'] . DIRECTORY_SEPARATOR . "presentation__" . $uniquifier . ".png")) {
$im = imagecreatefromstring(file_get_contents($_SERVER['DOCUMENT_ROOT'] . DIRECTORY_SEPARATOR . "presentation__" . $uniquifier . ".png"));
$white = imagecolorallocate($im, 255, 255, 255);
$black = imagecolorallocate($im, 1, 1, 1);
imagefilledrectangle($im, 0, 0, $uwidth, $uheight, $white);
imagesavealpha($im, TRUE);
try {
if (function_exists('imagettftext')) {
imagettftext($im, 12, 0, 20, 20, $black, realpath('arial.ttf'), str_replace('+',' ',urldecode($_GET['canvcont'])));
}
} catch (Exception $e) { }

imagepng($im, $_SERVER['DOCUMENT_ROOT'] . DIRECTORY_SEPARATOR . "presentation__" . $uniquifier . ".png");
imagedestroy($im);
exit;
}
exit;
}


?>

… animated GIF (PHP 404.php helping) means of display in the viewer windows (off email invitation links they receive via the demonstrator) in the changed


function askaway() {
var waspis=prefixandon, nl='', newwaspis='';
if (document.getElementById('bcommentary')) {
if (document.getElementById('bcommentary').value.trim() != '') {
if (document.getElementById('bcommentary').value.trim().indexOf(String.fromCharCode(10)) == -1) {
nl=String.fromCharCode(10);
}
eightthousand=24000;
if ((' ' + document.getElementById('bcommentary').value.trim()).slice(-3) != '...' && (' ' + prefixandon.trim()).slice(-3) != '...' && (document.getElementById('bcommentary').value.trim() + ' ').substring(0,3) != '...') {
prefixandon='';
lastval='';
} else if ((document.getElementById('bcommentary').value.trim() + ' ').substring(0,3) == '...') {
if (waspis.indexOf(lastval.trim()) == -1) {
prefixandon=String.fromCharCode(10) + lastval.trim().replace(/\.\.\.NoWayJosE$/g, ' ' + nl + ('' + (new Date())) + ' ... ') + waspis;
newwaspis=prefixandon;
}
}
if ((' ' + document.getElementById('bcommentary').value.trim()).slice(-3) == '...') {
document.getElementById('ifco').src='//www.rjmprogramming.com.au/ITblog/' + Math.min(550,window.innerWidth) + '/' + Math.min(350,window.innerHeight) + '/?uniquifier=' + encodeURIComponent(document.getElementById('uniquifier').value) + '&canvcont=' + encodeURIComponent(document.getElementById('bcommentary').value.trim().replace(/\.\.\.$/g, ' ' + nl + ('' + (new Date())) + ' ... ' + String.fromCharCode(10) + String.fromCharCode(10) + prefixandon));
} else {
document.getElementById('ifco').src='//www.rjmprogramming.com.au/ITblog/' + Math.min(550,window.innerWidth) + '/' + Math.min(350,window.innerHeight) + '/?uniquifier=' + encodeURIComponent(document.getElementById('uniquifier').value) + '&canvcont=' + encodeURIComponent(document.getElementById('bcommentary').value + String.fromCharCode(10) + String.fromCharCode(10) + prefixandon);
}
document.getElementById('bcommentary').title=document.getElementById('bcommentary').value;
if ((document.getElementById('bcommentary').value.trim() + ' ').substring(0,3) == '...') {
if (newwaspis != '') { waspis=newwaspis; }
if (waspis.indexOf(document.getElementById('bcommentary').value.trim()) == -1) {
prefixandon=String.fromCharCode(10) + document.getElementById('bcommentary').value.trim().replace(/\.\.\.$/g, ' ' + nl + ('' + (new Date())) + ' ... ') + waspis;
}
}
lastval=document.getElementById('bcommentary').value;
document.getElementById('bcommentary').value='';
setTimeout(function(){ document.getElementById('subcc').click(); }, 2000);
}
}
}

function newfunction() {
if (document.getElementById('bshare')) {
document.getElementById('sbshare').innerHTML='<iframe id=ifco style=display:none; src=></iframe><br><br><textarea rows=2 cols=80 id=bcommentary placeholder="Commentary to Viewers can go here ... start with or end with ... for ongoing ..." onblur="askaway(this);" value=""></textarea><br><br>';
}
}

latest draft image_venn.html Google Chart Image Chart Venn Chart or Scatter Chart or GraphViz Chart or Pie Chart or Line Chart or Bar Chart or Candlestick/Box Chart or Google-O-Meter Chart or Radar Chart or Map Chart interfacing web application you can also try below.


Previous relevant Google Chart Image Chart Radar Chart Tutorial is shown below.

Google Chart Image Chart Radar Chart Tutorial

Google Chart Image Chart Radar Chart Tutorial

Onto yesterday’s Google Chart Image Chart Box Chart Tutorial, today we have a two part stepping forward via new …

Why the trepidation? Well, so far, when the text is angled we can’t understand what results we are getting back from a call to [element].getBoundingClientRect() just yet.

Why is this needed? Again, with the questions! Well, Mr De Niro, you see, well, somebody might want to go onto that more complex annotating.

And why would they do that? Sheesh. Well, Mr De Niro, sir, you see, sometimes things happen in life, and well, fingers slip on keyboards, and mice get awfullllly nervous around screens these days.

Yeh, well, show us the money, wiseguy. Who’s is that question? And what’s with the questions? Well, you see, Mr De Niro, the money is if we can get PHP text placement for text at an angle, where it rotates from the middle of the text, to get a similar positioning to good ol’ … pardon, Mr De Niro … good and well respected Javascript transform rotations … not with a triple pike, Mr De Niro, but you’re awfulllllly close, Mr De Niro, sir … rather, we throw in a couple of translations … no, not Latin, Mr De Niro … of co-ordinates, Mr De Niro.

And that will bring in how much by next Tuesday? Back to the questions? Why so many questions? We think it’s a pretty big money spinner, Mr De Niro, sir, and we think you should come back next Tuesday, and we can show you the ropes. Sweat, oozing from the brow, as Mr De Niro exits stage left.

And just while we have a few minutes, here’s the updated Javascript parameterization …


var dtextis='dtext';
var pretherest='';
var newtherest='';
var tmod='';
var colchange='';
var cht=location.search.split('cht=')[1] ? decodeURIComponent(location.search.split('cht=')[1].split('&')[0]) : "v";
if ((cht + ' ').substring(0,1) == 'p' && cht != 'p') { pretherest=cht.substring(1); }
//if ((cht + ' ').substring(0,2) == 'bv' && cht != 'bv') { pretherest=cht.substring(2); if (1 == 1) { cht='bv'; } }
if ((cht + ' ').substring(0,1) == 'bv'.substring(0,1) && cht != 'bv'.substring(0,1)) { pretherest=cht.substring(1); if (1 == 1) { cht='bv'.substring(0,1); } }
if ((cht + ' ').substring(0,1) == 'l' && cht != 'l') { pretherest=cht.substring(1); if (1 == 1) { cht='l'; } }
if ((cht + ' ').substring(0,1) == 'r' && cht != 'r') { pretherest=cht.substring(1); if (1 == 1) { cht='r'; } }
var ccode=location.search.split('chld=')[1] ? decodeURIComponent(location.search.split('chld=')[1].split('&')[0]) : "";
var ctype=location.search.split('type=')[1] ? decodeURIComponent(location.search.split('type=')[1].split('&')[0]) : cht;
var cname=(ctype == 'v' ? 'Venn Chart' : (ctype == 's' ? 'Scatter Chart' : (ctype == 'gv' ? 'GraphViz Chart' :
(ctype.substring(0,1) == 'p' ? 'Pie Chart' :
((ctype + ' ').substring(0,2).substring(0,1) == 'bv'.substring(0,1) ? 'Bar Chart' : (ctype.substring(0,1) == 'l' ? 'Line Chart' :
(ctype == 'map' ? 'Map Chart' :
(ctype == 'gom' ? 'Google-O-Meter Chart' :
(ctype == 'r' ? 'Radar Chart' :
'')))))))));
var cencodename=(ctype == 'v' ? 'Venn%20Diagram' : (ctype == 's' ? 'Scatter%20Chart' : (ctype == 'gv' ? 'GraphViz%20Chart' :
(ctype.substring(0,1) == 'p' ? 'Pie%20Chart' :
((ctype + ' ').substring(0,2).substring(0,1) == 'bv'.substring(0,1) ? 'Bar%20Chart' : (ctype.substring(0,1) == 'l' ? 'Line%20Chart' :
(ctype == 'map' ? 'Map%20Chart' :
(ctype == 'gom' ? 'Google-O-Meter%20Chart' :
(ctype == 'r' ? 'Radar%20Chart' :
'')))))))));
var chdt=(ctype == 'v' ? '&chd=t:' : (ctype == 's' ? '&chd=t:' : (ctype == 'gv' ? '&chl=' :
(ctype.substring(0,1) == 'p' ? pretherest + '&chd=t:' :
((ctype + ' ').substring(0,2).substring(0,1) == 'bv'.substring(0,1) ? '&chd=t:' : (ctype.substring(0,1) == 'l' ? '&chd=t:' :
(ctype == 'map' ? '' :
(ctype == 'gom' ? '&chd=t:' :
(ctype == 'r' ? pretherest + '&chd=t:' :
'')))))))));
var chdeq=(ctype == 'v' ? '&chd=' : (ctype == 's' ? '&chd=' : (ctype == 'gv' ? '&chl=' :
(ctype.substring(0,1) == 'p' ? '&chd=' :
((ctype + ' ').substring(0,2).substring(0,1) == 'bv'.substring(0,1) ? '&chd=' : (ctype.substring(0,1) == 'l' ? '&chd=' :
(ctype == 'map' ? '&chld=' :
(ctype == 'gom' ? '&chld=' :
(ctype == 'r' ? '&chd=' :
'')))))))));
var tc=(ctype == 'v' ? 't:' : (ctype == 's' ? 't:' : (ctype == 'gv' ? '' :
(ctype.substring(0,1) == 'p' ? 't:' :
((ctype + ' ').substring(0,2).substring(0,1) == 'bv'.substring(0,1) ? 't:' : (ctype.substring(0,1) == 'l' ? 't:' :
(ctype == 'map' ? '' :
(ctype == 'gom' ? 't:' :
(ctype == 'r' ? 't:' :
'')))))))));
var chdl=(ctype == 'v' ? '&chdl=' : (ctype == 's' ? '&chdl=' : (ctype == 'gv' ? '' :
(ctype.substring(0,1) == 'p' ? '&chdl=' :
((ctype + ' ').substring(0,2).substring(0,1) == 'bv'.substring(0,1) ? '&chbh=' : (ctype.substring(0,1) == 'l' ? '&chbh=' :
(ctype == 'map' ? '' :
(ctype == 'gom' ? '&chdl=' :
(ctype == 'r' ? '&chxt=x&chxl=' :
'')))))))));

var prenchtt=(ctype == 'v' ? '100,80,60,30,30,30,10' : (ctype == 's' ? '12,87,75,41,23,96,68,71,34,9|98,60,27,34,56,79,58,74,18,76|84,23,69,81,47,94,60,93,64,54' : (ctype == 'gv' ? 'graph{C_0--H_0[type=s];C_0--H_1[type=s];C_0--H_2[type=s];C_0--C_1[type=s];C_1--H_3[type=s];C_1--H_4[type=s];C_1--H_5[type=s]}' :
(ctype.substring(0,1) == 'p' ? '1,2,3,4' :
((ctype + ' ').substring(0,2).substring(0,1) == 'bv'.substring(0,1) ? '5,5,5|10,10,10|15,15,15' : (ctype.substring(0,1) == 'l' ? '5,45,5|10,60,10|15,85,15' :
(ctype == 'map' ? '' :
(ctype == 'gom' ? '20,40,60' :
(ctype == 'r' ? '10,20,30,40,50' :
'')))))))));
var preachtt=(ctype == 'v' ? 'A|B|C' : (ctype == 's' ? 'Cats|Dogs' : (ctype == 'gv' ? '' :
(ctype.substring(0,1) == 'p' ? 'January|February|March|April' :
((ctype + ' ').substring(0,2).substring(0,1) == 'bv'.substring(0,1) ? '15,4,15' : (ctype.substring(0,1) == 'l' ? '15,4,15' :
(ctype == 'map' ? '' :
(ctype == 'gom' ? 'A|B|C' :
(ctype == 'r' ? '0:|1|2|3|4|5|6' :
'')))))))));
var defchco=(ctype == 'v' ? 'ff0000,00ff00,0000ff' : (ctype == 's' ? 'FF0000|0000FF&chxt=x,y' : (ctype == 'gv' ? '' :
(ctype.substring(0,1) == 'p' ? 'ff0000,00ff00,0000ff,ff00ff' :
((ctype + ' ').substring(0,2).substring(0,1) == 'bv'.substring(0,1) ? '4D89F9,C6D9FD,C6FDD9&chxt=x,y' : (ctype.substring(0,1) == 'l' ? '3D89F9.B6D9FD,B6FDD9&chxt=x,y' :
(ctype == 'map' ? '' :
(ctype == 'gom' ? 'ff0000,00ff00,0000ff' :
(ctype == 'r' ? 'FF0000,FF9900,ff0a00,00ffb0,000cff' :
'')))))))));

var prechtt=(ctype == 'v' ? chdt + prenchtt + chdl + preachtt : (ctype == 's' ? chdt + prenchtt + chdl + preachtt + '&chxt=x,y' : (ctype == 'gv' ? chdt + prenchtt :
(ctype.substring(0,1) == 'p' ? chdt + prenchtt + chdl + preachtt :
((ctype + ' ').substring(0,2).substring(0,1) == 'bv'.substring(0,1) ? chdt + prenchtt + chdl + preachtt : (ctype.substring(0,1) == 'l' ? chdt + prenchtt + chdl + preachtt :
(ctype == 'map' ? '' :
(ctype == 'gom' ? chdt + prenchtt + chdl + preachtt :
(ctype == 'r' ? chdt + prenchtt + chdl + preachtt :
'')))))))));
var promptone=(ctype == 'v' ? "Enter delimited values string for Venn Diagram such that ... " + String.fromCharCode(10) + "The first three values specify the sizes of three circles: A, B, & C. For chart with only two circles, specify zero for the third value." + String.fromCharCode(10) + "The fourth value specifies the size of the intersection of A and B." + String.fromCharCode(10) + "The fifth value specifies the size of the intersection of A and C. For a chart with only two circles, do not specify a value here." + String.fromCharCode(10) + "The sixth value specifies the size of the intersection of B and C. For a chart with only two circles, do not specify a value here." + String.fromCharCode(10) + "The seventh value specifies the size of the common intersection of A, B, and C. For a chart with only two circles, do not specify a value here." + String.fromCharCode(10) + String.fromCharCode(10) + "" : (ctype == 's' ? "Enter delimited values string for Scatter Chart" : (ctype == 'gv' ? "Enter delimited values string for GraphViz Chart" :
(ctype.substring(0,1) == 'p' ? "Enter delimited values string for Pie Chart" :
((ctype + ' ').substring(0,2).substring(0,1) == 'bv'.substring(0,1) ? "Enter v for Vertical or h for Horizontal then one of g for Group or s for Stacked or o for Overlapped Bar Chart look then a space and then enter delimited values string for Bar Chart. Here is a Candlestick and horizontal Bar Chart idea eg. hg 1:20,10,15,25,17,30|0,5,10,7,12,6|35,25,45,47,24,46|15,40,30,27,39,54|70,55,63,59,80,6 Here is a vertical Bar Chart and Box Chart idea vs 1:-1,5,10,7,12,-1|-1,25,30,27,24,-1|-1,40,45,47,39,-1|-1,55,63,59,80,-1|-1,30,40,35,30,-1|-1,-1,5,70,90,-1|-1,-1,-1,80,5,-1&chm=F,FF9900,0,1:4,40|H,0CBF0B,0,1:4,1:20|H,000000,4,1:4,1:40|H,0000FF,3,1:4,1:20|o,FF0000,5,-1,7|o,FF0000,6,-1,7 Prefix just the delimited string you enter by 1: to additionally display Candlestick/Box Charts or by 0: to only display Candlestick/Box Chart" :
(ctype.substring(0,1) == 'l' ? "Enter c for Even or s for Sparklines or xy for Just XY Line Chart look then a space and then enter delimited values string for Line Chart. Here is a Candlestick and Line Chart idea eg. c 1:20,10,15,25,17,30|0,5,10,7,12,6|35,25,45,47,24,46|15,40,30,27,39,54|70,55,63,59,80,6 Here is a Line Chart and Box Chart idea s 1:-1,5,10,7,12,-1|-1,25,30,27,24,-1|-1,40,45,47,39,-1|-1,55,63,59,80,-1|-1,30,40,35,30,-1|-1,-1,5,70,90,-1|-1,-1,-1,80,5,-1&chm=F,FF9900,0,1:4,40|H,0CBF0B,0,1:4,1:20|H,000000,4,1:4,1:40|H,0000FF,3,1:4,1:20|o,FF0000,5,-1,7|o,FF0000,6,-1,7 Prefix just the delimited string you enter by 1: to additionally display Candlestick/Box Charts or by 0: to only display Candlestick/Box Chart" :
(ctype == 'map' ? "" :
(ctype == 'gom' ? "Enter delimited values string for Google-O-Meter Chart" :
(ctype == 'r' ? "Enter delimited values string for Radar Chart but prefix with an s for smooth lines" :
"")))))))));
var oneprompt=(ctype == 'v' ? "Enter delimited values string for your Venn Diagram collaborations, optionally, such that ... " + String.fromCharCode(10) + "The first three values specify the sizes of three circles: A, B, & C. For chart with only two circles, specify zero for the third value." + String.fromCharCode(10) + "The fourth value specifies the size of the intersection of A and B." + String.fromCharCode(10) + "The fifth value specifies the size of the intersection of A and C. For a chart with only two circles, do not specify a value here." + String.fromCharCode(10) + "The sixth value specifies the size of the intersection of B and C. For a chart with only two circles, do not specify a value here." + String.fromCharCode(10) + "The seventh value specifies the size of the common intersection of A, B, and C. For a chart with only two circles, do not specify a value here." + String.fromCharCode(10) + String.fromCharCode(10) + "" : (ctype == 's' ? "Enter delimited values string for Scatter Chart" : (ctype == 'gv' ? "Enter delimited values string for GraphViz Chart" :
(ctype.substring(0,1) == 'p' ? "Enter delimited values string for Pie Chart" :
((ctype + ' ').substring(0,2).substring(0,1) == 'bv'.substring(0,1) ? "Enter g for Grouped or s for Stacked or o for Overlapped Bar Chart look then a space and then enter delimited values string for Bar Chart. Here is a Candlestick and Bar Chart idea eg. g 1:20,10,15,25,17,30|0,5,10,7,12,6|35,25,45,47,24,46|15,40,30,27,39,54|70,55,63,59,80,6 Here is a vertical Bar Chart and Box Chart idea vs 1:-1,5,10,7,12,-1|-1,25,30,27,24,-1|-1,40,45,47,39,-1|-1,55,63,59,80,-1|-1,30,40,35,30,-1|-1,-1,5,70,90,-1|-1,-1,-1,80,5,-1&chm=F,FF9900,0,1:4,40|H,0CBF0B,0,1:4,1:20|H,000000,4,1:4,1:40|H,0000FF,3,1:4,1:20|o,FF0000,5,-1,7|o,FF0000,6,-1,7 Prefix just the delimited string you enter by 1: to additionally display Candlestick/Box Charts or by 0: to only display Candlestick/Box Chart" :
(ctype.substring(0,1) == 'l' ? "Enter c for Even or s for Sparklines or xy for Just XY Line Chart look then a space and then enter delimited values string for Line Chart. Here is a Candlestick and Line Chart idea eg. c 1:20,10,15,25,17,30|0,5,10,7,12,6|35,25,45,47,24,46|15,40,30,27,39,54|70,55,63,59,80,6 Here is a Line Chart and Box Chart idea s 1:-1,5,10,7,12,-1|-1,25,30,27,24,-1|-1,40,45,47,39,-1|-1,55,63,59,80,-1|-1,30,40,35,30,-1|-1,-1,5,70,90,-1|-1,-1,-1,80,5,-1&chm=F,FF9900,0,1:4,40|H,0CBF0B,0,1:4,1:20|H,000000,4,1:4,1:40|H,0000FF,3,1:4,1:20|o,FF0000,5,-1,7|o,FF0000,6,-1,7 Prefix just the delimited string you enter by 1: to additionally display Candlestick/Box Charts or by 0: to only display Candlestick/Box Chart" :
(ctype == 'map' ? "" :
(ctype == 'gom' ? "Enter delimited values string for Google-O-Meter Chart" :
(ctype == 'r' ? "Enter delimited values string for Radar Chart but prefix with an s for smooth lines" :
"")))))))));
var asktwo=(ctype == 'v' ? true : (ctype == 's' ? true : (ctype == 'gv' ? false :
(ctype.substring(0,1) == 'p' ? true :
((ctype + ' ').substring(0,2).substring(0,1) == 'bv'.substring(0,1) ? true : (ctype.substring(0,1) == 'l' ? true :
(ctype == 'map' ? false :
(ctype == 'gom' ? true :
(ctype == 'r' ? true :
false)))))))));

var twopb=(ctype.substring(0,1) == 'p' ? 'Any optional legend or title argument snippets? Optionally prefix by 3 for 3d Pie Chart or by c for Concentric Pie Chart. Eg. 3' + chdl + preachtt + '&chtt=My%20' + cencodename + '&chco=' + defchco : 'Any optional legend or title argument snippets? Eg. ' + chdl + preachtt + '&chtt=My%20' + cencodename + '&chco=' + defchco);
var beforeanswer=(ctype.substring(0,1) == 'l' ? 'c ' : ((ctype + ' ').substring(0,2).substring(0,1) == 'bv'.substring(0,1) ? 'vg ' : ''));


var emsmlist='';

… that goes into helping make the changed latest draft image_venn.html Google Chart Image Chart Venn Chart or Scatter Chart or GraphViz Chart or Pie Chart or Line Chart or Bar Chart or Candlestick/Box Chart or Google-O-Meter Chart or Radar Chart or Map Chart interfacing web application you can also try below, have regular sleepovers on cloud nine.

Did you know?

Did you notice the inclusion of CSS styling …

<style>

#fsangle { background-image: url("data:image/svg+xml;utf8,<svg xmlns='http://www.w3.org/2000/svg' width='24' height='24' viewport='0 0 100 100' style='font-family:Verdana;font-size:10px;'><text y='50%'> \00B0</text></svg>"); background-repeat: no-repeat; background-position: center right; }

</style>

? It styles an input type=number textbox where a placeholder is not really an option to explain a textbox’s purpose, and we do dislike set aside labels, these days. It’s also a way to explain the textbox for mobile users who do not get a hovering message to help. It’s also got an internationalization feel to it, using the degree sign emoji ° (ie. &#176; or that \u0080 UTF-16 Encoding style of definition suitable for CSS styling usage) to both associate the units we’d want, as well as that we are asking for an angle. Clockwise or anticlockwise, alas, comes down to user experience!


Previous relevant Google Chart Image Chart Box Chart Tutorial is shown below.

Google Chart Image Chart Box Chart Tutorial

Google Chart Image Chart Box Chart Tutorial

Today we offer new …

… interfacings, onto the progress up to yesterday’s Google Chart Image Chart Colour Tutorial.

As such, it’s probably timely to update you with the parameterization up the top of the Javascript code …


var pretherest='';
var newtherest='';
var tmod='';
var colchange='';
var cht=location.search.split('cht=')[1] ? decodeURIComponent(location.search.split('cht=')[1].split('&')[0]) : "v";
if ((cht + ' ').substring(0,1) == 'p' && cht != 'p') { pretherest=cht.substring(1); }
//if ((cht + ' ').substring(0,2) == 'bv' && cht != 'bv') { pretherest=cht.substring(2); if (1 == 1) { cht='bv'; } }
if ((cht + ' ').substring(0,1) == 'bv'.substring(0,1) && cht != 'bv'.substring(0,1)) { pretherest=cht.substring(1); if (1 == 1) { cht='bv'.substring(0,1); } }
if ((cht + ' ').substring(0,1) == 'l' && cht != 'l') { pretherest=cht.substring(1); if (1 == 1) { cht='l'; } }
var ccode=location.search.split('chld=')[1] ? decodeURIComponent(location.search.split('chld=')[1].split('&')[0]) : "";
var ctype=location.search.split('type=')[1] ? decodeURIComponent(location.search.split('type=')[1].split('&')[0]) : cht;
var cname=(ctype == 'v' ? 'Venn Chart' : (ctype == 's' ? 'Scatter Chart' : (ctype == 'gv' ? 'GraphViz Chart' :
(ctype.substring(0,1) == 'p' ? 'Pie Chart' :
((ctype + ' ').substring(0,2).substring(0,1) == 'bv'.substring(0,1) ? 'Bar Chart' : (ctype.substring(0,1) == 'l' ? 'Line Chart' :
(ctype == 'map' ? 'Map Chart' :
(ctype == 'gom' ? 'Google-O-Meter Chart' :
''))))))));
var cencodename=(ctype == 'v' ? 'Venn%20Diagram' : (ctype == 's' ? 'Scatter%20Chart' : (ctype == 'gv' ? 'GraphViz%20Chart' :
(ctype.substring(0,1) == 'p' ? 'Pie%20Chart' :
((ctype + ' ').substring(0,2).substring(0,1) == 'bv'.substring(0,1) ? 'Bar%20Chart' : (ctype.substring(0,1) == 'l' ? 'Line%20Chart' :
(ctype == 'map' ? 'Map%20Chart' :
(ctype == 'gom' ? 'Google-O-Meter%20Chart' :
''))))))));
var chdt=(ctype == 'v' ? '&chd=t:' : (ctype == 's' ? '&chd=t:' : (ctype == 'gv' ? '&chl=' :
(ctype.substring(0,1) == 'p' ? pretherest + '&chd=t:' :
((ctype + ' ').substring(0,2).substring(0,1) == 'bv'.substring(0,1) ? '&chd=t:' : (ctype.substring(0,1) == 'l' ? '&chd=t:' :
(ctype == 'map' ? '' :
(ctype == 'gom' ? '&chd=t:' :
''))))))));
var chdeq=(ctype == 'v' ? '&chd=' : (ctype == 's' ? '&chd=' : (ctype == 'gv' ? '&chl=' :
(ctype.substring(0,1) == 'p' ? '&chd=' :
((ctype + ' ').substring(0,2).substring(0,1) == 'bv'.substring(0,1) ? '&chd=' : (ctype.substring(0,1) == 'l' ? '&chd=' :
(ctype == 'map' ? '&chld=' :
(ctype == 'gom' ? '&chdl=' :
''))))))));
var tc=(ctype == 'v' ? 't:' : (ctype == 's' ? 't:' : (ctype == 'gv' ? '' :
(ctype.substring(0,1) == 'p' ? 't:' :
((ctype + ' ').substring(0,2).substring(0,1) == 'bv'.substring(0,1) ? 't:' : (ctype.substring(0,1) == 'l' ? 't:' :
(ctype == 'map' ? '' :
(ctype == 'gom' ? 't:' :
''))))))));
var chdl=(ctype == 'v' ? '&chdl=' : (ctype == 's' ? '&chdl=' : (ctype == 'gv' ? '' :
(ctype.substring(0,1) == 'p' ? '&chdl=' :
((ctype + ' ').substring(0,2).substring(0,1) == 'bv'.substring(0,1) ? '&chbh=' : (ctype.substring(0,1) == 'l' ? '&chbh=' :
(ctype == 'map' ? '' :
(ctype == 'gom' ? '&chdl=' :
''))))))));

var prenchtt=(ctype == 'v' ? '100,80,60,30,30,30,10' : (ctype == 's' ? '12,87,75,41,23,96,68,71,34,9|98,60,27,34,56,79,58,74,18,76|84,23,69,81,47,94,60,93,64,54' : (ctype == 'gv' ? 'graph{C_0--H_0[type=s];C_0--H_1[type=s];C_0--H_2[type=s];C_0--C_1[type=s];C_1--H_3[type=s];C_1--H_4[type=s];C_1--H_5[type=s]}' :
(ctype.substring(0,1) == 'p' ? '1,2,3,4' :
((ctype + ' ').substring(0,2).substring(0,1) == 'bv'.substring(0,1) ? '5,5,5|10,10,10|15,15,15' : (ctype.substring(0,1) == 'l' ? '5,45,5|10,60,10|15,85,15' :
(ctype == 'map' ? '' :
(ctype == 'gom' ? '20,40,60' :
''))))))));
var preachtt=(ctype == 'v' ? 'A|B|C' : (ctype == 's' ? 'Cats|Dogs' : (ctype == 'gv' ? '' :
(ctype.substring(0,1) == 'p' ? 'January|February|March|April' :
((ctype + ' ').substring(0,2).substring(0,1) == 'bv'.substring(0,1) ? '15,4,15' : (ctype.substring(0,1) == 'l' ? '15,4,15' :
(ctype == 'map' ? '' :
(ctype == 'gom' ? 'A|B|C' :
''))))))));
var defchco=(ctype == 'v' ? 'ff0000,00ff00,0000ff' : (ctype == 's' ? 'FF0000|0000FF&chxt=x,y' : (ctype == 'gv' ? '' :
(ctype.substring(0,1) == 'p' ? 'ff0000,00ff00,0000ff,ff00ff' :
((ctype + ' ').substring(0,2).substring(0,1) == 'bv'.substring(0,1) ? '4D89F9,C6D9FD,C6FDD9&chxt=x,y' : (ctype.substring(0,1) == 'l' ? '3D89F9.B6D9FD,B6FDD9&chxt=x,y' :
(ctype == 'map' ? '' :
(ctype == 'gom' ? 'ff0000,00ff00,0000ff' :
''))))))));

var prechtt=(ctype == 'v' ? chdt + prenchtt + chdl + preachtt : (ctype == 's' ? chdt + prenchtt + chdl + preachtt + '&chxt=x,y' : (ctype == 'gv' ? chdt + prenchtt :
(ctype.substring(0,1) == 'p' ? chdt + prenchtt + chdl + preachtt :
((ctype + ' ').substring(0,2).substring(0,1) == 'bv'.substring(0,1) ? chdt + prenchtt + chdl + preachtt : (ctype.substring(0,1) == 'l' ? chdt + prenchtt + chdl + preachtt :
(ctype == 'map' ? '' :
(ctype == 'gom' ? chdt + prenchtt + chdl + preachtt :
''))))))));
var promptone=(ctype == 'v' ? "Enter delimited values string for Venn Diagram such that ... " + String.fromCharCode(10) + "The first three values specify the sizes of three circles: A, B, & C. For chart with only two circles, specify zero for the third value." + String.fromCharCode(10) + "The fourth value specifies the size of the intersection of A and B." + String.fromCharCode(10) + "The fifth value specifies the size of the intersection of A and C. For a chart with only two circles, do not specify a value here." + String.fromCharCode(10) + "The sixth value specifies the size of the intersection of B and C. For a chart with only two circles, do not specify a value here." + String.fromCharCode(10) + "The seventh value specifies the size of the common intersection of A, B, and C. For a chart with only two circles, do not specify a value here." + String.fromCharCode(10) + String.fromCharCode(10) + "" : (ctype == 's' ? "Enter delimited values string for Scatter Chart" : (ctype == 'gv' ? "Enter delimited values string for GraphViz Chart" :
(ctype.substring(0,1) == 'p' ? "Enter delimited values string for Pie Chart" :
((ctype + ' ').substring(0,2).substring(0,1) == 'bv'.substring(0,1) ? "Enter v for Vertical or h for Horizontal then one of g for Group or s for Stacked or o for Overlapped Bar Chart look then a space and then enter delimited values string for Bar Chart. Here is a Candlestick and horizontal Bar Chart idea eg. hg 1:20,10,15,25,17,30|0,5,10,7,12,6|35,25,45,47,24,46|15,40,30,27,39,54|70,55,63,59,80,6 Here is a vertical Bar Chart and Box Chart idea vs 1:-1,5,10,7,12,-1|-1,25,30,27,24,-1|-1,40,45,47,39,-1|-1,55,63,59,80,-1|-1,30,40,35,30,-1|-1,-1,5,70,90,-1|-1,-1,-1,80,5,-1&chm=F,FF9900,0,1:4,40|H,0CBF0B,0,1:4,1:20|H,000000,4,1:4,1:40|H,0000FF,3,1:4,1:20|o,FF0000,5,-1,7|o,FF0000,6,-1,7 Prefix just the delimited string you enter by 1: to additionally display Candlestick/Box Charts or by 0: to only display Candlestick/Box Chart" :
(ctype.substring(0,1) == 'l' ? "Enter c for Even or s for Sparklines or xy for Just XY Line Chart look then a space and then enter delimited values string for Line Chart. Here is a Candlestick and Line Chart idea eg. c 1:20,10,15,25,17,30|0,5,10,7,12,6|35,25,45,47,24,46|15,40,30,27,39,54|70,55,63,59,80,6 Here is a Line Chart and Box Chart idea s 1:-1,5,10,7,12,-1|-1,25,30,27,24,-1|-1,40,45,47,39,-1|-1,55,63,59,80,-1|-1,30,40,35,30,-1|-1,-1,5,70,90,-1|-1,-1,-1,80,5,-1&chm=F,FF9900,0,1:4,40|H,0CBF0B,0,1:4,1:20|H,000000,4,1:4,1:40|H,0000FF,3,1:4,1:20|o,FF0000,5,-1,7|o,FF0000,6,-1,7 Prefix just the delimited string you enter by 1: to additionally display Candlestick/Box Charts or by 0: to only display Candlestick/Box Chart" :
(ctype == 'map' ? "" :
(ctype == 'gom' ? "Enter delimited values string for Google-O-Meter Chart" :
""))))))));
var oneprompt=(ctype == 'v' ? "Enter delimited values string for your Venn Diagram collaborations, optionally, such that ... " + String.fromCharCode(10) + "The first three values specify the sizes of three circles: A, B, & C. For chart with only two circles, specify zero for the third value." + String.fromCharCode(10) + "The fourth value specifies the size of the intersection of A and B." + String.fromCharCode(10) + "The fifth value specifies the size of the intersection of A and C. For a chart with only two circles, do not specify a value here." + String.fromCharCode(10) + "The sixth value specifies the size of the intersection of B and C. For a chart with only two circles, do not specify a value here." + String.fromCharCode(10) + "The seventh value specifies the size of the common intersection of A, B, and C. For a chart with only two circles, do not specify a value here." + String.fromCharCode(10) + String.fromCharCode(10) + "" : (ctype == 's' ? "Enter delimited values string for Scatter Chart" : (ctype == 'gv' ? "Enter delimited values string for GraphViz Chart" :
(ctype.substring(0,1) == 'p' ? "Enter delimited values string for Pie Chart" :
((ctype + ' ').substring(0,2).substring(0,1) == 'bv'.substring(0,1) ? "Enter g for Grouped or s for Stacked or o for Overlapped Bar Chart look then a space and then enter delimited values string for Bar Chart. Here is a Candlestick and Bar Chart idea eg. g 1:20,10,15,25,17,30|0,5,10,7,12,6|35,25,45,47,24,46|15,40,30,27,39,54|70,55,63,59,80,6 Here is a vertical Bar Chart and Box Chart idea vs 1:-1,5,10,7,12,-1|-1,25,30,27,24,-1|-1,40,45,47,39,-1|-1,55,63,59,80,-1|-1,30,40,35,30,-1|-1,-1,5,70,90,-1|-1,-1,-1,80,5,-1&chm=F,FF9900,0,1:4,40|H,0CBF0B,0,1:4,1:20|H,000000,4,1:4,1:40|H,0000FF,3,1:4,1:20|o,FF0000,5,-1,7|o,FF0000,6,-1,7 Prefix just the delimited string you enter by 1: to additionally display Candlestick/Box Charts or by 0: to only display Candlestick/Box Chart" :
(ctype.substring(0,1) == 'l' ? "Enter c for Even or s for Sparklines or xy for Just XY Line Chart look then a space and then enter delimited values string for Line Chart. Here is a Candlestick and Line Chart idea eg. c 1:20,10,15,25,17,30|0,5,10,7,12,6|35,25,45,47,24,46|15,40,30,27,39,54|70,55,63,59,80,6 Here is a Line Chart and Box Chart idea s 1:-1,5,10,7,12,-1|-1,25,30,27,24,-1|-1,40,45,47,39,-1|-1,55,63,59,80,-1|-1,30,40,35,30,-1|-1,-1,5,70,90,-1|-1,-1,-1,80,5,-1&chm=F,FF9900,0,1:4,40|H,0CBF0B,0,1:4,1:20|H,000000,4,1:4,1:40|H,0000FF,3,1:4,1:20|o,FF0000,5,-1,7|o,FF0000,6,-1,7 Prefix just the delimited string you enter by 1: to additionally display Candlestick/Box Charts or by 0: to only display Candlestick/Box Chart" :
(ctype == 'map' ? "" :
(ctype == 'gom' ? "Enter delimited values string for Google-O-Meter Chart" :
""))))))));
var asktwo=(ctype == 'v' ? true : (ctype == 's' ? true : (ctype == 'gv' ? false :
(ctype.substring(0,1) == 'p' ? true :
((ctype + ' ').substring(0,2).substring(0,1) == 'bv'.substring(0,1) ? true : (ctype.substring(0,1) == 'l' ? true :
(ctype == 'map' ? false :
(ctype == 'gom' ? true :
false))))))));

var twopb=(ctype.substring(0,1) == 'p' ? 'Any optional legend or title argument snippets? Optionally prefix by 3 for 3d Pie Chart or by c for Concentric Pie Chart. Eg. 3' + chdl + preachtt + '&chtt=My%20' + cencodename + '&chco=' + defchco : 'Any optional legend or title argument snippets? Eg. ' + chdl + preachtt + '&chtt=My%20' + cencodename + '&chco=' + defchco);
var beforeanswer=(ctype.substring(0,1) == 'l' ? 'c ' : ((ctype + ' ').substring(0,2).substring(0,1) == 'bv'.substring(0,1) ? 'vg ' : ''));

var emsmlist='';

… that goes into helping make the changed latest draft image_venn.html Google Chart Image Chart Venn Chart or Scatter Chart or GraphViz Chart or Pie Chart or Line Chart or Bar Chart or Candlestick/Box Chart or Google-O-Meter Chart or Map Chart interfacing web application you can also try below, one of the happiest little vegemites we know.


Previous relevant Google Chart Image Chart Colour Tutorial is shown below.

Google Chart Image Chart Colour Tutorial

Google Chart Image Chart Colour Tutorial

Restricting you creatives to “inhouse annotations” of the “gray variety” might be seen as a bit boooorrrriiiinnnngggg! And so, onto the progress up to yesterday’s Google Chart Image Chart Rubber Banding Tutorial, today we’ve added a …

  • colour picker … way user can define an “inhouse annotations” colour … and while we were at it …
  • as far as text “inhouse annotations” go we’ve added a counterclockwise from the horizon, in degrees, way to define an angle the text should be placed at … and …
  • we’ve stopped closing off the text font size dropdown too early, allowing the user to mix it up with their annotations, and so …

    We now recommend, for those users pushing the boundaries of functionality, to gather all their “inhouse annotations” together before any “graphical canvas annotations” are thought about.

Which begs the question …

Where do you get it?

Well, here, via … dare we say it?! … … via …

Mantissa Madness Monday

Both colour and degree counterclockwise angle became “Mantissa Madness Monday” tragics, a bit like moi, really?

How did we express these two measures?

  • colour can be derived at the 404.php end via mantissae that are 9 or more long where a number of the form rrrgggbbb is numerical and passed across to 404.php in the y co-ordinate mantissa … while … kind of crazily …
  • angle can be a set of zeros in the x co-ordinate mantissa represented by zero characters to the length of the angle from 1 to 359 in front of a pre-existant font size (in px) usage, from last “Mantissa Madness Monday” (us getting away with this because no font size should start with a zero)

Oh! We have such fun around here?! Below is PHP WordPress blog 404.php code …

<?php

// text placement
$black = imagecolorallocatealpha($im, 1, 1, 1, 0);
$blackish = imagecolorallocatealpha($im, 127, 127, 127, 64);
$yis=$csv[1];
$mantissae=explode('.', ('' . $csv[1]));
if (sizeof($mantissae) > 1) {
if (strlen($mantissae[1]) >= 9) {
$black = imagecolorallocatealpha($im, intval(substr($mantissae[1],0,3)), intval(substr(substr($mantissae[1],3),0,3)), intval(substr(substr($mantissae[1],6),0,3)), 0);
$blackish = imagecolorallocatealpha($im, intval(substr($mantissae[1],0,3)), intval(substr(substr($mantissae[1],3),0,3)), intval(substr(substr($mantissae[1],6),0,3)), 64);
}
$yis=$mantissae[0];
}

$za=0;
$xis=$csv[0];

$mantissae=explode('.', ('' . $csv[0]));
if (sizeof($mantissae) > 1) {
if (substr($mantissae[1],0,1) == '0') {
if (str_replace('0','',$mantissae[1]) != '') {
while (substr($mantissae[1],0,1) == '0') {
$za++;
$mantiss=substr($mantissae[1],1);
$mantissae[1]=$mantiss;
}
}
}

$tenpx=$mantissae[1];
$xis=$mantissae[0];
}
try {
if (function_exists('imagettftext')) {
if (explode('' . $csv[0] . ',' . $csv[1] . ',', $plotstring)[1] !== '') {
//echo explode('' . $csv[0] . ',' . $csv[1] . ',', $plotstring)[1];
//exit;
imagettftext($im, $tenpx, $za, $xis, $yis, $black, realpath('arial.ttf'), explode('' . $csv[0] . ',' . $csv[1] . ',', $plotstring)[1]);
}
}
} catch (Exception $e) { }

?>

… used by our changed latest draft image_venn.html Google Chart Image Chart Venn Chart or Scatter Chart or GraphViz Chart or Pie Chart or Line Chart or Bar Chart or Candlestick Chart or Map Chart interfacing web application you can also try below.


Previous relevant Google Chart Image Chart Rubber Banding Tutorial is shown below.

Google Chart Image Chart Rubber Banding Tutorial

Google Chart Image Chart Rubber Banding Tutorial

The Javascript clientside idea of “Rubber Banding”

Rubber banding is a popular technique of drawing geometric primitives such as line, polylines, rectangle, circle and ellipse on the computer screen.

… really appeals to our “inner programmer” … damn! … come, thou, out into the open, reveal thyself! … the sunshine is wonderful down here, and we’ve done away with death duties! … mostly! but it is …

  • only really a non-mobile prospect …

    function checkforaction(rubberbanding,nx,ny) {
    var bcbit='background-color:rgba(127,127,127,0.5);';
    var zeroes='';
    var classbit='';
    var brbit='';
    var ourdist=0;
    var ioff=(rubberbanding == true ? 1 : 0);
    var mone=1;

    curno=eval('' + xneeds.length);
    if (eval(ioff + curno) >= needtohave) {
    if (!rubberbanding) {
    document.getElementById('fauxdtext').innerHTML='';
    }
    if (curmode == 8) {
    zeroes='00000000';
    classbit=' class="crerect" ';
    } else if (curmode == -5) {
    //alert(1);
    bcbit='border:2px solid rgba(127,127,127,0.5);';
    if (rubberbanding) {
    ourdist=eval(2.0 * Math.sqrt((nx - xneeds[0]) * (nx - xneeds[0]) + (ny - yneeds[0]) * (ny - yneeds[0])));
    ourdist-=10;
    bcbit='border:2px solid gray;background-color:transparent;';
    } else {
    ourdist=eval(2.0 * Math.sqrt((xneeds[1] - xneeds[0]) * (xneeds[1] - xneeds[0]) + (yneeds[1] - yneeds[0]) * (yneeds[1] - yneeds[0])));
    }
    //alert(ourdist);
    //xneeds[1]=Math.floor('' + ourdist);
    //yneeds[1]=xneeds[1];
    brbit='border-radius:' + Math.floor(eval(ourdist / 2)) + 'px;';
    zeroes='00000';
    classbit=' class="ocirc" ';
    //alert('open circle');
    } else if (curmode == 6) {
    if (rubberbanding) {
    ourdist=eval(2.0 * Math.sqrt((nx - xneeds[0]) * (nx - xneeds[0]) + (ny - yneeds[0]) * (ny - yneeds[0])));
    ourdist-=10;
    } else {
    ourdist=eval(2.0 * Math.sqrt((xneeds[1] - xneeds[0]) * (xneeds[1] - xneeds[0]) + (yneeds[1] - yneeds[0]) * (yneeds[1] - yneeds[0])));
    }
    //xneeds[1]=Math.floor('' + ourdist);
    //yneeds[1]=xneeds[1];
    brbit='border-radius:' + Math.floor(eval(ourdist / 2)) + 'px;';
    //bcbit='border:2px solid rgba(127,127,127,0.5);';
    zeroes='000000';
    classbit=' class="ccirc" ';
    //alert('closed circle ' + bcbit);
    } else if (curmode == -4) {
    if (rubberbanding) {
    mone=0.90;
    bcbit='border:2px solid gray;background-color:transparent;';
    } else {
    bcbit='border:2px solid rgba(127,127,127,0.5);';
    }
    zeroes='00';
    classbit=' class="orect" ';
    } else if (curmode == 2) {
    zeroes='0';
    if (rubberbanding) {
    if (Math.min(xneeds[0],nx) == xneeds[0] && Math.min(yneeds[0],ny) == ny) { // thanks to https://stackoverflow.com/questions/18012420/draw-diagonal-lines-in-div-background-with-css
    classbit=' class="crossedtotl" ';
    } else if (Math.min(xneeds[0],nx) == nx && Math.min(yneeds[0],ny) == yneeds[0]) { // thanks to https://stackoverflow.com/questions/18012420/draw-diagonal-lines-in-div-background-with-css
    classbit=' class="crossedtotl" ';
    } else {
    classbit=' class="crossedtotr" ';
    }
    } else {
    if (Math.min(xneeds[0],xneeds[1]) == xneeds[0] && Math.min(yneeds[0],yneeds[1]) == yneeds[1]) { // thanks to https://stackoverflow.com/questions/18012420/draw-diagonal-lines-in-div-background-with-css
    classbit=' class="crossedtotl" ';
    } else if (Math.min(xneeds[0],xneeds[1]) == xneeds[1] && Math.min(yneeds[0],yneeds[1]) == yneeds[0]) { // thanks to https://stackoverflow.com/questions/18012420/draw-diagonal-lines-in-div-background-with-css
    classbit=' class="crossedtotl" ';
    } else {
    classbit=' class="crossedtotr" ';
    }
    }
    bcbit='';
    } else if (curmode == 4) {
    if (rubberbanding) {
    mone=0.90;
    }
    zeroes='0000';
    classbit=' class="crect" ';
    }
    if (!rubberbanding) {
    curno=-1;
    //if (brbit != '') {
    //document.getElementById('dtext').innerHTML+='<div' + classbit + ' style="' + brbit + 'position:absolute;left:' + Math.min(xneeds[0],nx) + 'px;top:' + Math.min(yneeds[0],ny) + 'px;width:' + Math.abs(xneeds[0] - nx) + 'px;height:' + Math.abs(yneeds[0] - ny) + 'px;z-index:98;' + bcbit + '"></div>';
    //} else {
    //document.getElementById('dtext').innerHTML+='<div' + classbit + ' style="' + brbit + 'position:absolute;left:' + Math.min(xneeds[0],xneeds[1]) + 'px;top:' + Math.min(yneeds[0],yneeds[1]) + 'px;width:' + Math.abs(xneeds[0] - xneeds[1]) + 'px;height:' + Math.abs(yneeds[0] - yneeds[1]) + 'px;z-index:98;' + bcbit + '"></div>';
    //}
    document.getElementById('aemail').href+='&text' + textnum + '=' + encodeURIComponent('' + xneeds[0] + '.' + zeroes + xneeds[1] + ',' + yneeds[0] + '.' + yneeds[1] + ',') + '';
    document.getElementById('asms').href+='&text' + textnum + '=' + encodeURIComponent('' + xneeds[0] + '.' + zeroes + xneeds[1] + ',' + yneeds[0] + '.' + yneeds[1] + ',') + '';
    aemailurl+='&text' + textnum + '=' + encodeURIComponent('' + xneeds[0] + '.' + zeroes + xneeds[1] + ',' + yneeds[0] + '.' + yneeds[1] + ',') + '';
    asmsurl+='&text' + textnum + '=' + encodeURIComponent('' + xneeds[0] + '.' + zeroes + xneeds[1] + ',' + yneeds[0] + '.' + yneeds[1] + ',') + '';
    arest+='&text' + textnum + '=' + encodeURIComponent('' + xneeds[0] + '.' + zeroes + xneeds[1] + ',' + yneeds[0] + '.' + yneeds[1] + ',') + '';
    }
    if (brbit != '') {
    //alert('brbit=' + brbit);
    //xneeds[0]-=(xneeds[1] - xneeds[0]);
    //yneeds[0]-=(yneeds[1] - yneeds[0]);
    //alert('xneeds[0]=' + xneeds[0]);
    if (rubberbanding) {
    document.getElementById('fauxdtext').innerHTML='<div' + classbit + ' style="' + brbit + 'z-index:-89;position:absolute;left:' + Math.floor(eval(Math.min(xneeds[0],xneeds[0]) - ourdist / 2)) + 'px;top:' + Math.floor(eval(Math.min(yneeds[0],yneeds[0]) - ourdist / 2)) + 'px;width:' + ourdist + 'px;height:' + ourdist + 'px;z-index:98;' + bcbit + '"></div>';
    } else {
    document.getElementById('dtext').innerHTML+='<div' + classbit + ' style="' + brbit + 'position:absolute;left:' + Math.floor(eval(Math.min(xneeds[0],xneeds[0]) - ourdist / 2)) + 'px;top:' + Math.floor(eval(Math.min(yneeds[0],yneeds[0]) - ourdist / 2)) + 'px;width:' + ourdist + 'px;height:' + ourdist + 'px;z-index:98;' + bcbit + '"></div>';
    }
    } else {
    if (rubberbanding) {
    document.getElementById('fauxdtext').innerHTML='<div' + classbit + ' style="' + brbit + 'z-index:-89;position:absolute;left:' + Math.min(xneeds[0],nx) + 'px;top:' + Math.min(yneeds[0],ny) + 'px;width:' + Math.max(Math.floor(eval(-30 + Math.abs(xneeds[0] - nx))),Math.floor(eval(mone * Math.abs(xneeds[0] - nx)))) + 'px;height:' + Math.max(Math.floor(eval(-30 + Math.abs(yneeds[0] - ny))),Math.floor(eval(mone * Math.abs(yneeds[0] - ny)))) + 'px;z-index:98;' + bcbit + '"></div>';
    } else {
    document.getElementById('dtext').innerHTML+='<div' + classbit + ' style="' + brbit + 'position:absolute;left:' + Math.min(xneeds[0],xneeds[1]) + 'px;top:' + Math.min(yneeds[0],yneeds[1]) + 'px;width:' + Math.abs(xneeds[0] - xneeds[1]) + 'px;height:' + Math.abs(yneeds[0] - yneeds[1]) + 'px;z-index:98;' + bcbit + '"></div>';
    }
    }
    if (!rubberbanding) {
    textnum++;
    xneeds=[];
    yneeds=[];
    //alert('arest=' + arest);
    document.getElementById('tdright').innerHTML="  <span id=spemail><a target=_blank href='mailto:?subject=My%20" + cencodename + "%20...%20best%20viewed%20in%20landscape%20...&body=" + encodeURIComponent((document.getElementById('myvenn').src + arest).replace((document.getElementById('myvenn').src + arest).split('?')[0].split('#')[0], document.URL.split('?')[0].split('#')[0])) + "' id=aemail title=Email>&#128231;</a></span>      <span id=spsms><a target=_blank onmouseover=\"if (smsee.length == 0 && origsmsurl.indexOf('sms:&') != -1) { smsee=prompt('Please enter SMS number to send to.', ''); if (smsee == null) { smsee=''; } else { origsmsurl=origsmsurl.replace('sms:&','sms:' + smsee + '&'); asmsurl=asmsurl.replace('sms:&','sms:' + smsee + '&'); this.href=asmsurl; } }\" ontouchstart=\"if (smsee.length == 0 && origsmsurl.indexOf('sms:&') != -1) { smsee=prompt('Please enter SMS number to send to.', ''); if (smsee == null) { smsee=''; } else { origsmsurl=origsmsurl.replace('sms:&','sms:' + smsee + '&'); asmsurl=asmsurl.replace('sms:&','sms:' + smsee + '&'); this.href=asmsurl; } }\" href='sms:&body=" + encodeURIComponent((document.getElementById('myvenn').src + arest).replace(document.getElementById('myvenn').src.split('?')[0].split('#')[0], document.URL.split('?')[0].split('#')[0])) + "' id=asms title=SMS>&#128223;</a></span><br><br>  <input title=\"\" onclick=\"event.stopPropagation();\" id=ilp onblur=\"waitfortwo(0); lasttext=this.value.replace(/\~\~/g, '<br>'); this.title=lasttext; if (!navigator.userAgent.match(/Android|BlackBerry|iPhone|iPad|iPod|Opera Mini|IEMobile/i)) { this.value=''; } this.placeholder='Click where you want ... ' + lasttext.replace(/\<br\>/g, String.fromCharCode(10)); mvp.setAttribute('content','initial-scale=1'); document.getElementById('myvenn').scrollIntoView();\" placeholder='Enter text and later click place for it on " + decodeURIComponent(cencodename) + " to left (line feed is ~~)' type=text style=width:500px; value=''></input>" + fszbit + "<br><br>  <img id=line src='/MarkItUp/line.png' onclick=\"event.stopPropagation(); this.style.border='1px dotted red'; waitfortwo(2);\"></img>  <img id=rectangle src='/MarkItUp/rectangle.png' onclick=\"event.stopPropagation(); this.style.border='1px dotted red'; waitfortwo(4);\"></img>  <img id=orectangle src='/MarkItUp/orectangle.png' onclick=\"event.stopPropagation(); this.style.border='1px dotted red'; waitfortwo(-4);\"></img>  <img id=circle src='/MarkItUp/circlefill.png' onclick=\"event.stopPropagation(); this.style.border='1px dotted red'; waitfortwo(6);\"></img>  <img id=ocircle src='/MarkItUp/circle.png' onclick=\"event.stopPropagation(); this.style.border='1px dotted red'; waitfortwo(-5);\"></img>  <button id=orerect onclick=\"event.stopPropagation(); this.style.border='1px dotted red'; waitfortwo(8);\" title=\"Zoom in on rectangle you define via two clicks\" style=display:none;>&#128270;</button>" + lastbit + atend;
    //alert(1);
    if (!navigator.userAgent.match(/Android|BlackBerry|iPhone|iPad|iPod|Opera Mini|IEMobile/i)) { document.getElementById('ilp').focus(); }
    document.getElementById('ilp').placeholder='Enter text and later click place for it on ' + decodeURIComponent(cencodename) + ' to left (line feed is ~~)';
    }
    } else if (curmode == 2 && !rubberbanding) {
    document.getElementById('line').style.border='1px dashed yellow';
    } else if (curmode == -4 && !rubberbanding) {
    document.getElementById('orectangle').style.border='1px dashed yellow';
    } else if (curmode == 4 && !rubberbanding) {
    document.getElementById('rectangle').style.border='1px dashed yellow';
    } else if (curmode == -5 && !rubberbanding) {
    document.getElementById('ocircle').style.border='1px dashed yellow';
    } else if (curmode == 6 && !rubberbanding) {
    document.getElementById('circle').style.border='1px dashed yellow';
    } else if (curmode == 8 && !rubberbanding) {
    document.getElementById('orerect').style.border='1px dashed yellow';
    }
    }

    // Rubber banding
    document.body.addEventListener('mousemove', function(evt){
    evt = evt || window.event;

    evt.preventDefault();

    elemLeft = document.getElementById('myvenn').offsetLeft;
    elemTop = document.getElementById('myvenn').offsetTop;

    //document.getElementById('myh3').innerHTML+=' ' + elemLeft + ':' + elemTop;
    //document.getElementById('myh3').innerHTML+=' ' + document.body.scrollLeft + '.' + document.body.scrollTop;

    if (evt.touches) {
    if (evt.touches[0].pageX) {
    //alert('here');
    xx = evt.touches[0].pageX + document.body.scrollLeft - elemLeft;
    yy = evt.touches[0].pageY + document.body.scrollTop - elemTop;
    if (xx >= 0 && xx <= eval(('' + document.getElementById('myvenn').width).replace('px','')) && yy >= 0 && yy <= eval(('' + document.getElementById('myvenn').height).replace('px',''))) {
    if (curno == 1 && (lastx != xx || lasty != yy)) {
    checkforaction(true,xx,yy);
    }
    //lastx=xx;
    //lasty=yy;
    //alert('x:' + x + ' and y:' + y);
    }
    } else {
    //alert('Here');
    xx = evt.touches[0].clientX + document.body.scrollLeft - elemLeft;
    yy = evt.touches[0].clientY + document.body.scrollTop - elemTop;
    if (xx >= 0 && xx <= eval(('' + document.getElementById('myvenn').width).replace('px','')) && yy >= 0 && yy <= eval(('' + document.getElementById('myvenn').height).replace('px',''))) {
    if (curno == 1 && (lastx != xx || lasty != yy)) {
    checkforaction(true,xx,yy);
    }
    //lastx=xx;
    //lasty=yy;
    //alert('x:' + x + ' and y:' + y);
    }
    }
    } else if (evt.clientX || ev.clientY) {
    //alert('HERE');
    xx = evt.clientX + document.body.scrollLeft - elemLeft;
    yy = evt.clientY + document.body.scrollTop - elemTop;
    if (xx >= 0 && xx <= eval(('' + document.getElementById('myvenn').width).replace('px','')) && yy >= 0 && yy <= eval(('' + document.getElementById('myvenn').height).replace('px',''))) {
    if (curno == 1 && (lastx != xx || lasty != yy)) {
    checkforaction(true,xx,yy);
    }
    //lastx=xx;
    //lasty=yy;
    }
    } else {
    //alert('HEre');
    xx = evt.pageX + document.body.scrollLeft - elemLeft;
    yy = evt.pageY + document.body.scrollTop - elemTop;
    if (xx >= 0 && xx <= eval(('' + document.getElementById('myvenn').width).replace('px','')) && yy >= 0 && yy <= eval(('' + document.getElementById('myvenn').height).replace('px',''))) {
    if (curno == 1 && (lastx != xx || lasty != yy)) {
    checkforaction(true,xx,yy);
    }
    //lastx=xx;
    //lasty=yy;
    }
    }
    });

    … at least for us (being as we do not want to clobber any pinch or spread gesture ideas, for the user)
  • is only a really, “nice to have” functionality idea

Even so, achieving even a 95% percent working “rubber band” is like … is like …

Barracking for Hairtie United …
You little beauty, Untied!

And so, further to yesterday’s Google Chart Image Chart Circle Annotation Tutorial we have this non-mobile “Rubber Banding” inhouse annotation functionality included in our changed latest draft image_venn.html Google Chart Image Chart Venn Chart or Scatter Chart or GraphViz Chart or Pie Chart or Line Chart or Bar Chart or Candlestick Chart or Map Chart interfacing web application you can also try below.

But there’s more! Despite how long out of the day it takes to barrack for Hairtie United, there was a mobile matter we resolved. A slide in today’s animated GIF presentation shows the issue. On mobile platforms, with these inhouse annotations, it would immediately show a tiny annotation. There panned out to be two event programming related issues we needed to fix related to this problem …

  1. change looking for a “touchstart” event, and instead look for a “touchdown” event for a document.body scope (else we might have restricted the “scope” to just document.getEleementById(‘myvenn’) as another approach (and you should note our event.stopPropagation() statements in lots of places as another research point for you)) because we are talking “discrete click” user behaviour we are targeting … as well as …
  2. start checking that the co-ordinates calculated fall into the range of the Google Charts Image Chart image dimensions … doh!


document.body.addEventListener('touchdown', function(evt){
//alert(8);
evt = evt || window.event;

evt.preventDefault();

elemLeft = document.getElementById('myvenn').offsetLeft;
elemTop = document.getElementById('myvenn').offsetTop;

//document.getElementById('myh3').innerHTML+=' ' + elemLeft + ';' + elemTop;

if (evt.touches) {
if (evt.touches[0].pageX) {
//alert('here');
x = evt.touches[0].pageX + document.body.scrollLeft - elemLeft;
y = evt.touches[0].pageY + document.body.scrollTop - elemTop;
if (x >= 0 && x <= eval(('' + document.getElementById('myvenn').width).replace('px','')) && y >= 0 && y <= eval(('' + document.getElementById('myvenn').height).replace('px',''))) {
if (curno >= 0 && (lastx != x || lasty != y)) {
xneeds.push(x);
yneeds.push(y);
checkforaction(false,-1,-1);
}
lastx=x;
lasty=y;
}
//alert('x:' + x + ' and y:' + y);
} else {
//alert('Here');
x = evt.touches[0].clientX + document.body.scrollLeft - elemLeft;
y = evt.touches[0].clientY + document.body.scrollTop - elemTop;
if (x >= 0 && x <= eval(('' + document.getElementById('myvenn').width).replace('px','')) && y >= 0 && y <= eval(('' + document.getElementById('myvenn').height).replace('px',''))) {
if (curno >= 0 && (lastx != x || lasty != y)) {
xneeds.push(x);
yneeds.push(y);
checkforaction(false,-1,-1);
}
lastx=x;
lasty=y;
}
//alert('x:' + x + ' and y:' + y);
}
} else if (evt.clientX || ev.clientY) {
//alert('HERE');
x = evt.clientX + document.body.scrollLeft - elemLeft;
y = evt.clientY + document.body.scrollTop - elemTop;
if (x >= 0 && x <= eval(('' + document.getElementById('myvenn').width).replace('px','')) && y >= 0 && y <= eval(('' + document.getElementById('myvenn').height).replace('px',''))) {
if (curno >= 0 && (lastx != x || lasty != y)) {
xneeds.push(x);
yneeds.push(y);
checkforaction(false,-1,-1);
}
lastx=x;
lasty=y;
}
} else {
//alert('HEre');
x = evt.pageX + document.body.scrollLeft - elemLeft;
y = evt.pageY + document.body.scrollTop - elemTop;
if (x >= 0 && x <= eval(('' + document.getElementById('myvenn').width).replace('px','')) && y >= 0 && y <= eval(('' + document.getElementById('myvenn').height).replace('px',''))) {
if (curno >= 0 && (lastx != x || lasty != y)) {
xneeds.push(x);
yneeds.push(y);
checkforaction(false,-1,-1);
}
lastx=x;
lasty=y;
}
}
});

Did you know?

Well … we didn’t?! We happened to try the web application above on a tiny iPad and saw that HTML button elements with an innerHTML label containing a line feed ( ie. <br> ) only showed the top line, and, alas, for that button in question, the vital new information used to be on the second line. Hence our fix …


//document.getElementById('bshare').innerHTML='Repainting Top Left Image Periodically ... <br>Click here to Broadcast this session to other interested parties ...';
document.getElementById('bshare').innerHTML='Click here to Broadcast this session to other interested parties ...<br>Repainting Top Left Image Periodically ...';


Previous relevant Google Chart Image Chart Circle Annotation Tutorial is shown below.

Google Chart Image Chart Circle Annotation Tutorial

Google Chart Image Chart Circle Annotation Tutorial

Today, we add …

  • open circle
  • filled circle

… annotation possibilities onto the “Broadcast Talk” work in yesterday’s Google Chart Image Chart Broadcast Talk Context Tutorial.

The CSS border-radius property has come to the rescue of many a programmer, saving us from resorting to SVG to display circle or ellipses or arcs of various sorts …


function checkforaction() {
var bcbit='background-color:rgba(127,127,127,0.5);';
var zeroes='';
var classbit='';
var brbit='';
var ourdist=0;


curno=eval('' + xneeds.length);
if (curno >= needtohave) {
if (curmode == 8) {
zeroes='00000000';
classbit=' class="crerect" ';
} else if (curmode == -5) {
//alert(1);
ourdist=eval(2.0 * Math.sqrt((xneeds[1] - xneeds[0]) * (xneeds[1] - xneeds[0]) + (yneeds[1] - yneeds[0]) * (yneeds[1] - yneeds[0])));
//alert(ourdist);
//xneeds[1]=Math.floor('' + ourdist);
//yneeds[1]=xneeds[1];
brbit='border-radius:' + Math.floor(eval(ourdist / 2)) + 'px;';
bcbit='border:2px solid rgba(127,127,127,0.5);';
zeroes='00000';
classbit=' class="ocirc" ';
//alert('open circle');
} else if (curmode == 6) {
ourdist=eval(2.0 * Math.sqrt((xneeds[1] - xneeds[0]) * (xneeds[1] - xneeds[0]) + (yneeds[1] - yneeds[0]) * (yneeds[1] - yneeds[0])));
//xneeds[1]=Math.floor('' + ourdist);
//yneeds[1]=xneeds[1];
brbit='border-radius:' + Math.floor(eval(ourdist / 2)) + 'px;';
//bcbit='border:2px solid rgba(127,127,127,0.5);';
zeroes='000000';
classbit=' class="ccirc" ';
//alert('closed circle ' + bcbit);
}
else if (curmode == -4) {
bcbit='border:2px solid rgba(127,127,127,0.5);';
zeroes='00';
classbit=' class="orect" ';
} else if (curmode == 2) {
zeroes='0';
if (Math.min(xneeds[0],xneeds[1]) == xneeds[0] && Math.min(yneeds[0],yneeds[1]) == yneeds[1]) { // thanks to https://stackoverflow.com/questions/18012420/draw-diagonal-lines-in-div-background-with-css
classbit=' class="crossedtotl" ';
} else if (Math.min(xneeds[0],xneeds[1]) == xneeds[1] && Math.min(yneeds[0],yneeds[1]) == yneeds[0]) { // thanks to https://stackoverflow.com/questions/18012420/draw-diagonal-lines-in-div-background-with-css
classbit=' class="crossedtotl" ';
} else {
classbit=' class="crossedtotr" ';
}
bcbit='';
} else if (curmode == 4) {
zeroes='0000';
classbit=' class="crect" ';
}
curno=-1;
//if (brbit != '') {
//document.getElementById('dtext').innerHTML+='<div' + classbit + ' style="' + brbit + 'position:absolute;left:' + Math.min(xneeds[0],xneeds[1]) + 'px;top:' + Math.min(yneeds[0],yneeds[1]) + 'px;width:' + Math.abs(xneeds[0] - xneeds[1]) + 'px;height:' + Math.abs(yneeds[0] - yneeds[1]) + 'px;z-index:98;' + bcbit + '"></div>';
//} else {
//document.getElementById('dtext').innerHTML+='<div' + classbit + ' style="' + brbit + 'position:absolute;left:' + Math.min(xneeds[0],xneeds[1]) + 'px;top:' + Math.min(yneeds[0],yneeds[1]) + 'px;width:' + Math.abs(xneeds[0] - xneeds[1]) + 'px;height:' + Math.abs(yneeds[0] - yneeds[1]) + 'px;z-index:98;' + bcbit + '"></div>';
//}
document.getElementById('aemail').href+='&text' + textnum + '=' + encodeURIComponent('' + xneeds[0] + '.' + zeroes + xneeds[1] + ',' + yneeds[0] + '.' + yneeds[1] + ',') + '';
document.getElementById('asms').href+='&text' + textnum + '=' + encodeURIComponent('' + xneeds[0] + '.' + zeroes + xneeds[1] + ',' + yneeds[0] + '.' + yneeds[1] + ',') + '';
aemailurl+='&text' + textnum + '=' + encodeURIComponent('' + xneeds[0] + '.' + zeroes + xneeds[1] + ',' + yneeds[0] + '.' + yneeds[1] + ',') + '';
asmsurl+='&text' + textnum + '=' + encodeURIComponent('' + xneeds[0] + '.' + zeroes + xneeds[1] + ',' + yneeds[0] + '.' + yneeds[1] + ',') + '';
arest+='&text' + textnum + '=' + encodeURIComponent('' + xneeds[0] + '.' + zeroes + xneeds[1] + ',' + yneeds[0] + '.' + yneeds[1] + ',') + '';
if (brbit != '') {
//alert('brbit=' + brbit);
//xneeds[0]-=(xneeds[1] - xneeds[0]);
//yneeds[0]-=(yneeds[1] - yneeds[0]);
//alert('xneeds[0]=' + xneeds[0]);
document.getElementById('dtext').innerHTML+='<div' + classbit + ' style="' + brbit + 'position:absolute;left:' + Math.floor(eval(Math.min(xneeds[0],xneeds[0]) - ourdist / 2)) + 'px;top:' + Math.floor(eval(Math.min(yneeds[0],yneeds[0]) - ourdist / 2)) + 'px;width:' + ourdist + 'px;height:' + ourdist + 'px;z-index:98;' + bcbit + '"></div>';
} else {

document.getElementById('dtext').innerHTML+='<div' + classbit + ' style="' + brbit + 'position:absolute;left:' + Math.min(xneeds[0],xneeds[1]) + 'px;top:' + Math.min(yneeds[0],yneeds[1]) + 'px;width:' + Math.abs(xneeds[0] - xneeds[1]) + 'px;height:' + Math.abs(yneeds[0] - yneeds[1]) + 'px;z-index:98;' + bcbit + '"></div>';
}
textnum++;
xneeds=[];
yneeds=[];
//alert('arest=' + arest);
document.getElementById('tdright').innerHTML="  <span id=spemail><a target=_blank href='mailto:?subject=My%20" + cencodename + "%20...%20best%20viewed%20in%20landscape%20...&body=" + encodeURIComponent((document.getElementById('myvenn').src + arest).replace((document.getElementById('myvenn').src + arest).split('?')[0].split('#')[0], document.URL.split('?')[0].split('#')[0])) + "' id=aemail title=Email>&#128231;</a></span>      <span id=spsms><a target=_blank onmouseover=\"if (smsee.length == 0 && origsmsurl.indexOf('sms:&') != -1) { smsee=prompt('Please enter SMS number to send to.', ''); if (smsee == null) { smsee=''; } else { origsmsurl=origsmsurl.replace('sms:&','sms:' + smsee + '&'); asmsurl=asmsurl.replace('sms:&','sms:' + smsee + '&'); this.href=asmsurl; } }\" ontouchstart=\"if (smsee.length == 0 && origsmsurl.indexOf('sms:&') != -1) { smsee=prompt('Please enter SMS number to send to.', ''); if (smsee == null) { smsee=''; } else { origsmsurl=origsmsurl.replace('sms:&','sms:' + smsee + '&'); asmsurl=asmsurl.replace('sms:&','sms:' + smsee + '&'); this.href=asmsurl; } }\" href='sms:&body=" + encodeURIComponent((document.getElementById('myvenn').src + arest).replace(document.getElementById('myvenn').src.split('?')[0].split('#')[0], document.URL.split('?')[0].split('#')[0])) + "' id=asms title=SMS>&#128223;</a></span><br><br>  <input title=\"\" onclick=\"event.stopPropagation();\" id=ilp onblur=\"waitfortwo(0); lasttext=this.value.replace(/\~\~/g, '<br>'); this.title=lasttext; if (!navigator.userAgent.match(/Android|BlackBerry|iPhone|iPad|iPod|Opera Mini|IEMobile/i)) { this.value=''; } this.placeholder='Click where you want ... ' + lasttext.replace(/\<br\>/g, String.fromCharCode(10)); mvp.setAttribute('content','initial-scale=1'); document.getElementById('myvenn').scrollIntoView();\" placeholder='Enter text and later click place for it on " + decodeURIComponent(cencodename) + " to left (line feed is ~~)' type=text style=width:500px; value=''></input>" + fszbit + "<br><br>  <img id=line src='/MarkItUp/line.png' onclick=\"event.stopPropagation(); this.style.border='1px dotted red'; waitfortwo(2);\"></img>  <img id=rectangle src='/MarkItUp/rectangle.png' onclick=\"event.stopPropagation(); this.style.border='1px dotted red'; waitfortwo(4);\"></img>  <img id=orectangle src='/MarkItUp/orectangle.png' onclick=\"event.stopPropagation(); this.style.border='1px dotted red'; waitfortwo(-4);\"></img>  <img id=circle src='/MarkItUp/circlefill.png' onclick=\"event.stopPropagation(); this.style.border='1px dotted red'; waitfortwo(6);\"></img>  <img id=ocircle src='/MarkItUp/circle.png' onclick=\"event.stopPropagation(); this.style.border='1px dotted red'; waitfortwo(-5);\"></img>  <button id=orerect onclick=\"event.stopPropagation(); this.style.border='1px dotted red'; waitfortwo(8);\" title=\"Zoom in on rectangle you define via two clicks\" style=display:none;>&#128270;</button>" + lastbit + atend;
//alert(1);
if (!navigator.userAgent.match(/Android|BlackBerry|iPhone|iPad|iPod|Opera Mini|IEMobile/i)) { document.getElementById('ilp').focus(); }
document.getElementById('ilp').placeholder='Enter text and later click place for it on ' + decodeURIComponent(cencodename) + ' to left (line feed is ~~)';
} else if (curmode == 2) {
document.getElementById('line').style.border='1px dashed yellow';
} else if (curmode == -4) {
document.getElementById('orectangle').style.border='1px dashed yellow';
} else if (curmode == 4) {
document.getElementById('rectangle').style.border='1px dashed yellow';
} else if (curmode == -5) {
document.getElementById('ocircle').style.border='1px dashed yellow';
} else if (curmode == 6) {
document.getElementById('circle').style.border='1px dashed yellow';
} else if (curmode == 8) {
document.getElementById('orerect').style.border='1px dashed yellow';
}
}

… to team up with WordPress blog 404.php changes …

<?php

if (strlen($zeroesbit) == 6) { // filled in circle
if (sizeof($csv) == 3) {
array_push($csv, $csv[2]);
} else if (sizeof($csv) >= 4) {
$dist=(2.0 * sqrt(($csv[0] - $csv[2]) * ($csv[0] - $csv[2]) + ($csv[1] - $csv[3]) * ($csv[1] - $csv[3])));
$csv[2]=$dist;
$csv[3]=$dist;
}
imagefilledellipse($im, $csv[0], $csv[1], $csv[2], $csv[3], $blackish);
} else if (strlen($zeroesbit) == 5) { // circle
if (sizeof($csv) == 3) {
array_push($csv, $csv[2]);
} else if (sizeof($csv) >= 4) {
$dist=(2.0 * sqrt(($csv[0] - $csv[2]) * ($csv[0] - $csv[2]) + ($csv[1] - $csv[3]) * ($csv[1] - $csv[3])));
$csv[2]=$dist;
$csv[3]=$dist;
}
imageellipse($im, $csv[0], $csv[1], $csv[2], $csv[3], $black);
}

?>

… with our changed ninth draft image_venn.html Google Chart Image Chart Venn Chart or Scatter Chart or GraphViz Chart or Pie Chart or Line Chart or Bar Chart or Candlestick Chart or Map Chart interfacing web application you can also try below.


Previous relevant Google Chart Image Chart Broadcast Talk Context Tutorial is shown below.

Google Chart Image Chart Broadcast Talk Context Tutorial

Google Chart Image Chart Broadcast Talk Context Tutorial

The progress, today, along the same lines as yesterday’s Google Chart Image Chart Broadcast Talk Tutorial‘s introduction of a “Broadcast Talk” functionality, was to …

  • improve “Broadcast Talk” context, by adding onto yesterday’s …

    presented as an update image still presented and updated periodically

    … only display option, with, as of today …

  • a presenter’s first snapshotted image retained for user display (in case they arrive late to the lesson … tutt tutt) … and …
  • ImageMagick created animated GIF with slides for just this first image and the most recent image, updated periodically, in bottom right cell of user display …
    <?php

    if (isset($_POST['canvcont']) && isset($_POST['uniquifier']) && strpos(('?' . $_SERVER['QUERY_STRING']), 'cht=') === false) {
    if (isset($_POST['uniquifier'])) {
    $uniquifier=str_replace('+',' ',urldecode($_POST['uniquifier']));
    }
    if ($uniquifier == '') {
    $uniquifier='_' . rand(0,78654356);
    file_put_contents($_SERVER['DOCUMENT_ROOT'] . DIRECTORY_SEPARATOR . "presentation" . $uniquifier . ".png", base64_decode( explode('base64,', str_replace(' ','+',urldecode($_POST['canvcont'])))[1]));
    exec("/usr/local/cpanel/3rdparty/bin/convert -delay 20 -loop 0 " . $_SERVER['DOCUMENT_ROOT'] . DIRECTORY_SEPARATOR . "presentation" . $uniquifier . ".png" . " " . $_SERVER['DOCUMENT_ROOT'] . DIRECTORY_SEPARATOR . "presentation" . $uniquifier . ".gif");
    echo "<html><body onload=\"if (parent.document.getElementById('uniquifier')) { if (parent.document.getElementById('uniquifier').value == '') { parent.document.getElementById('uniquifier').value='" . $uniquifier . "'; } }\"></body></html>";
    } else {
    file_put_contents($_SERVER['DOCUMENT_ROOT'] . DIRECTORY_SEPARATOR . "presentation" . $uniquifier . ".png", base64_decode( explode('base64,', str_replace(' ','+',urldecode($_POST['canvcont'])))[1]));
    exec("rm -f " . $_SERVER['DOCUMENT_ROOT'] . DIRECTORY_SEPARATOR . "presentation" . $uniquifier . ".gif ; /usr/local/cpanel/3rdparty/bin/convert -delay 200 -loop 0 " . $_SERVER['DOCUMENT_ROOT'] . DIRECTORY_SEPARATOR . "presentation_" . $uniquifier . ".png " . $_SERVER['DOCUMENT_ROOT'] . DIRECTORY_SEPARATOR . "presentation" . $uniquifier . ".png" . " " . $_SERVER['DOCUMENT_ROOT'] . DIRECTORY_SEPARATOR . "presentation" . $uniquifier . ".gif");
    }
    exit;
    }

    ?>
    … and …
  • images saved as changes are detected gathered, as ever smaller thumbnails, in the top right of four table cells of the user display …

    var iijk=0, uniquif=''; snapshots=[], elem=null, elemcontext=null, oimg=null, checkforsquare=2;

    function canvinit() {
    var kkii=0, wpx=0, hpx=0;
    var tdr=document.getElementById('tdtr').getBoundingClientRect();
    wpx=eval('' + tdr.width);
    hpx=eval('' + tdr.height);
    elem=document.getElementById('agcanvas');
    elemcontext=elem.getContext('2d');
    elem.width=elem.width;
    elemcontext.drawImage(document.getElementById('talkimg'),0,0);
    if (iijk == 0 || ('' + document.getElementById('tdtr').style.backgroundImage).indexOf('rand=0') != -1) {
    //alert('89 ' + elem.toDataURL().length);
    //snapshots.push(elem.toDataURL());
    iijk=eval(-1 + eval('' + ('' + document.getElementById('tdtr').style.backgroundImage).split('),').length));
    document.getElementById('tdtr').style.backgroundImage=('' + document.getElementById('tdtr').style.backgroundImage).replace(('' + document.getElementById('tdtr').style.backgroundImage).split('),')[iijk], '' + 'url(' + elem.toDataURL() + '),' + ('' + document.getElementById('tdtr').style.backgroundImage).split('),')[iijk]).replace('rand=0', 'rand=x');
    iijk=eval(0 + eval('' + ('' + document.getElementById('tdtr').style.backgroundImage).split('),').length));
    setInterval(canvinit, 9000);
    } else {
    elem.width=elem.width;
    elemcontext.drawImage(document.getElementById('talkimg'),0,0);
    if (document.body.innerHTML.indexOf(elem.toDataURL()) == -1) {
    //snapshots.push(elem.toDataURL());
    iijk=eval(-1 + eval('' + ('' + document.getElementById('tdtr').style.backgroundImage).split('),').length));
    document.getElementById('tdtr').style.backgroundImage=('' + document.getElementById('tdtr').style.backgroundImage).replace(('' + document.getElementById('tdtr').style.backgroundImage).split('),')[iijk], '' + 'url(' + elem.toDataURL() + '),' + ('' + document.getElementById('tdtr').style.backgroundImage).split('),')[iijk]).replace('rand=x','rand=x' + Math.floor(Math.random() * 9));
    iijk=eval(0 + eval('' + ('' + document.getElementById('tdtr').style.backgroundImage).split('),').length));
    }
    }
    var bpx='background-position:;';
    var bbpx='background-position:;';
    var bsx='background-size:;';
    var brx='background-repeat:;';
    var xstart=0;
    var ystart=0;
    var xxstart=eval('' + tdr.left);
    var yystart=eval('' + tdr.top);
    if (iijk > eval(checkforsquare * checkforsquare)) { checkforsquare++; }
    for (kkii=1; kkii<=iijk; kkii++) {
    if (bsx.indexOf(':;') != -1) {
    bsx=bsx.replace(':;', ':' + Math.round(eval(wpx / checkforsquare)) + 'px ' + Math.round(eval(hpx /checkforsquare)) + 'px;');
    brx=brx.replace(':;', ':no-repeat;');
    bpx=bpx.replace(':;', ':' + Math.round(xstart) + 'px ' + Math.round(ystart) + 'px;');
    bbpx=bbpx.replace(':;', ':' + Math.round(xxstart) + 'px ' + Math.round(yystart) + 'px;');
    } else {
    bsx=bsx.replace(';', ',' + Math.round(eval(wpx / checkforsquare)) + 'px ' + Math.round(eval(hpx /checkforsquare)) + 'px;');
    brx=brx.replace(';', ',no-repeat;');
    bpx=bpx.replace(';', ',' + Math.round(xstart) + 'px ' + Math.round(ystart) + 'px;');
    bbpx=bbpx.replace(';', ',' + Math.round(xxstart) + 'px ' + Math.round(yystart) + 'px;');
    }
    if (eval(kkii % checkforsquare) == 0) {
    xstart=0;
    xxstart=eval('' + tdr.left);
    ystart+=eval(hpx / checkforsquare);
    yystart+=eval(hpx / checkforsquare);
    } else {
    xstart+=eval(wpx / checkforsquare);
    xxstart+=eval(wpx / checkforsquare);
    }
    }
    //alert('iijk=' + iijk + ' ' + bbpx + ' ' + bpx + ' ' + bsx + ' ' + brx);
    document.getElementById('tdtr').style.backgroundRepeat=brx.split(':')[1];
    document.getElementById('tdtr').style.backgroundSize=bsx.split(':')[1];
    document.getElementById('tdtr').style.backgroundPosition=bpx.split(':')[1];
    //document.body.style.backgroundImage=('' + document.getElementById('tdtr').style.backgroundImage);
    //document.body.style.backgroundRepeat=brx.split(':')[1];
    //document.body.style.backgroundSize=bsx.split(':')[1];

    document.body.style.backgroundPosition=bbpx.split(':')[1];
    var kdss=bsx.split(':')[1].replace(/\;/g,'').split(',');
    var idss=bbpx.split(':')[1].replace(/\;/g,'').split(',');
    var jdss=(('' + document.getElementById('tdtr').style.backgroundImage) + ',').replace(';,',',').replace(/url\(/g,'').replace(/URL\(/g,'').replace(/\"\;/g,'').replace(/\"/g,'').split('),');
    document.getElementById('idiv').innerHTML='';
    var istuff='', laststuff='';
    for (var iop=0; iop<idss.length; iop++) {
    //while (istuff == laststuff) {
    if (('' + jdss[iop]) != 'undefined' && ('' + jdss[iop]).trim() != '') {
    if (jdss[iop].trim().indexOf('iVBOR') != -1) {
    istuff+='<img style="position:absolute;width:' + kdss[iop].split(' ')[0] + ';height:' + kdss[iop].split(' ')[1] + ';left:' + idss[iop].split(' ')[0] + ';top:' + idss[iop].split(' ')[1] + ';" src="data:image/png;base64,iVBOR' + jdss[iop].trim().split('iVBOR')[1] + '"></img>';
    } else if (jdss[iop].trim() .indexOf('//') != -1) {
    istuff+='<img style="position:absolute;width:' + kdss[iop].split(' ')[0] + ';height:' + kdss[iop].split(' ')[1] + ';left:' + idss[iop].split(' ')[0] + ';top:' + idss[iop].split(' ')[1] + ';" src="' + jdss[iop].trim() + '"></img>';
    }
    //}
    laststuff=istuff;
    }
    }
    document.getElementById('idiv').innerHTML=istuff;
    }

We hope you try new functionality in our changed eighth draft image_venn.html Google Chart Image Chart Venn Chart or Scatter Chart or GraphViz Chart or Pie Chart or Line Chart or Bar Chart or Candlestick Chart or Map Chart interfacing web application you can also try below.


Previous relevant Google Chart Image Chart Broadcast Talk Tutorial is shown below.

Google Chart Image Chart Broadcast Talk Tutorial

Google Chart Image Chart Broadcast Talk Tutorial

Onto yesterday’s Google Chart Image Chart Statistical Charts Tutorial progress we want to offer …

  • once a user has that “More Annotation” annotating happening … offer the chance to …
  • Broadcast … their work as it happens, dynamically …
  • to an emailee list audience

… and we’re calling this …

Broadcast Talk

… even though it is only visual by nature, presented as an update image still presented and updated periodically. Go figure?! We’re blaming that supper time two back. We’re not sure?!

Anyway, we hope you try out the new arrangements in our changed seventh draft image_venn.html Google Chart Image Chart Venn Chart or Scatter Chart or GraphViz Chart or Pie Chart or Line Chart or Bar Chart or Candlestick Chart or Map Chart interfacing web application you can also try below, and helped out by a WordPress blog good ol’ TwentyTen theme 404.php which now includes …

<?php

if (isset($_POST['canvcont']) && isset($_POST['uniquifier']) && strpos(('?' . $_SERVER['QUERY_STRING']), 'cht=') === false) {
if (isset($_POST['uniquifier'])) {
$uniquifier=str_replace('+',' ',urldecode($_POST['uniquifier']));
}
if ($uniquifier == '') {
$uniquifier='_' . rand(0,78654356);
file_put_contents($_SERVER['DOCUMENT_ROOT'] . DIRECTORY_SEPARATOR . "presentation" . $uniquifier . ".png", base64_decode( explode('base64,', str_replace(' ','+',urldecode($_POST['canvcont'])))[1]));
echo "<html><body onload=\"if (parent.document.getElementById('uniquifier')) { if (parent.document.getElementById('uniquifier').value == '') { parent.document.getElementById('uniquifier').value='" . $uniquifier . "'; } }\"></body></html>";
} else {
file_put_contents($_SERVER['DOCUMENT_ROOT'] . DIRECTORY_SEPARATOR . "presentation" . $uniquifier . ".png", base64_decode( explode('base64,', str_replace(' ','+',urldecode($_POST['canvcont'])))[1]));
}
exit;
}

?>

… featuring our first use of this 404.php in response to a method=POST form call. Verrrrrryyyy interesting!


Previous relevant Google Chart Image Chart Statistical Charts Tutorial is shown below.

Google Chart Image Chart Statistical Charts Tutorial

Google Chart Image Chart Statistical Charts Tutorial

Further to yesterday’s Google Chart Image Chart Pie Chart Tutorial, today, we embark on our first ventures into composite charts, along what we like to think of as “statistical lines”, regarding interfacing to Google Charts Image Chart

… the latter being like a “parasite” display idea off the more conventional Statistical Graph favourites, the Line Chart and Bar Chart, where you have a relationship between a numerical concept (eg. sales) and another type of concept (eg. month of the year), and you want to present the data in a graphical form.

Again, we haven’t stopped our “retweaking”. We might “retweak” in the morning or we might “retweak” over a coffee break or we might “retweak” at supper time, but the end result is, well, you’re reading it now!


var pretherest='';
var newtherest='';
var tmod='';
var cht=location.search.split('cht=')[1] ? decodeURIComponent(location.search.split('cht=')[1].split('&')[0]) : "v";
if ((cht + ' ').substring(0,1) == 'p' && cht != 'p') { pretherest=cht.substring(1); }
if ((cht + ' ').substring(0,2) == 'bv' && cht != 'bv') { pretherest=cht.substring(2); if (1 == 1) { cht='bv'; } }
if ((cht + ' ').substring(0,1) == 'l' && cht != 'l') { pretherest=cht.substring(1); if (1 == 1) { cht='l'; } }
var ctype=location.search.split('type=')[1] ? decodeURIComponent(location.search.split('type=')[1].split('&')[0]) : cht;
var cname=(ctype == 'v' ? 'Venn Chart' : (ctype == 's' ? 'Scatter Chart' : (ctype == 'gv' ? 'GraphViz Chart' :
(ctype.substring(0,1) == 'p' ? 'Pie Chart' :
((ctype + ' ').substring(0,2) == 'bv' ? 'Bar Chart' : (ctype.substring(0,1) == 'l' ? 'Line Chart' : ''))))));
var cencodename=(ctype == 'v' ? 'Venn%20Diagram' : (ctype == 's' ? 'Scatter%20Chart' : (ctype == 'gv' ? 'GraphViz%20Chart' :
(ctype.substring(0,1) == 'p' ? 'Pie%20Chart' :
((ctype + ' ').substring(0,2) == 'bv' ? 'Bar%20Chart' : (ctype.substring(0,1) == 'l' ? 'Line%20Chart' : ''))))));
var chdt=(ctype == 'v' ? '&chd=t:' : (ctype == 's' ? '&chd=t:' : (ctype == 'gv' ? '&chl=' :
(ctype.substring(0,1) == 'p' ? pretherest + '&chd=t:' :
((ctype + ' ').substring(0,2) == 'bv' ? '&chd=t:' : (ctype.substring(0,1) == 'l' ? '&chd=t:' : ''))))));
var chdeq=(ctype == 'v' ? '&chd=' : (ctype == 's' ? '&chd=' : (ctype == 'gv' ? '&chl=' :
(ctype.substring(0,1) == 'p' ? '&chd=' :
((ctype + ' ').substring(0,2) == 'bv' ? '&chd=' : (ctype.substring(0,1) == 'l' ? '&chd=' : ''))))));
var tc=(ctype == 'v' ? 't:' : (ctype == 's' ? 't:' : (ctype == 'gv' ? '' :
(ctype.substring(0,1) == 'p' ? 't:' :
((ctype + ' ').substring(0,2) == 'bv' ? 't:' : (ctype.substring(0,1) == 'l' ? 't:' : ''))))));
var chdl=(ctype == 'v' ? '&chdl=' : (ctype == 's' ? '&chdl=' : (ctype == 'gv' ? '' :
(ctype.substring(0,1) == 'p' ? '&chdl=' :
((ctype + ' ').substring(0,2) == 'bv' ? '&chbh=' : (ctype.substring(0,1) == 'l' ? '&chbh=' : ''))))));

var prenchtt=(ctype == 'v' ? '100,80,60,30,30,30,10' : (ctype == 's' ? '12,87,75,41,23,96,68,71,34,9|98,60,27,34,56,79,58,74,18,76|84,23,69,81,47,94,60,93,64,54' : (ctype == 'gv' ? 'graph{C_0--H_0[type=s];C_0--H_1[type=s];C_0--H_2[type=s];C_0--C_1[type=s];C_1--H_3[type=s];C_1--H_4[type=s];C_1--H_5[type=s]}' :
(ctype.substring(0,1) == 'p' ? '1,2,3,4' :
((ctype + ' ').substring(0,2) == 'bv' ? '5,5,5|10,10,10|15,15,15' : (ctype.substring(0,1) == 'l' ? '5,45,5|10,60,10|15,85,15' : ''))))));
var preachtt=(ctype == 'v' ? 'A|B|C' : (ctype == 's' ? 'Cats|Dogs' : (ctype == 'gv' ? '' :
(ctype.substring(0,1) == 'p' ? 'January|February|March|April' :
((ctype + ' ').substring(0,2) == 'bv' ? '15,4,15' : (ctype.substring(0,1) == 'l' ? '15,4,15' : ''))))));
var defchco=(ctype == 'v' ? 'ff0000,00ff00,0000ff' : (ctype == 's' ? 'FF0000|0000FF&chxt=x,y' : (ctype == 'gv' ? '' :
(ctype.substring(0,1) == 'p' ? 'ff0000,00ff00,0000ff,ff00ff' :
((ctype + ' ').substring(0,2) == 'bv' ? '4D89F9,C6D9FD,C6FDD9&chxt=x,y' : (ctype.substring(0,1) == 'l' ? '3D89F9.B6D9FD,B6FDD9&chxt=x,y' : ''))))));

var prechtt=(ctype == 'v' ? chdt + prenchtt + chdl + preachtt : (ctype == 's' ? chdt + prenchtt + chdl + preachtt + '&chxt=x,y' : (ctype == 'gv' ? chdt + prenchtt :
(ctype.substring(0,1) == 'p' ? chdt + prenchtt + chdl + preachtt :
((ctype + ' ').substring(0,2) == 'bv' ? chdt + prenchtt + chdl + preachtt : (ctype.substring(0,1) == 'l' ? chdt + prenchtt + chdl + preachtt : ''))))));
var promptone=(ctype == 'v' ? "Enter delimited values string for Venn Diagram such that ... " + String.fromCharCode(10) + "The first three values specify the sizes of three circles: A, B, & C. For chart with only two circles, specify zero for the third value." + String.fromCharCode(10) + "The fourth value specifies the size of the intersection of A and B." + String.fromCharCode(10) + "The fifth value specifies the size of the intersection of A and C. For a chart with only two circles, do not specify a value here." + String.fromCharCode(10) + "The sixth value specifies the size of the intersection of B and C. For a chart with only two circles, do not specify a value here." + String.fromCharCode(10) + "The seventh value specifies the size of the common intersection of A, B, and C. For a chart with only two circles, do not specify a value here." + String.fromCharCode(10) + String.fromCharCode(10) + "" : (ctype == 's' ? "Enter delimited values string for Scatter Chart" : (ctype == 'gv' ? "Enter delimited values string for GraphViz Chart" :
(ctype.substring(0,1) == 'p' ? "Enter delimited values string for Pie Chart" :
((ctype + ' ').substring(0,2) == 'bv' ? "Enter g for Group or s for Stacked or o for Overlapped Bar Chart look then a space and then enter delimited values string for Bar Chart. Here is a Candlestick and Bar Chart idea eg. g 1:20,10,15,25,17,30|0,5,10,7,12,6|35,25,45,47,24,46|15,40,30,27,39,54|70,55,63,59,80,6 Prefix just the delimited string you enter by 1: to additionally display Candlestick Charts or by 0: to only display Candlestick Chart" :
(ctype.substring(0,1) == 'l' ? "Enter c for Even or s for Sparklines or xy for Just XY Line Chart look then a space and then enter delimited values string for Line Chart. Here is a Candlestick and Line Chart idea eg. c 1:20,10,15,25,17,30|0,5,10,7,12,6|35,25,45,47,24,46|15,40,30,27,39,54|70,55,63,59,80,6 Prefix just the delimited string you enter by 1: to additionally display Candlestick Charts or by 0: to only display Candlestick Chart" : ""))))));
var oneprompt=(ctype == 'v' ? "Enter delimited values string for your Venn Diagram collaborations, optionally, such that ... " + String.fromCharCode(10) + "The first three values specify the sizes of three circles: A, B, & C. For chart with only two circles, specify zero for the third value." + String.fromCharCode(10) + "The fourth value specifies the size of the intersection of A and B." + String.fromCharCode(10) + "The fifth value specifies the size of the intersection of A and C. For a chart with only two circles, do not specify a value here." + String.fromCharCode(10) + "The sixth value specifies the size of the intersection of B and C. For a chart with only two circles, do not specify a value here." + String.fromCharCode(10) + "The seventh value specifies the size of the common intersection of A, B, and C. For a chart with only two circles, do not specify a value here." + String.fromCharCode(10) + String.fromCharCode(10) + "" : (ctype == 's' ? "Enter delimited values string for Scatter Chart" : (ctype == 'gv' ? "Enter delimited values string for GraphViz Chart" :
(ctype.substring(0,1) == 'p' ? "Enter delimited values string for Pie Chart" :
((ctype + ' ').substring(0,2) == 'bv' ? "Enter g for Grouped or s for Stacked or o for Overlapped Bar Chart look then a space and then enter delimited values string for Bar Chart. Here is a Candlestick and Bar Chart idea eg. g 1:20,10,15,25,17,30|0,5,10,7,12,6|35,25,45,47,24,46|15,40,30,27,39,54|70,55,63,59,80,6 Prefix just the delimited string you enter by 1: to additionally display Candlestick Charts or by 0: to only display Candlestick Chart" :
(ctype.substring(0,1) == 'l' ? "Enter c for Even or s for Sparklines or xy for Just XY Line Chart look then a space and then enter delimited values string for Line Chart. Here is a Candlestick and Line Chart idea eg. c 1:20,10,15,25,17,30|0,5,10,7,12,6|35,25,45,47,24,46|15,40,30,27,39,54|70,55,63,59,80,6 Prefix just the delimited string you enter by 1: to additionally display Candlestick Charts or by 0: to only display Candlestick Chart" : ""))))));
var asktwo=(ctype == 'v' ? true : (ctype == 's' ? true : (ctype == 'gv' ? false :
(ctype.substring(0,1) == 'p' ? true :
((ctype + ' ').substring(0,2) == 'bv' ? true : (ctype.substring(0,1) == 'l' ? true : false))))));
var twopb=(ce.substring(0,1) == 'p' ? 'Any optional legend or title argument snippets? Optionally prefix by 3 for 3d Pie Chart or by c for Concentric Pie Chart. Eg. 3' + chdl + preachtt + '&chtt=My%20' + cencodename + '&chco=' + defchco : 'Any optional legend or title argument snippets? Eg. ' + chdl + preachtt + '&chtt=My%20' + cencodename + '&chco=' + defchco);
var beforeanswer=(ctype.substring(0,1) == 'l' ? 'c ' : ((ctype + ' ').substring(0,2) == 'bv' ? 'g ' : ''));

if ((document.URL.toLowerCase().indexOf('chd=t%3a') == -1 && document.URL.toLowerCase().indexOf('chd=t:') == -1) && document.URL.toLowerCase().indexOf('chd=t') != -1 && document.URL.toLowerCase().indexOf('%3a') != -1) {
tmod=document.URL.toLowerCase().split('chd=t')[1].split('%3')[0];
//tc='t' + tmod + ':';
//chdt=chdt.replace('t:', 't' + tmod + ':');
//answer=answer.trim().replace(tmod + ':','');
//therest+='&chm=F,,1,1:4,20';
} else if ((document.URL.toLowerCase().indexOf('chd=t%3a') == -1 && document.URL.toLowerCase().indexOf('chd=t:') == -1) && document.URL.toLowerCase().indexOf('chd=t') != -1 && document.URL.toLowerCase().substring(8).indexOf(':') != -1) {
tmod=document.URL.toLowerCase().split('chd=t')[1].split(':')[0];
//tc='t' + tmod + ':';
//chdt=chdt.replace('t:', 't' + tmod + ':');
//answer=answer.trim().replace(tmod + ':','');
//therest+='&chm=F,,1,1:4,20';
}

var atend="<canvas id=sharecanvas style=display:none;></canvas><div style=display:none;><label for='shareurl'><input type=button onclick='downloadmaybe(); shareurl();' id='sbut' value='Share URL Link'></input>: </label><input onblur=changeu(this.value); title='Suffix by hashtag 1 is text and hashtag 2 is title' style='width:45%;' type=url value='' placeholder='https://www.rjmprogramming.com.au/ITblog/#RJM Programming Blog#IT Blog' id=shareurl ondblclick='this.value=trythis(this.placeholder);'></input><br><br><span> ... and/or ... </span><br><br><label for='files'><input type=button onclick=document.getElementById('share').click(); value='Share media or document files'></input>: </label><input id='files' type='file' accept='image/*,video/*,audio/*,application/*,text/*' multiple></div><br><br><button id='share' type='button'>Share your media or documents or link!</button><output id='output'></output><scr" + "ipt type='text/javascript' src='/web_share_api_test.js?canv" + "asshare=as_necessary9867654' defer></scr" + "ipt>";
atend='';

var vals=[], annowin=null;


var lastbit="<br><br><br><br>  <button title='Other complex canvas annotation functionalities (forgoes the simpler ones above) ...' id=annobut onclick=\"document.getElementById('tdleft').style.verticalAlign='top'; setTimeout(prerepaint, 12000); if (arest.length != 0) { alert('arest=' + arest); if (document.getElementById('myvenn').src.indexOf(arest) == -1) { pdivhide(); document.getElementById('myvenn').src=document.getElementById('myvenn').src.split(arest.substring(0,5))[0] + arest; document.getElementById('tdleft').style.verticalAlign='top'; } } annowin=window.open('/HTMLCSS/user_of_signature_signature.htm?elemode=img','_blank','top=420,left=620,width=900,height=420'); \" style=\"background-color:yellow;\">More Annotations</button>  <button id=bshare onclick=repaint(); style=display:none;>Repaint <font size=1>(but lose sharing emojis above)</font></button><br><div id=divcanvas style=display:none;><canvas id=bottomcanvas></canvas></div>";
var fszbit='  <span id=spanfsz><select id=fsz onchange="fsz=this.value;"><option value=".10">10px</option><option value=".6">6px</option><option value=".8">8px</option><option value=".9">9px</option><option value=".11">11px</option><option value=".12">12px</option><option value=".14">14px</option><option value=".16">16px</option><option value=".18">18px</option><option value=".20">20px</option><option value=".24">24px</option><option value=".30">30px</option><option value=".36">36px</option><option value=".40">40px</option><option value=".48">48px</option><option value=".50">50px</option><option value=".64">64px</option></select></span>';
var origemailurl='mailto:?subject=My%20' + cencodename + '%20...%20best%20viewed%20in%20landscape%20...&body=';
var origsmsurl='sms:&body=My%20' + cencodename + '%20...%20best%20viewed%20in%20landscape%20...';
var smsee='';
var chd=location.search.split(chdeq)[1] ? (tc + dectypodeURIComponent(location.search.split(chdeq)[1].split('&')[0])).replace('t:t:', 't:').replace(/^t\:$/g, '') : "";
var therest=location.search.split(chdeq)[1] ? (pretherest + document.URL.split(document.URL.split('#')[0].split(chdeq)[1].split('&')[0])[1].split('#')[0]) : "";
newtherest=((ctype + ' ').substring(0,2) == 'bv' ? therest : '');

And yes, you can, and we did, put line feeds into those ternery statements to help with their readability as we add complexity to the parameterization, as we go along, in our changed sixth draft image_venn.html Google Chart Image Chart Venn Chart or Scatter Chart or GraphViz Chart or Pie Chart or Line Chart or Bar Chart or Candlestick Chart interfacing web application you can also try below.


Previous relevant Google Chart Image Chart Pie Chart Tutorial is shown below.

Google Chart Image Chart Pie Chart Tutorial

Google Chart Image Chart Pie Chart Tutorial

As we intimated in yesterday’s Google Chart Image Chart GraphViz Chart Tutorial

start with an at least two part “inhouse phase” of additional “extra to text” annotation functionality possibilities …

… we would return! And so, here thou lingers. It’s “part two” day, even bigger than “Ben Hur” in certain outback towns we’re a little bit shy to divulge until we get to know our readers that little bit better.

Yes, we are dovetailing with work we’ve done in the past using the excellent …

  • canvas … element introduced with HTML5 … whereby …
  • annotations like …
    1. scribble … as the default, and various other …
    2. discrete click shapes … and …
    3. text … including emojis … and …
    4. image

    … annotating modus operandi

… can be part of the arrangements. It works that the Annotation Helper is opened …

  • in a new “known about” popup window … looking out for …
  • parent based “img” element (in the modus operandi we use, calling it, regarding the parent top left image) … so as to be able to …
  • populate its canvas element with a clone of that calling “img” graphical content … but add into the mix …
  • menu driven annotation functionality which can change that canvas look and underlying data … and …
  • the caller can keep track of this and arrange, or not, for these changes to be reflected back at its top left “img” element … the catch being …
  • the “within range of GET argument” limits are ruined by this introduction of graphical data, and so in agreeing to this, a user forgoes those simpler sharing and annotating functionalities of yesterday’s (and before) work … though your normal image sharing capabilities via the web browser remain in the caller and the called

As well, today, we are introducing new Google Charts Image Chart Pie Chart interfacing, and because this chart type can have the three …

  • Normal
  • 3D
  • Concentric

… guises, there was some work to keep us off this street (okay … so we divulgedagain)


var pretherest='';
var cht=location.search.split('cht=')[1] ? decodeURIComponent(location.search.split('cht=')[1].split('&')[0]) : "v";
if ((cht + ' ').substring(0,1) == 'p' && cht != 'p') { pretherest=cht.substring(1); }
var ctype=location.search.split('type=')[1] ? decodeURIComponent(location.search.split('type=')[1].split('&')[0]) : cht;
var cname=(ctype == 'v' ? 'Venn Chart' : (ctype == 's' ? 'Scatter Chart' : (ctype == 'gv' ? 'GraphViz Chart' : (ctype.substring(0,1) == 'p' ? 'Pie Chart' : ''))));
var cencodename=(ctype == 'v' ? 'Venn%20Diagram' : (ctype == 's' ? 'Scatter%20Chart' : (ctype == 'gv' ? 'GraphViz%20Chart' : (ctype.substring(0,1) == 'p' ? 'Pie%20Chart' : ''))));
var chdt=(ctype == 'v' ? '&chd=t:' : (ctype == 's' ? '&chd=t:' : (ctype == 'gv' ? '&chl=' : (ctype.substring(0,1) == 'p' ? pretherest + '&chd=t:' : ''))));
var chdeq=(ctype == 'v' ? '&chd=' : (ctype == 's' ? '&chd=' : (ctype == 'gv' ? '&chl=' : (ctype.substring(0,1) == 'p' ? '&chd=' : ''))));
var tc=(ctype == 'v' ? 't:' : (ctype == 's' ? 't:' : (ctype == 'gv' ? '' : (ctype.substring(0,1) == 'p' ? 't:' : ''))));
var chdl=(ctype == 'v' ? '&chdl=' : (ctype == 's' ? '&chdl=' : (ctype == 'gv' ? '' : (ctype.substring(0,1) == 'p' ? '&chdl=' : ''))));
var prenchtt=(ctype == 'v' ? '100,80,60,30,30,30,10' : (ctype == 's' ? '12,87,75,41,23,96,68,71,34,9|98,60,27,34,56,79,58,74,18,76|84,23,69,81,47,94,60,93,64,54' : (ctype == 'gv' ? 'graph{C_0--H_0[type=s];C_0--H_1[type=s];C_0--H_2[type=s];C_0--C_1[type=s];C_1--H_3[type=s];C_1--H_4[type=s];C_1--H_5[type=s]}' : (ctype.substring(0,1) == 'p' ? '1,2,3,4' : ''))));
var preachtt=(ctype == 'v' ? 'A|B|C' : (ctype == 's' ? 'Cats|Dogs' : (ctype == 'gv' ? '' : (ctype.substring(0,1) == 'p' ? 'January|February|March|April' : ''))));
var prechtt=(ctype == 'v' ? chdt + prenchtt + chdl + preachtt : (ctype == 's' ? chdt + prenchtt + chdl + preachtt + '&chxt=x,y' : (ctype == 'gv' ? chdt + prenchtt : (ctype.substring(0,1) == 'p' ? chdt + prenchtt + chdl + preachtt : ''))));
var defchco=(ctype == 'v' ? 'ff0000,00ff00,0000ff' : (ctype == 's' ? 'FF0000|0000FF&chxt=x,y' : (ctype == 'gv' ? '' : (ctype.substring(0,1) == 'p' ? 'ff0000,00ff00,0000ff,ff00ff' : ''))));
var promptone=(ctype == 'v' ? "Enter delimited values string for Venn Diagram such that ... " + String.fromCharCode(10) + "The first three values specify the sizes of three circles: A, B, & C. For chart with only two circles, specify zero for the third value." + String.fromCharCode(10) + "The fourth value specifies the size of the intersection of A and B." + String.fromCharCode(10) + "The fifth value specifies the size of the intersection of A and C. For a chart with only two circles, do not specify a value here." + String.fromCharCode(10) + "The sixth value specifies the size of the intersection of B and C. For a chart with only two circles, do not specify a value here." + String.fromCharCode(10) + "The seventh value specifies the size of the common intersection of A, B, and C. For a chart with only two circles, do not specify a value here." + String.fromCharCode(10) + String.fromCharCode(10) + "" : (ctype == 's' ? "Enter delimited values string for Scatter Chart" : (ctype == 'gv' ? "Enter delimited values string for GraphViz Chart" : (ctype.substring(0,1) == 'p' ? "Enter delimited values string for Pie Chart" : ""))));
var oneprompt=(ctype == 'v' ? "Enter delimited values string for your Venn Diagram collaborations, optionally, such that ... " + String.fromCharCode(10) + "The first three values specify the sizes of three circles: A, B, & C. For chart with only two circles, specify zero for the third value." + String.fromCharCode(10) + "The fourth value specifies the size of the intersection of A and B." + String.fromCharCode(10) + "The fifth value specifies the size of the intersection of A and C. For a chart with only two circles, do not specify a value here." + String.fromCharCode(10) + "The sixth value specifies the size of the intersection of B and C. For a chart with only two circles, do not specify a value here." + String.fromCharCode(10) + "The seventh value specifies the size of the common intersection of A, B, and C. For a chart with only two circles, do not specify a value here." + String.fromCharCode(10) + String.fromCharCode(10) + "" : (ctype == 's' ? "Enter delimited values string for Scatter Chart" : (ctype == 'gv' ? "Enter delimited values string for GraphViz Chart" : (ctype.substring(0,1) == 'p' ? "Enter delimited values string for Pie Chart" : ""))));
var asktwo=(ctype == 'v' ? true : (ctype == 's' ? true : (ctype == 'gv' ? false : (ctype.substring(0,1) == 'p' ? true : false))));
var twopb=(ctype.substring(0,1) == 'p' ? 'Any optional legend or title argument snippets? Optionally prefix by 3 for 3d Pie Chart or by c for Concentric Pie Chart. Eg. 3' + chdl + preachtt + '&chtt=My%20' + cencodename + '&chco=' + defchco : 'Any optional legend or title argument snippets? Eg. ' + chdl + preachtt + '&chtt=My%20' + cencodename + '&chco=' + defchco);

var atend="<canvas id=sharecanvas style=display:none;></canvas><div style=display:none;><label for='shareurl'><input type=button onclick='downloadmaybe(); shareurl();' id='sbut' value='Share URL Link'></input>: </label><input onblur=changeu(this.value); title='Suffix by hashtag 1 is text and hashtag 2 is title' style='width:45%;' type=url value='' placeholder='https://www.rjmprogramming.com.au/ITblog/#RJM Programming Blog#IT Blog' id=shareurl ondblclick='this.value=trythis(this.placeholder);'></input><br><br><span> ... and/or ... </span><br><br><label for='files'><input type=button onclick=document.getElementById('share').click(); value='Share media or document files'></input>: </label><input id='files' type='file' accept='image/*,video/*,audio/*,application/*,text/*' multiple></div><br><br><button id='share' type='button'>Share your media or documents or link!</button><output id='output'></output><scr" + "ipt type='text/javascript' src='/web_share_api_test.js?canv" + "asshare=as_necessary9867654' defer></scr" + "ipt>";
atend='';

var vals=[], annowin=null;
var lastbit="<br><br><br><br>  <button title='Other complex canvas annotation functionalities (forgoes the simpler ones above) ...' id=annobut onclick=\"document.getElementById('tdleft').style.verticalAlign='top'; setTimeout(prerepaint, 12000); if (arest.length != 0) { if (document.getElementById('myvenn').src.indexOf(arest) == -1) { pdivhide(); document.getElementById('myvenn').src=document.getElementById('myvenn').src.split(arest.substring(0,5))[0] + arest; document.getElementById('tdleft').style.verticalAlign='top'; } } annowin=window.open('/HTMLCSS/user_of_signature_signature.htm?elemode=img','_blank','top=420,left=620,width=900,height=420'); \" style=\"background-color:yellow;\">More Annotations</button>  <button id=bshare onclick=repaint(); style=display:none;>Repaint <font size=1>(but lose sharing emojis above)</font></button><br><div id=divcanvas style=display:none;><canvas id=bottomcanvas></canvas></div>";
var fszbit='  <span id=spanfsz><select id=fsz onchange="fsz=this.value;"><option value=".10">10px</option><option value=".6">6px</option><option value=".8">8px</option><option value=".9">9px</option><option value=".11">11px</option><option value=".12">12px</option><option value=".14">14px</option><option value=".16">16px</option><option value=".18">18px</option><option value=".20">20px</option><option value=".24">24px</option><option value=".30">30px</option><option value=".36">36px</option><option value=".40">40px</option><option value=".48">48px</option><option value=".50">50px</option><option value=".64">64px</option></select></span>';
var origemailurl='mailto:?subject=My%20' + cencodename + '%20...%20best%20viewed%20in%20landscape%20...&body=';
var origsmsurl='sms:&body=My%20' + cencodename + '%20...%20best%20viewed%20in%20landscape%20...';
var smsee='';
var chd=location.search.split(chdeq)[1] ? (tc + decodeURIComponent(location.search.split(chdeq)[1].split('&')[0])).replace('t:t:', 't:').replace(/^t\:$/g, '') : "";
var therest=location.search.split(chdeq)[1] ? (pretherest + document.URL.split(document.URL.split('#')[0].split(chdeq)[1].split('&')[0])[1].split('#')[0]) : "";

Please acquaint yourself with these new annotating features in our changed fifth draft image_venn.html Google Chart Image Chart Venn Chart or Scatter Chart or GraphViz Chart or Pie Chart interfacing web application you can also try below.


Previous relevant Google Chart Image Chart GraphViz Chart Tutorial is shown below.

Google Chart Image Chart GraphViz Chart Tutorial

Google Chart Image Chart GraphViz Chart Tutorial

Today we have two strands of forward progress, onto the progress up to yesterday’s Google Chart Image Chart Scatter Chart Tutorial, they being …

  • establish a new interfacing to GraphViz Chart

    GraphViz is a package of open source tools for visualizing connectivity graphs. You can create GraphViz graphs using the DOT language and your choice of layout engines.

    … a chart looking a bit like Organization Charts

    Org charts are diagrams of a hierarchy of nodes, commonly used to portray superior/subordinate relationships in an organization. A family tree is a type of org chart.


  • start with an at least two part “inhouse phase” of additional “extra to text” annotation functionality possibilities … just starting with …
    1. line
    2. open rectangle
    3. filled rectangle

… additional functionality, that we may well add to, but being as we feel a change we’ll leave that for another time.

The WordPress blog “404.php” code snippet becomes …

<?php

if (strpos(('?' . $_SERVER['QUERY_STRING']), '?cht=') !== false || strpos(('?' . $_SERVER['QUERY_STRING']), '&cht=') !== false) {

$theqs=str_replace('??','?',('?' . $_SERVER['QUERY_STRING']));
if (strpos($theqs, '?chs=') === false && strpos($theqs, '&chs=') === false) {
$theqs='?chs=' . $newWidth . 'x' . $newHeight . '&' . explode('?', $theqs)[1];
}


if (strpos(('?' . $_SERVER['QUERY_STRING']), 'text1=') !== false) {
$theone=2;
$im = imagecreatefromstring(file_get_contents('http://chart.googleapis.com/chart' . explode('&text1=', $theqs)[0]));

if (7 == 7) {

$plotstring=str_replace('+',' ',urldecode($_GET['text1']));
$csv=explode(',', $plotstring);
$black = imagecolorallocatealpha($im, 1, 1, 1, 0);
$blackish = imagecolorallocatealpha($im, 127, 127, 127, 64);
if (sizeof($csv) >= 3) {
if (trim($csv[2]) == '') { // non text annotations

$zeroesbit='';
$izeroes=0;
$xmantissae=explode('.', ('' . $csv[0]));
if (sizeof($xmantissae) > 1) {
$csv[0]=$xmantissae[0];
while (substr($xmantissae[1],0,1) == '0') {
$zeroesbit.='0';
$xmantissae[1]=substr($xmantissae[1],1);
}
$csv[2]=$xmantissae[1];
}
$ymantissae=explode('.', ('' . $csv[1]));
if (sizeof($ymantissae) > 1) {
$csv[1]=$ymantissae[0];
if (sizeof($csv) > 3) {
$csv[3]=$ymantissae[1];
} else {
array_push($csv, $ymantissae[1]);
}
}


if (strlen($zeroesbit) == 4) { // filled in rectangle
imagefilledrectangle($im, $csv[0], $csv[1], $csv[2], $csv[3], $blackish);
} else if (strlen($zeroesbit) == 2) { // rectangle
imagerectangle($im, $csv[0], $csv[1], $csv[2], $csv[3], $black);
} else if (strlen($zeroesbit) == 1) { // line
imageline($im, $csv[0], $csv[1], $csv[2], $csv[3], $black);
}

} else { // text placement
$xis=$csv[0];
$mantissae=explode('.', ('' . $csv[0]));
if (sizeof($mantissae) > 1) {
$tenpx=$mantissae[1];
$xis=$mantissae[0];
}
try {
if (function_exists('imagettftext')) {
if (explode('' . $csv[0] . ',' . $csv[1] . ',', $plotstring)[1] !== '') {
//echo explode('' . $csv[0] . ',' . $csv[1] . ',', $plotstring)[1];
//exit;
imagettftext($im, $tenpx, 0, $xis, $csv[1], $black, realpath('arial.ttf'), explode('' . $csv[0] . ',' . $csv[1] . ',', $plotstring)[1]);
}
}
} catch (Exception $e) { }
}
while (isset($_GET['text' . $theone])) {
$plotstring=str_replace('+',' ',urldecode($_GET['text' . $theone]));
$csv=explode(',', $plotstring);
if (sizeof($csv) >= 3) {
if (trim($csv[2]) == '') { // non text annotations

$zeroesbit='';
$izeroes=0;
$xmantissae=explode('.', ('' . $csv[0]));
if (sizeof($xmantissae) > 1) {
$csv[0]=$xmantissae[0];
while (substr($xmantissae[1],0,1) == '0') {
$zeroesbit.='0';
$xmantissae[1]=substr($xmantissae[1],1);
}
$csv[2]=$xmantissae[1];
}
$ymantissae=explode('.', ('' . $csv[1]));
if (sizeof($ymantissae) > 1) {
$csv[1]=$ymantissae[0];
if (sizeof($csv) > 3) {
$csv[3]=$ymantissae[1];
} else {
array_push($csv, $ymantissae[1]);
}
}


if (strlen($zeroesbit) == 4) { // filled in rectangle
imagefilledrectangle($im, $csv[0], $csv[1], $csv[2], $csv[3], $blackish);
} else if (strlen($zeroesbit) == 2) { // rectangle
imagerectangle($im, $csv[0], $csv[1], $csv[2], $csv[3], $black);
} else if (strlen($zeroesbit) == 1) { // line
imageline($im, $csv[0], $csv[1], $csv[2], $csv[3], $black);
}

} else { // text placement
try {
$xis=$csv[0];
$mantissae=explode('.', ('' . $csv[0]));
if (sizeof($mantissae) > 1) {
$tenpx=$mantissae[1];
$xis=$mantissae[0];
}
if (function_exists('imagettftext')) {
if (explode('' . $csv[0] . ',' . $csv[1] . ',', $plotstring)[1] !== '') {
imagettftext($im, $tenpx, 0, $xis, $csv[1], $black, realpath('arial.ttf'), explode('' . $csv[0] . ',' . $csv[1] . ',', $plotstring)[1]);
}
}
} catch (Exception $e) { }
}
$theone++;
}
}
//}
}


}

header('Content-Type: image/png');

imagepng($im);
imagedestroy($im);
} else {
header('Content-Type: image/png');
echo file_get_contents('http://chart.googleapis.com/chart' . $theqs);
}
exit;

}

?>

… utilizing that good ol’ PHP GD image library.

We hope you enjoy the …

Mantissa Madness Monday

… coding feel utilized to retain yesterday’s …


&textn=x,y,Text

… argument snippet basis, adding “x” and “y” mantissa arrangement smarts with a “nothing” Text in our changed fourth draft image_venn.html Google Chart Image Chart Venn Chart or Scatter Chart or GraphViz Chart interfacing web application you can also try below.

Did you know?

Would you believe, at least to us, it is far less obvious how to display a straight line (that is perhaps not horizontal nor vertical) within a webpage, than it is to display a rectangle, filled or not?! Talk about irony! Over time, we have developed …

  • HTML hr elements (with a rotation) … and the less kludgy …
  • HTML div (defining a box with defined dimensions) for a nested SVG element containing the line definition using percentage dimensions

… in the past, for when we needed to do this. But, today, we’d like to thank this great webpage for its suggestion to involve linear gradients …


<style>

.crossedtotl {
background:
linear-gradient(to top left,
rgba(0,0,0,0) 0%,
rgba(0,0,0,0) calc(50% - 0.8px),
rgba(0,0,0,1) 50%,
rgba(0,0,0,0) calc(50% + 0.8px),
rgba(0,0,0,0) 100%);
}
.crossedtotr {
background:
linear-gradient(to top right,
rgba(0,0,0,0) 0%,
rgba(0,0,0,0) calc(50% - 0.8px),
rgba(0,0,0,1) 50%,
rgba(0,0,0,0) calc(50% + 0.8px),
rgba(0,0,0,0) 100%);
}
</style>

… in a, basically, CSS solution. Great stuff, thanks!


Previous relevant Google Chart Image Chart Scatter Chart Tutorial is shown below.

Google Chart Image Chart Scatter Chart Tutorial

Google Chart Image Chart Scatter Chart Tutorial

Today, we bring the Google Charts Image Chart

… making distributing “Venn Chart” hardcodings into a dropdown selectable arrangement, because there are more commonalities than differences, really, and we do like to parameterize … even in the shower, with a fairly loud rendition of this, perhaps.

Here is our framework for parameterization, here, and into the future


<title>Interfacing to Google Charts Image Chart Venn Chart or Scatter Chart - RJM Programming - November, 2023</title>
<script type=text/javascript>
var cht=location.search.split('cht=')[1] ? decodeURIComponent(location.search.split('cht=')[1].split('&')[0]) : "v";
var ctype=location.search.split('type=')[1] ? decodeURIComponent(location.search.split('type=')[1].split('&')[0]) : cht;
var cname=(ctype == 'v' ? 'Venn Chart' : (ctype == 's' ? 'Scatter Chart' : ''));
var cencodename=(ctype == 'v' ? 'Venn%20Diagram' : (ctype == 's' ? 'Scatter%20Chart' : ''));
var prenchtt=(ctype == 'v' ? '100,80,60,30,30,30,10' : (ctype == 's' ? '12,87,75,41,23,96,68,71,34,9|98,60,27,34,56,79,58,74,18,76|84,23,69,81,47,94,60,93,64,54' : ''));
var preachtt=(ctype == 'v' ? 'A|B|C' : (ctype == 's' ? 'Cats|Dogs' : ''));
var prechtt=(ctype == 'v' ? '&chd=t:' + prenchtt + '&chdl=' + preachtt : (ctype == 's' ? '&chd=t:' + prenchtt + '&chdl=' + preachtt + '&chxt=x,y' : ''));
var defchco=(ctype == 'v' ? 'ff0000,00ff00,0000ff' : (ctype == 's' ? 'FF0000|0000FF&chxt=x,y' : ''));
var promptone=(ctype == 'v' ? "Enter delimited values string for Venn Diagram such that ... " + String.fromCharCode(10) + "The first three values specify the sizes of three circles: A, B, & C. For chart with only two circles, specify zero for the third value." + String.fromCharCode(10) + "The fourth value specifies the size of the intersection of A and B." + String.fromCharCode(10) + "The fifth value specifies the size of the intersection of A and C. For a chart with only two circles, do not specify a value here." + String.fromCharCode(10) + "The sixth value specifies the size of the intersection of B and C. For a chart with only two circles, do not specify a value here." + String.fromCharCode(10) + "The seventh value specifies the size of the common intersection of A, B, and C. For a chart with only two circles, do not specify a value here." + String.fromCharCode(10) + String.fromCharCode(10) + "" : (ctype == 's' ? "Enter delimited values string for Scatter Chart" : ""));
var oneprompt=(ctype == 'v' ? "Enter delimited values string for your Venn Diagram collaborations, optionally, such that ... " + String.fromCharCode(10) + "The first three values specify the sizes of three circles: A, B, & C. For chart with only two circles, specify zero for the third value." + String.fromCharCode(10) + "The fourth value specifies the size of the intersection of A and B." + String.fromCharCode(10) + "The fifth value specifies the size of the intersection of A and C. For a chart with only two circles, do not specify a value here." + String.fromCharCode(10) + "The sixth value specifies the size of the intersection of B and C. For a chart with only two circles, do not specify a value here." + String.fromCharCode(10) + "The seventh value specifies the size of the common intersection of A, B, and C. For a chart with only two circles, do not specify a value here." + String.fromCharCode(10) + String.fromCharCode(10) + "" : (ctype == 's' ? "Enter delimited values string for Scatter Chart" : ""));

// etcetera etcetera etcetera

… but, as you can imagine, there will probably be small retweaks of this arrangement, which is holding out okay so far for Scatter Charts in our changed third draft image_venn.html Google Chart Image Chart Venn Chart or Scatter Chart interfacing web application you can also try below.

Did you know?

In this online world with so many platforms and devices and software choices, there is no need to ever be embarrassed by what might seem an obvious feature you’ve missed.

Take the way on macOS, but not iOS, using a web browser to get to YouTube, you can flag that a video should loop. Especially good for …

  • song obsessions …
  • earworms you need to salve

… and what about if your shower is taking an awfully long time?! Please be careful with moisture and devices, though, in the bathroom!

How does it happen? Right click the play button, and looping is there as the top option. Now back to that shower song obsession.


Previous relevant Google Chart Image Chart Venn Chart User Text Tutorial is shown below.

Google Chart Image Chart Venn Chart User Text Tutorial

Google Chart Image Chart Venn Chart User Text Tutorial

We think a way to improve on our interfacing web application start regarding yesterday’s Google Chart Image Chart Venn Chart Interfacing Primer Tutorial would be to offer the user the chance to enter their own text onto the Venn Diagrams …

But we would say that.

… given what we learnt in Primary school … or should we say …

“Gryffindor Slytherin Ravenclaw Hufflepuff Junior Business College”

… and, yes, is that you, Aoife? What did you want to point out? After you swallow those Rice Bubbles, that is?! Class is waiting …

.
.
.
.
.
.
.
.
.
.
.
.
.
.
.
.
.
.
.
.
.
.
.
.
.

Yes … miss something … and …

.
.
.
.
.
.
.
.
.
.
.
.
.
.
.
.
.
.
.
.
.
.
.
.
.

Use your words … okay … missing … don’t worry, the bus will wait … no … there’s no need to point … oh! …

… do you mean …

missing ewe … no … missing you … oh! … missing u … oh! … “Gryffindor Slytherin Ravenclaw Hufflepuff Juniour Business College” … quite so, Aiofe … 3 points for Hufflepuff!

Anyway we needed a fleshed out “function ask” to cater for potential onclick event logic catering for co-ordinates


function ask(evt) {
var answer='', answertherest='';
if (lasttext != '' && evt && normalcall) {
document.getElementById('ilp').placeholder='Enter text and later click place for it on Venn Diagram to left (line feed is ~~)';

elemLeft = document.getElementById('myvenn').offsetLeft;
elemTop = document.getElementById('myvenn').offsetTop;

if (evt.touches) {
if (evt.touches[0].pageX) {
x = evt.touches[0].pageX + document.body.scrollLeft - elemLeft;
y = evt.touches[0].pageY + document.body.scrollTop - elemTop;
} else {
x = evt.touches[0].clientX + document.body.scrollLeft - elemLeft;
y = evt.touches[0].clientY + document.body.scrollTop - elemTop;
}
} else if (evt.clientX || ev.clientY) {
x = evt.clientX + document.body.scrollLeft - elemLeft;
y = evt.clientY + document.body.scrollTop - elemTop;
} else {
x = evt.pageX + document.body.scrollLeft - elemLeft;
y = evt.pageY + document.body.scrollTop - elemTop;
}


document.getElementById('dtext').innerHTML+='<p style="position:absolute;font-size:10px;font-family:Arial;left:' + x + 'px;top:' + y + 'px;z-index:98;">' + lasttext + '</p>';

document.getElementById('aemail').href+='&text' + textnum + '=' + encodeURIComponent('' + x + ',' + y + ',') + encodeURIComponent(lasttext.replace(/\<br\>/g, String.fromCharCode(10)));
document.getElementById('asms').href+='&text' + textnum + '=' + encodeURIComponent('' + x + ',' + y + ',') + encodeURIComponent(lasttext.replace(/\<br\>/g, String.fromCharCode(10)));
arest+='&text' + textnum + '=' + encodeURIComponent('' + x + ',' + y + ',') + encodeURIComponent(lasttext.replace(/\<br\>/g, String.fromCharCode(10)));
therest+='&text' + textnum + '=' + encodeURIComponent('' + x + ',' + y + ',') + encodeURIComponent(lasttext.replace(/\<br\>/g, String.fromCharCode(10)));
asmsurl+='&text' + textnum + '=' + encodeURIComponent('' + x + ',' + y + ',') + encodeURIComponent(lasttext.replace(/\<br\>/g, String.fromCharCode(10)));
aemailurl+='&text' + textnum + '=' + encodeURIComponent('' + x + ',' + y + ',') + encodeURIComponent(lasttext.replace(/\<br\>/g, String.fromCharCode(10)));
document.getElementById('tdright').innerHTML="  <span id=spemail><a target=_blank href='mailto:?subject=My%20Venn%20Diagram%20...%20best%20viewed%20in%20landscape%20...&body=" + encodeURIComponent((document.getElementById('myvenn').src + arest).replace((document.getElementById('myvenn').src + arest).split('?')[0].split('#')[0], document.URL.split('?')[0].split('#')[0])) + "' id=aemail title=Email>&#128231;</a></span>      <span id=spsms><a target=_blank onmouseover=\"if (smsee.length == 0 && origsmsurl.indexOf('sms:&') != -1) { smsee=prompt('Please enter SMS number to send to.', ''); if (smsee == null) { smsee=''; } else { origsmsurl=origsmsurl.replace('sms:&','sms:' + smsee + '&'); asmsurl=asmsurl.replace('sms:&','sms:' + smsee + '&'); this.href=asmsurl; } }\" ontouchstart=\"if (smsee.length == 0 && origsmsurl.indexOf('sms:&') != -1) { smsee=prompt('Please enter SMS number to send to.', ''); if (smsee == null) { smsee=''; } else { origsmsurl=origsmsurl.replace('sms:&','sms:' + smsee + '&'); asmsurl=asmsurl.replace('sms:&','sms:' + smsee + '&'); this.href=asmsurl; } }\" href='sms:&body=" + encodeURIComponent((document.getElementById('myvenn').src + arest).replace(document.getElementById('myvenn').src.split('?')[0].split('#')[0], document.URL.split('?')[0].split('#')[0])) + "' id=asms title=SMS>&#128223;</a></span><br><br>  <input id=ilp onblur=\"lasttext=this.value.replace(/\~\~/g, '<br>'); this.value=''; this.placeholder='Click where you want ... ' + lasttext.replace(/\<br\>/g, String.fromCharCode(10)); mvp.setAttribute('content','initial-scale=1'); document.getElementById('myvenn').scrollIntoView();\" placeholder='Enter text and later click place for it on Venn Diagram to left (line feed is ~~)' type=text style=width:500px; value=''></input>";
//alert( document.getElementById('aemail').outerHTML );
//alert( document.getElementById('asms').outerHTML );
textnum++;
lasttext='';
} else if (!evt || !normalcall) {
if (chd == '') {
answer=prompt("Enter delimited values string for Venn Diagram such that ... " + String.fromCharCode(10) + "The first three values specify the sizes of three circles: A, B, & C. For chart with only two circles, specify zero for the third value." + String.fromCharCode(10) + "The fourth value specifies the size of the intersection of A and B." + String.fromCharCode(10) + "The fifth value specifies the size of the intersection of A and C. For a chart with only two circles, do not specify a value here." + String.fromCharCode(10) + "The sixth value specifies the size of the intersection of B and C. For a chart with only two circles, do not specify a value here." + String.fromCharCode(10) + "The seventh value specifies the size of the common intersection of A, B, and C. For a chart with only two circles, do not specify a value here." + String.fromCharCode(10) + String.fromCharCode(10) + "", (chd == '' ? "100,80,60,30,30,30,10" : (chd.replace('t:',''))));
} else {
answer=prompt("Enter delimited values string for your Venn Diagram collaborations, optionally, such that ... " + String.fromCharCode(10) + "The first three values specify the sizes of three circles: A, B, & C. For chart with only two circles, specify zero for the third value." + String.fromCharCode(10) + "The fourth value specifies the size of the intersection of A and B." + String.fromCharCode(10) + "The fifth value specifies the size of the intersection of A and C. For a chart with only two circles, do not specify a value here." + String.fromCharCode(10) + "The sixth value specifies the size of the intersection of B and C. For a chart with only two circles, do not specify a value here." + String.fromCharCode(10) + "The seventh value specifies the size of the common intersection of A, B, and C. For a chart with only two circles, do not specify a value here." + String.fromCharCode(10) + String.fromCharCode(10) + "", (chd == '' ? "100,80,60,30,30,30,10" : (chd.replace('t:',''))));
}
vals=[];
if (answer != null) {
answer=answer.trim();
if (answer.trim() != '') {
var delimis='';
for (var ii=0; ii<answer.length; ii++) {
if (delimis == '' && (answer.substring(ii).substring(0,1) < '0' || answer.substring(ii).substring(0,1) > '9')) {
delimis=answer.substring(ii).substring(0,1);
}
}
}
if (delimis != '') {
vals=answer.split(delimis);
}
if (vals.length == 6 || vals.length == 7) {
answertherest=prompt('Any optional legend or title argument snippets? Eg. &chdl=A|B|C&chtt=My%20Venn%20Diagram&chco=ff0000,00ff00,0000ff', therest);
if (answertherest == null) { answertherest=''; }
therest=answertherest.trim();
var aone=1;
var plotstring='';
var flds=[];
if (therest.indexOf('&text' + aone + '=') != -1) {
while (therest.indexOf('&text' + aone + '=') != -1) {
if (chd == '') {
plotstring=decodeURIComponent(therest.split('&text' + aone + '=')[1].split('&')[0]);
while (plotstring.indexOf(String.fromCharCode(10)) != -1) {
plotstring=plotstring.replace(String.fromCharCode(10), '<br>');
}
flds=plotstring.split(',');
if (eval('' + flds.length) >= 3) {
document.getElementById('dtext').innerHTML+='<p style="position:absolute;font-size:10px;font-family:Arial;left:' + flds[0] + 'px;top:' + flds[1] + 'px;z-index:98;">' + plotstring.split('' + flds[0] + ',' + flds[1] + ',')[1] + '</p>';
}
}
aone++;
textnum=aone;
}
}
//document.getElementById('myvenn').style.backgroundImage='URL(//www.rjmprogramming.com.au/ITblog/' + Math.min(550,window.innerWidth) + '/' + Math.min(350,window.innerHeight) + '/?cht=v&chd=t:' + encodeURIComponent(answer + therest) + ')';
document.getElementById('myvenn').src='//www.rjmprogramming.com.au/ITblog/' + Math.min(550,window.innerWidth) + '/' + Math.min(350,window.innerHeight) + '/?cht=v&chd=t:' + encodeURIComponent(answer) + therest + '';
if (document.getElementById('tdright').innerHTML == '') {
document.getElementById('tdright').innerHTML="  <span id=spemail><a target=_blank href='mailto:?subject=My%20Venn%20Diagram%20...%20best%20viewed%20in%20landscape%20...&body=" + encodeURIComponent((document.getElementById('myvenn').src + arest).replace(document.getElementById('myvenn').src.split('?')[0].split('#')[0], document.URL.split('?')[0].split('#')[0])) + "' id=aemail title=Email>&#128231;</a></span>      <span id=spsms><a target=_blank onmouseover=\"if (smsee.length == 0 && origsmsurl.indexOf('sms:&') != -1) { smsee=prompt('Please enter SMS number to send to.', ''); if (smsee == null) { smsee=''; } else { origsmsurl=origsmsurl.replace('sms:&','sms:' + smsee + '&'); asmsurl=asmsurl.replace('sms:&','sms:' + smsee + '&'); this.href=asmsurl; } }\" ontouchstart=\"if (smsee.length == 0 && origsmsurl.indexOf('sms:&') != -1) { smsee=prompt('Please enter SMS number to send to.', ''); if (smsee == null) { smsee=''; } else { origsmsurl=origsmsurl.replace('sms:&','sms:' + smsee + '&'); asmsurl=asmsurl.replace('sms:&','sms:' + smsee + '&'); this.href=asmsurl; } }\" href='sms:&body=" + encodeURIComponent((document.getElementById('myvenn').src + arest).replace(document.getElementById('myvenn').src.split('?')[0].split('#')[0], document.URL.split('?')[0].split('#')[0])) + "' id=asms title=SMS>&#128223;</a></span><br><br>  <input id=ilp onblur=\"lasttext=this.value.replace(/\~\~/g, '<br>'); this.value=''; this.placeholder='Click where you want ... ' + lasttext.replace(/\<br\>/g, String.fromCharCode(10));\" placeholder='Enter text and later click place for it on Venn Diagram to left (line feed is ~~)' type=text style=width:500px; value=''></input>";
}
} else {
alert('Try again.');
ask(null);
}
}
}
atstart=false;
normalcall=true;
}

… in our changed second draft image_venn.html Google Chart Image Chart Venn Chart interfacing web application you can also try below.

Did you know?

As far as this WordPress blog’s 404.php role goes in all this, we were keen to maintain Venn Diagrams that were purely image based data, because the web browser sharing mechanisms are so much better this way, else we were tempted to just construct a webpage HTML dataset positioning text in an absolute way with a Venn Chart background image. In order to do these purely image based Venn Diagrams we used PHP’s GD image library as per

<?php

if (strpos(('?' . $_SERVER['QUERY_STRING']), '?cht=') !== false || strpos(('?' . $_SERVER['QUERY_STRING']), '&cht=') !== false) {

$theqs=str_replace('??','?',('?' . $_SERVER['QUERY_STRING']));
if (strpos($theqs, '?chs=') === false && strpos($theqs, '&chs=') === false) {
$theqs='?chs=' . $newWidth . 'x' . $newHeight . '&' . explode('?', $theqs)[1];
}

if (strpos(('?' . $_SERVER['QUERY_STRING']), 'text1=') !== false) {
$theone=2;
$im = imagecreatefromstring(file_get_contents('ht
tp://chart.googleapis.com/chart' . explode('&text1=', $theqs)[0]));

if (7 == 7) {

$plotstring=str_replace('+',' ',urldecode($_GET['text1']));
$csv=explode(',', $plotstring);
$black = imagecolorallocatealpha($im, 1, 1, 1, 0);
if (sizeof($csv) >= 3) {
try {
if (function_exists('imagettftext')) {
if (explode('' . $csv[0] . ',' . $csv[1] . ',', $plotstring)[1] !== '') {
//echo explode('' . $csv[0] . ',' . $csv[1] . ',', $plotstring)[1];
//exit;
imagettftext($im, 10, 0, $csv[0], $csv[1], $black, realpath('arial.ttf'), explode('' . $csv[0] . ',' . $csv[1] . ',', $plotstring)[1]);
}
}
} catch (Exception $e) { }
while (isset($_GET['text' . $theone])) {
$plotstring=str_replace('+',' ',urldecode($_GET['text' . $theone]));
$csv=explode(',', $plotstring);
if (sizeof($csv) >= 3) {
try {
if (function_exists('imagettftext')) {
if (explode('' . $csv[0] . ',' . $csv[1] . ',', $plotstring)[1] !== '') {
imagettftext($im, 10, 0, $csv[0], $csv[1], $black, realpath('arial.ttf'), explode('' . $csv[0] . ',' . $csv[1] . ',', $plotstring)[1]);
}
}
} catch (Exception $e) { }
}
$theone++;
}
}

}


header('Content-Type: image/png');

imagepng($im);
imagedestroy($im);
} else {

header('Content-Type: image/png');
echo file_get_contents('http://chart.googleapis.com/chart' . $theqs);
}
exit;

}

?>


Previous relevant Google Chart Image Chart Venn Chart Interfacing Primer Tutorial is shown below.

Google Chart Image Chart Venn Chart Interfacing Primer Tutorial

Google Chart Image Chart Venn Chart Interfacing Primer Tutorial

So, moving on from Google Charts Image Chart Map Charts, today, let’s turn our attention to Google Charts Image Chart Venn Charts which we were dead set curious about given work we’d done in the past regarding Venn Diagrams, which we referenced when we presented Flowchart and Venn Diagram and Mind Map Token Subject Emoji Tutorial some time back. Gobsmackingly good is the Google approach, again, as you’d expect, but the approach covers different ground, so one feels one should go back to Primary School! You thought we were going to give away the answer to one of those security questions, didn’t you?! Didn’t you!?! Well, the answer is “Gryffindor Slytherin Ravenclaw Hufflepuff Junior Business College” … if you must know.

The sharing capabilities are good with the Google Charts approach too, given we are creating an HTML image, as our WordPress blog good ol’ 404.php has been woken up to address via …

<?php

if (strpos(('?' . $_SERVER['QUERY_STRING']), '?cht=') !== false || strpos(('?' . $_SERVER['QUERY_STRING']), '&cht=') !== false) {

$theqs=str_replace('??','?',('?' . $_SERVER['QUERY_STRING']));
if (strpos($theqs, '?chs=') === false && strpos($theqs, '&chs=') === false) {
$theqs='?chs=' . $newWidth . 'x' . $newHeight . '&' . explode('?', $theqs)[1];
}


header('Content-Type: image/png');
echo file_get_contents('http://chart.googleapis.com/chart' . $theqs);
exit;

}

?>

Yes, all these Image Chart smarts come, essentially, from a “one line” calling URL! Who’d have believed it! Shiver me timbers!

Well, it’s early days with this Venn Chart interfacing where we allow for …

  • circle (think up to three) definition … and the rest, in this first draft (hoping you’ve done some reading)
  • legend and title and colour selection user definitions dumped into a fairly unfriendly “the rest” Javascript prompt entry we ask of the user should they go ahead with the previous definition … and …
  • sharing and collaboration email and SMS functionality

… we hope you try via our “proof of concept” first draft image_venn.html Google Chart Image Chart Venn Chart interfacing web application you can also try below …


If this was interesting you may be interested in this too.


If this was interesting you may be interested in this too.


If this was interesting you may be interested in this too.


If this was interesting you may be interested in this too.


If this was interesting you may be interested in this too.


If this was interesting you may be interested in this too.


If this was interesting you may be interested in this too.


If this was interesting you may be interested in this too.


If this was interesting you may be interested in this too.


If this was interesting you may be interested in this too.


If this was interesting you may be interested in this too.


If this was interesting you may be interested in this too.


If this was interesting you may be interested in this too.


If this was interesting you may be interested in this too.


If this was interesting you may be interested in this too.


If this was interesting you may be interested in this too.


If this was interesting you may be interested in this too.


If this was interesting you may be interested in this too.


If this was interesting you may be interested in this too.


If this was interesting you may be interested in this too.


If this was interesting you may be interested in this too.


If this was interesting you may be interested in this too.


If this was interesting you may be interested in this too.


If this was interesting you may be interested in this too.


If this was interesting you may be interested in this too.


If this was interesting you may be interested in this too.


If this was interesting you may be interested in this too.

Posted in eLearning, Event-Driven Programming, Tutorials | Tagged , , , , , , , , , , , , , , , , , , , , , , , , , , , , , , , , , , , , , , , , , , , , , , , , , , , , | Leave a comment

Python GraphViz via PHP on AlmaLinux Organization Hierarchy Tutorial

Python GraphViz via PHP on AlmaLinux Organization Hierarchy Tutorial

Python GraphViz via PHP on AlmaLinux Organization Hierarchy Tutorial

Calling cab (6754 – 6756 + 4).

Huh?!

Calling the second cab off the rank.

Yes, now that we understand a bit more about file permission issues, after yesterday’s Python GraphViz via PHP on AlmaLinux Permissions Tutorial, having PHP hosting Python with GraphViz calls, let’s turn our attention to the issue of “lots of data”, today, with our …


Organization Hierarchyist

… what do you say?! It’s a bit embarrassingly easy a remedy because we are writing in PHP, to just …

  • make any $_GET[] (web browser address bar arguments) references become $_POST[] equivalents … and any …
  • HTML form method=GET should become HTML form method=POST

Calling log (6754 – 6756 + 4 – 1) … to fall off.

Python code wise, our hierarchy_organization.py inspiration came from https://graphviz.readthedocs.io/en/stable/examples.html thanks.

Then we worked on PHP hierarchy_organization.php to be as close to being a buddy with a Python as, well, Monty?!


Previous relevant Python GraphViz via PHP on AlmaLinux Permissions Tutorial is shown below.

Python GraphViz via PHP on AlmaLinux Permissions Tutorial

Python GraphViz via PHP on AlmaLinux Permissions Tutorial

Did you guess, regarding the Python Graphviz via PHP work of yesterday’s Python GraphViz via PHP on AlmaLinux Tutorial, we were experiencing File Permission issues?

Well, yesterday, regarding the Python Graphviz via PHP work of yesterday’s Python GraphViz via PHP on AlmaLinux Tutorial, we were experiencing File Permission issues.

We thought we’d move the Python, via PHP processing, totally into the purview of the web server administration owner, by involving a …

  1. Korn Shell *.ksh … supervised by …
  2. crontab … pointing to …

    ksh -c 'for i in `find /home/rjmprogr/public_html/ -name "subgraph_example_*.ksh"`; do ksh -c `echo $i`; done'

    … very regularly

… arrangement, but even that failed, in a first incarnation using /tmp/ placement of the Korn Shell file. “Permission denied”, again. Running a Korn Shell from /tmp/ on AlmaLinux must be a no-no, so moved the place to be AlmaLinux web server’s Document Root place, and then things started happening, in the changed subgraph_example.php Python GraphViz using web application.


Previous relevant Python GraphViz via PHP on AlmaLinux Tutorial is shown below.

Python GraphViz via PHP on AlmaLinux Tutorial

Python GraphViz via PHP on AlmaLinux Tutorial

Do you remember reading, with PHP Image GraphViz via Pear on AlmaLinux Primer Tutorial below, our outlining three known GraphViz guises …

  • the recent, alas now deprecated, Google Charts Image Charts GraphViz option means of drawing SVG graphics within an HTML image … we’ve known about before about yesterday
  • today’s interest, that being PHP Image GraphViz via Pear on AlmaLinux install, via the AlmaLinux cPanel “Module Installers” Pear installer page, means by which we can use GraphViz calls in PHP code … and, for the future …
  • GraphViz installs for Python via pip

…? Well, today, we start down the road of …

  1. installing Python GraphViz package via …

    pip install graphviz

    … then …
  2. getting great help from https://graphviz.readthedocs.io/en/stable/, thanks, as the Python code basis we call subgraph_example.py … and …
  3. used and remoulded by our overseeing PHP subgraph_example.php Python GraphViz using web application

… we need to work on more after this first draft start to another road of our GraphViz journey last talked about at PHP Image GraphViz via Pear on AlmaLinux Focus Tutorial.


Previous relevant PHP Image GraphViz via Pear on AlmaLinux Focus Tutorial is shown below.

PHP Image GraphViz via Pear on AlmaLinux Focus Tutorial

PHP Image GraphViz via Pear on AlmaLinux Focus Tutorial

It reared it’s ugly head with the Animated GIF Creator here at RJM Programming (helped out by the great Jeroen van Wissen open source work, thanks). And with yesterday’s PHP Image GraphViz via Pear on AlmaLinux Recallable Tutorial it reared up again.

On non-mobile focus goes to the address bar on many web browsers unless there is a (nominally) visible input type=text or textarea next in line.

It’s hard to keep in mind except as it “rears up” in an annoying way, but if we’d thought back, yes, we allow in the linked list feel of revealing textboxes (or textareas) only as they are needed scenarios we allow for two blank ones to be (nominally) visible at any given time … not one … but two, presumably because there is a tiny Javascript DOM “refresh period” not short enough to stop the web browser “desperation measure” (of placing focus in the address bar) happening?!

Why the non-mobile mention? Well, on mobile, a user programming [HTMLelement].focus(); call has no affect, as the touch operating systems need control of focus arrangements, presumably?!

How can we forget? My liege, please accept my humble apologies?!

Why the (nominally) mentions? Well, we have, successfully, in the past, just arranged a (statically HTML placed) textbox (ie. input type=text) that sits outside the viewing screen but not (nominally) invisible (eg. style=’position:absolute;top:-200px;left:-200px;’) can help you avoid the focus going up to the web browser address bar.

So that’s that, and other progress today is to allow the emailing or SMS of a recalled URL Step arrangement via more options on that “Recall Dropdown” we started allowing for yesterday.

Please see this happening in our changed PHP coded My Recipe Steps web application you can also try below.


Previous relevant PHP Image GraphViz via Pear on AlmaLinux Recallable Tutorial is shown below.

PHP Image GraphViz via Pear on AlmaLinux Recallable Tutorial

PHP Image GraphViz via Pear on AlmaLinux Recallable Tutorial

After yesterday’s PHP Image GraphViz via Pear on AlmaLinux Sharing Tutorial some readers may be curious to understand the distinction between …

  • email and SMS sharing … and …
  • inhouse intersessional sharing via window.localStorage (ie. like HTTP Cookies)

… over yesterday’s and today’s blog posting timings. Simply put, for us, we …

  • take a deep breath before starting intersessional window.localStorage work, as it is not to be sneezed at, as any sort of doddle (at least for us) … as well as …
  • since last intersessional window.localStorage work we’ve started using email and SMS sharing hashtagging arrangements that fit in, like a glove, with this intersessional window.localStorage work … so that …
  • even though, we write the code here in PHP, all this functionality is client based … which we like because …
  • get the idea correct, with careful forward planning and implementation, we’ll be able to apply similar such thinking into the future, whether that be for clientside only web applications and/or ones that call on serverside code (like PHP) … and …
  • if we can keep things just clientside more readers can be involved, we figure

If you’re wondering about the worry of any of this, it is to do with large title and/or URL link and/or ingredient type data whose data length could be huge, where most of our concern lies, and …

  • hashtagging (where data limits are so much longer) can help it remain as a clientside only solution environment (rather than relying on some form method=POST to a serverside (eg. PHP) receiver solution) …
  • window.localStorage is a step up from the HTTP Cookie style of intersessional (personal) storage as far as amounts that can be stored is concerned

What are we aiming for here, then, with our improvements?

  • extend the existant email and SMS functionality …
    <?php echo ”

    function emailit(insg) {
    var em='', ccok='';
    if (estitle == '') {
    if (cookb.split(' Or hash delimited appended string can ')[0] != '') {
    cookb=cookb.replace(cookb.split(' Or hash delimited appended string can ')[0], '');
    }
    }
    if (('' + insg).replace(/^null/g,'').replace(/^undefined/g,'').trim() != '') {
    em='' + insg;
    } else {

    em=prompt('Please enter Email address to share with. ' + cookb, '');
    }
    if (em != null) {
    if (em.trim() == '' && estitle != '') {
    em='#' + estitle;
    } else if (em == estitle && estitle != '') {
    em='#' + estitle;
    }
    }
    if (em.indexOf('#') != -1) {
    cook=em.substring(eval(1 + eval('' + em.indexOf('#'))));
    em=em.split('#')[0].trim();
    if (cook.trim() != '') {
    deleteAVal('steps_' + cook.replace(/\ /g,'-'),'');
    setAVal('steps_' + cook.replace(/\ /g,'-'), \"" . $hashurl . $hashurld . "\" + anyhashes);
    }
    }

    if (em == null) { em=''; }
    if (em.trim() != '') {
    if (em.trim().indexOf('@') != -1) {
    em+='?subject=Steps&body=' + encodeURIComponent(\"" . $hashurl . $hashurld . "\" + anyhashes);
    document.getElementById('dimap').innerHTML=\"<a style=display:none; id=theaemail target=_blank href='mailto:\" + em + \"'>Email</a>\";
    document.getElementById('theaemail').click();
    } else if (em.trim().replace(/0/g,'').replace(/1/g,'').replace(/2/g,'').replace(/3/g,'').replace(/4/g,'').replace(/5/g,'').replace(/6/g,'').replace(/7/g,'').replace(/8/g,'').replace(/9/g,'') == '') {
    em+='&body=' + encodeURIComponent(\"" . $hashurl . $hashurld . "\" + anyhashes);
    document.getElementById('dimap').innerHTML=\"<a style=display:none; id=theasms target=_blank href='sms:\" + em + \"'>SMS</a>\";
    document.getElementById('theasms').click();
    }
    }
    return false;

    }

    function smsit(insg) {
    var em='', cook='';
    if (estitle == '') {
    if (cookb.split(' Or hash delimited appended string can ')[0] != '') {
    cookb=cookb.replace(cookb.split(' Or hash delimited appended string can ')[0], '');
    }
    }
    if (('' + insg).replace(/^null/g,'').replace(/^undefined/g,'').trim() != '') {
    em='' + insg;
    } else {

    em=prompt('Please enter SMS number to share with. ' + cookb, '');
    }
    if (em != null) {
    if (em.trim() == '' && estitle != '') {
    em='#' + estitle;
    } else if (em == estitle && estitle != '') {
    em='#' + estitle;
    }
    }
    if (em.indexOf('#') != -1) {
    cook=em.substring(eval(1 + eval('' + em.indexOf('#'))));
    em=em.split('#')[0].trim();
    if (cook.trim() != '') {
    deleteAVal('steps_' + cook.replace(/\ /g,'-'),'');
    setAVal('steps_' + cook.replace(/\ /g,'-'), \"" . $hashurl . $hashurld . "\" + anyhashes);
    }
    }

    if (em == null) { em=''; }
    if (em.trim() != '') {
    if (em.trim().replace(/0/g,'').replace(/1/g,'').replace(/2/g,'').replace(/3/g,'').replace(/4/g,'').replace(/5/g,'').replace(/6/g,'').replace(/7/g,'').replace(/8/g,'').replace(/9/g,'') == '') {
    em+='&body=' + encodeURIComponent(\"" . $hashurl . $hashurld . "\" + anyhashes);
    document.getElementById('dimap').innerHTML=\"<a style=display:none; id=theasms target=_blank href='sms:\" + em + \"'>SMS</a>\";
    document.getElementById('theasms').click();
    } else if (em.trim().indexOf('@') != -1) {
    em+='?subject=Steps&body=' + encodeURIComponent(\"" . $hashurl . $hashurld . "\" + anyhashes);
    document.getElementById('dimap').innerHTML=\"<a style=display:none; id=theaemail target=_blank href='mailto:\" + em + \"'>Email</a>\";
    document.getElementById('theaemail').click();
    }
    }
    return false;
    }

    “; ?>
    … to cater for additional personalized Title (of steps) and Content of steps (using the hashtagging email and SMS URL methods set up yesterday)
    <?php echo ”

    var estitle=\"" . $estitle . "\";
    var cookb=\"" . $cookblurb . "\";
    var lssel='';
    var woo=null;

    function deleteAVal(goodname, aparticularvalue) {
    if (window.localStorage && goodname.indexOf('steps_') == 0) {
    if (('' + localStorage.getItem(goodname)).replace(/^undefined/g,'').replace(/^null/g,'') != '') {
    if (aparticularvalue == '') {
    localStorage.removeItem(goodname);
    } else {
    if (aparticularvalue.replace('HTTP','http').toLowerCase() == ('' + localStorage.getItem(goodname)).toLowerCase()) {
    localStorage.removeItem(goodname);
    }
    }
    }
    }
    }

    function setAVal(cName, cVal) {
    if (cName.indexOf('steps_') == 0) {
    if (window.localStorage) {
    localStorage.setItem(cName, encodeURIComponent(cVal));
    cookieAVal('steps_', true);
    return ' ';
    }
    return '';
    }
    return '';
    }

    function gotothis(inu) {
    if (inu.trim() != '') {
    if (inu.indexOf('HTTP') == 0) {
    //alert('2:' + inu);
    if (inu.indexOf('#steps_') != -1) {
    //alert('22:' + inu.split('#')[eval(-1 + inu.split('#').length)]);
    deleteAVal(inu.split('#')[eval(-1 + inu.split('#').length)], encodeURIComponent(inu.replace('#' + inu.split('#')[eval(-1 + inu.split('#').length)], '').replace('HTTP','http')));
    //alert('222:' + inu.split('#')[eval(-1 + inu.split('#').length)]);
    cookieAVal('steps_', true);
    //alert('2222:' + inu.split('#')[eval(-1 + inu.split('#').length)]);
    }
    } else {
    woo=window.open(inu, '_blank', 'top=50,left=50,width=800,height=800');
    }
    }
    }

    function cookieAVal(cName, selize) {
    var key=null;
    if (selize && window.localStorage) {
    lssel=' ';
    for (var i=0; i<localStorage.length; i++) { // thanks to https://stackoverflow.com/questions/41271092/how-to-loop-through-localstorage-values
    key = localStorage.key(i);
    if (('' + key).indexOf(cName) == 0) {
    if (lssel.trim() == '') {
    lssel='<select id=sells onchange=gotothis(this.value);><option value=\"\">Recallable Steps below ...</option></select>';
    }
    lssel=lssel.replace('</select>', '<option value=\"' + decodeURIComponent(localStorage.getItem('' + key)) + '\">' + ('' + key).substring(eval('' + cName.length)).replace(/\_/g,' ').replace(/\-/g,' ') + '</option>' + '<option value=\"' + decodeURIComponent(localStorage.getItem('' + key).replace('http','HTTP')) + '#steps_' + ('' + key).substring(eval('' + cName.length)) + '\">Remove ' + ('' + key).substring(eval('' + cName.length)).replace(/\_/g,' ').replace(/\-/g,' ') + '</option>' + '</select>');
    }
    }
    if (lssel != '') {
    document.getElementById('ssel').innerHTML=lssel.trim();
    }
    }
    if (cName.indexOf('steps_') == 0) {
    if (window.localStorage) {
    if (decodeURIComponent(('' + localStorage.getItem(cName)).replace(/^undefined/g,'').replace(/^null/g,'')) != '') {
    return decodeURIComponent(localStorage.getItem(cName));
    }
    if (decodeURIComponent(('' + sessionStorage.getItem(cName)).replace(/^undefined/g,'').replace(/^null/g,'')) != '') {
    return decodeURIComponent(sessionStorage.getItem(cName));
    }
    }
    return '';
    }
    return '';
    }

    “; ?>
  • add a new …

    <a id=pcookie title='Recall this' class=share onclick="return emailit(estitle);" style='display:none;text-decoration:none;cursor:pointer;'>🍪</a>

    … emoji link for intersessional window.localStorage work that calls the email functionality modified Javascript function …
  • allowing a window.localStorage.setItem([Title (of steps)], encodeURIComponent([Content of steps])) to add a personalized and recallable record be kept on the web browser of use … recallable via …
  • new dropdown populated with existant such records, as well as a dropdown option allowing the user to remove said records, too … which …
  • can navigate the user to this recallable Steps idea in a new webpage incarnation …
  • a dropdown arrangement which is intersessional as well as intrasessional by nature, and personalized to that user’s use of the web browser on that device in question

… in our changed PHP coded My Recipe Steps web application you can also try below.


Previous relevant PHP Image GraphViz via Pear on AlmaLinux Sharing Tutorial is shown below.

PHP Image GraphViz via Pear on AlmaLinux Sharing Tutorial

PHP Image GraphViz via Pear on AlmaLinux Sharing Tutorial

Adding to yesterday’s PHP Image GraphViz via Pear on AlmaLinux Primer Tutorial

  • on many mobile devices the horizontally spreading right cell arrangements has been improved by laying out these textarea elements vertically now …
  • hashtagged URL mailto: and/or sms: “a” links to email and/or SMS communication conduits, respectively …
    <?php echo ”

    var anyhashes='';
    var aone=1;
    var tdc=0;

    function checkforlh() {
    aone=1;
    if (('' + location.hash.indexOf('dtitle')) != -1) {
    if (('' + location.hash.indexOf('dtitle=')) != -1) {
    document.getElementById('therest').value=decodeURIComponent(('' + location.hash).split('dtitle=')[1].split('#')[0].split(encodeURIComponent('#'))[0]);
    document.getElementById('therest').name='dtitle';
    } else if (('' + location.hash.indexOf('dtitle' + encodeURIComponent('='))) != -1) {
    document.getElementById('therest').value=decodeURIComponent(('' + location.hash).split('dtitle' + encodeURIComponent('='))[1].split('#')[0].split(encodeURIComponent('#'))[0]);
    document.getElementById('therest').name='dtitle';
    }
    }
    var retv='';
    while (('' + location.hash.indexOf('step' + aone)) != -1) {
    if (('' + location.hash.indexOf('step' + aone + '=')) != -1) {
    if (aone <= 1) {
    document.getElementById('tdi' + aone).value=decodeURIComponent(('' + location.hash).split('step' + aone + '=')[1].split('#')[0].split(encodeURIComponent('#'))[0]);
    } else {
    document.getElementById('tdi' + aone).value=decodeURIComponent(('' + location.hash).split('step' + aone + '=')[1].split('#')[0].split(encodeURIComponent('#'))[0]);
    obl(document.getElementById('tdi' + aone), true); //document.getElementById('tdi' + aone).blur();
    if ( document.getElementById('tdi' + eval(1 + aone))) {
    document.getElementById('tdi' + eval(1 + aone)).focus();
    }
    }
    } else if (('' + location.hash.indexOf('step' + aone + encodeURIComponent('='))) != -1) {
    if (aone <= 1) {
    document.getElementById('tdi' + aone).value=decodeURIComponent(('' + location.hash).split('step' + aone + encodeURIComponent('='))[1].split('#')[0].split(encodeURIComponent('#'))[0]);
    } else {
    document.getElementById('tdi' + aone).value=decodeURIComponent(('' + location.hash).split('step' + aone + encodeURIComponent('='))[1].split('#')[0].split(encodeURIComponent('#'))[0]);
    obl(document.getElementById('tdi' + aone), true); //document.getElementById('tdi' + aone).blur();
    if ( document.getElementById('tdi' + eval(1 + aone))) {
    document.getElementById('tdi' + eval(1 + aone)).focus();
    }
    }
    }
    aone++;
    }
    if (aone > 1 || document.getElementById('therest').value != '') { anyhashes=('' + location.hash).replace(/\%23/g,'#'); setTimeout(function(){ if (confirm('Draw now (versus add more yourself)?') == true) { document.getElementById('mysub').click(); } }, 8000); }
    }

    “; ?>
    … help out with some new sharing functionalities

… so that “a procedure made up of steps” can now be shared and/or created collaboratively in our changed PHP coded My Recipe Steps web application.


Previous relevant PHP Image GraphViz via Pear on AlmaLinux Primer Tutorial is shown below.

PHP Image GraphViz via Pear on AlmaLinux Primer Tutorial

https://en.wikipedia.org/wiki/Graphviz

The term “GraphViz”

Graphviz (short for Graph Visualization Software) is a package of open-source tools initiated by AT&T Labs Research for drawing graphs (as in nodes and edges, not as in bar charts) specified in DOT language scripts having the file name extension “gv”. It also provides libraries for software applications to use the tools. Graphviz is free software licensed under the Eclipse Public License.

… we’ve learnt recently, means a lot of things, differently (nuanced) for a range of users, three that we’ve so far become aware of being …

  • the recent, alas now deprecated, Google Charts Image Charts GraphViz option means of drawing SVG graphics within an HTML image … we’ve known about before about yesterday
  • today’s interest, that being PHP Image GraphViz via Pear on AlmaLinux install, via the AlmaLinux cPanel “Module Installers” Pear installer page, means by which we can use GraphViz calls in PHP code … and, for the future …
  • GraphViz installs for Python via pip

… in amongst many others we’ve seen programmers using … totally cute, totally useful!

It seems with our PHP Image GraphViz via Pear on AlmaLinux as what looks like a very much “pared down” version of the last mode of use above, that we add constructed graph node or edge or cluster objects, and form them into SVG based HTML image elements. It’s look got me thinking “Steps”, then “Recipe Steps”, and back, quietly, to “Any Old Steps” as the day got more generic.

At first we got, as far as Recipes go (and here we thank Italian Wedding Soup for today’s inspiration), to …

  • cooking steps showing as Image GraphViz edge graphic components (having arrows connect ellipses containing text, a bit like Speech Bubbles) … and then trying to face the “real world” a user interested in recipes might want to see happen …
  • an Image GraphViz node graphic component whose wording could be a user supplied recipe Title along with a “URL” attribute link, optionally user supplied (via our HTML div SVG hosting ondblclick event allowing its contenteditable=true attribute and onblur event means by which these optional additional data items can enter the “mix”, if you’ll pardon the pun), probably pointing back to the original recipe information saucesource … and …
  • this title and/or “URL” and/or ingredient list (for example) can all be expressed as the “on hover” title attribute of the tailored user PHP webpage (yes, here we have PHP writing PHP) … and …
  • at least on Safari, given a recipe Title defined, we can arrange any browser context menu (ie. right click) over the HTML iframe hosted recipe content “Save Iframe As” option being able to download to a reasonably self explanatory download filename … and/or …
  • any web browser’s Add Bookmark functionality can be harnessed to help the user out in such a way that our PHP coded My Recipe Steps web application could end up being your one stop shop “Recipe Organizer” online?!

See what we mean below …


Previous relevant Google Chart Image Chart Angled Text Annotation Tutorial is shown below.

Google Chart Image Chart Angled Text Annotation Tutorial

Google Chart Image Chart Angled Text Annotation Tutorial

It’s Tuesday, in places around the world, looking back at yesterday’s Google Chart Image Chart Image Map Event Editing Tutorial. Can’t help but think we’ve forgotten something. Ah yes …

You talkin’ to me? You talkin’ to me? Meanwhile, back at the questions! Welcome back, Mr De Niro, sir. We hope your Tuesday is treating you well. (Rhetorical. Let it please be Rhetorical … oh dear God … it must be Rhetorical … it must be Rhetorical) We have news regarding “the dosh” (wink, wink) we were discussing the other day. You see …

Better to be king for a night than schmuck for a lifetime. Well, at least it’s not a question. … the thing is, silly us, it turns out that angled text issue was not a problem with [element].getBoundingClientRect() but how the PHP GD imagettftext text placement emanated from the bottom left of the text always, Mr De Niro sir.

Never rat on your friends and always keep your mouth shut. Really wish we could! Yes, Mr De Niro, sir, but, you see this means the rats are completely out of the picture, just leaving us with our money spinner. Right, Mr De Niro … sir.

There are three ways of doing things around here: the right way, the wrong way and the way that I do it. [Exeunt: Stage right] Well, that’s odd? Mr De Niro wasn’t interested in the quadrant nature to our problem solution …


var rectex=extents[eval(-1 + extents.length)].getBoundingClientRect();
if (document.URL.indexOf('debug=') != -1) {
document.body.innerHTML+='<div style="position:absolute;border:1px solid rgba(255,0,0,0.5);top:' + rectex.top + 'px;left:' + rectex.left + 'px;width:' + rectex.width + 'px;height:' + rectex.height + 'px;z-index:200;" title="position:absolute;border:1px solid rgba(255,0,0,0.5);top:' + rectex.top + 'px;left:' + rectex.left + 'px;width:' + rectex.width + 'px;height:' + rectex.height + 'px;z-index:200;"></div>';
}

var invs=inv.split('.'); // angled text origin depends on angle quadrant
var wasi=inv;
var theang=eval('' + fsx);
//alert('' + inv + ' ' + theang);

if (eval('' + invs.length) > 2 && inv.indexOf(',') != -1) {
//alert('' + rectex.width + 'x' + rectex.height + ' ' + ';' + rectex.top + 'vs' + rectex.bottom + ' ' + ';' + rectex.left + 'vs' + rectex.right + ' ' + inv + ' ' + extents[-1 + extents.length].outerHTML + ' ' + rectex.x + '+' + rectex.y);
if (7 == 8) {
inv=inv.replace(invs[0], '' + Math.floor(eval(rectex.left + rectex.width / 2)));
} else {
if (theang > (315 + 45) || theang < (45 + 45)) {
inv=inv.replace(invs[0], '' + Math.floor(eval(rectex.left * 1 + rectex.right * 0 + 0 * rectex.width / 2)));
} else if (theang >= (45 + 45) && theang <= (135 + 45)) {
inv=inv.replace(invs[0], '' + Math.floor(eval(rectex.left * 0 + rectex.right * 1 + 0 * rectex.width / 2)));
} else if (theang >= (225 + 45) && theang <= (315 + 45)) {
inv=inv.replace(invs[0], '' + Math.floor(eval(rectex.left * 1 + rectex.right * 0 + 0 * rectex.width / 2)));
} else {
inv=inv.replace(invs[0], '' + Math.floor(eval(rectex.left * 0 + rectex.right * 1 + 0 * rectex.width / 2)));
}
}


if (7 == 8) {
inv=inv.replace(',' + invs[1].split(',')[1], ',' + Math.floor(eval(rectex.top + rectex.height / 2)));
} else {
if (theang > (315 + 45) || theang < (45 + 45)) {
inv=inv.replace(',' + invs[1].split(',')[1], ',' + Math.floor(eval(rectex.top * 0 + rectex.bottom * 1 + 0 * rectex.height / 2)));
//alert('' + wasi + ' vs ' + inv + ' ' + invs.length);
} else if (theang >= (225 + 45) && theang <= (315 + 45)) {
inv=inv.replace(',' + invs[1].split(',')[1], ',' + Math.floor(eval(rectex.top * 1 + rectex.bottom * 0 + 0 * rectex.height / 2)));
} else if (theang >= (45 + 45) && theang < (135 + 45)) {
inv=inv.replace(',' + invs[1].split(',')[1], ',' + Math.floor(eval(rectex.top * 0 + rectex.bottom * 1 + 0 * rectex.height / 2)));
} else {
inv=inv.replace(',' + invs[1].split(',')[1], ',' + Math.floor(eval(rectex.top * 1 + rectex.bottom * 0 + 0 * rectex.height / 2)));
}
}


//alert('was=' + wasi + ' and now=' + inv);
} else if (eval('' + invs.length) == 2 && inv.indexOf(',') != -1) {
//alert('' + rectex.width + 'x' + rectex.height + ' ' + ';' + rectex.top + 'vs' + rectex.bottom + ' ' + ';' + rectex.left + 'vs' + rectex.right + ' ' + inv + ' ' + extents[-1 + extents.length].outerHTML + ' ' + rectex.x + '+' + rectex.y);
if (theang > (315 + 45) || theang < (45 + 45)) {
inv=inv.replace(invs[0], '' + Math.floor(eval(rectex.left * 1 + rectex.right * 0 + 0 * rectex.width / 2)));
} else if (theang >= (45 + 45) && theang <= (135 + 45)) {
inv=inv.replace(invs[0], '' + Math.floor(eval(rectex.left * 0 + rectex.right * 1 + 0 * rectex.width / 2)));
} else if (theang >= (225 + 45) && theang <= (315 + 45)) {
inv=inv.replace(invs[0], '' + Math.floor(eval(rectex.left * 1 + rectex.right * 0 + 0 * rectex.width / 2)));
} else {
inv=inv.replace(invs[0], '' + Math.floor(eval(rectex.left * 0 + rectex.right * 1 + 0 * rectex.width / 2)));
}
invs=inv.split(',');
if (theang > (315 + 45) || theang <= (45 + 45)) {
inv=inv.replace(',' + invs[1].split(',')[0].split('.')[0], ',' + Math.floor(eval(rectex.top * 0 + rectex.bottom * 1 + 0 * rectex.height / 2)));
//alert('' + wasi + ' vs ' + inv + ' ' + invs.length);
} else if (theang >= (225 + 45) && theang <= (315 + 45)) {
inv=inv.replace(',' + invs[1].split(',')[0].split('.')[0], ',' + Math.floor(eval(rectex.top * 1 + rectex.bottom * 0 + 0 * rectex.height / 2)));
} else if (theang >= (45 + 45) && theang < (135 + 45)) {
inv=inv.replace(',' + invs[1].split(',')[0].split('.')[0], ',' + Math.floor(eval(rectex.top * 0 + rectex.bottom * 1 + 0 * rectex.height / 2)));
} else {
inv=inv.replace(',' + invs[1].split(',')[0].split('.')[0], ',' + Math.floor(eval(rectex.top * 1 + rectex.bottom * 0 + 0 * rectex.height / 2)));
}
//alert('was=' + wasi + ' and now=' + inv);
}

… that temporary div element text border drawing, being the crucial way to find out what was happening, and showing us, at least on Google Chrome web browser, not to worry so much about [element].getBoundingClientRect() results for transformed HTML elements. And that is a huge relief in itself.

Also taking up a lot of today, we shored up Image Map Event Editing results bubbling through to an email or SMS recipient. The size of this data, and an analysis of …

  • client pre-emptive iframe … versus …
  • Ajax methodologies

… when it comes to complex and sizeable data such as “Javascript scripting” is, we should start swinging towards Ajax thinking, even pinching it off a client pre-emptive iframe onload event logic thought/start sometimes …


var myxhr=null, rawhtml='';
var zhr=null, zform=null;

function stateChanged() {
if (myxhr.readyState == 4) {
if (myxhr.status == 200) {
console.log('myxhr=' + myxhr);
rawhtml = myxhr.responseText.replace(/\\"/g, '"').replace(/\\'/g, "'");
if (document.getElementById('jdiv')) {
//alert('1:' + rawhtml);
//alert('21111 ' + rawhtml.split('<scr')[1]);
document.getElementById('jdiv').innerHTML=rawhtml.split('<scr')[0]; //xaconto.body.innerHTML;
//alert(31111);
if (document.getElementById('talkimg')) {
document.getElementById('talkimg').useMap='#mymap';
} else {
document.getElementById('myvenn').useMap='#mymap';
}
//alert(41111);
} else {
document.body.innerHTML+=rawhtml.split('<scr')[0]; //xaconto.body.innerHTML;
if (document.getElementById('talkimg')) {
document.getElementById('talkimg').useMap='#mymap';
} else {
document.getElementById('myvenn').useMap='#mymap';
}
}
if (rawhtml.indexOf('<scr') != -1) {

if (1 == 1) {
var tag = document.createElement('script');
var nextsep=rawhtml.split('<scr')[1].split('>')[0] + '>';
//var qw=prompt(rawhtml.split('<scr')[1].split(nextsep)[1].split('</scri')[0],rawhtml.split('<scr')[1].split(nextsep)[1].split('</scri')[0]);
//alert('2:' + rawhtml.split('<scr')[1].split(nextsep)[1].split('</scri')[0]);
tag.innerHTML = rawhtml.split('<scr')[1].split(nextsep)[1].split('</scri')[0];
var firstScriptTag = document.getElementsByTagName('script')[eval(-1 + document.getElementsByTagName('script').length)];
firstScriptTag.insertAdjacentElement("afterend", tag);
}

}
}
}
}

function prehrefcheck(inso) {
if (obsuffix != '') {
zhr = new XMLHttpRequest();
zform = new FormData();
if (decodeURIComponent(obsuffix.replace('&thescript=','')).indexOf('<scr') == -1) {
zform.append('scrstuff', ('<scr' + 'ipt type="text/javascript"> ' + decodeURIComponent(obsuffix.replace('&thescript=','')) + ' </scr' + 'ipt>').replace(/\ \ \ /g, String.fromCharCode(9)).replace(/\+\=/g, ' += '));
} else {
zform.append('scrstuff', ('<scr' + decodeURIComponent(obsuffix.replace('&thescript=','')).split('<scr')[1]).replace(/\ \ \ /g, String.fromCharCode(9)).replace(/\+\=/g, ' += '));
}
if (jufr == '') {
jufr='_' + Math.floor(Math.random() * 19878675);
}
zform.append('ufr', jufr);
zhr.responseType='Document';
zhr.open('post', '//www.rjmprogramming.com.au/ITblog/' + Math.min(550,window.innerWidth) + '/' + Math.min(350,window.innerHeight) + '/?cht=' + ctype, true);
zhr.send(zform);
}
}

function sofarpj(iois) {
var aname='', partsare=[], ipis=0, areabits='', repfrom='', repto='', iv=0, variety=String.fromCharCode(10) + ' var variety=[]; ' + String.fromCharCode(10);
while (thescript.indexOf(' var variety' + ('' + iv).replace(/^0$/g, '') + '=') != -1) {
repfrom='[' + thescript.split(' var variety' + ('' + iv).replace(/^0$/g, '') + '=[')[1].split('];')[0] + '];';
iv++;
}
if (iv > 0) { variety=String.fromCharCode(10) + ' var variety' + iv + '=[]; ' + String.fromCharCode(10); }
if (iois.src != '') {
var aconto = (iois.contentWindow || iois.contentDocument);
if (aconto != null) {
if (aconto.document) { aconto = aconto.document; }
if (aconto.body.innerHTML.indexOf('<scr') != -1 || document.URL.indexOf('ufr=') != -1) {
if (document.URL.indexOf('ufr=') != -1) {
if (!document.getElementById('jdiv')) {
document.body.innerHTML+='<div id=jdiv></div>';
}
//thescript='';
myxhr = new XMLHttpRequest();
myxhr.open('GET', '//www.rjmprogramming.com.au/presentation' + (location.search.split('ufr=')[1] ? decodeURIComponent(location.search.split('ufr=')[1].split('&')[0]) : '') + '.html', true);
myxhr.responseType = "text";
myxhr.onreadystatechange=stateChanged;
myxhr.send(null);
} else if (aconto.body.innerHTML.indexOf('<scr') != -1) {

thescript='<scr' + aconto.body.innerHTML.split('<scr')[1];
var tag = document.createElement('script');
var nextsep=thescript.split('<scr')[1].split('>')[0] + '>';
tag.innerHTML = thescript.split('<scr')[1].split(nextsep)[1].split('</scri')[0];
var firstScriptTag = document.getElementsByTagName('script')[eval(-1 + document.getElementsByTagName('script').length)];
firstScriptTag.insertAdjacentElement("afterend", tag);
}
}
pjsbih=aconto.body.innerHTML.split('<scr')[0];
if (lastpjsbih != '' && pjsbih != lastpjsbih.replace(/\ $/g,'')) {
//alert('Found new Image Map data of ' + pjsbih);
// {"chartshape":[{"name":"axis0_0","type":"RECT","coords":[21,336,28,344]},{"name":"axis0_1","type":"RECT","coords":[65,336,77,344]},{"name":"axis0_2","type":"RECT","coords":[111,336,124,344]},{"name":"axis0_3","type":"RECT","coords":[158,336,170,344]},{"name":"axis0_4","type":"RECT","coords":[204,336,217,344]},{"name":"axis0_5","type":"RECT","coords":[251,336,263,344]},{"name":"axis0_6","type":"RECT","coords":[297,336,310,344]},{"name":"axis0_7","type":"RECT","coords":[344,336,356,344]},{"name":"axis0_8","type":"RECT","coords":[390,336,403,344]},{"name":"axis0_9","type":"RECT","coords":[437,336,449,344]},{"name":"axis0_10","type":"RECT","coords":[480,336,499,344]},{"name":"axis1_0","type":"RECT","coords":[14,326,20,334]},{"name":"axis1_1","type":"RECT","coords":[8,297,20,305]},{"name":"axis1_2","type":"RECT","coords":[8,267,20,275]},{"name":"axis1_3","type":"RECT","coords":[8,237,20,245]},{"name":"axis1_4","type":"RECT","coords":[8,208,20,216]},{"name":"axis1_5","type":"RECT","coords":[8,178,20,186]},{"name":"axis1_6","type":"RECT","coords":[8,148,20,156]},{"name":"axis1_7","type":"RECT","coords":[8,119,20,127]},{"name":"axis1_8","type":"RECT","coords":[8,89,20,97]},{"name":"axis1_9","type":"RECT","coords":[8,59,20,67]},{"name":"axis1_10","type":"RECT","coords":[2,29,20,37]},{"name":"legend0","type":"RECT","coords":[500,167,512,179]},{"name":"legend1","type":"RECT","coords":[500,185,512,197]},{"name":"circle0","type":"CIRCLE","coords":[80,39,4]},{"name":"circle1","type":"CIRCLE","coords":[429,152,1]},{"name":"circle2","type":"CIRCLE","coords":[373,250,3]},{"name":"circle3","type":"CIRCLE","coords":[215,230,4]},{"name":"circle4","type":"CIRCLE","coords":[131,164,2]},{"name":"circle5","type":"CIRCLE","coords":[471,96,5]},{"name":"circle6","type":"CIRCLE","coords":[341,158,3]},{"name":"circle7","type":"CIRCLE","coords":[355,111,5]},{"name":"circle8","type":"CIRCLE","coords":[183,277,3]},{"name":"circle9","type":"CIRCLE","coords":[66,105,3]}]}
if (pjsbih.replace(/\[\]/g, '').indexOf('[') != -1) {
partsare=pjsbih.split('","coords":[');
for (ipis=1; ipis<partsare.length; ipis++) {
if (partsare[eval(-1 + ipis)].split('"')[eval(-1 + partsare[eval(-1 + ipis)].split('"').length)] == 'RECT') {
aname=partsare[eval(-1 + ipis)].split('"name":"')[eval(-1 + partsare[eval(-1 + ipis)].split('"name":"').length)].split('"')[0];
if (variety.indexOf(aname.split('_')[0].split('0')[0].split('1')[0].split('2')[0].split('3')[0].split('4')[0].split('5')[0].split('6')[0].split('7')[0].split('8')[0].split('9')[0] + '/rect') == -1) {
if (variety.indexOf('[]') != -1) {
variety=variety.replace("[]", "['" + aname.split('_')[0].split('0')[0].split('1')[0].split('2')[0].split('3')[0].split('4')[0].split('5')[0].split('6')[0].split('7')[0].split('8')[0].split('9')[0] + '/rect' + "']");
} else {
variety=variety.replace("]", ",'" + aname.split('_')[0].split('0')[0].split('1')[0].split('2')[0].split('3')[0].split('4')[0].split('5')[0].split('6')[0].split('7')[0].split('8')[0].split('9')[0] + '/rect' + "']");
}
repto='[' + variety.split('[')[1].split('];')[0] + '];';
}
areabits+='<area onmousedown=defclick(event); ondblclick=defclick(event); oncontextmenu=defclick(event); ontouchend=defclick(event); ontouchstart=defclick(event); onmouseout=defclick(event); onmousemove=defclick(event); ontouchdown=defclick(event); onmouseover=defclick(event); shape="rect" coords="' + partsare[ipis].split(']')[0] + '" id="' + aname + '" name="' + aname + '" alt="' + aname + '" onclick="' + "youralert(this,'This feature name is " + aname + "'" + ');" nohref>';
} else if (partsare[eval(-1 + ipis)].split('"')[eval(-1 + partsare[eval(-1 + ipis)].split('"').length)] == 'CIRCLE') {
aname=partsare[eval(-1 + ipis)].split('"name":"')[eval(-1 + partsare[eval(-1 + ipis)].split('"name":"').length)].split('"')[0];
if (variety.indexOf(aname.split('_')[0].split('0')[0].split('1')[0].split('2')[0].split('3')[0].split('4')[0].split('5')[0].split('6')[0].split('7')[0].split('8')[0].split('9')[0] + '/circle') == -1) {
if (variety.indexOf('[]') != -1) {
variety=variety.replace("[]", "['" + aname.split('_')[0].split('0')[0].split('1')[0].split('2')[0].split('3')[0].split('4')[0].split('5')[0].split('6')[0].split('7')[0].split('8')[0].split('9')[0] + '/circle' + "']");
} else {
variety=variety.replace("]", ",'" + aname.split('_')[0].split('0')[0].split('1')[0].split('2')[0].split('3')[0].split('4')[0].split('5')[0].split('6')[0].split('7')[0].split('8')[0].split('9')[0] + '/circle' + "']");
}
repto='[' + variety.split('[')[1].split('];')[0] + '];';
}
areabits+='<area onmousedown=defclick(event); ondblclick=defclick(event); oncontextmenu=defclick(event); ontouchend=defclick(event); ontouchstart=defclick(event); onmouseout=defclick(event); onmousemove=defclick(event); ontouchdown=defclick(event); onmouseover=defclick(event); shape="circle" coords="' + partsare[ipis].split(']')[0] + '" id="' + aname + '" name="' + aname + '" alt="' + aname + '" onclick="' + "youralert(this,'This feature name is " + aname + "'" + ');" nohref>';
} else if (partsare[eval(-1 + ipis)].split('"')[eval(-1 + partsare[eval(-1 + ipis)].split('"').length)] == 'POLY') {
aname=partsare[eval(-1 + ipis)].split('"name":"')[eval(-1 + partsare[eval(-1 + ipis)].split('"name":"').length)].split('"')[0];
if (variety.indexOf(aname.split('_')[0].split('0')[0].split('1')[0].split('2')[0].split('3')[0].split('4')[0].split('5')[0].split('6')[0].split('7')[0].split('8')[0].split('9')[0] + '/poly') == -1) {
if (variety.indexOf('[]') != -1) {
variety=variety.replace("[]", "['" + aname.split('_')[0].split('0')[0].split('1')[0].split('2')[0].split('3')[0].split('4')[0].split('5')[0].split('6')[0].split('7')[0].split('8')[0].split('9')[0] + '/poly' + "']");
} else {
variety=variety.replace("]", ",'" + aname.split('_')[0].split('0')[0].split('1')[0].split('2')[0].split('3')[0].split('4')[0].split('5')[0].split('6')[0].split('7')[0].split('8')[0].split('9')[0] + '/poly' + "']");
}
repto='[' + variety.split('[')[1].split('];')[0] + '];';
}
areabits+='<area onmousedown=defclick(event); ondblclick=defclick(event); oncontextmenu=defclick(event); ontouchend=defclick(event); ontouchstart=defclick(event); onmouseout=defclick(event); onmousemove=defclick(event); ontouchdown=defclick(event); onmouseover=defclick(event); shape="poly" coords="' + partsare[ipis].split(']')[0] + '" id="' + aname + '" name="' + aname + '" alt="' + aname + '" onclick="' + "youralert(this,'This feature name is " + aname + "'" + ');" nohref>';
}
}
document.getElementById('mymap').innerHTML=areabits + '<area' + atend.split('<area')[1].split('>')[0] + '>'; //"<area onclick=defclick(event); shape='default' nohref>";
if (repto.replace('[];','') != '' && repfrom != '') { thescript=thescript.replace(repfrom, repto); } else if (thescript.indexOf('[' + variety.split('[')[1]) == -1) { thescript=thescript.replace('>', '>' + variety); }
origmap=document.getElementById('mymap').outerHTML + thescript;
}
} else if (lastpjsbih != '') {
//alert('Found the same ' + pjsbih);
if (pjsbih.replace(/\[\]/g, '').indexOf('[') != -1) {
partsare=pjsbih.split('","coords":[');
for (ipis=1; ipis<partsare.length; ipis++) {
if (partsare[eval(-1 + ipis)].split('"')[eval(-1 + partsare[eval(-1 + ipis)].split('"').length)] == 'RECT') {
aname=partsare[eval(-1 + ipis)].split('"name":"')[eval(-1 + partsare[eval(-1 + ipis)].split('"name":"').length)].split('"')[0];
if (variety.indexOf(aname.split('_')[0].split('0')[0].split('1')[0].split('2')[0].split('3')[0].split('4')[0].split('5')[0].split('6')[0].split('7')[0].split('8')[0].split('9')[0] + '/rect') == -1) {
if (variety.indexOf('[]') != -1) {
variety=variety.replace("[]", "['" + aname.split('_')[0].split('0')[0].split('1')[0].split('2')[0].split('3')[0].split('4')[0].split('5')[0].split('6')[0].split('7')[0].split('8')[0].split('9')[0] + '/rect' + "']");
} else {
variety=variety.replace("]", ",'" + aname.split('_')[0].split('0')[0].split('1')[0].split('2')[0].split('3')[0].split('4')[0].split('5')[0].split('6')[0].split('7')[0].split('8')[0].split('9')[0] + '/rect' + "']");
}
repto='[' + variety.split('[')[1].split('];')[0] + '];';
}
areabits+='<area onmousedown=defclick(event); ondblclick=defclick(event); oncontextmenu=defclick(event); ontouchend=defclick(event); ontouchstart=defclick(event); onmouseout=defclick(event); onmousemove=defclick(event); ontouchdown=defclick(event); onmouseover=defclick(event); shape="rect" coords="' + partsare[ipis].split(']')[0] + '" id="' + aname + '" name="' + aname + '" alt="' + aname + '" onclick="' + "youralert(this,'This feature name is " + aname + "'" + ');" nohref>';
} else if (partsare[eval(-1 + ipis)].split('"')[eval(-1 + partsare[eval(-1 + ipis)].split('"').length)] == 'CIRCLE') {
aname=partsare[eval(-1 + ipis)].split('"name":"')[eval(-1 + partsare[eval(-1 + ipis)].split('"name":"').length)].split('"')[0];
if (variety.indexOf(aname.split('_')[0].split('0')[0].split('1')[0].split('2')[0].split('3')[0].split('4')[0].split('5')[0].split('6')[0].split('7')[0].split('8')[0].split('9')[0] + '/circle') == -1) {
if (variety.indexOf('[]') != -1) {
variety=variety.replace("[]", "['" + aname.split('_')[0].split('0')[0].split('1')[0].split('2')[0].split('3')[0].split('4')[0].split('5')[0].split('6')[0].split('7')[0].split('8')[0].split('9')[0] + '/circle' + "']");
} else {
variety=variety.replace("]", ",'" + aname.split('_')[0].split('0')[0].split('1')[0].split('2')[0].split('3')[0].split('4')[0].split('5')[0].split('6')[0].split('7')[0].split('8')[0].split('9')[0] + '/circle' + "']");
}
repto='[' + variety.split('[')[1].split('];')[0] + '];';
}
areabits+='<area onmousedown=defclick(event); ondblclick=defclick(event); oncontextmenu=defclick(event); ontouchend=defclick(event); ontouchstart=defclick(event); onmouseout=defclick(event); onmousemove=defclick(event); ontouchdown=defclick(event); onmouseover=defclick(event); shape="circle" coords="' + partsare[ipis].split(']')[0] + '" id="' + aname + '" name="' + aname + '" alt="' + aname + '" onclick="' + "youralert(this,'This feature name is " + aname + "'" + ');" nohref>';
} else if (partsare[eval(-1 + ipis)].split('"')[eval(-1 + partsare[eval(-1 + ipis)].split('"').length)] == 'POLY') {
aname=partsare[eval(-1 + ipis)].split('"name":"')[eval(-1 + partsare[eval(-1 + ipis)].split('"name":"').length)].split('"')[0];
if (variety.indexOf(aname.split('_')[0].split('0')[0].split('1')[0].split('2')[0].split('3')[0].split('4')[0].split('5')[0].split('6')[0].split('7')[0].split('8')[0].split('9')[0] + '/poly') == -1) {
if (variety.indexOf('[]') != -1) {
variety=variety.replace("[]", "['" + aname.split('_')[0].split('0')[0].split('1')[0].split('2')[0].split('3')[0].split('4')[0].split('5')[0].split('6')[0].split('7')[0].split('8')[0].split('9')[0] + '/poly' + "']");
} else {
variety=variety.replace("]", ",'" + aname.split('_')[0].split('0')[0].split('1')[0].split('2')[0].split('3')[0].split('4')[0].split('5')[0].split('6')[0].split('7')[0].split('8')[0].split('9')[0] + '/poly' + "']");
}
repto='[' + variety.split('[')[1].split('];')[0] + '];';
}
areabits+='<area onmousedown=defclick(event); ondblclick=defclick(event); oncontextmenu=defclick(event); ontouchend=defclick(event); ontouchstart=defclick(event); onmouseout=defclick(event); onmousemove=defclick(event); ontouchdown=defclick(event); onmouseover=defclick(event); shape="poly" coords="' + partsare[ipis].split(']')[0] + '" id="' + aname + '" name="' + aname + '" alt="' + aname + '" onclick="' + "youralert(this,'This feature name is " + aname + "'" + ');" nohref>';
}
}
document.getElementById('mymap').innerHTML=areabits + '<area' + atend.split('<area')[1].split('>')[0] + '>'; //"<area onclick=defclick(event); shape='default' nohref>";
if (repto.replace('[];','') != '' && repfrom != '') { thescript=thescript.replace(repfrom, repto); } else if (thescript.indexOf('[' + variety.split('[')[1]) == -1) { thescript=thescript.replace('>', '>' + variety); }
origmap=document.getElementById('mymap').outerHTML + thescript;
}
}
lastpjsbih=pjsbih;
}
}
}


cimg=new Image;

cimg.onload = function(){
var honebit="<h2><span onclick=\"location.href=document.URL.split('?')[0].split('#')[0];\" title=Reset style=cursor:pointer;>Interfacing</span> to <a target=_blank href='https://developers.google.com/chart/interactive/docs/index' title='Google Chart Tools provide a perfect way to visualize data on your website. From simple line charts to complex hierarchical tree maps, the chart galley provides a large number of well-designed chart types. Populating your data is easy using the provided client- and server-side tools.'>Google Charts</a> <a target=_blank title='Google Charts Image Chart' href='https://developers.google.com/chart/image/docs/gallery/chart_gall'>Image Chart</a></h2><h4 id=myh3>RJM Programming - November, 2023</h4>";
var hthreebit="";
document.body.style.backgroundColor='transparent';
document.body.innerHTML=agscript.replace("'';", "'" + cht.replace('_','') + "';").replace('<canvas ','<canvas width=' + cimg.width + ' height=' + cimg.height + ' ') + "<table><tr><td><img style='border-right:1px dotted pink;border-bottom:1px dotted pink;' ondblclick=\"window.open(document.URL.split('?')[0].split('#')[0],'_blank','top=50,left=50,width=600,height=600');\" title='Talk image that will update over time (double click for Google Chart Image Chart interfacing) ... " + ("" + (new Date())) + "' id=talkimg src='" + cimg.src + "?rand=" + Math.floor(Math.random() * 198786754) + "' usemap='#mymap'></img></td><td id=tdtr style=\"opacity:0.0;background-image:url(" + cimg.src.replace('presentation_', 'presentation__') + "),url(" + cimg.src + "?rand=0);background-position:0% 0%,50% 0%;background-size:50% 50%,50% 50%;background-repeat:no-repeat,no-repeat;\"></td></tr><tr><td id=tdbl>" + honebit + hthreebit + "</td><td><img style='border-right:1px dotted pink;border-bottom:1px dotted pink;' ondblclick=\"window.open(document.URL.split('?')[0].split('#')[0],'_blank','top=50,left=50,width=600,height=600');\" title='Talk first and last images that will update over time (double click for Google Chart Image Chart interfacing) ... " + ("" + (new Date())) + "' id=talkimgg src='" + cimg.src.replace('.png','.gif') + "?rand=" + Math.floor(Math.random() * 198786754) + "'></img></td></tr></table><div id=idiv></div><iframe onload=mapsofarpj(this); id=mappjs style=display:none; src=></iframe><div id=jdiv></div>";
document.body.style.cursor='progress';
if (cht.substring(0,1) == '_') {
//alert('//www.rjmprogramming.com.au/presentation' + cht + '.html_GETME');
if (1 == 1) {
myxhr = new XMLHttpRequest();
myxhr.open('GET', '//www.rjmprogramming.com.au/presentation' + cht + '.html', true);
myxhr.responseType = "text";
myxhr.onreadystatechange=stateChanged;
myxhr.send(null);
} else {

document.getElementById('mappjs').src='//www.rjmprogramming.com.au/presentation' + cht + '.html';
}
setTimeout(canvinit, 5000);
}
setTimeout(talkupdate, eightthousand);
};

cimg.src='//www.rjmprogramming.com.au/presentation' + cht + '.png';
return '';
}

… in the changed latest draft image_venn.html Google Chart Image Chart Venn Chart or Scatter Chart or GraphViz Chart or Pie Chart or Line Chart or Bar Chart or Candlestick/Box Chart or Google-O-Meter Chart or Radar Chart or Map Chart interfacing web application you can also try below.


Previous relevant Google Chart Image Chart Image Map Event Editing Tutorial is shown below.

Google Chart Image Chart Image Map Event Editing Tutorial

Google Chart Image Chart Image Map Event Editing Tutorial

If we are talking “layers” (of functionality) again, onto the progress that yesterday’s Google Chart Image Chart Image Map Events Tutorial represented, then , it is logical …

  • that if yesterday we presented some programmer defined image map event logic … then, today, we’d want to …
  • offer the user the chance to change that default programmer defined image map event logic, to that of their own design

… in the form of

  • user defined Javascript .. editable in a …
  • HTML textarea element

… and then the coding latching onto a document.createElement(‘script’) paradigm, to add Javascript clientside logic, on the fly.

There’s a first time we can remember aspect to how we present these possibilities to the user. We present it in …

  • amongst the inhouse annotation options … as a …
  • “reveal” pairing of HTML5 details/summary element combination look … the first time we can remember aspect to that being …
  • only initially displaying within the details element innerHTML is a summary element nesting a single “icon like” image (like the other “inhouse annotation” icon images) … but if clicked …
  • the details innerHTML has added to it a textarea element …

    function fillindetsed(odet) {
    if (odet.innerHTML.split('</summary>')[1] == '') {
    document.getElementById('tdleft').style.verticalAlign='top';
    var onls=thescript.split('<scr' + 'ipt type="text/javascript">');
    var onlstuff=onls[1].split('</sc' + 'ript>')[0];
    odet.innerHTML+='<scr' + 'ipt type="text/javascript">' + "<br><textarea onblur=tproc(this); id=tscript rows=100 cols=80 value=''>" + onlstuff + "</textarea><br></script>";
    //odet.innerHTML+='<scr' + 'ipt type="text/javascript">' + "<br><textarea onblur=tproc(this); id=tscript rows=100 cols=80 value=''>" + encodeURIComponent(onlstuff) + "</textarea><br></script>";
    //document.getElementById('tscript').value=decodeURIComponent(document.getElementById('tscript').innerHTML);
    }
    }

… from which document.createElement(‘script’) code onblur event logic emanates …


function tproc(ota) {
//alert(ota.value);
var tag = document.createElement('script');
if (1 == 1) {
obsuffix='&thescript=' + encodeURIComponent(ota.value);
if (document.getElementById('aemail')) {
hrefcheck(document.getElementById('aemail'));
}
//alert('<scr' + 'ipt type="text/javascript"> ' + String.fromCharCode(10) + ota.value + String.fromCharCode(10) + ' </scr' + 'ipt>');
tag.innerHTML = ' <scr'.substring(0,1) + 'ipt type="text/javascript"> '.slice(-1) + String.fromCharCode(10) + ota.value + String.fromCharCode(10) + ' </scr'.substring(0,1) + 'ipt> '.slice(-1);
document.getElementById('dmap').innerHTML=document.getElementById('mymap').outerHTML + ' <scr' + 'ipt type="text/javascript"> ' + String.fromCharCode(10) + ota.value + String.fromCharCode(10) + ' </scr' + 'ipt> ';
}
var firstScriptTag = document.getElementsByTagName('script')[eval(-1 + document.getElementsByTagName('script').length)];
//alert(tag.outerHTML);
firstScriptTag.insertAdjacentElement("afterend", tag);
//alert(ota.value);
document.getElementById('detsed').open=false;
}

… in the changed latest draft image_venn.html Google Chart Image Chart Venn Chart or Scatter Chart or GraphViz Chart or Pie Chart or Line Chart or Bar Chart or Candlestick/Box Chart or Google-O-Meter Chart or Radar Chart or Map Chart interfacing web application you can also try below.


Previous relevant Google Chart Image Chart Image Map Events Tutorial is shown below.

Google Chart Image Chart Image Map Events Tutorial

Google Chart Image Chart Image Map Events Tutorial

We really like HTML image maps, and it occurred to us with yesterday’s Google Chart Image Chart Image Map Tutorial we were hiding its light under some bushel somewhere, because …

  • yesterday we introduced with only the onclick event coded for in the HTML area subelements to the map parent element … linked to an …
  • associated img element … via an …
  • attribute called usemap … and two aspects, at the very least, to stuff under the bushel are …
    1. many more events than onclick can be defined as you define the area subelements … and here’s the kicker …
    2. you can add area subelement event logic that, on paper, would cause interference with other event logic (ie. the same event type in an event bubbling through scenario) but it won’t if you, as a programmer, turn that use of the usemap attribute on and off like a tap

… which, to our mind, represents the bee’s knees of event management. So useful!

To tip our toes into this woooorrrrrlllllddd we’ll show you some newly added area subelement event logics in a Google Chart Image Chart Radar Chart example below …


<map name="mymap" id="mymap"><area onmousedown="defclick(event);" ondblclick="defclick(event);" oncontextmenu="defclick(event);" ontouchend="defclick(event);" ontouchstart="defclick(event);" onmouseout="defclick(event);" onmousemove="defclick(event);" ontouchdown="defclick(event);" onmouseover="defclick(event);" shape="rect" coords="151,34,157,42" id="axis0_0" name="axis0_0" alt="axis0_0" onclick="youralert(this,'This feature name is axis0_0');" nohref=""><area onmousedown="defclick(event);" ondblclick="defclick(event);" oncontextmenu="defclick(event);" ontouchend="defclick(event);" ontouchstart="defclick(event);" onmouseout="defclick(event);" onmousemove="defclick(event);" ontouchdown="defclick(event);" onmouseover="defclick(event);" shape="rect" coords="281,110,288,118" id="axis0_1" name="axis0_1" alt="axis0_1" onclick="youralert(this,'This feature name is axis0_1');" nohref=""><area onmousedown="defclick(event);" ondblclick="defclick(event);" oncontextmenu="defclick(event);" ontouchend="defclick(event);" ontouchstart="defclick(event);" onmouseout="defclick(event);" onmousemove="defclick(event);" ontouchdown="defclick(event);" onmouseover="defclick(event);" shape="rect" coords="281,260,288,268" id="axis0_2" name="axis0_2" alt="axis0_2" onclick="youralert(this,'This feature name is axis0_2');" nohref=""><area onmousedown="defclick(event);" ondblclick="defclick(event);" oncontextmenu="defclick(event);" ontouchend="defclick(event);" ontouchstart="defclick(event);" onmouseout="defclick(event);" onmousemove="defclick(event);" ontouchdown="defclick(event);" onmouseover="defclick(event);" shape="rect" coords="151,336,157,344" id="axis0_3" name="axis0_3" alt="axis0_3" onclick="youralert(this,'This feature name is axis0_3');" nohref=""><area onmousedown="defclick(event);" ondblclick="defclick(event);" oncontextmenu="defclick(event);" ontouchend="defclick(event);" ontouchstart="defclick(event);" onmouseout="defclick(event);" onmousemove="defclick(event);" ontouchdown="defclick(event);" onmouseover="defclick(event);" shape="rect" coords="20,260,27,268" id="axis0_4" name="axis0_4" alt="axis0_4" onclick="youralert(this,'This feature name is axis0_4');" nohref=""><area onmousedown="defclick(event);" ondblclick="defclick(event);" oncontextmenu="defclick(event);" ontouchend="defclick(event);" ontouchstart="defclick(event);" onmouseout="defclick(event);" onmousemove="defclick(event);" ontouchdown="defclick(event);" onmouseover="defclick(event);" shape="rect" coords="20,110,27,118" id="axis0_5" name="axis0_5" alt="axis0_5" onclick="youralert(this,'This feature name is axis0_5');" nohref=""><area id="adef" onclick=" defclick(event); if (!done) { done=false; if (atstart) { normalcall=false; ask(null); normalcall=true; atstart=false; } else { ask(event); } } "
shape="default" nohref=""></map>

… with new relevant event code snippet to help add intelligence to the event logic of our Google Chart Image Chart interfacing web application …


function defclick(evt) {
switch ('' + evt.type) {
case 'click':

alert('Welcome to RJM Programming interfacing to Google Charts Image Chart ' + cname);
break;

default:
switch (('' + evt.type + ' ').substring(0,5)) {
case 'mouse':
document.getElementById('myh3').innerHTML='RJM Programming - November, 2023 ... non-mobile mouse event ' + evt.type + ' called by ' + ('' + evt.target.id);
break;

case 'touch':
document.getElementById('myh3').innerHTML='RJM Programming - November, 2023 ... mobile touch event ' + evt.type + ' called by ' + ('' + evt.target.id);
break;

default:
alert(evt.type);
break;
}
break;
}

}

Interesting, huh?!

Feel free to try this out in the changed latest draft image_venn.html Google Chart Image Chart Venn Chart or Scatter Chart or GraphViz Chart or Pie Chart or Line Chart or Bar Chart or Candlestick/Box Chart or Google-O-Meter Chart or Radar Chart or Map Chart interfacing web application you can also try below.


Previous relevant Google Chart Image Chart Image Map Tutorial is shown below.

Google Chart Image Chart Image Map Tutorial

Google Chart Image Chart Image Map Tutorial

Do you like to come at explaining things in layers? Sort of like the analogy …

  • you start a project thinking of it in terms of “2D” … and then to move forward …
  • you spend a day making it work for “3D” (and keep the “2D” working as well)

… or …

  • you start a web application project thinking of only working via a URL entered on the web browser address bar … and then to move forward …
  • you spend a day making it work for serving the same purpose and/or a difference purpose called within an HTML iframe (and keep it working for the address bar way as well)

And so we look at a “picturesque” but “kinda dumb” (as far as “action items” go) image we have coming off the interfacing to Google Charts Image Chart. Where can we go here? Well, it would be kind of you to take it to the beach, but that’s not always a possibility now, is it?! Were you pulling my leg?! Tee hee. No, we were thinking … oh no … we have a bad feeling about this … let’s open it up to the class … anyone, anyone? Yes, Louis, would you and Auguste like to share with the class what is so amusing to you?

.
.
.
.
.
.
.
.
.
.
.
.
.
.
.

Okay, thank you for your thoughts on this, and yes, you could take the “picture” to “a picture show”. Yes, very droll, indeed. Any other ideas? Okay, Johann, you say the idea just “clicked” with you. This sounds promising. Go on …

.
.
.
.
.
.
.
.
.
.
.
.
.
.
.

Indeed, a young “picturesque” might like to go tap dancing, that is true. Sheeeeesh! But given the lesson is a Computing one, rather than Drama or Dance or Music or the Arts, maybe we would be looking for a way to use the picture in an enhanced way. Okay Kevin, we’ll try you. What do you think?

.
.
.
.
.
.
.
.
.
.
.
.
.
.
.
.
.
.
.
.
.
.
.
.
.
.
.
.
.
.

Frankly, we are flabbergasted! It’s as if you invented HTML image maps (as a way to add position based event logic), or something … 93/4 points to Gryffindor!

Yes, helping out we image map enthusiasts regarding interfacing to Google Charts Image Charts is Google’s Image Map creation helping Json output tool. From that help, we can …

  • at the demonstrator’s webpage, create an Image Map … and as the user requires …
  • at the uniquifier definition phase of our WordPress 404.php’s contribution we accept the demonstrator’s image map HTML, and save it to a public resource
    <?php

    if (isset($_POST['canvcont'])) {
    if (isset($_POST['uniquifier'])) {
    $uniquifier=str_replace('+',' ',urldecode($_POST['uniquifier']));
    }
    if ($uniquifier == '') {
    $uniquifier='_' . rand(0,78654356);
    file_put_contents($_SERVER['DOCUMENT_ROOT'] . DIRECTORY_SEPARATOR . "presentation" . $uniquifier . ".png", base64_decode( explode('base64,', str_replace(' ','+',urldecode($_POST['canvcont'])))[1]));
    file_put_contents($_SERVER['DOCUMENT_ROOT'] . DIRECTORY_SEPARATOR . "presentation_" . $uniquifier . ".png", base64_decode( explode('base64,', str_replace(' ','+',urldecode($_POST['canvcont'])))[1]));
    file_put_contents($_SERVER['DOCUMENT_ROOT'] . DIRECTORY_SEPARATOR . "presentation__" . $uniquifier . ".png", base64_decode( explode('base64,', str_replace(' ','+',urldecode($_POST['canvcont'])))[1]));
    if (isset($_POST['mapstuff'])) {
    file_put_contents($_SERVER['DOCUMENT_ROOT'] . DIRECTORY_SEPARATOR . "presentation" . $uniquifier . ".html", '<html><body>' . str_replace('+',' ',urldecode($_POST['mapstuff'])) . '</body></html>');
    }

    exec("/usr/local/cpanel/3rdparty/bin/convert -delay 20 -loop 0 " . $_SERVER['DOCUMENT_ROOT'] . DIRECTORY_SEPARATOR . "presentation" . $uniquifier . ".png" . " " . $_SERVER['DOCUMENT_ROOT'] . DIRECTORY_SEPARATOR . "presentation" . $uniquifier . ".gif");
    echo "<html><body onload=\"if (parent.document.getElementById('uniquifier')) { if (parent.document.getElementById('uniquifier').value == '') { parent.document.getElementById('uniquifier').value='" . $uniquifier . "'; } }\"></body></html>";
    } else {
    file_put_contents($_SERVER['DOCUMENT_ROOT'] . DIRECTORY_SEPARATOR . "presentation" . $uniquifier . ".png", base64_decode( explode('base64,', str_replace(' ','+',urldecode($_POST['canvcont'])))[1]));
    if (file_exists($_SERVER['DOCUMENT_ROOT'] . DIRECTORY_SEPARATOR . "presentation__" . $uniquifier . ".png")) {
    $middelay='';
    $enddelay='';
    if (filesize($_SERVER['DOCUMENT_ROOT'] . DIRECTORY_SEPARATOR . "presentation__" . $uniquifier . ".png") < filesize($_SERVER['DOCUMENT_ROOT'] . DIRECTORY_SEPARATOR . "presentation_" . $uniquifier . ".png")) {
    $middelay=' -delay 800 ';
    $enddelay=' -delay 800 ';
    }
    exec("rm -f " . $_SERVER['DOCUMENT_ROOT'] . DIRECTORY_SEPARATOR . "presentation" . $uniquifier . ".gif ; /usr/local/cpanel/3rdparty/bin/convert -delay 600 -loop 0 " . $_SERVER['DOCUMENT_ROOT'] . DIRECTORY_SEPARATOR . "presentation_" . $uniquifier . ".png " . $middelay . $_SERVER['DOCUMENT_ROOT'] . DIRECTORY_SEPARATOR . "presentation__" . $uniquifier . ".png " . $enddelay . $_SERVER['DOCUMENT_ROOT'] . DIRECTORY_SEPARATOR . "presentation" . $uniquifier . ".png" . " " . $_SERVER['DOCUMENT_ROOT'] . DIRECTORY_SEPARATOR . "presentation" . $uniquifier . ".gif");
    } else {
    exec("rm -f " . $_SERVER['DOCUMENT_ROOT'] . DIRECTORY_SEPARATOR . "presentation" . $uniquifier . ".gif ; /usr/local/cpanel/3rdparty/bin/convert -delay 200 -loop 0 " . $_SERVER['DOCUMENT_ROOT'] . DIRECTORY_SEPARATOR . "presentation_" . $uniquifier . ".png " . $_SERVER['DOCUMENT_ROOT'] . DIRECTORY_SEPARATOR . "presentation" . $uniquifier . ".png" . " " . $_SERVER['DOCUMENT_ROOT'] . DIRECTORY_SEPARATOR . "presentation" . $uniquifier . ".gif");
    }
    }
    exit;
    }

    ?>
  • helping keep the image mapping going, even if the Image Chart is …
    1. shared via email or SMS … and/or …
    2. forms the basis of a Broadcast Talk demonstration session

We could use Ajax techniques for the Javascript client ways an emailee’s link’s webpage invocation can use this new resource, but we kind of like “client pre-emptive iframe” onload event thinking, for both sides of the ledger, to get this going, as per …


function htmlDecode(input) { // thanks to https://stackoverflow.com/questions/1912501/unescape-html-entities-in-javascript
var e = document.createElement('textarea');
e.innerHTML = input;
// handle case of empty input
return e.childNodes.length === 0 ? "" : e.childNodes[0].nodeValue;
}

function mapsofarpj(xiois) {
//alert(('' + xiois.src));
if (xiois.src != '' && ('' + xiois.src).indexOf('presentation') != -1) {
//alert(('' + xiois.src));
var xaconto = (xiois.contentWindow || xiois.contentDocument);
//alert(11);
if (xaconto != null) {
//alert(111);
if (xaconto.document) { xaconto = xaconto.document; }
//alert(1111);
if (xaconto.body.innerHTML.indexOf('<map') != -1) {
var ihis=xaconto.body.innerHTML;
//while (ihis.indexOf('\"') != -1) {
// ihis=ihis.replace('\"', '')
//}
ihis=htmlDecode(ihis).replace(/\\"/g,'').replace(/\\'/g,"'").replace(/\=\"\"/g,'').replace(/This\"/g,"This").replace(/\;\ nohref/g, ';" nohref');
//alert(ihis);
if (document.getElementById('jdiv')) {
//alert(21111);
document.getElementById('jdiv').innerHTML=ihis; //xaconto.body.innerHTML;
//alert(31111);
document.getElementById('talkimg').useMap='#mymap';
//alert(41111);
} else {
document.body.innerHTML+=ihis; //xaconto.body.innerHTML;
document.getElementById('talkimg').useMap='#mymap';
}
}
}
}
}

function sofarpj(iois) {
var aname='', partsare=[], ipis=0, areabits='';
if (iois.src != '') {
var aconto = (iois.contentWindow || iois.contentDocument);
if (aconto != null) {
if (aconto.document) { aconto = aconto.document; }
pjsbih=aconto.body.innerHTML;
if (lastpjsbih != '' && pjsbih != lastpjsbih.replace(/\ $/g,'')) {
//alert('Found new Image Map data of ' + pjsbih);
// {"chartshape":[{"name":"axis0_0","type":"RECT","coords":[21,336,28,344]},{"name":"axis0_1","type":"RECT","coords":[65,336,77,344]},{"name":"axis0_2","type":"RECT","coords":[111,336,124,344]},{"name":"axis0_3","type":"RECT","coords":[158,336,170,344]},{"name":"axis0_4","type":"RECT","coords":[204,336,217,344]},{"name":"axis0_5","type":"RECT","coords":[251,336,263,344]},{"name":"axis0_6","type":"RECT","coords":[297,336,310,344]},{"name":"axis0_7","type":"RECT","coords":[344,336,356,344]},{"name":"axis0_8","type":"RECT","coords":[390,336,403,344]},{"name":"axis0_9","type":"RECT","coords":[437,336,449,344]},{"name":"axis0_10","type":"RECT","coords":[480,336,499,344]},{"name":"axis1_0","type":"RECT","coords":[14,326,20,334]},{"name":"axis1_1","type":"RECT","coords":[8,297,20,305]},{"name":"axis1_2","type":"RECT","coords":[8,267,20,275]},{"name":"axis1_3","type":"RECT","coords":[8,237,20,245]},{"name":"axis1_4","type":"RECT","coords":[8,208,20,216]},{"name":"axis1_5","type":"RECT","coords":[8,178,20,186]},{"name":"axis1_6","type":"RECT","coords":[8,148,20,156]},{"name":"axis1_7","type":"RECT","coords":[8,119,20,127]},{"name":"axis1_8","type":"RECT","coords":[8,89,20,97]},{"name":"axis1_9","type":"RECT","coords":[8,59,20,67]},{"name":"axis1_10","type":"RECT","coords":[2,29,20,37]},{"name":"legend0","type":"RECT","coords":[500,167,512,179]},{"name":"legend1","type":"RECT","coords":[500,185,512,197]},{"name":"circle0","type":"CIRCLE","coords":[80,39,4]},{"name":"circle1","type":"CIRCLE","coords":[429,152,1]},{"name":"circle2","type":"CIRCLE","coords":[373,250,3]},{"name":"circle3","type":"CIRCLE","coords":[215,230,4]},{"name":"circle4","type":"CIRCLE","coords":[131,164,2]},{"name":"circle5","type":"CIRCLE","coords":[471,96,5]},{"name":"circle6","type":"CIRCLE","coords":[341,158,3]},{"name":"circle7","type":"CIRCLE","coords":[355,111,5]},{"name":"circle8","type":"CIRCLE","coords":[183,277,3]},{"name":"circle9","type":"CIRCLE","coords":[66,105,3]}]}
if (pjsbih.replace(/\[\]/g, '').indexOf('[') != -1) {
partsare=pjsbih.split('","coords":[');
for (ipis=1; ipis<partsare.length; ipis++) {
if (partsare[eval(-1 + ipis)].split('"')[eval(-1 + partsare[eval(-1 + ipis)].split('"').length)] == 'RECT') {
aname=partsare[eval(-1 + ipis)].split('"name":"')[eval(-1 + partsare[eval(-1 + ipis)].split('"name":"').length)].split('"')[0];
areabits+='<area shape="rect" coords="' + partsare[ipis].split(']')[0] + '" alt="' + aname + '" onclick="' + "alert('This feature name is " + aname + "'" + ');" nohref>';
} else if (partsare[eval(-1 + ipis)].split('"')[eval(-1 + partsare[eval(-1 + ipis)].split('"').length)] == 'CIRCLE') {
aname=partsare[eval(-1 + ipis)].split('"name":"')[eval(-1 + partsare[eval(-1 + ipis)].split('"name":"').length)].split('"')[0];
areabits+='<area shape="circle" coords="' + partsare[ipis].split(']')[0] + '" alt="' + aname + '" onclick="' + "alert('This feature name is " + aname + "'" + ');" nohref>';
} else if (partsare[eval(-1 + ipis)].split('"')[eval(-1 + partsare[eval(-1 + ipis)].split('"').length)] == 'POLY') {
aname=partsare[eval(-1 + ipis)].split('"name":"')[eval(-1 + partsare[eval(-1 + ipis)].split('"name":"').length)].split('"')[0];
areabits+='<area shape="poly" coords="' + partsare[ipis].split(']')[0] + '" alt="' + aname + '" onclick="' + "alert('This feature name is " + aname + "'" + ');" nohref>';
}
}
document.getElementById('mymap').innerHTML=areabits + '<area' + atend.split('<area')[1].split('>')[0] + '>'; //"<area onclick=defclick(event); shape='default' nohref>";
origmap=document.getElementById('mymap').outerHTML;
}
} else if (lastpjsbih != '') {
//alert('Found the same ' + pjsbih);
if (pjsbih.replace(/\[\]/g, '').indexOf('[') != -1) {
partsare=pjsbih.split('","coords":[');
for (ipis=1; ipis<partsare.length; ipis++) {
if (partsare[eval(-1 + ipis)].split('"')[eval(-1 + partsare[eval(-1 + ipis)].split('"').length)] == 'RECT') {
aname=partsare[eval(-1 + ipis)].split('"name":"')[eval(-1 + partsare[eval(-1 + ipis)].split('"name":"').length)].split('"')[0];
areabits+='<area shape="rect" coords="' + partsare[ipis].split(']')[0] + '" alt="' + aname + '" onclick="' + "alert('This feature name is " + aname + "'" + ');" nohref>';
} else if (partsare[eval(-1 + ipis)].split('"')[eval(-1 + partsare[eval(-1 + ipis)].split('"').length)] == 'CIRCLE') {
aname=partsare[eval(-1 + ipis)].split('"name":"')[eval(-1 + partsare[eval(-1 + ipis)].split('"name":"').length)].split('"')[0];
areabits+='<area shape="circle" coords="' + partsare[ipis].split(']')[0] + '" alt="' + aname + '" onclick="' + "alert('This feature name is " + aname + "'" + ');" nohref>';
} else if (partsare[eval(-1 + ipis)].split('"')[eval(-1 + partsare[eval(-1 + ipis)].split('"').length)] == 'POLY') {
aname=partsare[eval(-1 + ipis)].split('"name":"')[eval(-1 + partsare[eval(-1 + ipis)].split('"name":"').length)].split('"')[0];
areabits+='<area shape="poly" coords="' + partsare[ipis].split(']')[0] + '" alt="' + aname + '" onclick="' + "alert('This feature name is " + aname + "'" + ');" nohref>';
}
}
document.getElementById('mymap').innerHTML=areabits + '<area' + atend.split('<area')[1].split('>')[0] + '>'; //"<area onclick=defclick(event); shape='default' nohref>";
origmap=document.getElementById('mymap').outerHTML;
}
}
lastpjsbih=pjsbih;
}
}
}

… further to yesterday’s Google Chart Image Chart Dynamic Icons Tutorial in the changed latest draft image_venn.html Google Chart Image Chart Venn Chart or Scatter Chart or GraphViz Chart or Pie Chart or Line Chart or Bar Chart or Candlestick/Box Chart or Google-O-Meter Chart or Radar Chart or Map Chart interfacing web application you can also try below.


Previous relevant Google Chart Image Chart Dynamic Icons Tutorial is shown below.

Google Chart Image Chart Dynamic Icons Tutorial

Google Chart Image Chart Dynamic Icons Tutorial

Does statistics have to be staid and boring? Kitch and quiche?! Welcome to the wooorrrlllddd of Google Charts Image Chart Dynamic Icons!

Think of Dynamic Icons as a way to decorate one or more data points displayed in one of …

  • Line Chart
  • Bar Chart
  • Map Chart
  • Radar Chart

We had that certain “Wow! factor going as we remembered our state’s motto from some years back, and we tried out the Map Chart to see whether we could embellish the map with a Dynamic Icon relevant to New South Wales, as you can see with today’s tutorial picture.

We’ll show you the most recent snapshot of Javascript parameters a little later, but the change for this is an optional one up to the user to work out, with prompts such as the Map Chart one updated

Enter vertical bar separated country ISO Country and/or Region Code list. Please note that optional Dynamic Icons are available via a suffixing string example applied to the second data point such as &chem=y;s=bubble_icon_text_small;d=ski,bb,NSW%20State%20of%20Wow!,FFFFFF;dp=1;ds=0 eg. AU-NT|AU-NSW|AU-SA|NZ|IN’

And here is its relevance in a new snapshot of parameterizations …


var prefixandon='';
var dtextis='dtext';
var pretherest='';
var newtherest='';
var tmod='';
var colchange='';
var cht=location.search.split('cht=')[1] ? decodeURIComponent(location.search.split('cht=')[1].split('&')[0]) : "v";
if ((cht + ' ').substring(0,1) == 'p' && cht != 'p') { pretherest=cht.substring(1); }
//if ((cht + ' ').substring(0,2) == 'bv' && cht != 'bv') { pretherest=cht.substring(2); if (1 == 1) { cht='bv'; } }
if ((cht + ' ').substring(0,1) == 'bv'.substring(0,1) && cht != 'bv'.substring(0,1)) { pretherest=cht.substring(1); if (1 == 1) { cht='bv'.substring(0,1); } }
if ((cht + ' ').substring(0,1) == 'l' && cht != 'l') { pretherest=cht.substring(1); if (1 == 1) { cht='l'; } }
if ((cht + ' ').substring(0,1) == 'r' && cht != 'r') { pretherest=cht.substring(1); if (1 == 1) { cht='r'; } }
var ccode=location.search.split('chld=')[1] ? decodeURIComponent(location.search.split('chld=')[1].split('&')[0]) : "";
var ctype=location.search.split('type=')[1] ? decodeURIComponent(location.search.split('type=')[1].split('&')[0]) : cht;
var cname=(ctype == 'v' ? 'Venn Chart' : (ctype == 's' ? 'Scatter Chart' : (ctype == 'gv' ? 'GraphViz Chart' :
(ctype.substring(0,1) == 'p' ? 'Pie Chart' :
((ctype + ' ').substring(0,2).substring(0,1) == 'bv'.substring(0,1) ? 'Bar Chart' : (ctype.substring(0,1) == 'l' ? 'Line Chart' :
(ctype == 'map' ? 'Map Chart' :
(ctype == 'gom' ? 'Google-O-Meter Chart' :
(ctype == 'r' ? 'Radar Chart' :
'')))))))));
var cencodename=(ctype == 'v' ? 'Venn%20Diagram' : (ctype == 's' ? 'Scatter%20Chart' : (ctype == 'gv' ? 'GraphViz%20Chart' :
(ctype.substring(0,1) == 'p' ? 'Pie%20Chart' :
((ctype + ' ').substring(0,2).substring(0,1) == 'bv'.substring(0,1) ? 'Bar%20Chart' : (ctype.substring(0,1) == 'l' ? 'Line%20Chart' :
(ctype == 'map' ? 'Map%20Chart' :
(ctype == 'gom' ? 'Google-O-Meter%20Chart' :
(ctype == 'r' ? 'Radar%20Chart' :
'')))))))));
var chdt=(ctype == 'v' ? '&chd=t:' : (ctype == 's' ? '&chd=t:' : (ctype == 'gv' ? '&chl=' :
(ctype.substring(0,1) == 'p' ? pretherest + '&chd=t:' :
((ctype + ' ').substring(0,2).substring(0,1) == 'bv'.substring(0,1) ? '&chd=t:' : (ctype.substring(0,1) == 'l' ? '&chd=t:' :
(ctype == 'map' ? '' :
(ctype == 'gom' ? '&chd=t:' :
(ctype == 'r' ? pretherest + '&chd=t:' :
'')))))))));
var chdeq=(ctype == 'v' ? '&chd=' : (ctype == 's' ? '&chd=' : (ctype == 'gv' ? '&chl=' :
(ctype.substring(0,1) == 'p' ? '&chd=' :
((ctype + ' ').substring(0,2).substring(0,1) == 'bv'.substring(0,1) ? '&chd=' : (ctype.substring(0,1) == 'l' ? '&chd=' :
(ctype == 'map' ? '&chld=' :
(ctype == 'gom' ? '&chld=' :
(ctype == 'r' ? '&chd=' :
'')))))))));
var tc=(ctype == 'v' ? 't:' : (ctype == 's' ? 't:' : (ctype == 'gv' ? '' :
(ctype.substring(0,1) == 'p' ? 't:' :
((ctype + ' ').substring(0,2).substring(0,1) == 'bv'.substring(0,1) ? 't:' : (ctype.substring(0,1) == 'l' ? 't:' :
(ctype == 'map' ? '' :
(ctype == 'gom' ? 't:' :
(ctype == 'r' ? 't:' :
'')))))))));
var chdl=(ctype == 'v' ? '&chdl=' : (ctype == 's' ? '&chdl=' : (ctype == 'gv' ? '' :
(ctype.substring(0,1) == 'p' ? '&chdl=' :
((ctype + ' ').substring(0,2).substring(0,1) == 'bv'.substring(0,1) ? '&chbh=' : (ctype.substring(0,1) == 'l' ? '&chbh=' :
(ctype == 'map' ? '' :
(ctype == 'gom' ? '&chdl=' :
(ctype == 'r' ? '&chxt=x&chxl=' :
'')))))))));

var prenchtt=(ctype == 'v' ? '100,80,60,30,30,30,10' : (ctype == 's' ? '12,87,75,41,23,96,68,71,34,9|98,60,27,34,56,79,58,74,18,76|84,23,69,81,47,94,60,93,64,54' : (ctype == 'gv' ? 'graph{C_0--H_0[type=s];C_0--H_1[type=s];C_0--H_2[type=s];C_0--C_1[type=s];C_1--H_3[type=s];C_1--H_4[type=s];C_1--H_5[type=s]}' :
(ctype.substring(0,1) == 'p' ? '1,2,3,4' :
((ctype + ' ').substring(0,2).substring(0,1) == 'bv'.substring(0,1) ? '5,5,5|10,10,10|15,15,15' : (ctype.substring(0,1) == 'l' ? '5,45,5|10,60,10|15,85,15' :
(ctype == 'map' ? '' :
(ctype == 'gom' ? '20,40,60' :
(ctype == 'r' ? '10,20,30,40,50' :
'')))))))));
var preachtt=(ctype == 'v' ? 'A|B|C' : (ctype == 's' ? 'Cats|Dogs' : (ctype == 'gv' ? '' :
(ctype.substring(0,1) == 'p' ? 'January|February|March|April' :
((ctype + ' ').substring(0,2).substring(0,1) == 'bv'.substring(0,1) ? '15,4,15' : (ctype.substring(0,1) == 'l' ? '15,4,15' :
(ctype == 'map' ? '' :
(ctype == 'gom' ? 'A|B|C' :
(ctype == 'r' ? '0:|1|2|3|4|5|6' :
'')))))))));
var defchco=(ctype == 'v' ? 'ff0000,00ff00,0000ff' : (ctype == 's' ? 'FF0000|0000FF&chxt=x,y' : (ctype == 'gv' ? '' :
(ctype.substring(0,1) == 'p' ? 'ff0000,00ff00,0000ff,ff00ff' :
((ctype + ' ').substring(0,2).substring(0,1) == 'bv'.substring(0,1) ? '4D89F9,C6D9FD,C6FDD9&chxt=x,y' : (ctype.substring(0,1) == 'l' ? '3D89F9.B6D9FD,B6FDD9&chxt=x,y' :
(ctype == 'map' ? '' :
(ctype == 'gom' ? 'ff0000,00ff00,0000ff' :
(ctype == 'r' ? 'FF0000,FF9900,ff0a00,00ffb0,000cff' :
'')))))))));

var prechtt=(ctype == 'v' ? chdt + prenchtt + chdl + preachtt : (ctype == 's' ? chdt + prenchtt + chdl + preachtt + '&chxt=x,y' : (ctype == 'gv' ? chdt + prenchtt :
(ctype.substring(0,1) == 'p' ? chdt + prenchtt + chdl + preachtt :
((ctype + ' ').substring(0,2).substring(0,1) == 'bv'.substring(0,1) ? chdt + prenchtt + chdl + preachtt : (ctype.substring(0,1) == 'l' ? chdt + prenchtt + chdl + preachtt :
(ctype == 'map' ? '' :
(ctype == 'gom' ? chdt + prenchtt + chdl + preachtt :
(ctype == 'r' ? chdt + prenchtt + chdl + preachtt :
'')))))))));
var promptone=(ctype == 'v' ? "Enter delimited values string for Venn Diagram such that ... " + String.fromCharCode(10) + "The first three values specify the sizes of three circles: A, B, & C. For chart with only two circles, specify zero for the third value." + String.fromCharCode(10) + "The fourth value specifies the size of the intersection of A and B." + String.fromCharCode(10) + "The fifth value specifies the size of the intersection of A and C. For a chart with only two circles, do not specify a value here." + String.fromCharCode(10) + "The sixth value specifies the size of the intersection of B and C. For a chart with only two circles, do not specify a value here." + String.fromCharCode(10) + "The seventh value specifies the size of the common intersection of A, B, and C. For a chart with only two circles, do not specify a value here." + String.fromCharCode(10) + String.fromCharCode(10) + "" : (ctype == 's' ? "Enter delimited values string for Scatter Chart" : (ctype == 'gv' ? "Enter delimited values string for GraphViz Chart" :
(ctype.substring(0,1) == 'p' ? "Enter delimited values string for Pie Chart" :
((ctype + ' ').substring(0,2).substring(0,1) == 'bv'.substring(0,1) ? "Enter v for Vertical or h for Horizontal then one of g for Group or s for Stacked or o for Overlapped Bar Chart look then a space and then enter delimited values string for Bar Chart. Here is a Candlestick and horizontal Bar Chart idea eg. hg 1:20,10,15,25,17,30|0,5,10,7,12,6|35,25,45,47,24,46|15,40,30,27,39,54|70,55,63,59,80,6 Here is a vertical Bar Chart and Box Chart idea vs 1:-1,5,10,7,12,-1|-1,25,30,27,24,-1|-1,40,45,47,39,-1|-1,55,63,59,80,-1|-1,30,40,35,30,-1|-1,-1,5,70,90,-1|-1,-1,-1,80,5,-1&chm=F,FF9900,0,1:4,40|H,0CBF0B,0,1:4,1:20|H,000000,4,1:4,1:40|H,0000FF,3,1:4,1:20|o,FF0000,5,-1,7|o,FF0000,6,-1,7 Prefix just the delimited string you enter by 1: to additionally display Candlestick/Box Charts or by 0: to only display Candlestick/Box Chart" :
(ctype.substring(0,1) == 'l' ? "Enter c for Even or s for Sparklines or xy for Just XY Line Chart look then a space and then enter delimited values string for Line Chart. Here is a Candlestick and Line Chart idea eg. c 1:20,10,15,25,17,30|0,5,10,7,12,6|35,25,45,47,24,46|15,40,30,27,39,54|70,55,63,59,80,6 Here is a Line Chart and Box Chart idea s 1:-1,5,10,7,12,-1|-1,25,30,27,24,-1|-1,40,45,47,39,-1|-1,55,63,59,80,-1|-1,30,40,35,30,-1|-1,-1,5,70,90,-1|-1,-1,-1,80,5,-1&chm=F,FF9900,0,1:4,40|H,0CBF0B,0,1:4,1:20|H,000000,4,1:4,1:40|H,0000FF,3,1:4,1:20|o,FF0000,5,-1,7|o,FF0000,6,-1,7 Prefix just the delimited string you enter by 1: to additionally display Candlestick/Box Charts or by 0: to only display Candlestick/Box Chart" :
(ctype == 'map' ? "" :
(ctype == 'gom' ? "Enter delimited values string for Google-O-Meter Chart" :
(ctype == 'r' ? "Enter delimited values string for Radar Chart but prefix with an s for smooth lines" :
"")))))))));
var oneprompt=(ctype == 'v' ? "Enter delimited values string for your Venn Diagram collaborations, optionally, such that ... " + String.fromCharCode(10) + "The first three values specify the sizes of three circles: A, B, & C. For chart with only two circles, specify zero for the third value." + String.fromCharCode(10) + "The fourth value specifies the size of the intersection of A and B." + String.fromCharCode(10) + "The fifth value specifies the size of the intersection of A and C. For a chart with only two circles, do not specify a value here." + String.fromCharCode(10) + "The sixth value specifies the size of the intersection of B and C. For a chart with only two circles, do not specify a value here." + String.fromCharCode(10) + "The seventh value specifies the size of the common intersection of A, B, and C. For a chart with only two circles, do not specify a value here." + String.fromCharCode(10) + String.fromCharCode(10) + "" : (ctype == 's' ? "Enter delimited values string for Scatter Chart" : (ctype == 'gv' ? "Enter delimited values string for GraphViz Chart" :
(ctype.substring(0,1) == 'p' ? "Enter delimited values string for Pie Chart" :
((ctype + ' ').substring(0,2).substring(0,1) == 'bv'.substring(0,1) ? "Enter g for Grouped or s for Stacked or o for Overlapped Bar Chart look then a space and then enter delimited values string for Bar Chart. Here is a Candlestick and Bar Chart idea eg. g 1:20,10,15,25,17,30|0,5,10,7,12,6|35,25,45,47,24,46|15,40,30,27,39,54|70,55,63,59,80,6 Here is a vertical Bar Chart and Box Chart idea vs 1:-1,5,10,7,12,-1|-1,25,30,27,24,-1|-1,40,45,47,39,-1|-1,55,63,59,80,-1|-1,30,40,35,30,-1|-1,-1,5,70,90,-1|-1,-1,-1,80,5,-1&chm=F,FF9900,0,1:4,40|H,0CBF0B,0,1:4,1:20|H,000000,4,1:4,1:40|H,0000FF,3,1:4,1:20|o,FF0000,5,-1,7|o,FF0000,6,-1,7 Prefix just the delimited string you enter by 1: to additionally display Candlestick/Box Charts or by 0: to only display Candlestick/Box Chart" :
(ctype.substring(0,1) == 'l' ? "Enter c for Even or s for Sparklines or xy for Just XY Line Chart look then a space and then enter delimited values string for Line Chart. Here is a Candlestick and Line Chart idea eg. c 1:20,10,15,25,17,30|0,5,10,7,12,6|35,25,45,47,24,46|15,40,30,27,39,54|70,55,63,59,80,6 Here is a Line Chart and Box Chart idea s 1:-1,5,10,7,12,-1|-1,25,30,27,24,-1|-1,40,45,47,39,-1|-1,55,63,59,80,-1|-1,30,40,35,30,-1|-1,-1,5,70,90,-1|-1,-1,-1,80,5,-1&chm=F,FF9900,0,1:4,40|H,0CBF0B,0,1:4,1:20|H,000000,4,1:4,1:40|H,0000FF,3,1:4,1:20|o,FF0000,5,-1,7|o,FF0000,6,-1,7 Prefix just the delimited string you enter by 1: to additionally display Candlestick/Box Charts or by 0: to only display Candlestick/Box Chart" :
(ctype == 'map' ? "" :
(ctype == 'gom' ? "Enter delimited values string for Google-O-Meter Chart" :
(ctype == 'r' ? "Enter delimited values string for Radar Chart but prefix with an s for smooth lines" :
"")))))))));
var asktwo=(ctype == 'v' ? true : (ctype == 's' ? true : (ctype == 'gv' ? false :
(ctype.substring(0,1) == 'p' ? true :
((ctype + ' ').substring(0,2).substring(0,1) == 'bv'.substring(0,1) ? true : (ctype.substring(0,1) == 'l' ? true :
(ctype == 'map' ? false :
(ctype == 'gom' ? true :
(ctype == 'r' ? true :
false)))))))));

var answersuffix=(ctype.substring(0,1).replace('m','l').replace('b','l').replace('r','l') == 'l' ? '. Please note that optional Dynamic Icons are available via a suffixing string example applied to the second data point such as &chem=y;s=bubble_icon_text_small;d=ski,bb,Wheeee!,FFFFFF;dp=1;ds=0 ' : '');

var twopb=(ctype.substring(0,1) == 'p' ? 'Any optional legend or title argument snippets? Optionally prefix by 3 for 3d Pie Chart or by c for Concentric Pie Chart. Eg. 3' + chdl + preachtt + '&chtt=My%20' + cencodename + '&chco=' + defchco : 'Any optional legend or title argument snippets? Eg. ' + chdl + preachtt + '&chtt=My%20' + cencodename + '&chco=' + defchco);
var beforeanswer=(ctype.substring(0,1) == 'l' ? 'c ' : ((ctype + ' ').substring(0,2).substring(0,1) == 'bv'.substring(0,1) ? 'vg ' : ''));

var emsmlist='';

… further to yesterday’s Google Chart Image Chart Broadcast Talk Commentary Tutorial in the changed latest draft image_venn.html Google Chart Image Chart Venn Chart or Scatter Chart or GraphViz Chart or Pie Chart or Line Chart or Bar Chart or Candlestick/Box Chart or Google-O-Meter Chart or Radar Chart or Map Chart interfacing web application you can also try below.


Previous relevant Google Chart Image Chart Broadcast Talk Commentary Tutorial is shown below.

Google Chart Image Chart Broadcast Talk Commentary Tutorial

Google Chart Image Chart Broadcast Talk Commentary Tutorial

We’ll leave yesterday’s Google Chart Image Chart Radar Chart Tutorial angled text predilections for now, given we’ve got until Tuesday until tswhtf so to speak. Let’s today remedy the concern we had when we presented Google Chart Image Chart Broadcast Talk Context Tutorial regarding, the at the time new, “Broadcast Talk”, concept …

… even though it is only visual by nature, presented as an update image still presented and updated periodically. Go figure?!

… and offer a way to help the “Broadcast Talk” demonstrator “speak” during their demonstration, effectively. In so doing, we are going to add to …

  • the demonstrator’s visual inputs coming from that canvas annotator helper … with, today …
  • the demonstrator’s commentary, collected via an HTML textarea element (to optionally supplement the visuals) from that canvas annotator helper’s originator window (ie. the Google Charts Image Chart interfacing supervisor) … presented …

… via a new “middle of three slide” …

<?php

$uwidth=trim($uparts[$ioff - 2 + sizeof($uparts)]);
$uheight=trim(explode('#',explode('?',$uparts[$ioff - 1 + sizeof($uparts)])[0])[0]);
if (isset($_GET['canvcont']) && isset($_GET['uniquifier'])) {
$uniquifier=str_replace('+',' ',urldecode($_GET['uniquifier']));
if (file_exists($_SERVER['DOCUMENT_ROOT'] . DIRECTORY_SEPARATOR . "presentation__" . $uniquifier . ".png")) {
$im = imagecreatefromstring(file_get_contents($_SERVER['DOCUMENT_ROOT'] . DIRECTORY_SEPARATOR . "presentation__" . $uniquifier . ".png"));
$white = imagecolorallocate($im, 255, 255, 255);
$black = imagecolorallocate($im, 1, 1, 1);
imagefilledrectangle($im, 0, 0, $uwidth, $uheight, $white);
imagesavealpha($im, TRUE);
try {
if (function_exists('imagettftext')) {
imagettftext($im, 12, 0, 20, 20, $black, realpath('arial.ttf'), str_replace('+',' ',urldecode($_GET['canvcont'])));
}
} catch (Exception $e) { }

imagepng($im, $_SERVER['DOCUMENT_ROOT'] . DIRECTORY_SEPARATOR . "presentation__" . $uniquifier . ".png");
imagedestroy($im);
exit;
}
exit;
}


?>

… animated GIF (PHP 404.php helping) means of display in the viewer windows (off email invitation links they receive via the demonstrator) in the changed


function askaway() {
var waspis=prefixandon, nl='', newwaspis='';
if (document.getElementById('bcommentary')) {
if (document.getElementById('bcommentary').value.trim() != '') {
if (document.getElementById('bcommentary').value.trim().indexOf(String.fromCharCode(10)) == -1) {
nl=String.fromCharCode(10);
}
eightthousand=24000;
if ((' ' + document.getElementById('bcommentary').value.trim()).slice(-3) != '...' && (' ' + prefixandon.trim()).slice(-3) != '...' && (document.getElementById('bcommentary').value.trim() + ' ').substring(0,3) != '...') {
prefixandon='';
lastval='';
} else if ((document.getElementById('bcommentary').value.trim() + ' ').substring(0,3) == '...') {
if (waspis.indexOf(lastval.trim()) == -1) {
prefixandon=String.fromCharCode(10) + lastval.trim().replace(/\.\.\.NoWayJosE$/g, ' ' + nl + ('' + (new Date())) + ' ... ') + waspis;
newwaspis=prefixandon;
}
}
if ((' ' + document.getElementById('bcommentary').value.trim()).slice(-3) == '...') {
document.getElementById('ifco').src='//www.rjmprogramming.com.au/ITblog/' + Math.min(550,window.innerWidth) + '/' + Math.min(350,window.innerHeight) + '/?uniquifier=' + encodeURIComponent(document.getElementById('uniquifier').value) + '&canvcont=' + encodeURIComponent(document.getElementById('bcommentary').value.trim().replace(/\.\.\.$/g, ' ' + nl + ('' + (new Date())) + ' ... ' + String.fromCharCode(10) + String.fromCharCode(10) + prefixandon));
} else {
document.getElementById('ifco').src='//www.rjmprogramming.com.au/ITblog/' + Math.min(550,window.innerWidth) + '/' + Math.min(350,window.innerHeight) + '/?uniquifier=' + encodeURIComponent(document.getElementById('uniquifier').value) + '&canvcont=' + encodeURIComponent(document.getElementById('bcommentary').value + String.fromCharCode(10) + String.fromCharCode(10) + prefixandon);
}
document.getElementById('bcommentary').title=document.getElementById('bcommentary').value;
if ((document.getElementById('bcommentary').value.trim() + ' ').substring(0,3) == '...') {
if (newwaspis != '') { waspis=newwaspis; }
if (waspis.indexOf(document.getElementById('bcommentary').value.trim()) == -1) {
prefixandon=String.fromCharCode(10) + document.getElementById('bcommentary').value.trim().replace(/\.\.\.$/g, ' ' + nl + ('' + (new Date())) + ' ... ') + waspis;
}
}
lastval=document.getElementById('bcommentary').value;
document.getElementById('bcommentary').value='';
setTimeout(function(){ document.getElementById('subcc').click(); }, 2000);
}
}
}

function newfunction() {
if (document.getElementById('bshare')) {
document.getElementById('sbshare').innerHTML='<iframe id=ifco style=display:none; src=></iframe><br><br><textarea rows=2 cols=80 id=bcommentary placeholder="Commentary to Viewers can go here ... start with or end with ... for ongoing ..." onblur="askaway(this);" value=""></textarea><br><br>';
}
}

latest draft image_venn.html Google Chart Image Chart Venn Chart or Scatter Chart or GraphViz Chart or Pie Chart or Line Chart or Bar Chart or Candlestick/Box Chart or Google-O-Meter Chart or Radar Chart or Map Chart interfacing web application you can also try below.


Previous relevant Google Chart Image Chart Radar Chart Tutorial is shown below.

Google Chart Image Chart Radar Chart Tutorial

Google Chart Image Chart Radar Chart Tutorial

Onto yesterday’s Google Chart Image Chart Box Chart Tutorial, today we have a two part stepping forward via new …

Why the trepidation? Well, so far, when the text is angled we can’t understand what results we are getting back from a call to [element].getBoundingClientRect() just yet.

Why is this needed? Again, with the questions! Well, Mr De Niro, you see, well, somebody might want to go onto that more complex annotating.

And why would they do that? Sheesh. Well, Mr De Niro, sir, you see, sometimes things happen in life, and well, fingers slip on keyboards, and mice get awfullllly nervous around screens these days.

Yeh, well, show us the money, wiseguy. Who’s is that question? And what’s with the questions? Well, you see, Mr De Niro, the money is if we can get PHP text placement for text at an angle, where it rotates from the middle of the text, to get a similar positioning to good ol’ … pardon, Mr De Niro … good and well respected Javascript transform rotations … not with a triple pike, Mr De Niro, but you’re awfulllllly close, Mr De Niro, sir … rather, we throw in a couple of translations … no, not Latin, Mr De Niro … of co-ordinates, Mr De Niro.

And that will bring in how much by next Tuesday? Back to the questions? Why so many questions? We think it’s a pretty big money spinner, Mr De Niro, sir, and we think you should come back next Tuesday, and we can show you the ropes. Sweat, oozing from the brow, as Mr De Niro exits stage left.

And just while we have a few minutes, here’s the updated Javascript parameterization …


var dtextis='dtext';
var pretherest='';
var newtherest='';
var tmod='';
var colchange='';
var cht=location.search.split('cht=')[1] ? decodeURIComponent(location.search.split('cht=')[1].split('&')[0]) : "v";
if ((cht + ' ').substring(0,1) == 'p' && cht != 'p') { pretherest=cht.substring(1); }
//if ((cht + ' ').substring(0,2) == 'bv' && cht != 'bv') { pretherest=cht.substring(2); if (1 == 1) { cht='bv'; } }
if ((cht + ' ').substring(0,1) == 'bv'.substring(0,1) && cht != 'bv'.substring(0,1)) { pretherest=cht.substring(1); if (1 == 1) { cht='bv'.substring(0,1); } }
if ((cht + ' ').substring(0,1) == 'l' && cht != 'l') { pretherest=cht.substring(1); if (1 == 1) { cht='l'; } }
if ((cht + ' ').substring(0,1) == 'r' && cht != 'r') { pretherest=cht.substring(1); if (1 == 1) { cht='r'; } }
var ccode=location.search.split('chld=')[1] ? decodeURIComponent(location.search.split('chld=')[1].split('&')[0]) : "";
var ctype=location.search.split('type=')[1] ? decodeURIComponent(location.search.split('type=')[1].split('&')[0]) : cht;
var cname=(ctype == 'v' ? 'Venn Chart' : (ctype == 's' ? 'Scatter Chart' : (ctype == 'gv' ? 'GraphViz Chart' :
(ctype.substring(0,1) == 'p' ? 'Pie Chart' :
((ctype + ' ').substring(0,2).substring(0,1) == 'bv'.substring(0,1) ? 'Bar Chart' : (ctype.substring(0,1) == 'l' ? 'Line Chart' :
(ctype == 'map' ? 'Map Chart' :
(ctype == 'gom' ? 'Google-O-Meter Chart' :
(ctype == 'r' ? 'Radar Chart' :
'')))))))));
var cencodename=(ctype == 'v' ? 'Venn%20Diagram' : (ctype == 's' ? 'Scatter%20Chart' : (ctype == 'gv' ? 'GraphViz%20Chart' :
(ctype.substring(0,1) == 'p' ? 'Pie%20Chart' :
((ctype + ' ').substring(0,2).substring(0,1) == 'bv'.substring(0,1) ? 'Bar%20Chart' : (ctype.substring(0,1) == 'l' ? 'Line%20Chart' :
(ctype == 'map' ? 'Map%20Chart' :
(ctype == 'gom' ? 'Google-O-Meter%20Chart' :
(ctype == 'r' ? 'Radar%20Chart' :
'')))))))));
var chdt=(ctype == 'v' ? '&chd=t:' : (ctype == 's' ? '&chd=t:' : (ctype == 'gv' ? '&chl=' :
(ctype.substring(0,1) == 'p' ? pretherest + '&chd=t:' :
((ctype + ' ').substring(0,2).substring(0,1) == 'bv'.substring(0,1) ? '&chd=t:' : (ctype.substring(0,1) == 'l' ? '&chd=t:' :
(ctype == 'map' ? '' :
(ctype == 'gom' ? '&chd=t:' :
(ctype == 'r' ? pretherest + '&chd=t:' :
'')))))))));
var chdeq=(ctype == 'v' ? '&chd=' : (ctype == 's' ? '&chd=' : (ctype == 'gv' ? '&chl=' :
(ctype.substring(0,1) == 'p' ? '&chd=' :
((ctype + ' ').substring(0,2).substring(0,1) == 'bv'.substring(0,1) ? '&chd=' : (ctype.substring(0,1) == 'l' ? '&chd=' :
(ctype == 'map' ? '&chld=' :
(ctype == 'gom' ? '&chld=' :
(ctype == 'r' ? '&chd=' :
'')))))))));
var tc=(ctype == 'v' ? 't:' : (ctype == 's' ? 't:' : (ctype == 'gv' ? '' :
(ctype.substring(0,1) == 'p' ? 't:' :
((ctype + ' ').substring(0,2).substring(0,1) == 'bv'.substring(0,1) ? 't:' : (ctype.substring(0,1) == 'l' ? 't:' :
(ctype == 'map' ? '' :
(ctype == 'gom' ? 't:' :
(ctype == 'r' ? 't:' :
'')))))))));
var chdl=(ctype == 'v' ? '&chdl=' : (ctype == 's' ? '&chdl=' : (ctype == 'gv' ? '' :
(ctype.substring(0,1) == 'p' ? '&chdl=' :
((ctype + ' ').substring(0,2).substring(0,1) == 'bv'.substring(0,1) ? '&chbh=' : (ctype.substring(0,1) == 'l' ? '&chbh=' :
(ctype == 'map' ? '' :
(ctype == 'gom' ? '&chdl=' :
(ctype == 'r' ? '&chxt=x&chxl=' :
'')))))))));

var prenchtt=(ctype == 'v' ? '100,80,60,30,30,30,10' : (ctype == 's' ? '12,87,75,41,23,96,68,71,34,9|98,60,27,34,56,79,58,74,18,76|84,23,69,81,47,94,60,93,64,54' : (ctype == 'gv' ? 'graph{C_0--H_0[type=s];C_0--H_1[type=s];C_0--H_2[type=s];C_0--C_1[type=s];C_1--H_3[type=s];C_1--H_4[type=s];C_1--H_5[type=s]}' :
(ctype.substring(0,1) == 'p' ? '1,2,3,4' :
((ctype + ' ').substring(0,2).substring(0,1) == 'bv'.substring(0,1) ? '5,5,5|10,10,10|15,15,15' : (ctype.substring(0,1) == 'l' ? '5,45,5|10,60,10|15,85,15' :
(ctype == 'map' ? '' :
(ctype == 'gom' ? '20,40,60' :
(ctype == 'r' ? '10,20,30,40,50' :
'')))))))));
var preachtt=(ctype == 'v' ? 'A|B|C' : (ctype == 's' ? 'Cats|Dogs' : (ctype == 'gv' ? '' :
(ctype.substring(0,1) == 'p' ? 'January|February|March|April' :
((ctype + ' ').substring(0,2).substring(0,1) == 'bv'.substring(0,1) ? '15,4,15' : (ctype.substring(0,1) == 'l' ? '15,4,15' :
(ctype == 'map' ? '' :
(ctype == 'gom' ? 'A|B|C' :
(ctype == 'r' ? '0:|1|2|3|4|5|6' :
'')))))))));
var defchco=(ctype == 'v' ? 'ff0000,00ff00,0000ff' : (ctype == 's' ? 'FF0000|0000FF&chxt=x,y' : (ctype == 'gv' ? '' :
(ctype.substring(0,1) == 'p' ? 'ff0000,00ff00,0000ff,ff00ff' :
((ctype + ' ').substring(0,2).substring(0,1) == 'bv'.substring(0,1) ? '4D89F9,C6D9FD,C6FDD9&chxt=x,y' : (ctype.substring(0,1) == 'l' ? '3D89F9.B6D9FD,B6FDD9&chxt=x,y' :
(ctype == 'map' ? '' :
(ctype == 'gom' ? 'ff0000,00ff00,0000ff' :
(ctype == 'r' ? 'FF0000,FF9900,ff0a00,00ffb0,000cff' :
'')))))))));

var prechtt=(ctype == 'v' ? chdt + prenchtt + chdl + preachtt : (ctype == 's' ? chdt + prenchtt + chdl + preachtt + '&chxt=x,y' : (ctype == 'gv' ? chdt + prenchtt :
(ctype.substring(0,1) == 'p' ? chdt + prenchtt + chdl + preachtt :
((ctype + ' ').substring(0,2).substring(0,1) == 'bv'.substring(0,1) ? chdt + prenchtt + chdl + preachtt : (ctype.substring(0,1) == 'l' ? chdt + prenchtt + chdl + preachtt :
(ctype == 'map' ? '' :
(ctype == 'gom' ? chdt + prenchtt + chdl + preachtt :
(ctype == 'r' ? chdt + prenchtt + chdl + preachtt :
'')))))))));
var promptone=(ctype == 'v' ? "Enter delimited values string for Venn Diagram such that ... " + String.fromCharCode(10) + "The first three values specify the sizes of three circles: A, B, & C. For chart with only two circles, specify zero for the third value." + String.fromCharCode(10) + "The fourth value specifies the size of the intersection of A and B." + String.fromCharCode(10) + "The fifth value specifies the size of the intersection of A and C. For a chart with only two circles, do not specify a value here." + String.fromCharCode(10) + "The sixth value specifies the size of the intersection of B and C. For a chart with only two circles, do not specify a value here." + String.fromCharCode(10) + "The seventh value specifies the size of the common intersection of A, B, and C. For a chart with only two circles, do not specify a value here." + String.fromCharCode(10) + String.fromCharCode(10) + "" : (ctype == 's' ? "Enter delimited values string for Scatter Chart" : (ctype == 'gv' ? "Enter delimited values string for GraphViz Chart" :
(ctype.substring(0,1) == 'p' ? "Enter delimited values string for Pie Chart" :
((ctype + ' ').substring(0,2).substring(0,1) == 'bv'.substring(0,1) ? "Enter v for Vertical or h for Horizontal then one of g for Group or s for Stacked or o for Overlapped Bar Chart look then a space and then enter delimited values string for Bar Chart. Here is a Candlestick and horizontal Bar Chart idea eg. hg 1:20,10,15,25,17,30|0,5,10,7,12,6|35,25,45,47,24,46|15,40,30,27,39,54|70,55,63,59,80,6 Here is a vertical Bar Chart and Box Chart idea vs 1:-1,5,10,7,12,-1|-1,25,30,27,24,-1|-1,40,45,47,39,-1|-1,55,63,59,80,-1|-1,30,40,35,30,-1|-1,-1,5,70,90,-1|-1,-1,-1,80,5,-1&chm=F,FF9900,0,1:4,40|H,0CBF0B,0,1:4,1:20|H,000000,4,1:4,1:40|H,0000FF,3,1:4,1:20|o,FF0000,5,-1,7|o,FF0000,6,-1,7 Prefix just the delimited string you enter by 1: to additionally display Candlestick/Box Charts or by 0: to only display Candlestick/Box Chart" :
(ctype.substring(0,1) == 'l' ? "Enter c for Even or s for Sparklines or xy for Just XY Line Chart look then a space and then enter delimited values string for Line Chart. Here is a Candlestick and Line Chart idea eg. c 1:20,10,15,25,17,30|0,5,10,7,12,6|35,25,45,47,24,46|15,40,30,27,39,54|70,55,63,59,80,6 Here is a Line Chart and Box Chart idea s 1:-1,5,10,7,12,-1|-1,25,30,27,24,-1|-1,40,45,47,39,-1|-1,55,63,59,80,-1|-1,30,40,35,30,-1|-1,-1,5,70,90,-1|-1,-1,-1,80,5,-1&chm=F,FF9900,0,1:4,40|H,0CBF0B,0,1:4,1:20|H,000000,4,1:4,1:40|H,0000FF,3,1:4,1:20|o,FF0000,5,-1,7|o,FF0000,6,-1,7 Prefix just the delimited string you enter by 1: to additionally display Candlestick/Box Charts or by 0: to only display Candlestick/Box Chart" :
(ctype == 'map' ? "" :
(ctype == 'gom' ? "Enter delimited values string for Google-O-Meter Chart" :
(ctype == 'r' ? "Enter delimited values string for Radar Chart but prefix with an s for smooth lines" :
"")))))))));
var oneprompt=(ctype == 'v' ? "Enter delimited values string for your Venn Diagram collaborations, optionally, such that ... " + String.fromCharCode(10) + "The first three values specify the sizes of three circles: A, B, & C. For chart with only two circles, specify zero for the third value." + String.fromCharCode(10) + "The fourth value specifies the size of the intersection of A and B." + String.fromCharCode(10) + "The fifth value specifies the size of the intersection of A and C. For a chart with only two circles, do not specify a value here." + String.fromCharCode(10) + "The sixth value specifies the size of the intersection of B and C. For a chart with only two circles, do not specify a value here." + String.fromCharCode(10) + "The seventh value specifies the size of the common intersection of A, B, and C. For a chart with only two circles, do not specify a value here." + String.fromCharCode(10) + String.fromCharCode(10) + "" : (ctype == 's' ? "Enter delimited values string for Scatter Chart" : (ctype == 'gv' ? "Enter delimited values string for GraphViz Chart" :
(ctype.substring(0,1) == 'p' ? "Enter delimited values string for Pie Chart" :
((ctype + ' ').substring(0,2).substring(0,1) == 'bv'.substring(0,1) ? "Enter g for Grouped or s for Stacked or o for Overlapped Bar Chart look then a space and then enter delimited values string for Bar Chart. Here is a Candlestick and Bar Chart idea eg. g 1:20,10,15,25,17,30|0,5,10,7,12,6|35,25,45,47,24,46|15,40,30,27,39,54|70,55,63,59,80,6 Here is a vertical Bar Chart and Box Chart idea vs 1:-1,5,10,7,12,-1|-1,25,30,27,24,-1|-1,40,45,47,39,-1|-1,55,63,59,80,-1|-1,30,40,35,30,-1|-1,-1,5,70,90,-1|-1,-1,-1,80,5,-1&chm=F,FF9900,0,1:4,40|H,0CBF0B,0,1:4,1:20|H,000000,4,1:4,1:40|H,0000FF,3,1:4,1:20|o,FF0000,5,-1,7|o,FF0000,6,-1,7 Prefix just the delimited string you enter by 1: to additionally display Candlestick/Box Charts or by 0: to only display Candlestick/Box Chart" :
(ctype.substring(0,1) == 'l' ? "Enter c for Even or s for Sparklines or xy for Just XY Line Chart look then a space and then enter delimited values string for Line Chart. Here is a Candlestick and Line Chart idea eg. c 1:20,10,15,25,17,30|0,5,10,7,12,6|35,25,45,47,24,46|15,40,30,27,39,54|70,55,63,59,80,6 Here is a Line Chart and Box Chart idea s 1:-1,5,10,7,12,-1|-1,25,30,27,24,-1|-1,40,45,47,39,-1|-1,55,63,59,80,-1|-1,30,40,35,30,-1|-1,-1,5,70,90,-1|-1,-1,-1,80,5,-1&chm=F,FF9900,0,1:4,40|H,0CBF0B,0,1:4,1:20|H,000000,4,1:4,1:40|H,0000FF,3,1:4,1:20|o,FF0000,5,-1,7|o,FF0000,6,-1,7 Prefix just the delimited string you enter by 1: to additionally display Candlestick/Box Charts or by 0: to only display Candlestick/Box Chart" :
(ctype == 'map' ? "" :
(ctype == 'gom' ? "Enter delimited values string for Google-O-Meter Chart" :
(ctype == 'r' ? "Enter delimited values string for Radar Chart but prefix with an s for smooth lines" :
"")))))))));
var asktwo=(ctype == 'v' ? true : (ctype == 's' ? true : (ctype == 'gv' ? false :
(ctype.substring(0,1) == 'p' ? true :
((ctype + ' ').substring(0,2).substring(0,1) == 'bv'.substring(0,1) ? true : (ctype.substring(0,1) == 'l' ? true :
(ctype == 'map' ? false :
(ctype == 'gom' ? true :
(ctype == 'r' ? true :
false)))))))));

var twopb=(ctype.substring(0,1) == 'p' ? 'Any optional legend or title argument snippets? Optionally prefix by 3 for 3d Pie Chart or by c for Concentric Pie Chart. Eg. 3' + chdl + preachtt + '&chtt=My%20' + cencodename + '&chco=' + defchco : 'Any optional legend or title argument snippets? Eg. ' + chdl + preachtt + '&chtt=My%20' + cencodename + '&chco=' + defchco);
var beforeanswer=(ctype.substring(0,1) == 'l' ? 'c ' : ((ctype + ' ').substring(0,2).substring(0,1) == 'bv'.substring(0,1) ? 'vg ' : ''));


var emsmlist='';

… that goes into helping make the changed latest draft image_venn.html Google Chart Image Chart Venn Chart or Scatter Chart or GraphViz Chart or Pie Chart or Line Chart or Bar Chart or Candlestick/Box Chart or Google-O-Meter Chart or Radar Chart or Map Chart interfacing web application you can also try below, have regular sleepovers on cloud nine.

Did you know?

Did you notice the inclusion of CSS styling …

<style>

#fsangle { background-image: url("data:image/svg+xml;utf8,<svg xmlns='http://www.w3.org/2000/svg' width='24' height='24' viewport='0 0 100 100' style='font-family:Verdana;font-size:10px;'><text y='50%'> \00B0</text></svg>"); background-repeat: no-repeat; background-position: center right; }

</style>

? It styles an input type=number textbox where a placeholder is not really an option to explain a textbox’s purpose, and we do dislike set aside labels, these days. It’s also a way to explain the textbox for mobile users who do not get a hovering message to help. It’s also got an internationalization feel to it, using the degree sign emoji ° (ie. &#176; or that \u0080 UTF-16 Encoding style of definition suitable for CSS styling usage) to both associate the units we’d want, as well as that we are asking for an angle. Clockwise or anticlockwise, alas, comes down to user experience!


Previous relevant Google Chart Image Chart Box Chart Tutorial is shown below.

Google Chart Image Chart Box Chart Tutorial

Google Chart Image Chart Box Chart Tutorial

Today we offer new …

… interfacings, onto the progress up to yesterday’s Google Chart Image Chart Colour Tutorial.

As such, it’s probably timely to update you with the parameterization up the top of the Javascript code …


var pretherest='';
var newtherest='';
var tmod='';
var colchange='';
var cht=location.search.split('cht=')[1] ? decodeURIComponent(location.search.split('cht=')[1].split('&')[0]) : "v";
if ((cht + ' ').substring(0,1) == 'p' && cht != 'p') { pretherest=cht.substring(1); }
//if ((cht + ' ').substring(0,2) == 'bv' && cht != 'bv') { pretherest=cht.substring(2); if (1 == 1) { cht='bv'; } }
if ((cht + ' ').substring(0,1) == 'bv'.substring(0,1) && cht != 'bv'.substring(0,1)) { pretherest=cht.substring(1); if (1 == 1) { cht='bv'.substring(0,1); } }
if ((cht + ' ').substring(0,1) == 'l' && cht != 'l') { pretherest=cht.substring(1); if (1 == 1) { cht='l'; } }
var ccode=location.search.split('chld=')[1] ? decodeURIComponent(location.search.split('chld=')[1].split('&')[0]) : "";
var ctype=location.search.split('type=')[1] ? decodeURIComponent(location.search.split('type=')[1].split('&')[0]) : cht;
var cname=(ctype == 'v' ? 'Venn Chart' : (ctype == 's' ? 'Scatter Chart' : (ctype == 'gv' ? 'GraphViz Chart' :
(ctype.substring(0,1) == 'p' ? 'Pie Chart' :
((ctype + ' ').substring(0,2).substring(0,1) == 'bv'.substring(0,1) ? 'Bar Chart' : (ctype.substring(0,1) == 'l' ? 'Line Chart' :
(ctype == 'map' ? 'Map Chart' :
(ctype == 'gom' ? 'Google-O-Meter Chart' :
''))))))));
var cencodename=(ctype == 'v' ? 'Venn%20Diagram' : (ctype == 's' ? 'Scatter%20Chart' : (ctype == 'gv' ? 'GraphViz%20Chart' :
(ctype.substring(0,1) == 'p' ? 'Pie%20Chart' :
((ctype + ' ').substring(0,2).substring(0,1) == 'bv'.substring(0,1) ? 'Bar%20Chart' : (ctype.substring(0,1) == 'l' ? 'Line%20Chart' :
(ctype == 'map' ? 'Map%20Chart' :
(ctype == 'gom' ? 'Google-O-Meter%20Chart' :
''))))))));
var chdt=(ctype == 'v' ? '&chd=t:' : (ctype == 's' ? '&chd=t:' : (ctype == 'gv' ? '&chl=' :
(ctype.substring(0,1) == 'p' ? pretherest + '&chd=t:' :
((ctype + ' ').substring(0,2).substring(0,1) == 'bv'.substring(0,1) ? '&chd=t:' : (ctype.substring(0,1) == 'l' ? '&chd=t:' :
(ctype == 'map' ? '' :
(ctype == 'gom' ? '&chd=t:' :
''))))))));
var chdeq=(ctype == 'v' ? '&chd=' : (ctype == 's' ? '&chd=' : (ctype == 'gv' ? '&chl=' :
(ctype.substring(0,1) == 'p' ? '&chd=' :
((ctype + ' ').substring(0,2).substring(0,1) == 'bv'.substring(0,1) ? '&chd=' : (ctype.substring(0,1) == 'l' ? '&chd=' :
(ctype == 'map' ? '&chld=' :
(ctype == 'gom' ? '&chdl=' :
''))))))));
var tc=(ctype == 'v' ? 't:' : (ctype == 's' ? 't:' : (ctype == 'gv' ? '' :
(ctype.substring(0,1) == 'p' ? 't:' :
((ctype + ' ').substring(0,2).substring(0,1) == 'bv'.substring(0,1) ? 't:' : (ctype.substring(0,1) == 'l' ? 't:' :
(ctype == 'map' ? '' :
(ctype == 'gom' ? 't:' :
''))))))));
var chdl=(ctype == 'v' ? '&chdl=' : (ctype == 's' ? '&chdl=' : (ctype == 'gv' ? '' :
(ctype.substring(0,1) == 'p' ? '&chdl=' :
((ctype + ' ').substring(0,2).substring(0,1) == 'bv'.substring(0,1) ? '&chbh=' : (ctype.substring(0,1) == 'l' ? '&chbh=' :
(ctype == 'map' ? '' :
(ctype == 'gom' ? '&chdl=' :
''))))))));

var prenchtt=(ctype == 'v' ? '100,80,60,30,30,30,10' : (ctype == 's' ? '12,87,75,41,23,96,68,71,34,9|98,60,27,34,56,79,58,74,18,76|84,23,69,81,47,94,60,93,64,54' : (ctype == 'gv' ? 'graph{C_0--H_0[type=s];C_0--H_1[type=s];C_0--H_2[type=s];C_0--C_1[type=s];C_1--H_3[type=s];C_1--H_4[type=s];C_1--H_5[type=s]}' :
(ctype.substring(0,1) == 'p' ? '1,2,3,4' :
((ctype + ' ').substring(0,2).substring(0,1) == 'bv'.substring(0,1) ? '5,5,5|10,10,10|15,15,15' : (ctype.substring(0,1) == 'l' ? '5,45,5|10,60,10|15,85,15' :
(ctype == 'map' ? '' :
(ctype == 'gom' ? '20,40,60' :
''))))))));
var preachtt=(ctype == 'v' ? 'A|B|C' : (ctype == 's' ? 'Cats|Dogs' : (ctype == 'gv' ? '' :
(ctype.substring(0,1) == 'p' ? 'January|February|March|April' :
((ctype + ' ').substring(0,2).substring(0,1) == 'bv'.substring(0,1) ? '15,4,15' : (ctype.substring(0,1) == 'l' ? '15,4,15' :
(ctype == 'map' ? '' :
(ctype == 'gom' ? 'A|B|C' :
''))))))));
var defchco=(ctype == 'v' ? 'ff0000,00ff00,0000ff' : (ctype == 's' ? 'FF0000|0000FF&chxt=x,y' : (ctype == 'gv' ? '' :
(ctype.substring(0,1) == 'p' ? 'ff0000,00ff00,0000ff,ff00ff' :
((ctype + ' ').substring(0,2).substring(0,1) == 'bv'.substring(0,1) ? '4D89F9,C6D9FD,C6FDD9&chxt=x,y' : (ctype.substring(0,1) == 'l' ? '3D89F9.B6D9FD,B6FDD9&chxt=x,y' :
(ctype == 'map' ? '' :
(ctype == 'gom' ? 'ff0000,00ff00,0000ff' :
''))))))));

var prechtt=(ctype == 'v' ? chdt + prenchtt + chdl + preachtt : (ctype == 's' ? chdt + prenchtt + chdl + preachtt + '&chxt=x,y' : (ctype == 'gv' ? chdt + prenchtt :
(ctype.substring(0,1) == 'p' ? chdt + prenchtt + chdl + preachtt :
((ctype + ' ').substring(0,2).substring(0,1) == 'bv'.substring(0,1) ? chdt + prenchtt + chdl + preachtt : (ctype.substring(0,1) == 'l' ? chdt + prenchtt + chdl + preachtt :
(ctype == 'map' ? '' :
(ctype == 'gom' ? chdt + prenchtt + chdl + preachtt :
''))))))));
var promptone=(ctype == 'v' ? "Enter delimited values string for Venn Diagram such that ... " + String.fromCharCode(10) + "The first three values specify the sizes of three circles: A, B, & C. For chart with only two circles, specify zero for the third value." + String.fromCharCode(10) + "The fourth value specifies the size of the intersection of A and B." + String.fromCharCode(10) + "The fifth value specifies the size of the intersection of A and C. For a chart with only two circles, do not specify a value here." + String.fromCharCode(10) + "The sixth value specifies the size of the intersection of B and C. For a chart with only two circles, do not specify a value here." + String.fromCharCode(10) + "The seventh value specifies the size of the common intersection of A, B, and C. For a chart with only two circles, do not specify a value here." + String.fromCharCode(10) + String.fromCharCode(10) + "" : (ctype == 's' ? "Enter delimited values string for Scatter Chart" : (ctype == 'gv' ? "Enter delimited values string for GraphViz Chart" :
(ctype.substring(0,1) == 'p' ? "Enter delimited values string for Pie Chart" :
((ctype + ' ').substring(0,2).substring(0,1) == 'bv'.substring(0,1) ? "Enter v for Vertical or h for Horizontal then one of g for Group or s for Stacked or o for Overlapped Bar Chart look then a space and then enter delimited values string for Bar Chart. Here is a Candlestick and horizontal Bar Chart idea eg. hg 1:20,10,15,25,17,30|0,5,10,7,12,6|35,25,45,47,24,46|15,40,30,27,39,54|70,55,63,59,80,6 Here is a vertical Bar Chart and Box Chart idea vs 1:-1,5,10,7,12,-1|-1,25,30,27,24,-1|-1,40,45,47,39,-1|-1,55,63,59,80,-1|-1,30,40,35,30,-1|-1,-1,5,70,90,-1|-1,-1,-1,80,5,-1&chm=F,FF9900,0,1:4,40|H,0CBF0B,0,1:4,1:20|H,000000,4,1:4,1:40|H,0000FF,3,1:4,1:20|o,FF0000,5,-1,7|o,FF0000,6,-1,7 Prefix just the delimited string you enter by 1: to additionally display Candlestick/Box Charts or by 0: to only display Candlestick/Box Chart" :
(ctype.substring(0,1) == 'l' ? "Enter c for Even or s for Sparklines or xy for Just XY Line Chart look then a space and then enter delimited values string for Line Chart. Here is a Candlestick and Line Chart idea eg. c 1:20,10,15,25,17,30|0,5,10,7,12,6|35,25,45,47,24,46|15,40,30,27,39,54|70,55,63,59,80,6 Here is a Line Chart and Box Chart idea s 1:-1,5,10,7,12,-1|-1,25,30,27,24,-1|-1,40,45,47,39,-1|-1,55,63,59,80,-1|-1,30,40,35,30,-1|-1,-1,5,70,90,-1|-1,-1,-1,80,5,-1&chm=F,FF9900,0,1:4,40|H,0CBF0B,0,1:4,1:20|H,000000,4,1:4,1:40|H,0000FF,3,1:4,1:20|o,FF0000,5,-1,7|o,FF0000,6,-1,7 Prefix just the delimited string you enter by 1: to additionally display Candlestick/Box Charts or by 0: to only display Candlestick/Box Chart" :
(ctype == 'map' ? "" :
(ctype == 'gom' ? "Enter delimited values string for Google-O-Meter Chart" :
""))))))));
var oneprompt=(ctype == 'v' ? "Enter delimited values string for your Venn Diagram collaborations, optionally, such that ... " + String.fromCharCode(10) + "The first three values specify the sizes of three circles: A, B, & C. For chart with only two circles, specify zero for the third value." + String.fromCharCode(10) + "The fourth value specifies the size of the intersection of A and B." + String.fromCharCode(10) + "The fifth value specifies the size of the intersection of A and C. For a chart with only two circles, do not specify a value here." + String.fromCharCode(10) + "The sixth value specifies the size of the intersection of B and C. For a chart with only two circles, do not specify a value here." + String.fromCharCode(10) + "The seventh value specifies the size of the common intersection of A, B, and C. For a chart with only two circles, do not specify a value here." + String.fromCharCode(10) + String.fromCharCode(10) + "" : (ctype == 's' ? "Enter delimited values string for Scatter Chart" : (ctype == 'gv' ? "Enter delimited values string for GraphViz Chart" :
(ctype.substring(0,1) == 'p' ? "Enter delimited values string for Pie Chart" :
((ctype + ' ').substring(0,2).substring(0,1) == 'bv'.substring(0,1) ? "Enter g for Grouped or s for Stacked or o for Overlapped Bar Chart look then a space and then enter delimited values string for Bar Chart. Here is a Candlestick and Bar Chart idea eg. g 1:20,10,15,25,17,30|0,5,10,7,12,6|35,25,45,47,24,46|15,40,30,27,39,54|70,55,63,59,80,6 Here is a vertical Bar Chart and Box Chart idea vs 1:-1,5,10,7,12,-1|-1,25,30,27,24,-1|-1,40,45,47,39,-1|-1,55,63,59,80,-1|-1,30,40,35,30,-1|-1,-1,5,70,90,-1|-1,-1,-1,80,5,-1&chm=F,FF9900,0,1:4,40|H,0CBF0B,0,1:4,1:20|H,000000,4,1:4,1:40|H,0000FF,3,1:4,1:20|o,FF0000,5,-1,7|o,FF0000,6,-1,7 Prefix just the delimited string you enter by 1: to additionally display Candlestick/Box Charts or by 0: to only display Candlestick/Box Chart" :
(ctype.substring(0,1) == 'l' ? "Enter c for Even or s for Sparklines or xy for Just XY Line Chart look then a space and then enter delimited values string for Line Chart. Here is a Candlestick and Line Chart idea eg. c 1:20,10,15,25,17,30|0,5,10,7,12,6|35,25,45,47,24,46|15,40,30,27,39,54|70,55,63,59,80,6 Here is a Line Chart and Box Chart idea s 1:-1,5,10,7,12,-1|-1,25,30,27,24,-1|-1,40,45,47,39,-1|-1,55,63,59,80,-1|-1,30,40,35,30,-1|-1,-1,5,70,90,-1|-1,-1,-1,80,5,-1&chm=F,FF9900,0,1:4,40|H,0CBF0B,0,1:4,1:20|H,000000,4,1:4,1:40|H,0000FF,3,1:4,1:20|o,FF0000,5,-1,7|o,FF0000,6,-1,7 Prefix just the delimited string you enter by 1: to additionally display Candlestick/Box Charts or by 0: to only display Candlestick/Box Chart" :
(ctype == 'map' ? "" :
(ctype == 'gom' ? "Enter delimited values string for Google-O-Meter Chart" :
""))))))));
var asktwo=(ctype == 'v' ? true : (ctype == 's' ? true : (ctype == 'gv' ? false :
(ctype.substring(0,1) == 'p' ? true :
((ctype + ' ').substring(0,2).substring(0,1) == 'bv'.substring(0,1) ? true : (ctype.substring(0,1) == 'l' ? true :
(ctype == 'map' ? false :
(ctype == 'gom' ? true :
false))))))));

var twopb=(ctype.substring(0,1) == 'p' ? 'Any optional legend or title argument snippets? Optionally prefix by 3 for 3d Pie Chart or by c for Concentric Pie Chart. Eg. 3' + chdl + preachtt + '&chtt=My%20' + cencodename + '&chco=' + defchco : 'Any optional legend or title argument snippets? Eg. ' + chdl + preachtt + '&chtt=My%20' + cencodename + '&chco=' + defchco);
var beforeanswer=(ctype.substring(0,1) == 'l' ? 'c ' : ((ctype + ' ').substring(0,2).substring(0,1) == 'bv'.substring(0,1) ? 'vg ' : ''));

var emsmlist='';

… that goes into helping make the changed latest draft image_venn.html Google Chart Image Chart Venn Chart or Scatter Chart or GraphViz Chart or Pie Chart or Line Chart or Bar Chart or Candlestick/Box Chart or Google-O-Meter Chart or Map Chart interfacing web application you can also try below, one of the happiest little vegemites we know.


Previous relevant Google Chart Image Chart Colour Tutorial is shown below.

Google Chart Image Chart Colour Tutorial

Google Chart Image Chart Colour Tutorial

Restricting you creatives to “inhouse annotations” of the “gray variety” might be seen as a bit boooorrrriiiinnnngggg! And so, onto the progress up to yesterday’s Google Chart Image Chart Rubber Banding Tutorial, today we’ve added a …

  • colour picker … way user can define an “inhouse annotations” colour … and while we were at it …
  • as far as text “inhouse annotations” go we’ve added a counterclockwise from the horizon, in degrees, way to define an angle the text should be placed at … and …
  • we’ve stopped closing off the text font size dropdown too early, allowing the user to mix it up with their annotations, and so …

    We now recommend, for those users pushing the boundaries of functionality, to gather all their “inhouse annotations” together before any “graphical canvas annotations” are thought about.

Which begs the question …

Where do you get it?

Well, here, via … dare we say it?! … … via …

Mantissa Madness Monday

Both colour and degree counterclockwise angle became “Mantissa Madness Monday” tragics, a bit like moi, really?

How did we express these two measures?

  • colour can be derived at the 404.php end via mantissae that are 9 or more long where a number of the form rrrgggbbb is numerical and passed across to 404.php in the y co-ordinate mantissa … while … kind of crazily …
  • angle can be a set of zeros in the x co-ordinate mantissa represented by zero characters to the length of the angle from 1 to 359 in front of a pre-existant font size (in px) usage, from last “Mantissa Madness Monday” (us getting away with this because no font size should start with a zero)

Oh! We have such fun around here?! Below is PHP WordPress blog 404.php code …

<?php

// text placement
$black = imagecolorallocatealpha($im, 1, 1, 1, 0);
$blackish = imagecolorallocatealpha($im, 127, 127, 127, 64);
$yis=$csv[1];
$mantissae=explode('.', ('' . $csv[1]));
if (sizeof($mantissae) > 1) {
if (strlen($mantissae[1]) >= 9) {
$black = imagecolorallocatealpha($im, intval(substr($mantissae[1],0,3)), intval(substr(substr($mantissae[1],3),0,3)), intval(substr(substr($mantissae[1],6),0,3)), 0);
$blackish = imagecolorallocatealpha($im, intval(substr($mantissae[1],0,3)), intval(substr(substr($mantissae[1],3),0,3)), intval(substr(substr($mantissae[1],6),0,3)), 64);
}
$yis=$mantissae[0];
}

$za=0;
$xis=$csv[0];

$mantissae=explode('.', ('' . $csv[0]));
if (sizeof($mantissae) > 1) {
if (substr($mantissae[1],0,1) == '0') {
if (str_replace('0','',$mantissae[1]) != '') {
while (substr($mantissae[1],0,1) == '0') {
$za++;
$mantiss=substr($mantissae[1],1);
$mantissae[1]=$mantiss;
}
}
}

$tenpx=$mantissae[1];
$xis=$mantissae[0];
}
try {
if (function_exists('imagettftext')) {
if (explode('' . $csv[0] . ',' . $csv[1] . ',', $plotstring)[1] !== '') {
//echo explode('' . $csv[0] . ',' . $csv[1] . ',', $plotstring)[1];
//exit;
imagettftext($im, $tenpx, $za, $xis, $yis, $black, realpath('arial.ttf'), explode('' . $csv[0] . ',' . $csv[1] . ',', $plotstring)[1]);
}
}
} catch (Exception $e) { }

?>

… used by our changed latest draft image_venn.html Google Chart Image Chart Venn Chart or Scatter Chart or GraphViz Chart or Pie Chart or Line Chart or Bar Chart or Candlestick Chart or Map Chart interfacing web application you can also try below.


Previous relevant Google Chart Image Chart Rubber Banding Tutorial is shown below.

Google Chart Image Chart Rubber Banding Tutorial

Google Chart Image Chart Rubber Banding Tutorial

The Javascript clientside idea of “Rubber Banding”

Rubber banding is a popular technique of drawing geometric primitives such as line, polylines, rectangle, circle and ellipse on the computer screen.

… really appeals to our “inner programmer” … damn! … come, thou, out into the open, reveal thyself! … the sunshine is wonderful down here, and we’ve done away with death duties! … mostly! but it is …

  • only really a non-mobile prospect …

    function checkforaction(rubberbanding,nx,ny) {
    var bcbit='background-color:rgba(127,127,127,0.5);';
    var zeroes='';
    var classbit='';
    var brbit='';
    var ourdist=0;
    var ioff=(rubberbanding == true ? 1 : 0);
    var mone=1;

    curno=eval('' + xneeds.length);
    if (eval(ioff + curno) >= needtohave) {
    if (!rubberbanding) {
    document.getElementById('fauxdtext').innerHTML='';
    }
    if (curmode == 8) {
    zeroes='00000000';
    classbit=' class="crerect" ';
    } else if (curmode == -5) {
    //alert(1);
    bcbit='border:2px solid rgba(127,127,127,0.5);';
    if (rubberbanding) {
    ourdist=eval(2.0 * Math.sqrt((nx - xneeds[0]) * (nx - xneeds[0]) + (ny - yneeds[0]) * (ny - yneeds[0])));
    ourdist-=10;
    bcbit='border:2px solid gray;background-color:transparent;';
    } else {
    ourdist=eval(2.0 * Math.sqrt((xneeds[1] - xneeds[0]) * (xneeds[1] - xneeds[0]) + (yneeds[1] - yneeds[0]) * (yneeds[1] - yneeds[0])));
    }
    //alert(ourdist);
    //xneeds[1]=Math.floor('' + ourdist);
    //yneeds[1]=xneeds[1];
    brbit='border-radius:' + Math.floor(eval(ourdist / 2)) + 'px;';
    zeroes='00000';
    classbit=' class="ocirc" ';
    //alert('open circle');
    } else if (curmode == 6) {
    if (rubberbanding) {
    ourdist=eval(2.0 * Math.sqrt((nx - xneeds[0]) * (nx - xneeds[0]) + (ny - yneeds[0]) * (ny - yneeds[0])));
    ourdist-=10;
    } else {
    ourdist=eval(2.0 * Math.sqrt((xneeds[1] - xneeds[0]) * (xneeds[1] - xneeds[0]) + (yneeds[1] - yneeds[0]) * (yneeds[1] - yneeds[0])));
    }
    //xneeds[1]=Math.floor('' + ourdist);
    //yneeds[1]=xneeds[1];
    brbit='border-radius:' + Math.floor(eval(ourdist / 2)) + 'px;';
    //bcbit='border:2px solid rgba(127,127,127,0.5);';
    zeroes='000000';
    classbit=' class="ccirc" ';
    //alert('closed circle ' + bcbit);
    } else if (curmode == -4) {
    if (rubberbanding) {
    mone=0.90;
    bcbit='border:2px solid gray;background-color:transparent;';
    } else {
    bcbit='border:2px solid rgba(127,127,127,0.5);';
    }
    zeroes='00';
    classbit=' class="orect" ';
    } else if (curmode == 2) {
    zeroes='0';
    if (rubberbanding) {
    if (Math.min(xneeds[0],nx) == xneeds[0] && Math.min(yneeds[0],ny) == ny) { // thanks to https://stackoverflow.com/questions/18012420/draw-diagonal-lines-in-div-background-with-css
    classbit=' class="crossedtotl" ';
    } else if (Math.min(xneeds[0],nx) == nx && Math.min(yneeds[0],ny) == yneeds[0]) { // thanks to https://stackoverflow.com/questions/18012420/draw-diagonal-lines-in-div-background-with-css
    classbit=' class="crossedtotl" ';
    } else {
    classbit=' class="crossedtotr" ';
    }
    } else {
    if (Math.min(xneeds[0],xneeds[1]) == xneeds[0] && Math.min(yneeds[0],yneeds[1]) == yneeds[1]) { // thanks to https://stackoverflow.com/questions/18012420/draw-diagonal-lines-in-div-background-with-css
    classbit=' class="crossedtotl" ';
    } else if (Math.min(xneeds[0],xneeds[1]) == xneeds[1] && Math.min(yneeds[0],yneeds[1]) == yneeds[0]) { // thanks to https://stackoverflow.com/questions/18012420/draw-diagonal-lines-in-div-background-with-css
    classbit=' class="crossedtotl" ';
    } else {
    classbit=' class="crossedtotr" ';
    }
    }
    bcbit='';
    } else if (curmode == 4) {
    if (rubberbanding) {
    mone=0.90;
    }
    zeroes='0000';
    classbit=' class="crect" ';
    }
    if (!rubberbanding) {
    curno=-1;
    //if (brbit != '') {
    //document.getElementById('dtext').innerHTML+='<div' + classbit + ' style="' + brbit + 'position:absolute;left:' + Math.min(xneeds[0],nx) + 'px;top:' + Math.min(yneeds[0],ny) + 'px;width:' + Math.abs(xneeds[0] - nx) + 'px;height:' + Math.abs(yneeds[0] - ny) + 'px;z-index:98;' + bcbit + '"></div>';
    //} else {
    //document.getElementById('dtext').innerHTML+='<div' + classbit + ' style="' + brbit + 'position:absolute;left:' + Math.min(xneeds[0],xneeds[1]) + 'px;top:' + Math.min(yneeds[0],yneeds[1]) + 'px;width:' + Math.abs(xneeds[0] - xneeds[1]) + 'px;height:' + Math.abs(yneeds[0] - yneeds[1]) + 'px;z-index:98;' + bcbit + '"></div>';
    //}
    document.getElementById('aemail').href+='&text' + textnum + '=' + encodeURIComponent('' + xneeds[0] + '.' + zeroes + xneeds[1] + ',' + yneeds[0] + '.' + yneeds[1] + ',') + '';
    document.getElementById('asms').href+='&text' + textnum + '=' + encodeURIComponent('' + xneeds[0] + '.' + zeroes + xneeds[1] + ',' + yneeds[0] + '.' + yneeds[1] + ',') + '';
    aemailurl+='&text' + textnum + '=' + encodeURIComponent('' + xneeds[0] + '.' + zeroes + xneeds[1] + ',' + yneeds[0] + '.' + yneeds[1] + ',') + '';
    asmsurl+='&text' + textnum + '=' + encodeURIComponent('' + xneeds[0] + '.' + zeroes + xneeds[1] + ',' + yneeds[0] + '.' + yneeds[1] + ',') + '';
    arest+='&text' + textnum + '=' + encodeURIComponent('' + xneeds[0] + '.' + zeroes + xneeds[1] + ',' + yneeds[0] + '.' + yneeds[1] + ',') + '';
    }
    if (brbit != '') {
    //alert('brbit=' + brbit);
    //xneeds[0]-=(xneeds[1] - xneeds[0]);
    //yneeds[0]-=(yneeds[1] - yneeds[0]);
    //alert('xneeds[0]=' + xneeds[0]);
    if (rubberbanding) {
    document.getElementById('fauxdtext').innerHTML='<div' + classbit + ' style="' + brbit + 'z-index:-89;position:absolute;left:' + Math.floor(eval(Math.min(xneeds[0],xneeds[0]) - ourdist / 2)) + 'px;top:' + Math.floor(eval(Math.min(yneeds[0],yneeds[0]) - ourdist / 2)) + 'px;width:' + ourdist + 'px;height:' + ourdist + 'px;z-index:98;' + bcbit + '"></div>';
    } else {
    document.getElementById('dtext').innerHTML+='<div' + classbit + ' style="' + brbit + 'position:absolute;left:' + Math.floor(eval(Math.min(xneeds[0],xneeds[0]) - ourdist / 2)) + 'px;top:' + Math.floor(eval(Math.min(yneeds[0],yneeds[0]) - ourdist / 2)) + 'px;width:' + ourdist + 'px;height:' + ourdist + 'px;z-index:98;' + bcbit + '"></div>';
    }
    } else {
    if (rubberbanding) {
    document.getElementById('fauxdtext').innerHTML='<div' + classbit + ' style="' + brbit + 'z-index:-89;position:absolute;left:' + Math.min(xneeds[0],nx) + 'px;top:' + Math.min(yneeds[0],ny) + 'px;width:' + Math.max(Math.floor(eval(-30 + Math.abs(xneeds[0] - nx))),Math.floor(eval(mone * Math.abs(xneeds[0] - nx)))) + 'px;height:' + Math.max(Math.floor(eval(-30 + Math.abs(yneeds[0] - ny))),Math.floor(eval(mone * Math.abs(yneeds[0] - ny)))) + 'px;z-index:98;' + bcbit + '"></div>';
    } else {
    document.getElementById('dtext').innerHTML+='<div' + classbit + ' style="' + brbit + 'position:absolute;left:' + Math.min(xneeds[0],xneeds[1]) + 'px;top:' + Math.min(yneeds[0],yneeds[1]) + 'px;width:' + Math.abs(xneeds[0] - xneeds[1]) + 'px;height:' + Math.abs(yneeds[0] - yneeds[1]) + 'px;z-index:98;' + bcbit + '"></div>';
    }
    }
    if (!rubberbanding) {
    textnum++;
    xneeds=[];
    yneeds=[];
    //alert('arest=' + arest);
    document.getElementById('tdright').innerHTML="  <span id=spemail><a target=_blank href='mailto:?subject=My%20" + cencodename + "%20...%20best%20viewed%20in%20landscape%20...&body=" + encodeURIComponent((document.getElementById('myvenn').src + arest).replace((document.getElementById('myvenn').src + arest).split('?')[0].split('#')[0], document.URL.split('?')[0].split('#')[0])) + "' id=aemail title=Email>&#128231;</a></span>      <span id=spsms><a target=_blank onmouseover=\"if (smsee.length == 0 && origsmsurl.indexOf('sms:&') != -1) { smsee=prompt('Please enter SMS number to send to.', ''); if (smsee == null) { smsee=''; } else { origsmsurl=origsmsurl.replace('sms:&','sms:' + smsee + '&'); asmsurl=asmsurl.replace('sms:&','sms:' + smsee + '&'); this.href=asmsurl; } }\" ontouchstart=\"if (smsee.length == 0 && origsmsurl.indexOf('sms:&') != -1) { smsee=prompt('Please enter SMS number to send to.', ''); if (smsee == null) { smsee=''; } else { origsmsurl=origsmsurl.replace('sms:&','sms:' + smsee + '&'); asmsurl=asmsurl.replace('sms:&','sms:' + smsee + '&'); this.href=asmsurl; } }\" href='sms:&body=" + encodeURIComponent((document.getElementById('myvenn').src + arest).replace(document.getElementById('myvenn').src.split('?')[0].split('#')[0], document.URL.split('?')[0].split('#')[0])) + "' id=asms title=SMS>&#128223;</a></span><br><br>  <input title=\"\" onclick=\"event.stopPropagation();\" id=ilp onblur=\"waitfortwo(0); lasttext=this.value.replace(/\~\~/g, '<br>'); this.title=lasttext; if (!navigator.userAgent.match(/Android|BlackBerry|iPhone|iPad|iPod|Opera Mini|IEMobile/i)) { this.value=''; } this.placeholder='Click where you want ... ' + lasttext.replace(/\<br\>/g, String.fromCharCode(10)); mvp.setAttribute('content','initial-scale=1'); document.getElementById('myvenn').scrollIntoView();\" placeholder='Enter text and later click place for it on " + decodeURIComponent(cencodename) + " to left (line feed is ~~)' type=text style=width:500px; value=''></input>" + fszbit + "<br><br>  <img id=line src='/MarkItUp/line.png' onclick=\"event.stopPropagation(); this.style.border='1px dotted red'; waitfortwo(2);\"></img>  <img id=rectangle src='/MarkItUp/rectangle.png' onclick=\"event.stopPropagation(); this.style.border='1px dotted red'; waitfortwo(4);\"></img>  <img id=orectangle src='/MarkItUp/orectangle.png' onclick=\"event.stopPropagation(); this.style.border='1px dotted red'; waitfortwo(-4);\"></img>  <img id=circle src='/MarkItUp/circlefill.png' onclick=\"event.stopPropagation(); this.style.border='1px dotted red'; waitfortwo(6);\"></img>  <img id=ocircle src='/MarkItUp/circle.png' onclick=\"event.stopPropagation(); this.style.border='1px dotted red'; waitfortwo(-5);\"></img>  <button id=orerect onclick=\"event.stopPropagation(); this.style.border='1px dotted red'; waitfortwo(8);\" title=\"Zoom in on rectangle you define via two clicks\" style=display:none;>&#128270;</button>" + lastbit + atend;
    //alert(1);
    if (!navigator.userAgent.match(/Android|BlackBerry|iPhone|iPad|iPod|Opera Mini|IEMobile/i)) { document.getElementById('ilp').focus(); }
    document.getElementById('ilp').placeholder='Enter text and later click place for it on ' + decodeURIComponent(cencodename) + ' to left (line feed is ~~)';
    }
    } else if (curmode == 2 && !rubberbanding) {
    document.getElementById('line').style.border='1px dashed yellow';
    } else if (curmode == -4 && !rubberbanding) {
    document.getElementById('orectangle').style.border='1px dashed yellow';
    } else if (curmode == 4 && !rubberbanding) {
    document.getElementById('rectangle').style.border='1px dashed yellow';
    } else if (curmode == -5 && !rubberbanding) {
    document.getElementById('ocircle').style.border='1px dashed yellow';
    } else if (curmode == 6 && !rubberbanding) {
    document.getElementById('circle').style.border='1px dashed yellow';
    } else if (curmode == 8 && !rubberbanding) {
    document.getElementById('orerect').style.border='1px dashed yellow';
    }
    }

    // Rubber banding
    document.body.addEventListener('mousemove', function(evt){
    evt = evt || window.event;

    evt.preventDefault();

    elemLeft = document.getElementById('myvenn').offsetLeft;
    elemTop = document.getElementById('myvenn').offsetTop;

    //document.getElementById('myh3').innerHTML+=' ' + elemLeft + ':' + elemTop;
    //document.getElementById('myh3').innerHTML+=' ' + document.body.scrollLeft + '.' + document.body.scrollTop;

    if (evt.touches) {
    if (evt.touches[0].pageX) {
    //alert('here');
    xx = evt.touches[0].pageX + document.body.scrollLeft - elemLeft;
    yy = evt.touches[0].pageY + document.body.scrollTop - elemTop;
    if (xx >= 0 && xx <= eval(('' + document.getElementById('myvenn').width).replace('px','')) && yy >= 0 && yy <= eval(('' + document.getElementById('myvenn').height).replace('px',''))) {
    if (curno == 1 && (lastx != xx || lasty != yy)) {
    checkforaction(true,xx,yy);
    }
    //lastx=xx;
    //lasty=yy;
    //alert('x:' + x + ' and y:' + y);
    }
    } else {
    //alert('Here');
    xx = evt.touches[0].clientX + document.body.scrollLeft - elemLeft;
    yy = evt.touches[0].clientY + document.body.scrollTop - elemTop;
    if (xx >= 0 && xx <= eval(('' + document.getElementById('myvenn').width).replace('px','')) && yy >= 0 && yy <= eval(('' + document.getElementById('myvenn').height).replace('px',''))) {
    if (curno == 1 && (lastx != xx || lasty != yy)) {
    checkforaction(true,xx,yy);
    }
    //lastx=xx;
    //lasty=yy;
    //alert('x:' + x + ' and y:' + y);
    }
    }
    } else if (evt.clientX || ev.clientY) {
    //alert('HERE');
    xx = evt.clientX + document.body.scrollLeft - elemLeft;
    yy = evt.clientY + document.body.scrollTop - elemTop;
    if (xx >= 0 && xx <= eval(('' + document.getElementById('myvenn').width).replace('px','')) && yy >= 0 && yy <= eval(('' + document.getElementById('myvenn').height).replace('px',''))) {
    if (curno == 1 && (lastx != xx || lasty != yy)) {
    checkforaction(true,xx,yy);
    }
    //lastx=xx;
    //lasty=yy;
    }
    } else {
    //alert('HEre');
    xx = evt.pageX + document.body.scrollLeft - elemLeft;
    yy = evt.pageY + document.body.scrollTop - elemTop;
    if (xx >= 0 && xx <= eval(('' + document.getElementById('myvenn').width).replace('px','')) && yy >= 0 && yy <= eval(('' + document.getElementById('myvenn').height).replace('px',''))) {
    if (curno == 1 && (lastx != xx || lasty != yy)) {
    checkforaction(true,xx,yy);
    }
    //lastx=xx;
    //lasty=yy;
    }
    }
    });

    … at least for us (being as we do not want to clobber any pinch or spread gesture ideas, for the user)
  • is only a really, “nice to have” functionality idea

Even so, achieving even a 95% percent working “rubber band” is like … is like …

Barracking for Hairtie United …
You little beauty, Untied!

And so, further to yesterday’s Google Chart Image Chart Circle Annotation Tutorial we have this non-mobile “Rubber Banding” inhouse annotation functionality included in our changed latest draft image_venn.html Google Chart Image Chart Venn Chart or Scatter Chart or GraphViz Chart or Pie Chart or Line Chart or Bar Chart or Candlestick Chart or Map Chart interfacing web application you can also try below.

But there’s more! Despite how long out of the day it takes to barrack for Hairtie United, there was a mobile matter we resolved. A slide in today’s animated GIF presentation shows the issue. On mobile platforms, with these inhouse annotations, it would immediately show a tiny annotation. There panned out to be two event programming related issues we needed to fix related to this problem …

  1. change looking for a “touchstart” event, and instead look for a “touchdown” event for a document.body scope (else we might have restricted the “scope” to just document.getEleementById(‘myvenn’) as another approach (and you should note our event.stopPropagation() statements in lots of places as another research point for you)) because we are talking “discrete click” user behaviour we are targeting … as well as …
  2. start checking that the co-ordinates calculated fall into the range of the Google Charts Image Chart image dimensions … doh!


document.body.addEventListener('touchdown', function(evt){
//alert(8);
evt = evt || window.event;

evt.preventDefault();

elemLeft = document.getElementById('myvenn').offsetLeft;
elemTop = document.getElementById('myvenn').offsetTop;

//document.getElementById('myh3').innerHTML+=' ' + elemLeft + ';' + elemTop;

if (evt.touches) {
if (evt.touches[0].pageX) {
//alert('here');
x = evt.touches[0].pageX + document.body.scrollLeft - elemLeft;
y = evt.touches[0].pageY + document.body.scrollTop - elemTop;
if (x >= 0 && x <= eval(('' + document.getElementById('myvenn').width).replace('px','')) && y >= 0 && y <= eval(('' + document.getElementById('myvenn').height).replace('px',''))) {
if (curno >= 0 && (lastx != x || lasty != y)) {
xneeds.push(x);
yneeds.push(y);
checkforaction(false,-1,-1);
}
lastx=x;
lasty=y;
}
//alert('x:' + x + ' and y:' + y);
} else {
//alert('Here');
x = evt.touches[0].clientX + document.body.scrollLeft - elemLeft;
y = evt.touches[0].clientY + document.body.scrollTop - elemTop;
if (x >= 0 && x <= eval(('' + document.getElementById('myvenn').width).replace('px','')) && y >= 0 && y <= eval(('' + document.getElementById('myvenn').height).replace('px',''))) {
if (curno >= 0 && (lastx != x || lasty != y)) {
xneeds.push(x);
yneeds.push(y);
checkforaction(false,-1,-1);
}
lastx=x;
lasty=y;
}
//alert('x:' + x + ' and y:' + y);
}
} else if (evt.clientX || ev.clientY) {
//alert('HERE');
x = evt.clientX + document.body.scrollLeft - elemLeft;
y = evt.clientY + document.body.scrollTop - elemTop;
if (x >= 0 && x <= eval(('' + document.getElementById('myvenn').width).replace('px','')) && y >= 0 && y <= eval(('' + document.getElementById('myvenn').height).replace('px',''))) {
if (curno >= 0 && (lastx != x || lasty != y)) {
xneeds.push(x);
yneeds.push(y);
checkforaction(false,-1,-1);
}
lastx=x;
lasty=y;
}
} else {
//alert('HEre');
x = evt.pageX + document.body.scrollLeft - elemLeft;
y = evt.pageY + document.body.scrollTop - elemTop;
if (x >= 0 && x <= eval(('' + document.getElementById('myvenn').width).replace('px','')) && y >= 0 && y <= eval(('' + document.getElementById('myvenn').height).replace('px',''))) {
if (curno >= 0 && (lastx != x || lasty != y)) {
xneeds.push(x);
yneeds.push(y);
checkforaction(false,-1,-1);
}
lastx=x;
lasty=y;
}
}
});

Did you know?

Well … we didn’t?! We happened to try the web application above on a tiny iPad and saw that HTML button elements with an innerHTML label containing a line feed ( ie. <br> ) only showed the top line, and, alas, for that button in question, the vital new information used to be on the second line. Hence our fix …


//document.getElementById('bshare').innerHTML='Repainting Top Left Image Periodically ... <br>Click here to Broadcast this session to other interested parties ...';
document.getElementById('bshare').innerHTML='Click here to Broadcast this session to other interested parties ...<br>Repainting Top Left Image Periodically ...';


Previous relevant Google Chart Image Chart Circle Annotation Tutorial is shown below.

Google Chart Image Chart Circle Annotation Tutorial

Google Chart Image Chart Circle Annotation Tutorial

Today, we add …

  • open circle
  • filled circle

… annotation possibilities onto the “Broadcast Talk” work in yesterday’s Google Chart Image Chart Broadcast Talk Context Tutorial.

The CSS border-radius property has come to the rescue of many a programmer, saving us from resorting to SVG to display circle or ellipses or arcs of various sorts …


function checkforaction() {
var bcbit='background-color:rgba(127,127,127,0.5);';
var zeroes='';
var classbit='';
var brbit='';
var ourdist=0;


curno=eval('' + xneeds.length);
if (curno >= needtohave) {
if (curmode == 8) {
zeroes='00000000';
classbit=' class="crerect" ';
} else if (curmode == -5) {
//alert(1);
ourdist=eval(2.0 * Math.sqrt((xneeds[1] - xneeds[0]) * (xneeds[1] - xneeds[0]) + (yneeds[1] - yneeds[0]) * (yneeds[1] - yneeds[0])));
//alert(ourdist);
//xneeds[1]=Math.floor('' + ourdist);
//yneeds[1]=xneeds[1];
brbit='border-radius:' + Math.floor(eval(ourdist / 2)) + 'px;';
bcbit='border:2px solid rgba(127,127,127,0.5);';
zeroes='00000';
classbit=' class="ocirc" ';
//alert('open circle');
} else if (curmode == 6) {
ourdist=eval(2.0 * Math.sqrt((xneeds[1] - xneeds[0]) * (xneeds[1] - xneeds[0]) + (yneeds[1] - yneeds[0]) * (yneeds[1] - yneeds[0])));
//xneeds[1]=Math.floor('' + ourdist);
//yneeds[1]=xneeds[1];
brbit='border-radius:' + Math.floor(eval(ourdist / 2)) + 'px;';
//bcbit='border:2px solid rgba(127,127,127,0.5);';
zeroes='000000';
classbit=' class="ccirc" ';
//alert('closed circle ' + bcbit);
}
else if (curmode == -4) {
bcbit='border:2px solid rgba(127,127,127,0.5);';
zeroes='00';
classbit=' class="orect" ';
} else if (curmode == 2) {
zeroes='0';
if (Math.min(xneeds[0],xneeds[1]) == xneeds[0] && Math.min(yneeds[0],yneeds[1]) == yneeds[1]) { // thanks to https://stackoverflow.com/questions/18012420/draw-diagonal-lines-in-div-background-with-css
classbit=' class="crossedtotl" ';
} else if (Math.min(xneeds[0],xneeds[1]) == xneeds[1] && Math.min(yneeds[0],yneeds[1]) == yneeds[0]) { // thanks to https://stackoverflow.com/questions/18012420/draw-diagonal-lines-in-div-background-with-css
classbit=' class="crossedtotl" ';
} else {
classbit=' class="crossedtotr" ';
}
bcbit='';
} else if (curmode == 4) {
zeroes='0000';
classbit=' class="crect" ';
}
curno=-1;
//if (brbit != '') {
//document.getElementById('dtext').innerHTML+='<div' + classbit + ' style="' + brbit + 'position:absolute;left:' + Math.min(xneeds[0],xneeds[1]) + 'px;top:' + Math.min(yneeds[0],yneeds[1]) + 'px;width:' + Math.abs(xneeds[0] - xneeds[1]) + 'px;height:' + Math.abs(yneeds[0] - yneeds[1]) + 'px;z-index:98;' + bcbit + '"></div>';
//} else {
//document.getElementById('dtext').innerHTML+='<div' + classbit + ' style="' + brbit + 'position:absolute;left:' + Math.min(xneeds[0],xneeds[1]) + 'px;top:' + Math.min(yneeds[0],yneeds[1]) + 'px;width:' + Math.abs(xneeds[0] - xneeds[1]) + 'px;height:' + Math.abs(yneeds[0] - yneeds[1]) + 'px;z-index:98;' + bcbit + '"></div>';
//}
document.getElementById('aemail').href+='&text' + textnum + '=' + encodeURIComponent('' + xneeds[0] + '.' + zeroes + xneeds[1] + ',' + yneeds[0] + '.' + yneeds[1] + ',') + '';
document.getElementById('asms').href+='&text' + textnum + '=' + encodeURIComponent('' + xneeds[0] + '.' + zeroes + xneeds[1] + ',' + yneeds[0] + '.' + yneeds[1] + ',') + '';
aemailurl+='&text' + textnum + '=' + encodeURIComponent('' + xneeds[0] + '.' + zeroes + xneeds[1] + ',' + yneeds[0] + '.' + yneeds[1] + ',') + '';
asmsurl+='&text' + textnum + '=' + encodeURIComponent('' + xneeds[0] + '.' + zeroes + xneeds[1] + ',' + yneeds[0] + '.' + yneeds[1] + ',') + '';
arest+='&text' + textnum + '=' + encodeURIComponent('' + xneeds[0] + '.' + zeroes + xneeds[1] + ',' + yneeds[0] + '.' + yneeds[1] + ',') + '';
if (brbit != '') {
//alert('brbit=' + brbit);
//xneeds[0]-=(xneeds[1] - xneeds[0]);
//yneeds[0]-=(yneeds[1] - yneeds[0]);
//alert('xneeds[0]=' + xneeds[0]);
document.getElementById('dtext').innerHTML+='<div' + classbit + ' style="' + brbit + 'position:absolute;left:' + Math.floor(eval(Math.min(xneeds[0],xneeds[0]) - ourdist / 2)) + 'px;top:' + Math.floor(eval(Math.min(yneeds[0],yneeds[0]) - ourdist / 2)) + 'px;width:' + ourdist + 'px;height:' + ourdist + 'px;z-index:98;' + bcbit + '"></div>';
} else {

document.getElementById('dtext').innerHTML+='<div' + classbit + ' style="' + brbit + 'position:absolute;left:' + Math.min(xneeds[0],xneeds[1]) + 'px;top:' + Math.min(yneeds[0],yneeds[1]) + 'px;width:' + Math.abs(xneeds[0] - xneeds[1]) + 'px;height:' + Math.abs(yneeds[0] - yneeds[1]) + 'px;z-index:98;' + bcbit + '"></div>';
}
textnum++;
xneeds=[];
yneeds=[];
//alert('arest=' + arest);
document.getElementById('tdright').innerHTML="  <span id=spemail><a target=_blank href='mailto:?subject=My%20" + cencodename + "%20...%20best%20viewed%20in%20landscape%20...&body=" + encodeURIComponent((document.getElementById('myvenn').src + arest).replace((document.getElementById('myvenn').src + arest).split('?')[0].split('#')[0], document.URL.split('?')[0].split('#')[0])) + "' id=aemail title=Email>&#128231;</a></span>      <span id=spsms><a target=_blank onmouseover=\"if (smsee.length == 0 && origsmsurl.indexOf('sms:&') != -1) { smsee=prompt('Please enter SMS number to send to.', ''); if (smsee == null) { smsee=''; } else { origsmsurl=origsmsurl.replace('sms:&','sms:' + smsee + '&'); asmsurl=asmsurl.replace('sms:&','sms:' + smsee + '&'); this.href=asmsurl; } }\" ontouchstart=\"if (smsee.length == 0 && origsmsurl.indexOf('sms:&') != -1) { smsee=prompt('Please enter SMS number to send to.', ''); if (smsee == null) { smsee=''; } else { origsmsurl=origsmsurl.replace('sms:&','sms:' + smsee + '&'); asmsurl=asmsurl.replace('sms:&','sms:' + smsee + '&'); this.href=asmsurl; } }\" href='sms:&body=" + encodeURIComponent((document.getElementById('myvenn').src + arest).replace(document.getElementById('myvenn').src.split('?')[0].split('#')[0], document.URL.split('?')[0].split('#')[0])) + "' id=asms title=SMS>&#128223;</a></span><br><br>  <input title=\"\" onclick=\"event.stopPropagation();\" id=ilp onblur=\"waitfortwo(0); lasttext=this.value.replace(/\~\~/g, '<br>'); this.title=lasttext; if (!navigator.userAgent.match(/Android|BlackBerry|iPhone|iPad|iPod|Opera Mini|IEMobile/i)) { this.value=''; } this.placeholder='Click where you want ... ' + lasttext.replace(/\<br\>/g, String.fromCharCode(10)); mvp.setAttribute('content','initial-scale=1'); document.getElementById('myvenn').scrollIntoView();\" placeholder='Enter text and later click place for it on " + decodeURIComponent(cencodename) + " to left (line feed is ~~)' type=text style=width:500px; value=''></input>" + fszbit + "<br><br>  <img id=line src='/MarkItUp/line.png' onclick=\"event.stopPropagation(); this.style.border='1px dotted red'; waitfortwo(2);\"></img>  <img id=rectangle src='/MarkItUp/rectangle.png' onclick=\"event.stopPropagation(); this.style.border='1px dotted red'; waitfortwo(4);\"></img>  <img id=orectangle src='/MarkItUp/orectangle.png' onclick=\"event.stopPropagation(); this.style.border='1px dotted red'; waitfortwo(-4);\"></img>  <img id=circle src='/MarkItUp/circlefill.png' onclick=\"event.stopPropagation(); this.style.border='1px dotted red'; waitfortwo(6);\"></img>  <img id=ocircle src='/MarkItUp/circle.png' onclick=\"event.stopPropagation(); this.style.border='1px dotted red'; waitfortwo(-5);\"></img>  <button id=orerect onclick=\"event.stopPropagation(); this.style.border='1px dotted red'; waitfortwo(8);\" title=\"Zoom in on rectangle you define via two clicks\" style=display:none;>&#128270;</button>" + lastbit + atend;
//alert(1);
if (!navigator.userAgent.match(/Android|BlackBerry|iPhone|iPad|iPod|Opera Mini|IEMobile/i)) { document.getElementById('ilp').focus(); }
document.getElementById('ilp').placeholder='Enter text and later click place for it on ' + decodeURIComponent(cencodename) + ' to left (line feed is ~~)';
} else if (curmode == 2) {
document.getElementById('line').style.border='1px dashed yellow';
} else if (curmode == -4) {
document.getElementById('orectangle').style.border='1px dashed yellow';
} else if (curmode == 4) {
document.getElementById('rectangle').style.border='1px dashed yellow';
} else if (curmode == -5) {
document.getElementById('ocircle').style.border='1px dashed yellow';
} else if (curmode == 6) {
document.getElementById('circle').style.border='1px dashed yellow';
} else if (curmode == 8) {
document.getElementById('orerect').style.border='1px dashed yellow';
}
}

… to team up with WordPress blog 404.php changes …

<?php

if (strlen($zeroesbit) == 6) { // filled in circle
if (sizeof($csv) == 3) {
array_push($csv, $csv[2]);
} else if (sizeof($csv) >= 4) {
$dist=(2.0 * sqrt(($csv[0] - $csv[2]) * ($csv[0] - $csv[2]) + ($csv[1] - $csv[3]) * ($csv[1] - $csv[3])));
$csv[2]=$dist;
$csv[3]=$dist;
}
imagefilledellipse($im, $csv[0], $csv[1], $csv[2], $csv[3], $blackish);
} else if (strlen($zeroesbit) == 5) { // circle
if (sizeof($csv) == 3) {
array_push($csv, $csv[2]);
} else if (sizeof($csv) >= 4) {
$dist=(2.0 * sqrt(($csv[0] - $csv[2]) * ($csv[0] - $csv[2]) + ($csv[1] - $csv[3]) * ($csv[1] - $csv[3])));
$csv[2]=$dist;
$csv[3]=$dist;
}
imageellipse($im, $csv[0], $csv[1], $csv[2], $csv[3], $black);
}

?>

… with our changed ninth draft image_venn.html Google Chart Image Chart Venn Chart or Scatter Chart or GraphViz Chart or Pie Chart or Line Chart or Bar Chart or Candlestick Chart or Map Chart interfacing web application you can also try below.


Previous relevant Google Chart Image Chart Broadcast Talk Context Tutorial is shown below.

Google Chart Image Chart Broadcast Talk Context Tutorial

Google Chart Image Chart Broadcast Talk Context Tutorial

The progress, today, along the same lines as yesterday’s Google Chart Image Chart Broadcast Talk Tutorial‘s introduction of a “Broadcast Talk” functionality, was to …

  • improve “Broadcast Talk” context, by adding onto yesterday’s …

    presented as an update image still presented and updated periodically

    … only display option, with, as of today …

  • a presenter’s first snapshotted image retained for user display (in case they arrive late to the lesson … tutt tutt) … and …
  • ImageMagick created animated GIF with slides for just this first image and the most recent image, updated periodically, in bottom right cell of user display …
    <?php

    if (isset($_POST['canvcont']) && isset($_POST['uniquifier']) && strpos(('?' . $_SERVER['QUERY_STRING']), 'cht=') === false) {
    if (isset($_POST['uniquifier'])) {
    $uniquifier=str_replace('+',' ',urldecode($_POST['uniquifier']));
    }
    if ($uniquifier == '') {
    $uniquifier='_' . rand(0,78654356);
    file_put_contents($_SERVER['DOCUMENT_ROOT'] . DIRECTORY_SEPARATOR . "presentation" . $uniquifier . ".png", base64_decode( explode('base64,', str_replace(' ','+',urldecode($_POST['canvcont'])))[1]));
    exec("/usr/local/cpanel/3rdparty/bin/convert -delay 20 -loop 0 " . $_SERVER['DOCUMENT_ROOT'] . DIRECTORY_SEPARATOR . "presentation" . $uniquifier . ".png" . " " . $_SERVER['DOCUMENT_ROOT'] . DIRECTORY_SEPARATOR . "presentation" . $uniquifier . ".gif");
    echo "<html><body onload=\"if (parent.document.getElementById('uniquifier')) { if (parent.document.getElementById('uniquifier').value == '') { parent.document.getElementById('uniquifier').value='" . $uniquifier . "'; } }\"></body></html>";
    } else {
    file_put_contents($_SERVER['DOCUMENT_ROOT'] . DIRECTORY_SEPARATOR . "presentation" . $uniquifier . ".png", base64_decode( explode('base64,', str_replace(' ','+',urldecode($_POST['canvcont'])))[1]));
    exec("rm -f " . $_SERVER['DOCUMENT_ROOT'] . DIRECTORY_SEPARATOR . "presentation" . $uniquifier . ".gif ; /usr/local/cpanel/3rdparty/bin/convert -delay 200 -loop 0 " . $_SERVER['DOCUMENT_ROOT'] . DIRECTORY_SEPARATOR . "presentation_" . $uniquifier . ".png " . $_SERVER['DOCUMENT_ROOT'] . DIRECTORY_SEPARATOR . "presentation" . $uniquifier . ".png" . " " . $_SERVER['DOCUMENT_ROOT'] . DIRECTORY_SEPARATOR . "presentation" . $uniquifier . ".gif");
    }
    exit;
    }

    ?>
    … and …
  • images saved as changes are detected gathered, as ever smaller thumbnails, in the top right of four table cells of the user display …

    var iijk=0, uniquif=''; snapshots=[], elem=null, elemcontext=null, oimg=null, checkforsquare=2;

    function canvinit() {
    var kkii=0, wpx=0, hpx=0;
    var tdr=document.getElementById('tdtr').getBoundingClientRect();
    wpx=eval('' + tdr.width);
    hpx=eval('' + tdr.height);
    elem=document.getElementById('agcanvas');
    elemcontext=elem.getContext('2d');
    elem.width=elem.width;
    elemcontext.drawImage(document.getElementById('talkimg'),0,0);
    if (iijk == 0 || ('' + document.getElementById('tdtr').style.backgroundImage).indexOf('rand=0') != -1) {
    //alert('89 ' + elem.toDataURL().length);
    //snapshots.push(elem.toDataURL());
    iijk=eval(-1 + eval('' + ('' + document.getElementById('tdtr').style.backgroundImage).split('),').length));
    document.getElementById('tdtr').style.backgroundImage=('' + document.getElementById('tdtr').style.backgroundImage).replace(('' + document.getElementById('tdtr').style.backgroundImage).split('),')[iijk], '' + 'url(' + elem.toDataURL() + '),' + ('' + document.getElementById('tdtr').style.backgroundImage).split('),')[iijk]).replace('rand=0', 'rand=x');
    iijk=eval(0 + eval('' + ('' + document.getElementById('tdtr').style.backgroundImage).split('),').length));
    setInterval(canvinit, 9000);
    } else {
    elem.width=elem.width;
    elemcontext.drawImage(document.getElementById('talkimg'),0,0);
    if (document.body.innerHTML.indexOf(elem.toDataURL()) == -1) {
    //snapshots.push(elem.toDataURL());
    iijk=eval(-1 + eval('' + ('' + document.getElementById('tdtr').style.backgroundImage).split('),').length));
    document.getElementById('tdtr').style.backgroundImage=('' + document.getElementById('tdtr').style.backgroundImage).replace(('' + document.getElementById('tdtr').style.backgroundImage).split('),')[iijk], '' + 'url(' + elem.toDataURL() + '),' + ('' + document.getElementById('tdtr').style.backgroundImage).split('),')[iijk]).replace('rand=x','rand=x' + Math.floor(Math.random() * 9));
    iijk=eval(0 + eval('' + ('' + document.getElementById('tdtr').style.backgroundImage).split('),').length));
    }
    }
    var bpx='background-position:;';
    var bbpx='background-position:;';
    var bsx='background-size:;';
    var brx='background-repeat:;';
    var xstart=0;
    var ystart=0;
    var xxstart=eval('' + tdr.left);
    var yystart=eval('' + tdr.top);
    if (iijk > eval(checkforsquare * checkforsquare)) { checkforsquare++; }
    for (kkii=1; kkii<=iijk; kkii++) {
    if (bsx.indexOf(':;') != -1) {
    bsx=bsx.replace(':;', ':' + Math.round(eval(wpx / checkforsquare)) + 'px ' + Math.round(eval(hpx /checkforsquare)) + 'px;');
    brx=brx.replace(':;', ':no-repeat;');
    bpx=bpx.replace(':;', ':' + Math.round(xstart) + 'px ' + Math.round(ystart) + 'px;');
    bbpx=bbpx.replace(':;', ':' + Math.round(xxstart) + 'px ' + Math.round(yystart) + 'px;');
    } else {
    bsx=bsx.replace(';', ',' + Math.round(eval(wpx / checkforsquare)) + 'px ' + Math.round(eval(hpx /checkforsquare)) + 'px;');
    brx=brx.replace(';', ',no-repeat;');
    bpx=bpx.replace(';', ',' + Math.round(xstart) + 'px ' + Math.round(ystart) + 'px;');
    bbpx=bbpx.replace(';', ',' + Math.round(xxstart) + 'px ' + Math.round(yystart) + 'px;');
    }
    if (eval(kkii % checkforsquare) == 0) {
    xstart=0;
    xxstart=eval('' + tdr.left);
    ystart+=eval(hpx / checkforsquare);
    yystart+=eval(hpx / checkforsquare);
    } else {
    xstart+=eval(wpx / checkforsquare);
    xxstart+=eval(wpx / checkforsquare);
    }
    }
    //alert('iijk=' + iijk + ' ' + bbpx + ' ' + bpx + ' ' + bsx + ' ' + brx);
    document.getElementById('tdtr').style.backgroundRepeat=brx.split(':')[1];
    document.getElementById('tdtr').style.backgroundSize=bsx.split(':')[1];
    document.getElementById('tdtr').style.backgroundPosition=bpx.split(':')[1];
    //document.body.style.backgroundImage=('' + document.getElementById('tdtr').style.backgroundImage);
    //document.body.style.backgroundRepeat=brx.split(':')[1];
    //document.body.style.backgroundSize=bsx.split(':')[1];

    document.body.style.backgroundPosition=bbpx.split(':')[1];
    var kdss=bsx.split(':')[1].replace(/\;/g,'').split(',');
    var idss=bbpx.split(':')[1].replace(/\;/g,'').split(',');
    var jdss=(('' + document.getElementById('tdtr').style.backgroundImage) + ',').replace(';,',',').replace(/url\(/g,'').replace(/URL\(/g,'').replace(/\"\;/g,'').replace(/\"/g,'').split('),');
    document.getElementById('idiv').innerHTML='';
    var istuff='', laststuff='';
    for (var iop=0; iop<idss.length; iop++) {
    //while (istuff == laststuff) {
    if (('' + jdss[iop]) != 'undefined' && ('' + jdss[iop]).trim() != '') {
    if (jdss[iop].trim().indexOf('iVBOR') != -1) {
    istuff+='<img style="position:absolute;width:' + kdss[iop].split(' ')[0] + ';height:' + kdss[iop].split(' ')[1] + ';left:' + idss[iop].split(' ')[0] + ';top:' + idss[iop].split(' ')[1] + ';" src="data:image/png;base64,iVBOR' + jdss[iop].trim().split('iVBOR')[1] + '"></img>';
    } else if (jdss[iop].trim() .indexOf('//') != -1) {
    istuff+='<img style="position:absolute;width:' + kdss[iop].split(' ')[0] + ';height:' + kdss[iop].split(' ')[1] + ';left:' + idss[iop].split(' ')[0] + ';top:' + idss[iop].split(' ')[1] + ';" src="' + jdss[iop].trim() + '"></img>';
    }
    //}
    laststuff=istuff;
    }
    }
    document.getElementById('idiv').innerHTML=istuff;
    }

We hope you try new functionality in our changed eighth draft image_venn.html Google Chart Image Chart Venn Chart or Scatter Chart or GraphViz Chart or Pie Chart or Line Chart or Bar Chart or Candlestick Chart or Map Chart interfacing web application you can also try below.


Previous relevant Google Chart Image Chart Broadcast Talk Tutorial is shown below.

Google Chart Image Chart Broadcast Talk Tutorial

Google Chart Image Chart Broadcast Talk Tutorial

Onto yesterday’s Google Chart Image Chart Statistical Charts Tutorial progress we want to offer …

  • once a user has that “More Annotation” annotating happening … offer the chance to …
  • Broadcast … their work as it happens, dynamically …
  • to an emailee list audience

… and we’re calling this …

Broadcast Talk

… even though it is only visual by nature, presented as an update image still presented and updated periodically. Go figure?! We’re blaming that supper time two back. We’re not sure?!

Anyway, we hope you try out the new arrangements in our changed seventh draft image_venn.html Google Chart Image Chart Venn Chart or Scatter Chart or GraphViz Chart or Pie Chart or Line Chart or Bar Chart or Candlestick Chart or Map Chart interfacing web application you can also try below, and helped out by a WordPress blog good ol’ TwentyTen theme 404.php which now includes …

<?php

if (isset($_POST['canvcont']) && isset($_POST['uniquifier']) && strpos(('?' . $_SERVER['QUERY_STRING']), 'cht=') === false) {
if (isset($_POST['uniquifier'])) {
$uniquifier=str_replace('+',' ',urldecode($_POST['uniquifier']));
}
if ($uniquifier == '') {
$uniquifier='_' . rand(0,78654356);
file_put_contents($_SERVER['DOCUMENT_ROOT'] . DIRECTORY_SEPARATOR . "presentation" . $uniquifier . ".png", base64_decode( explode('base64,', str_replace(' ','+',urldecode($_POST['canvcont'])))[1]));
echo "<html><body onload=\"if (parent.document.getElementById('uniquifier')) { if (parent.document.getElementById('uniquifier').value == '') { parent.document.getElementById('uniquifier').value='" . $uniquifier . "'; } }\"></body></html>";
} else {
file_put_contents($_SERVER['DOCUMENT_ROOT'] . DIRECTORY_SEPARATOR . "presentation" . $uniquifier . ".png", base64_decode( explode('base64,', str_replace(' ','+',urldecode($_POST['canvcont'])))[1]));
}
exit;
}

?>

… featuring our first use of this 404.php in response to a method=POST form call. Verrrrrryyyy interesting!


Previous relevant Google Chart Image Chart Statistical Charts Tutorial is shown below.

Google Chart Image Chart Statistical Charts Tutorial

Google Chart Image Chart Statistical Charts Tutorial

Further to yesterday’s Google Chart Image Chart Pie Chart Tutorial, today, we embark on our first ventures into composite charts, along what we like to think of as “statistical lines”, regarding interfacing to Google Charts Image Chart

… the latter being like a “parasite” display idea off the more conventional Statistical Graph favourites, the Line Chart and Bar Chart, where you have a relationship between a numerical concept (eg. sales) and another type of concept (eg. month of the year), and you want to present the data in a graphical form.

Again, we haven’t stopped our “retweaking”. We might “retweak” in the morning or we might “retweak” over a coffee break or we might “retweak” at supper time, but the end result is, well, you’re reading it now!


var pretherest='';
var newtherest='';
var tmod='';
var cht=location.search.split('cht=')[1] ? decodeURIComponent(location.search.split('cht=')[1].split('&')[0]) : "v";
if ((cht + ' ').substring(0,1) == 'p' && cht != 'p') { pretherest=cht.substring(1); }
if ((cht + ' ').substring(0,2) == 'bv' && cht != 'bv') { pretherest=cht.substring(2); if (1 == 1) { cht='bv'; } }
if ((cht + ' ').substring(0,1) == 'l' && cht != 'l') { pretherest=cht.substring(1); if (1 == 1) { cht='l'; } }
var ctype=location.search.split('type=')[1] ? decodeURIComponent(location.search.split('type=')[1].split('&')[0]) : cht;
var cname=(ctype == 'v' ? 'Venn Chart' : (ctype == 's' ? 'Scatter Chart' : (ctype == 'gv' ? 'GraphViz Chart' :
(ctype.substring(0,1) == 'p' ? 'Pie Chart' :
((ctype + ' ').substring(0,2) == 'bv' ? 'Bar Chart' : (ctype.substring(0,1) == 'l' ? 'Line Chart' : ''))))));
var cencodename=(ctype == 'v' ? 'Venn%20Diagram' : (ctype == 's' ? 'Scatter%20Chart' : (ctype == 'gv' ? 'GraphViz%20Chart' :
(ctype.substring(0,1) == 'p' ? 'Pie%20Chart' :
((ctype + ' ').substring(0,2) == 'bv' ? 'Bar%20Chart' : (ctype.substring(0,1) == 'l' ? 'Line%20Chart' : ''))))));
var chdt=(ctype == 'v' ? '&chd=t:' : (ctype == 's' ? '&chd=t:' : (ctype == 'gv' ? '&chl=' :
(ctype.substring(0,1) == 'p' ? pretherest + '&chd=t:' :
((ctype + ' ').substring(0,2) == 'bv' ? '&chd=t:' : (ctype.substring(0,1) == 'l' ? '&chd=t:' : ''))))));
var chdeq=(ctype == 'v' ? '&chd=' : (ctype == 's' ? '&chd=' : (ctype == 'gv' ? '&chl=' :
(ctype.substring(0,1) == 'p' ? '&chd=' :
((ctype + ' ').substring(0,2) == 'bv' ? '&chd=' : (ctype.substring(0,1) == 'l' ? '&chd=' : ''))))));
var tc=(ctype == 'v' ? 't:' : (ctype == 's' ? 't:' : (ctype == 'gv' ? '' :
(ctype.substring(0,1) == 'p' ? 't:' :
((ctype + ' ').substring(0,2) == 'bv' ? 't:' : (ctype.substring(0,1) == 'l' ? 't:' : ''))))));
var chdl=(ctype == 'v' ? '&chdl=' : (ctype == 's' ? '&chdl=' : (ctype == 'gv' ? '' :
(ctype.substring(0,1) == 'p' ? '&chdl=' :
((ctype + ' ').substring(0,2) == 'bv' ? '&chbh=' : (ctype.substring(0,1) == 'l' ? '&chbh=' : ''))))));

var prenchtt=(ctype == 'v' ? '100,80,60,30,30,30,10' : (ctype == 's' ? '12,87,75,41,23,96,68,71,34,9|98,60,27,34,56,79,58,74,18,76|84,23,69,81,47,94,60,93,64,54' : (ctype == 'gv' ? 'graph{C_0--H_0[type=s];C_0--H_1[type=s];C_0--H_2[type=s];C_0--C_1[type=s];C_1--H_3[type=s];C_1--H_4[type=s];C_1--H_5[type=s]}' :
(ctype.substring(0,1) == 'p' ? '1,2,3,4' :
((ctype + ' ').substring(0,2) == 'bv' ? '5,5,5|10,10,10|15,15,15' : (ctype.substring(0,1) == 'l' ? '5,45,5|10,60,10|15,85,15' : ''))))));
var preachtt=(ctype == 'v' ? 'A|B|C' : (ctype == 's' ? 'Cats|Dogs' : (ctype == 'gv' ? '' :
(ctype.substring(0,1) == 'p' ? 'January|February|March|April' :
((ctype + ' ').substring(0,2) == 'bv' ? '15,4,15' : (ctype.substring(0,1) == 'l' ? '15,4,15' : ''))))));
var defchco=(ctype == 'v' ? 'ff0000,00ff00,0000ff' : (ctype == 's' ? 'FF0000|0000FF&chxt=x,y' : (ctype == 'gv' ? '' :
(ctype.substring(0,1) == 'p' ? 'ff0000,00ff00,0000ff,ff00ff' :
((ctype + ' ').substring(0,2) == 'bv' ? '4D89F9,C6D9FD,C6FDD9&chxt=x,y' : (ctype.substring(0,1) == 'l' ? '3D89F9.B6D9FD,B6FDD9&chxt=x,y' : ''))))));

var prechtt=(ctype == 'v' ? chdt + prenchtt + chdl + preachtt : (ctype == 's' ? chdt + prenchtt + chdl + preachtt + '&chxt=x,y' : (ctype == 'gv' ? chdt + prenchtt :
(ctype.substring(0,1) == 'p' ? chdt + prenchtt + chdl + preachtt :
((ctype + ' ').substring(0,2) == 'bv' ? chdt + prenchtt + chdl + preachtt : (ctype.substring(0,1) == 'l' ? chdt + prenchtt + chdl + preachtt : ''))))));
var promptone=(ctype == 'v' ? "Enter delimited values string for Venn Diagram such that ... " + String.fromCharCode(10) + "The first three values specify the sizes of three circles: A, B, & C. For chart with only two circles, specify zero for the third value." + String.fromCharCode(10) + "The fourth value specifies the size of the intersection of A and B." + String.fromCharCode(10) + "The fifth value specifies the size of the intersection of A and C. For a chart with only two circles, do not specify a value here." + String.fromCharCode(10) + "The sixth value specifies the size of the intersection of B and C. For a chart with only two circles, do not specify a value here." + String.fromCharCode(10) + "The seventh value specifies the size of the common intersection of A, B, and C. For a chart with only two circles, do not specify a value here." + String.fromCharCode(10) + String.fromCharCode(10) + "" : (ctype == 's' ? "Enter delimited values string for Scatter Chart" : (ctype == 'gv' ? "Enter delimited values string for GraphViz Chart" :
(ctype.substring(0,1) == 'p' ? "Enter delimited values string for Pie Chart" :
((ctype + ' ').substring(0,2) == 'bv' ? "Enter g for Group or s for Stacked or o for Overlapped Bar Chart look then a space and then enter delimited values string for Bar Chart. Here is a Candlestick and Bar Chart idea eg. g 1:20,10,15,25,17,30|0,5,10,7,12,6|35,25,45,47,24,46|15,40,30,27,39,54|70,55,63,59,80,6 Prefix just the delimited string you enter by 1: to additionally display Candlestick Charts or by 0: to only display Candlestick Chart" :
(ctype.substring(0,1) == 'l' ? "Enter c for Even or s for Sparklines or xy for Just XY Line Chart look then a space and then enter delimited values string for Line Chart. Here is a Candlestick and Line Chart idea eg. c 1:20,10,15,25,17,30|0,5,10,7,12,6|35,25,45,47,24,46|15,40,30,27,39,54|70,55,63,59,80,6 Prefix just the delimited string you enter by 1: to additionally display Candlestick Charts or by 0: to only display Candlestick Chart" : ""))))));
var oneprompt=(ctype == 'v' ? "Enter delimited values string for your Venn Diagram collaborations, optionally, such that ... " + String.fromCharCode(10) + "The first three values specify the sizes of three circles: A, B, & C. For chart with only two circles, specify zero for the third value." + String.fromCharCode(10) + "The fourth value specifies the size of the intersection of A and B." + String.fromCharCode(10) + "The fifth value specifies the size of the intersection of A and C. For a chart with only two circles, do not specify a value here." + String.fromCharCode(10) + "The sixth value specifies the size of the intersection of B and C. For a chart with only two circles, do not specify a value here." + String.fromCharCode(10) + "The seventh value specifies the size of the common intersection of A, B, and C. For a chart with only two circles, do not specify a value here." + String.fromCharCode(10) + String.fromCharCode(10) + "" : (ctype == 's' ? "Enter delimited values string for Scatter Chart" : (ctype == 'gv' ? "Enter delimited values string for GraphViz Chart" :
(ctype.substring(0,1) == 'p' ? "Enter delimited values string for Pie Chart" :
((ctype + ' ').substring(0,2) == 'bv' ? "Enter g for Grouped or s for Stacked or o for Overlapped Bar Chart look then a space and then enter delimited values string for Bar Chart. Here is a Candlestick and Bar Chart idea eg. g 1:20,10,15,25,17,30|0,5,10,7,12,6|35,25,45,47,24,46|15,40,30,27,39,54|70,55,63,59,80,6 Prefix just the delimited string you enter by 1: to additionally display Candlestick Charts or by 0: to only display Candlestick Chart" :
(ctype.substring(0,1) == 'l' ? "Enter c for Even or s for Sparklines or xy for Just XY Line Chart look then a space and then enter delimited values string for Line Chart. Here is a Candlestick and Line Chart idea eg. c 1:20,10,15,25,17,30|0,5,10,7,12,6|35,25,45,47,24,46|15,40,30,27,39,54|70,55,63,59,80,6 Prefix just the delimited string you enter by 1: to additionally display Candlestick Charts or by 0: to only display Candlestick Chart" : ""))))));
var asktwo=(ctype == 'v' ? true : (ctype == 's' ? true : (ctype == 'gv' ? false :
(ctype.substring(0,1) == 'p' ? true :
((ctype + ' ').substring(0,2) == 'bv' ? true : (ctype.substring(0,1) == 'l' ? true : false))))));
var twopb=(ce.substring(0,1) == 'p' ? 'Any optional legend or title argument snippets? Optionally prefix by 3 for 3d Pie Chart or by c for Concentric Pie Chart. Eg. 3' + chdl + preachtt + '&chtt=My%20' + cencodename + '&chco=' + defchco : 'Any optional legend or title argument snippets? Eg. ' + chdl + preachtt + '&chtt=My%20' + cencodename + '&chco=' + defchco);
var beforeanswer=(ctype.substring(0,1) == 'l' ? 'c ' : ((ctype + ' ').substring(0,2) == 'bv' ? 'g ' : ''));

if ((document.URL.toLowerCase().indexOf('chd=t%3a') == -1 && document.URL.toLowerCase().indexOf('chd=t:') == -1) && document.URL.toLowerCase().indexOf('chd=t') != -1 && document.URL.toLowerCase().indexOf('%3a') != -1) {
tmod=document.URL.toLowerCase().split('chd=t')[1].split('%3')[0];
//tc='t' + tmod + ':';
//chdt=chdt.replace('t:', 't' + tmod + ':');
//answer=answer.trim().replace(tmod + ':','');
//therest+='&chm=F,,1,1:4,20';
} else if ((document.URL.toLowerCase().indexOf('chd=t%3a') == -1 && document.URL.toLowerCase().indexOf('chd=t:') == -1) && document.URL.toLowerCase().indexOf('chd=t') != -1 && document.URL.toLowerCase().substring(8).indexOf(':') != -1) {
tmod=document.URL.toLowerCase().split('chd=t')[1].split(':')[0];
//tc='t' + tmod + ':';
//chdt=chdt.replace('t:', 't' + tmod + ':');
//answer=answer.trim().replace(tmod + ':','');
//therest+='&chm=F,,1,1:4,20';
}

var atend="<canvas id=sharecanvas style=display:none;></canvas><div style=display:none;><label for='shareurl'><input type=button onclick='downloadmaybe(); shareurl();' id='sbut' value='Share URL Link'></input>: </label><input onblur=changeu(this.value); title='Suffix by hashtag 1 is text and hashtag 2 is title' style='width:45%;' type=url value='' placeholder='https://www.rjmprogramming.com.au/ITblog/#RJM Programming Blog#IT Blog' id=shareurl ondblclick='this.value=trythis(this.placeholder);'></input><br><br><span> ... and/or ... </span><br><br><label for='files'><input type=button onclick=document.getElementById('share').click(); value='Share media or document files'></input>: </label><input id='files' type='file' accept='image/*,video/*,audio/*,application/*,text/*' multiple></div><br><br><button id='share' type='button'>Share your media or documents or link!</button><output id='output'></output><scr" + "ipt type='text/javascript' src='/web_share_api_test.js?canv" + "asshare=as_necessary9867654' defer></scr" + "ipt>";
atend='';

var vals=[], annowin=null;


var lastbit="<br><br><br><br>  <button title='Other complex canvas annotation functionalities (forgoes the simpler ones above) ...' id=annobut onclick=\"document.getElementById('tdleft').style.verticalAlign='top'; setTimeout(prerepaint, 12000); if (arest.length != 0) { alert('arest=' + arest); if (document.getElementById('myvenn').src.indexOf(arest) == -1) { pdivhide(); document.getElementById('myvenn').src=document.getElementById('myvenn').src.split(arest.substring(0,5))[0] + arest; document.getElementById('tdleft').style.verticalAlign='top'; } } annowin=window.open('/HTMLCSS/user_of_signature_signature.htm?elemode=img','_blank','top=420,left=620,width=900,height=420'); \" style=\"background-color:yellow;\">More Annotations</button>  <button id=bshare onclick=repaint(); style=display:none;>Repaint <font size=1>(but lose sharing emojis above)</font></button><br><div id=divcanvas style=display:none;><canvas id=bottomcanvas></canvas></div>";
var fszbit='  <span id=spanfsz><select id=fsz onchange="fsz=this.value;"><option value=".10">10px</option><option value=".6">6px</option><option value=".8">8px</option><option value=".9">9px</option><option value=".11">11px</option><option value=".12">12px</option><option value=".14">14px</option><option value=".16">16px</option><option value=".18">18px</option><option value=".20">20px</option><option value=".24">24px</option><option value=".30">30px</option><option value=".36">36px</option><option value=".40">40px</option><option value=".48">48px</option><option value=".50">50px</option><option value=".64">64px</option></select></span>';
var origemailurl='mailto:?subject=My%20' + cencodename + '%20...%20best%20viewed%20in%20landscape%20...&body=';
var origsmsurl='sms:&body=My%20' + cencodename + '%20...%20best%20viewed%20in%20landscape%20...';
var smsee='';
var chd=location.search.split(chdeq)[1] ? (tc + dectypodeURIComponent(location.search.split(chdeq)[1].split('&')[0])).replace('t:t:', 't:').replace(/^t\:$/g, '') : "";
var therest=location.search.split(chdeq)[1] ? (pretherest + document.URL.split(document.URL.split('#')[0].split(chdeq)[1].split('&')[0])[1].split('#')[0]) : "";
newtherest=((ctype + ' ').substring(0,2) == 'bv' ? therest : '');

And yes, you can, and we did, put line feeds into those ternery statements to help with their readability as we add complexity to the parameterization, as we go along, in our changed sixth draft image_venn.html Google Chart Image Chart Venn Chart or Scatter Chart or GraphViz Chart or Pie Chart or Line Chart or Bar Chart or Candlestick Chart interfacing web application you can also try below.


Previous relevant Google Chart Image Chart Pie Chart Tutorial is shown below.

Google Chart Image Chart Pie Chart Tutorial

Google Chart Image Chart Pie Chart Tutorial

As we intimated in yesterday’s Google Chart Image Chart GraphViz Chart Tutorial

start with an at least two part “inhouse phase” of additional “extra to text” annotation functionality possibilities …

… we would return! And so, here thou lingers. It’s “part two” day, even bigger than “Ben Hur” in certain outback towns we’re a little bit shy to divulge until we get to know our readers that little bit better.

Yes, we are dovetailing with work we’ve done in the past using the excellent …

  • canvas … element introduced with HTML5 … whereby …
  • annotations like …
    1. scribble … as the default, and various other …
    2. discrete click shapes … and …
    3. text … including emojis … and …
    4. image

    … annotating modus operandi

… can be part of the arrangements. It works that the Annotation Helper is opened …

  • in a new “known about” popup window … looking out for …
  • parent based “img” element (in the modus operandi we use, calling it, regarding the parent top left image) … so as to be able to …
  • populate its canvas element with a clone of that calling “img” graphical content … but add into the mix …
  • menu driven annotation functionality which can change that canvas look and underlying data … and …
  • the caller can keep track of this and arrange, or not, for these changes to be reflected back at its top left “img” element … the catch being …
  • the “within range of GET argument” limits are ruined by this introduction of graphical data, and so in agreeing to this, a user forgoes those simpler sharing and annotating functionalities of yesterday’s (and before) work … though your normal image sharing capabilities via the web browser remain in the caller and the called

As well, today, we are introducing new Google Charts Image Chart Pie Chart interfacing, and because this chart type can have the three …

  • Normal
  • 3D
  • Concentric

… guises, there was some work to keep us off this street (okay … so we divulgedagain)


var pretherest='';
var cht=location.search.split('cht=')[1] ? decodeURIComponent(location.search.split('cht=')[1].split('&')[0]) : "v";
if ((cht + ' ').substring(0,1) == 'p' && cht != 'p') { pretherest=cht.substring(1); }
var ctype=location.search.split('type=')[1] ? decodeURIComponent(location.search.split('type=')[1].split('&')[0]) : cht;
var cname=(ctype == 'v' ? 'Venn Chart' : (ctype == 's' ? 'Scatter Chart' : (ctype == 'gv' ? 'GraphViz Chart' : (ctype.substring(0,1) == 'p' ? 'Pie Chart' : ''))));
var cencodename=(ctype == 'v' ? 'Venn%20Diagram' : (ctype == 's' ? 'Scatter%20Chart' : (ctype == 'gv' ? 'GraphViz%20Chart' : (ctype.substring(0,1) == 'p' ? 'Pie%20Chart' : ''))));
var chdt=(ctype == 'v' ? '&chd=t:' : (ctype == 's' ? '&chd=t:' : (ctype == 'gv' ? '&chl=' : (ctype.substring(0,1) == 'p' ? pretherest + '&chd=t:' : ''))));
var chdeq=(ctype == 'v' ? '&chd=' : (ctype == 's' ? '&chd=' : (ctype == 'gv' ? '&chl=' : (ctype.substring(0,1) == 'p' ? '&chd=' : ''))));
var tc=(ctype == 'v' ? 't:' : (ctype == 's' ? 't:' : (ctype == 'gv' ? '' : (ctype.substring(0,1) == 'p' ? 't:' : ''))));
var chdl=(ctype == 'v' ? '&chdl=' : (ctype == 's' ? '&chdl=' : (ctype == 'gv' ? '' : (ctype.substring(0,1) == 'p' ? '&chdl=' : ''))));
var prenchtt=(ctype == 'v' ? '100,80,60,30,30,30,10' : (ctype == 's' ? '12,87,75,41,23,96,68,71,34,9|98,60,27,34,56,79,58,74,18,76|84,23,69,81,47,94,60,93,64,54' : (ctype == 'gv' ? 'graph{C_0--H_0[type=s];C_0--H_1[type=s];C_0--H_2[type=s];C_0--C_1[type=s];C_1--H_3[type=s];C_1--H_4[type=s];C_1--H_5[type=s]}' : (ctype.substring(0,1) == 'p' ? '1,2,3,4' : ''))));
var preachtt=(ctype == 'v' ? 'A|B|C' : (ctype == 's' ? 'Cats|Dogs' : (ctype == 'gv' ? '' : (ctype.substring(0,1) == 'p' ? 'January|February|March|April' : ''))));
var prechtt=(ctype == 'v' ? chdt + prenchtt + chdl + preachtt : (ctype == 's' ? chdt + prenchtt + chdl + preachtt + '&chxt=x,y' : (ctype == 'gv' ? chdt + prenchtt : (ctype.substring(0,1) == 'p' ? chdt + prenchtt + chdl + preachtt : ''))));
var defchco=(ctype == 'v' ? 'ff0000,00ff00,0000ff' : (ctype == 's' ? 'FF0000|0000FF&chxt=x,y' : (ctype == 'gv' ? '' : (ctype.substring(0,1) == 'p' ? 'ff0000,00ff00,0000ff,ff00ff' : ''))));
var promptone=(ctype == 'v' ? "Enter delimited values string for Venn Diagram such that ... " + String.fromCharCode(10) + "The first three values specify the sizes of three circles: A, B, & C. For chart with only two circles, specify zero for the third value." + String.fromCharCode(10) + "The fourth value specifies the size of the intersection of A and B." + String.fromCharCode(10) + "The fifth value specifies the size of the intersection of A and C. For a chart with only two circles, do not specify a value here." + String.fromCharCode(10) + "The sixth value specifies the size of the intersection of B and C. For a chart with only two circles, do not specify a value here." + String.fromCharCode(10) + "The seventh value specifies the size of the common intersection of A, B, and C. For a chart with only two circles, do not specify a value here." + String.fromCharCode(10) + String.fromCharCode(10) + "" : (ctype == 's' ? "Enter delimited values string for Scatter Chart" : (ctype == 'gv' ? "Enter delimited values string for GraphViz Chart" : (ctype.substring(0,1) == 'p' ? "Enter delimited values string for Pie Chart" : ""))));
var oneprompt=(ctype == 'v' ? "Enter delimited values string for your Venn Diagram collaborations, optionally, such that ... " + String.fromCharCode(10) + "The first three values specify the sizes of three circles: A, B, & C. For chart with only two circles, specify zero for the third value." + String.fromCharCode(10) + "The fourth value specifies the size of the intersection of A and B." + String.fromCharCode(10) + "The fifth value specifies the size of the intersection of A and C. For a chart with only two circles, do not specify a value here." + String.fromCharCode(10) + "The sixth value specifies the size of the intersection of B and C. For a chart with only two circles, do not specify a value here." + String.fromCharCode(10) + "The seventh value specifies the size of the common intersection of A, B, and C. For a chart with only two circles, do not specify a value here." + String.fromCharCode(10) + String.fromCharCode(10) + "" : (ctype == 's' ? "Enter delimited values string for Scatter Chart" : (ctype == 'gv' ? "Enter delimited values string for GraphViz Chart" : (ctype.substring(0,1) == 'p' ? "Enter delimited values string for Pie Chart" : ""))));
var asktwo=(ctype == 'v' ? true : (ctype == 's' ? true : (ctype == 'gv' ? false : (ctype.substring(0,1) == 'p' ? true : false))));
var twopb=(ctype.substring(0,1) == 'p' ? 'Any optional legend or title argument snippets? Optionally prefix by 3 for 3d Pie Chart or by c for Concentric Pie Chart. Eg. 3' + chdl + preachtt + '&chtt=My%20' + cencodename + '&chco=' + defchco : 'Any optional legend or title argument snippets? Eg. ' + chdl + preachtt + '&chtt=My%20' + cencodename + '&chco=' + defchco);

var atend="<canvas id=sharecanvas style=display:none;></canvas><div style=display:none;><label for='shareurl'><input type=button onclick='downloadmaybe(); shareurl();' id='sbut' value='Share URL Link'></input>: </label><input onblur=changeu(this.value); title='Suffix by hashtag 1 is text and hashtag 2 is title' style='width:45%;' type=url value='' placeholder='https://www.rjmprogramming.com.au/ITblog/#RJM Programming Blog#IT Blog' id=shareurl ondblclick='this.value=trythis(this.placeholder);'></input><br><br><span> ... and/or ... </span><br><br><label for='files'><input type=button onclick=document.getElementById('share').click(); value='Share media or document files'></input>: </label><input id='files' type='file' accept='image/*,video/*,audio/*,application/*,text/*' multiple></div><br><br><button id='share' type='button'>Share your media or documents or link!</button><output id='output'></output><scr" + "ipt type='text/javascript' src='/web_share_api_test.js?canv" + "asshare=as_necessary9867654' defer></scr" + "ipt>";
atend='';

var vals=[], annowin=null;
var lastbit="<br><br><br><br>  <button title='Other complex canvas annotation functionalities (forgoes the simpler ones above) ...' id=annobut onclick=\"document.getElementById('tdleft').style.verticalAlign='top'; setTimeout(prerepaint, 12000); if (arest.length != 0) { if (document.getElementById('myvenn').src.indexOf(arest) == -1) { pdivhide(); document.getElementById('myvenn').src=document.getElementById('myvenn').src.split(arest.substring(0,5))[0] + arest; document.getElementById('tdleft').style.verticalAlign='top'; } } annowin=window.open('/HTMLCSS/user_of_signature_signature.htm?elemode=img','_blank','top=420,left=620,width=900,height=420'); \" style=\"background-color:yellow;\">More Annotations</button>  <button id=bshare onclick=repaint(); style=display:none;>Repaint <font size=1>(but lose sharing emojis above)</font></button><br><div id=divcanvas style=display:none;><canvas id=bottomcanvas></canvas></div>";
var fszbit='  <span id=spanfsz><select id=fsz onchange="fsz=this.value;"><option value=".10">10px</option><option value=".6">6px</option><option value=".8">8px</option><option value=".9">9px</option><option value=".11">11px</option><option value=".12">12px</option><option value=".14">14px</option><option value=".16">16px</option><option value=".18">18px</option><option value=".20">20px</option><option value=".24">24px</option><option value=".30">30px</option><option value=".36">36px</option><option value=".40">40px</option><option value=".48">48px</option><option value=".50">50px</option><option value=".64">64px</option></select></span>';
var origemailurl='mailto:?subject=My%20' + cencodename + '%20...%20best%20viewed%20in%20landscape%20...&body=';
var origsmsurl='sms:&body=My%20' + cencodename + '%20...%20best%20viewed%20in%20landscape%20...';
var smsee='';
var chd=location.search.split(chdeq)[1] ? (tc + decodeURIComponent(location.search.split(chdeq)[1].split('&')[0])).replace('t:t:', 't:').replace(/^t\:$/g, '') : "";
var therest=location.search.split(chdeq)[1] ? (pretherest + document.URL.split(document.URL.split('#')[0].split(chdeq)[1].split('&')[0])[1].split('#')[0]) : "";

Please acquaint yourself with these new annotating features in our changed fifth draft image_venn.html Google Chart Image Chart Venn Chart or Scatter Chart or GraphViz Chart or Pie Chart interfacing web application you can also try below.


Previous relevant Google Chart Image Chart GraphViz Chart Tutorial is shown below.

Google Chart Image Chart GraphViz Chart Tutorial

Google Chart Image Chart GraphViz Chart Tutorial

Today we have two strands of forward progress, onto the progress up to yesterday’s Google Chart Image Chart Scatter Chart Tutorial, they being …

  • establish a new interfacing to GraphViz Chart

    GraphViz is a package of open source tools for visualizing connectivity graphs. You can create GraphViz graphs using the DOT language and your choice of layout engines.

    … a chart looking a bit like Organization Charts

    Org charts are diagrams of a hierarchy of nodes, commonly used to portray superior/subordinate relationships in an organization. A family tree is a type of org chart.


  • start with an at least two part “inhouse phase” of additional “extra to text” annotation functionality possibilities … just starting with …
    1. line
    2. open rectangle
    3. filled rectangle

… additional functionality, that we may well add to, but being as we feel a change we’ll leave that for another time.

The WordPress blog “404.php” code snippet becomes …

<?php

if (strpos(('?' . $_SERVER['QUERY_STRING']), '?cht=') !== false || strpos(('?' . $_SERVER['QUERY_STRING']), '&cht=') !== false) {

$theqs=str_replace('??','?',('?' . $_SERVER['QUERY_STRING']));
if (strpos($theqs, '?chs=') === false && strpos($theqs, '&chs=') === false) {
$theqs='?chs=' . $newWidth . 'x' . $newHeight . '&' . explode('?', $theqs)[1];
}


if (strpos(('?' . $_SERVER['QUERY_STRING']), 'text1=') !== false) {
$theone=2;
$im = imagecreatefromstring(file_get_contents('http://chart.googleapis.com/chart' . explode('&text1=', $theqs)[0]));

if (7 == 7) {

$plotstring=str_replace('+',' ',urldecode($_GET['text1']));
$csv=explode(',', $plotstring);
$black = imagecolorallocatealpha($im, 1, 1, 1, 0);
$blackish = imagecolorallocatealpha($im, 127, 127, 127, 64);
if (sizeof($csv) >= 3) {
if (trim($csv[2]) == '') { // non text annotations

$zeroesbit='';
$izeroes=0;
$xmantissae=explode('.', ('' . $csv[0]));
if (sizeof($xmantissae) > 1) {
$csv[0]=$xmantissae[0];
while (substr($xmantissae[1],0,1) == '0') {
$zeroesbit.='0';
$xmantissae[1]=substr($xmantissae[1],1);
}
$csv[2]=$xmantissae[1];
}
$ymantissae=explode('.', ('' . $csv[1]));
if (sizeof($ymantissae) > 1) {
$csv[1]=$ymantissae[0];
if (sizeof($csv) > 3) {
$csv[3]=$ymantissae[1];
} else {
array_push($csv, $ymantissae[1]);
}
}


if (strlen($zeroesbit) == 4) { // filled in rectangle
imagefilledrectangle($im, $csv[0], $csv[1], $csv[2], $csv[3], $blackish);
} else if (strlen($zeroesbit) == 2) { // rectangle
imagerectangle($im, $csv[0], $csv[1], $csv[2], $csv[3], $black);
} else if (strlen($zeroesbit) == 1) { // line
imageline($im, $csv[0], $csv[1], $csv[2], $csv[3], $black);
}

} else { // text placement
$xis=$csv[0];
$mantissae=explode('.', ('' . $csv[0]));
if (sizeof($mantissae) > 1) {
$tenpx=$mantissae[1];
$xis=$mantissae[0];
}
try {
if (function_exists('imagettftext')) {
if (explode('' . $csv[0] . ',' . $csv[1] . ',', $plotstring)[1] !== '') {
//echo explode('' . $csv[0] . ',' . $csv[1] . ',', $plotstring)[1];
//exit;
imagettftext($im, $tenpx, 0, $xis, $csv[1], $black, realpath('arial.ttf'), explode('' . $csv[0] . ',' . $csv[1] . ',', $plotstring)[1]);
}
}
} catch (Exception $e) { }
}
while (isset($_GET['text' . $theone])) {
$plotstring=str_replace('+',' ',urldecode($_GET['text' . $theone]));
$csv=explode(',', $plotstring);
if (sizeof($csv) >= 3) {
if (trim($csv[2]) == '') { // non text annotations

$zeroesbit='';
$izeroes=0;
$xmantissae=explode('.', ('' . $csv[0]));
if (sizeof($xmantissae) > 1) {
$csv[0]=$xmantissae[0];
while (substr($xmantissae[1],0,1) == '0') {
$zeroesbit.='0';
$xmantissae[1]=substr($xmantissae[1],1);
}
$csv[2]=$xmantissae[1];
}
$ymantissae=explode('.', ('' . $csv[1]));
if (sizeof($ymantissae) > 1) {
$csv[1]=$ymantissae[0];
if (sizeof($csv) > 3) {
$csv[3]=$ymantissae[1];
} else {
array_push($csv, $ymantissae[1]);
}
}


if (strlen($zeroesbit) == 4) { // filled in rectangle
imagefilledrectangle($im, $csv[0], $csv[1], $csv[2], $csv[3], $blackish);
} else if (strlen($zeroesbit) == 2) { // rectangle
imagerectangle($im, $csv[0], $csv[1], $csv[2], $csv[3], $black);
} else if (strlen($zeroesbit) == 1) { // line
imageline($im, $csv[0], $csv[1], $csv[2], $csv[3], $black);
}

} else { // text placement
try {
$xis=$csv[0];
$mantissae=explode('.', ('' . $csv[0]));
if (sizeof($mantissae) > 1) {
$tenpx=$mantissae[1];
$xis=$mantissae[0];
}
if (function_exists('imagettftext')) {
if (explode('' . $csv[0] . ',' . $csv[1] . ',', $plotstring)[1] !== '') {
imagettftext($im, $tenpx, 0, $xis, $csv[1], $black, realpath('arial.ttf'), explode('' . $csv[0] . ',' . $csv[1] . ',', $plotstring)[1]);
}
}
} catch (Exception $e) { }
}
$theone++;
}
}
//}
}


}

header('Content-Type: image/png');

imagepng($im);
imagedestroy($im);
} else {
header('Content-Type: image/png');
echo file_get_contents('http://chart.googleapis.com/chart' . $theqs);
}
exit;

}

?>

… utilizing that good ol’ PHP GD image library.

We hope you enjoy the …

Mantissa Madness Monday

… coding feel utilized to retain yesterday’s …


&textn=x,y,Text

… argument snippet basis, adding “x” and “y” mantissa arrangement smarts with a “nothing” Text in our changed fourth draft image_venn.html Google Chart Image Chart Venn Chart or Scatter Chart or GraphViz Chart interfacing web application you can also try below.

Did you know?

Would you believe, at least to us, it is far less obvious how to display a straight line (that is perhaps not horizontal nor vertical) within a webpage, than it is to display a rectangle, filled or not?! Talk about irony! Over time, we have developed …

  • HTML hr elements (with a rotation) … and the less kludgy …
  • HTML div (defining a box with defined dimensions) for a nested SVG element containing the line definition using percentage dimensions

… in the past, for when we needed to do this. But, today, we’d like to thank this great webpage for its suggestion to involve linear gradients …


<style>

.crossedtotl {
background:
linear-gradient(to top left,
rgba(0,0,0,0) 0%,
rgba(0,0,0,0) calc(50% - 0.8px),
rgba(0,0,0,1) 50%,
rgba(0,0,0,0) calc(50% + 0.8px),
rgba(0,0,0,0) 100%);
}
.crossedtotr {
background:
linear-gradient(to top right,
rgba(0,0,0,0) 0%,
rgba(0,0,0,0) calc(50% - 0.8px),
rgba(0,0,0,1) 50%,
rgba(0,0,0,0) calc(50% + 0.8px),
rgba(0,0,0,0) 100%);
}
</style>

… in a, basically, CSS solution. Great stuff, thanks!


Previous relevant Google Chart Image Chart Scatter Chart Tutorial is shown below.

Google Chart Image Chart Scatter Chart Tutorial

Google Chart Image Chart Scatter Chart Tutorial

Today, we bring the Google Charts Image Chart

… making distributing “Venn Chart” hardcodings into a dropdown selectable arrangement, because there are more commonalities than differences, really, and we do like to parameterize … even in the shower, with a fairly loud rendition of this, perhaps.

Here is our framework for parameterization, here, and into the future


<title>Interfacing to Google Charts Image Chart Venn Chart or Scatter Chart - RJM Programming - November, 2023</title>
<script type=text/javascript>
var cht=location.search.split('cht=')[1] ? decodeURIComponent(location.search.split('cht=')[1].split('&')[0]) : "v";
var ctype=location.search.split('type=')[1] ? decodeURIComponent(location.search.split('type=')[1].split('&')[0]) : cht;
var cname=(ctype == 'v' ? 'Venn Chart' : (ctype == 's' ? 'Scatter Chart' : ''));
var cencodename=(ctype == 'v' ? 'Venn%20Diagram' : (ctype == 's' ? 'Scatter%20Chart' : ''));
var prenchtt=(ctype == 'v' ? '100,80,60,30,30,30,10' : (ctype == 's' ? '12,87,75,41,23,96,68,71,34,9|98,60,27,34,56,79,58,74,18,76|84,23,69,81,47,94,60,93,64,54' : ''));
var preachtt=(ctype == 'v' ? 'A|B|C' : (ctype == 's' ? 'Cats|Dogs' : ''));
var prechtt=(ctype == 'v' ? '&chd=t:' + prenchtt + '&chdl=' + preachtt : (ctype == 's' ? '&chd=t:' + prenchtt + '&chdl=' + preachtt + '&chxt=x,y' : ''));
var defchco=(ctype == 'v' ? 'ff0000,00ff00,0000ff' : (ctype == 's' ? 'FF0000|0000FF&chxt=x,y' : ''));
var promptone=(ctype == 'v' ? "Enter delimited values string for Venn Diagram such that ... " + String.fromCharCode(10) + "The first three values specify the sizes of three circles: A, B, & C. For chart with only two circles, specify zero for the third value." + String.fromCharCode(10) + "The fourth value specifies the size of the intersection of A and B." + String.fromCharCode(10) + "The fifth value specifies the size of the intersection of A and C. For a chart with only two circles, do not specify a value here." + String.fromCharCode(10) + "The sixth value specifies the size of the intersection of B and C. For a chart with only two circles, do not specify a value here." + String.fromCharCode(10) + "The seventh value specifies the size of the common intersection of A, B, and C. For a chart with only two circles, do not specify a value here." + String.fromCharCode(10) + String.fromCharCode(10) + "" : (ctype == 's' ? "Enter delimited values string for Scatter Chart" : ""));
var oneprompt=(ctype == 'v' ? "Enter delimited values string for your Venn Diagram collaborations, optionally, such that ... " + String.fromCharCode(10) + "The first three values specify the sizes of three circles: A, B, & C. For chart with only two circles, specify zero for the third value." + String.fromCharCode(10) + "The fourth value specifies the size of the intersection of A and B." + String.fromCharCode(10) + "The fifth value specifies the size of the intersection of A and C. For a chart with only two circles, do not specify a value here." + String.fromCharCode(10) + "The sixth value specifies the size of the intersection of B and C. For a chart with only two circles, do not specify a value here." + String.fromCharCode(10) + "The seventh value specifies the size of the common intersection of A, B, and C. For a chart with only two circles, do not specify a value here." + String.fromCharCode(10) + String.fromCharCode(10) + "" : (ctype == 's' ? "Enter delimited values string for Scatter Chart" : ""));

// etcetera etcetera etcetera

… but, as you can imagine, there will probably be small retweaks of this arrangement, which is holding out okay so far for Scatter Charts in our changed third draft image_venn.html Google Chart Image Chart Venn Chart or Scatter Chart interfacing web application you can also try below.

Did you know?

In this online world with so many platforms and devices and software choices, there is no need to ever be embarrassed by what might seem an obvious feature you’ve missed.

Take the way on macOS, but not iOS, using a web browser to get to YouTube, you can flag that a video should loop. Especially good for …

  • song obsessions …
  • earworms you need to salve

… and what about if your shower is taking an awfully long time?! Please be careful with moisture and devices, though, in the bathroom!

How does it happen? Right click the play button, and looping is there as the top option. Now back to that shower song obsession.


Previous relevant Google Chart Image Chart Venn Chart User Text Tutorial is shown below.

Google Chart Image Chart Venn Chart User Text Tutorial

Google Chart Image Chart Venn Chart User Text Tutorial

We think a way to improve on our interfacing web application start regarding yesterday’s Google Chart Image Chart Venn Chart Interfacing Primer Tutorial would be to offer the user the chance to enter their own text onto the Venn Diagrams …

But we would say that.

… given what we learnt in Primary school … or should we say …

“Gryffindor Slytherin Ravenclaw Hufflepuff Junior Business College”

… and, yes, is that you, Aoife? What did you want to point out? After you swallow those Rice Bubbles, that is?! Class is waiting …

.
.
.
.
.
.
.
.
.
.
.
.
.
.
.
.
.
.
.
.
.
.
.
.
.

Yes … miss something … and …

.
.
.
.
.
.
.
.
.
.
.
.
.
.
.
.
.
.
.
.
.
.
.
.
.

Use your words … okay … missing … don’t worry, the bus will wait … no … there’s no need to point … oh! …

… do you mean …

missing ewe … no … missing you … oh! … missing u … oh! … “Gryffindor Slytherin Ravenclaw Hufflepuff Juniour Business College” … quite so, Aiofe … 3 points for Hufflepuff!

Anyway we needed a fleshed out “function ask” to cater for potential onclick event logic catering for co-ordinates


function ask(evt) {
var answer='', answertherest='';
if (lasttext != '' && evt && normalcall) {
document.getElementById('ilp').placeholder='Enter text and later click place for it on Venn Diagram to left (line feed is ~~)';

elemLeft = document.getElementById('myvenn').offsetLeft;
elemTop = document.getElementById('myvenn').offsetTop;

if (evt.touches) {
if (evt.touches[0].pageX) {
x = evt.touches[0].pageX + document.body.scrollLeft - elemLeft;
y = evt.touches[0].pageY + document.body.scrollTop - elemTop;
} else {
x = evt.touches[0].clientX + document.body.scrollLeft - elemLeft;
y = evt.touches[0].clientY + document.body.scrollTop - elemTop;
}
} else if (evt.clientX || ev.clientY) {
x = evt.clientX + document.body.scrollLeft - elemLeft;
y = evt.clientY + document.body.scrollTop - elemTop;
} else {
x = evt.pageX + document.body.scrollLeft - elemLeft;
y = evt.pageY + document.body.scrollTop - elemTop;
}


document.getElementById('dtext').innerHTML+='<p style="position:absolute;font-size:10px;font-family:Arial;left:' + x + 'px;top:' + y + 'px;z-index:98;">' + lasttext + '</p>';

document.getElementById('aemail').href+='&text' + textnum + '=' + encodeURIComponent('' + x + ',' + y + ',') + encodeURIComponent(lasttext.replace(/\<br\>/g, String.fromCharCode(10)));
document.getElementById('asms').href+='&text' + textnum + '=' + encodeURIComponent('' + x + ',' + y + ',') + encodeURIComponent(lasttext.replace(/\<br\>/g, String.fromCharCode(10)));
arest+='&text' + textnum + '=' + encodeURIComponent('' + x + ',' + y + ',') + encodeURIComponent(lasttext.replace(/\<br\>/g, String.fromCharCode(10)));
therest+='&text' + textnum + '=' + encodeURIComponent('' + x + ',' + y + ',') + encodeURIComponent(lasttext.replace(/\<br\>/g, String.fromCharCode(10)));
asmsurl+='&text' + textnum + '=' + encodeURIComponent('' + x + ',' + y + ',') + encodeURIComponent(lasttext.replace(/\<br\>/g, String.fromCharCode(10)));
aemailurl+='&text' + textnum + '=' + encodeURIComponent('' + x + ',' + y + ',') + encodeURIComponent(lasttext.replace(/\<br\>/g, String.fromCharCode(10)));
document.getElementById('tdright').innerHTML="  <span id=spemail><a target=_blank href='mailto:?subject=My%20Venn%20Diagram%20...%20best%20viewed%20in%20landscape%20...&body=" + encodeURIComponent((document.getElementById('myvenn').src + arest).replace((document.getElementById('myvenn').src + arest).split('?')[0].split('#')[0], document.URL.split('?')[0].split('#')[0])) + "' id=aemail title=Email>&#128231;</a></span>      <span id=spsms><a target=_blank onmouseover=\"if (smsee.length == 0 && origsmsurl.indexOf('sms:&') != -1) { smsee=prompt('Please enter SMS number to send to.', ''); if (smsee == null) { smsee=''; } else { origsmsurl=origsmsurl.replace('sms:&','sms:' + smsee + '&'); asmsurl=asmsurl.replace('sms:&','sms:' + smsee + '&'); this.href=asmsurl; } }\" ontouchstart=\"if (smsee.length == 0 && origsmsurl.indexOf('sms:&') != -1) { smsee=prompt('Please enter SMS number to send to.', ''); if (smsee == null) { smsee=''; } else { origsmsurl=origsmsurl.replace('sms:&','sms:' + smsee + '&'); asmsurl=asmsurl.replace('sms:&','sms:' + smsee + '&'); this.href=asmsurl; } }\" href='sms:&body=" + encodeURIComponent((document.getElementById('myvenn').src + arest).replace(document.getElementById('myvenn').src.split('?')[0].split('#')[0], document.URL.split('?')[0].split('#')[0])) + "' id=asms title=SMS>&#128223;</a></span><br><br>  <input id=ilp onblur=\"lasttext=this.value.replace(/\~\~/g, '<br>'); this.value=''; this.placeholder='Click where you want ... ' + lasttext.replace(/\<br\>/g, String.fromCharCode(10)); mvp.setAttribute('content','initial-scale=1'); document.getElementById('myvenn').scrollIntoView();\" placeholder='Enter text and later click place for it on Venn Diagram to left (line feed is ~~)' type=text style=width:500px; value=''></input>";
//alert( document.getElementById('aemail').outerHTML );
//alert( document.getElementById('asms').outerHTML );
textnum++;
lasttext='';
} else if (!evt || !normalcall) {
if (chd == '') {
answer=prompt("Enter delimited values string for Venn Diagram such that ... " + String.fromCharCode(10) + "The first three values specify the sizes of three circles: A, B, & C. For chart with only two circles, specify zero for the third value." + String.fromCharCode(10) + "The fourth value specifies the size of the intersection of A and B." + String.fromCharCode(10) + "The fifth value specifies the size of the intersection of A and C. For a chart with only two circles, do not specify a value here." + String.fromCharCode(10) + "The sixth value specifies the size of the intersection of B and C. For a chart with only two circles, do not specify a value here." + String.fromCharCode(10) + "The seventh value specifies the size of the common intersection of A, B, and C. For a chart with only two circles, do not specify a value here." + String.fromCharCode(10) + String.fromCharCode(10) + "", (chd == '' ? "100,80,60,30,30,30,10" : (chd.replace('t:',''))));
} else {
answer=prompt("Enter delimited values string for your Venn Diagram collaborations, optionally, such that ... " + String.fromCharCode(10) + "The first three values specify the sizes of three circles: A, B, & C. For chart with only two circles, specify zero for the third value." + String.fromCharCode(10) + "The fourth value specifies the size of the intersection of A and B." + String.fromCharCode(10) + "The fifth value specifies the size of the intersection of A and C. For a chart with only two circles, do not specify a value here." + String.fromCharCode(10) + "The sixth value specifies the size of the intersection of B and C. For a chart with only two circles, do not specify a value here." + String.fromCharCode(10) + "The seventh value specifies the size of the common intersection of A, B, and C. For a chart with only two circles, do not specify a value here." + String.fromCharCode(10) + String.fromCharCode(10) + "", (chd == '' ? "100,80,60,30,30,30,10" : (chd.replace('t:',''))));
}
vals=[];
if (answer != null) {
answer=answer.trim();
if (answer.trim() != '') {
var delimis='';
for (var ii=0; ii<answer.length; ii++) {
if (delimis == '' && (answer.substring(ii).substring(0,1) < '0' || answer.substring(ii).substring(0,1) > '9')) {
delimis=answer.substring(ii).substring(0,1);
}
}
}
if (delimis != '') {
vals=answer.split(delimis);
}
if (vals.length == 6 || vals.length == 7) {
answertherest=prompt('Any optional legend or title argument snippets? Eg. &chdl=A|B|C&chtt=My%20Venn%20Diagram&chco=ff0000,00ff00,0000ff', therest);
if (answertherest == null) { answertherest=''; }
therest=answertherest.trim();
var aone=1;
var plotstring='';
var flds=[];
if (therest.indexOf('&text' + aone + '=') != -1) {
while (therest.indexOf('&text' + aone + '=') != -1) {
if (chd == '') {
plotstring=decodeURIComponent(therest.split('&text' + aone + '=')[1].split('&')[0]);
while (plotstring.indexOf(String.fromCharCode(10)) != -1) {
plotstring=plotstring.replace(String.fromCharCode(10), '<br>');
}
flds=plotstring.split(',');
if (eval('' + flds.length) >= 3) {
document.getElementById('dtext').innerHTML+='<p style="position:absolute;font-size:10px;font-family:Arial;left:' + flds[0] + 'px;top:' + flds[1] + 'px;z-index:98;">' + plotstring.split('' + flds[0] + ',' + flds[1] + ',')[1] + '</p>';
}
}
aone++;
textnum=aone;
}
}
//document.getElementById('myvenn').style.backgroundImage='URL(//www.rjmprogramming.com.au/ITblog/' + Math.min(550,window.innerWidth) + '/' + Math.min(350,window.innerHeight) + '/?cht=v&chd=t:' + encodeURIComponent(answer + therest) + ')';
document.getElementById('myvenn').src='//www.rjmprogramming.com.au/ITblog/' + Math.min(550,window.innerWidth) + '/' + Math.min(350,window.innerHeight) + '/?cht=v&chd=t:' + encodeURIComponent(answer) + therest + '';
if (document.getElementById('tdright').innerHTML == '') {
document.getElementById('tdright').innerHTML="  <span id=spemail><a target=_blank href='mailto:?subject=My%20Venn%20Diagram%20...%20best%20viewed%20in%20landscape%20...&body=" + encodeURIComponent((document.getElementById('myvenn').src + arest).replace(document.getElementById('myvenn').src.split('?')[0].split('#')[0], document.URL.split('?')[0].split('#')[0])) + "' id=aemail title=Email>&#128231;</a></span>      <span id=spsms><a target=_blank onmouseover=\"if (smsee.length == 0 && origsmsurl.indexOf('sms:&') != -1) { smsee=prompt('Please enter SMS number to send to.', ''); if (smsee == null) { smsee=''; } else { origsmsurl=origsmsurl.replace('sms:&','sms:' + smsee + '&'); asmsurl=asmsurl.replace('sms:&','sms:' + smsee + '&'); this.href=asmsurl; } }\" ontouchstart=\"if (smsee.length == 0 && origsmsurl.indexOf('sms:&') != -1) { smsee=prompt('Please enter SMS number to send to.', ''); if (smsee == null) { smsee=''; } else { origsmsurl=origsmsurl.replace('sms:&','sms:' + smsee + '&'); asmsurl=asmsurl.replace('sms:&','sms:' + smsee + '&'); this.href=asmsurl; } }\" href='sms:&body=" + encodeURIComponent((document.getElementById('myvenn').src + arest).replace(document.getElementById('myvenn').src.split('?')[0].split('#')[0], document.URL.split('?')[0].split('#')[0])) + "' id=asms title=SMS>&#128223;</a></span><br><br>  <input id=ilp onblur=\"lasttext=this.value.replace(/\~\~/g, '<br>'); this.value=''; this.placeholder='Click where you want ... ' + lasttext.replace(/\<br\>/g, String.fromCharCode(10));\" placeholder='Enter text and later click place for it on Venn Diagram to left (line feed is ~~)' type=text style=width:500px; value=''></input>";
}
} else {
alert('Try again.');
ask(null);
}
}
}
atstart=false;
normalcall=true;
}

… in our changed second draft image_venn.html Google Chart Image Chart Venn Chart interfacing web application you can also try below.

Did you know?

As far as this WordPress blog’s 404.php role goes in all this, we were keen to maintain Venn Diagrams that were purely image based data, because the web browser sharing mechanisms are so much better this way, else we were tempted to just construct a webpage HTML dataset positioning text in an absolute way with a Venn Chart background image. In order to do these purely image based Venn Diagrams we used PHP’s GD image library as per

<?php

if (strpos(('?' . $_SERVER['QUERY_STRING']), '?cht=') !== false || strpos(('?' . $_SERVER['QUERY_STRING']), '&cht=') !== false) {

$theqs=str_replace('??','?',('?' . $_SERVER['QUERY_STRING']));
if (strpos($theqs, '?chs=') === false && strpos($theqs, '&chs=') === false) {
$theqs='?chs=' . $newWidth . 'x' . $newHeight . '&' . explode('?', $theqs)[1];
}

if (strpos(('?' . $_SERVER['QUERY_STRING']), 'text1=') !== false) {
$theone=2;
$im = imagecreatefromstring(file_get_contents('ht
tp://chart.googleapis.com/chart' . explode('&text1=', $theqs)[0]));

if (7 == 7) {

$plotstring=str_replace('+',' ',urldecode($_GET['text1']));
$csv=explode(',', $plotstring);
$black = imagecolorallocatealpha($im, 1, 1, 1, 0);
if (sizeof($csv) >= 3) {
try {
if (function_exists('imagettftext')) {
if (explode('' . $csv[0] . ',' . $csv[1] . ',', $plotstring)[1] !== '') {
//echo explode('' . $csv[0] . ',' . $csv[1] . ',', $plotstring)[1];
//exit;
imagettftext($im, 10, 0, $csv[0], $csv[1], $black, realpath('arial.ttf'), explode('' . $csv[0] . ',' . $csv[1] . ',', $plotstring)[1]);
}
}
} catch (Exception $e) { }
while (isset($_GET['text' . $theone])) {
$plotstring=str_replace('+',' ',urldecode($_GET['text' . $theone]));
$csv=explode(',', $plotstring);
if (sizeof($csv) >= 3) {
try {
if (function_exists('imagettftext')) {
if (explode('' . $csv[0] . ',' . $csv[1] . ',', $plotstring)[1] !== '') {
imagettftext($im, 10, 0, $csv[0], $csv[1], $black, realpath('arial.ttf'), explode('' . $csv[0] . ',' . $csv[1] . ',', $plotstring)[1]);
}
}
} catch (Exception $e) { }
}
$theone++;
}
}

}


header('Content-Type: image/png');

imagepng($im);
imagedestroy($im);
} else {

header('Content-Type: image/png');
echo file_get_contents('http://chart.googleapis.com/chart' . $theqs);
}
exit;

}

?>


Previous relevant Google Chart Image Chart Venn Chart Interfacing Primer Tutorial is shown below.

Google Chart Image Chart Venn Chart Interfacing Primer Tutorial

Google Chart Image Chart Venn Chart Interfacing Primer Tutorial

So, moving on from Google Charts Image Chart Map Charts, today, let’s turn our attention to Google Charts Image Chart Venn Charts which we were dead set curious about given work we’d done in the past regarding Venn Diagrams, which we referenced when we presented Flowchart and Venn Diagram and Mind Map Token Subject Emoji Tutorial some time back. Gobsmackingly good is the Google approach, again, as you’d expect, but the approach covers different ground, so one feels one should go back to Primary School! You thought we were going to give away the answer to one of those security questions, didn’t you?! Didn’t you!?! Well, the answer is “Gryffindor Slytherin Ravenclaw Hufflepuff Junior Business College” … if you must know.

The sharing capabilities are good with the Google Charts approach too, given we are creating an HTML image, as our WordPress blog good ol’ 404.php has been woken up to address via …

<?php

if (strpos(('?' . $_SERVER['QUERY_STRING']), '?cht=') !== false || strpos(('?' . $_SERVER['QUERY_STRING']), '&cht=') !== false) {

$theqs=str_replace('??','?',('?' . $_SERVER['QUERY_STRING']));
if (strpos($theqs, '?chs=') === false && strpos($theqs, '&chs=') === false) {
$theqs='?chs=' . $newWidth . 'x' . $newHeight . '&' . explode('?', $theqs)[1];
}


header('Content-Type: image/png');
echo file_get_contents('http://chart.googleapis.com/chart' . $theqs);
exit;

}

?>

Yes, all these Image Chart smarts come, essentially, from a “one line” calling URL! Who’d have believed it! Shiver me timbers!

Well, it’s early days with this Venn Chart interfacing where we allow for …

  • circle (think up to three) definition … and the rest, in this first draft (hoping you’ve done some reading)
  • legend and title and colour selection user definitions dumped into a fairly unfriendly “the rest” Javascript prompt entry we ask of the user should they go ahead with the previous definition … and …
  • sharing and collaboration email and SMS functionality

… we hope you try via our “proof of concept” first draft image_venn.html Google Chart Image Chart Venn Chart interfacing web application you can also try below …


If this was interesting you may be interested in this too.


If this was interesting you may be interested in this too.


If this was interesting you may be interested in this too.


If this was interesting you may be interested in this too.


If this was interesting you may be interested in this too.


If this was interesting you may be interested in this too.


If this was interesting you may be interested in this too.


If this was interesting you may be interested in this too.


If this was interesting you may be interested in this too.


If this was interesting you may be interested in this too.


If this was interesting you may be interested in this too.


If this was interesting you may be interested in this too.


If this was interesting you may be interested in this too.


If this was interesting you may be interested in this too.


If this was interesting you may be interested in this too.


If this was interesting you may be interested in this too.


If this was interesting you may be interested in this too.


If this was interesting you may be interested in this too.


If this was interesting you may be interested in this too.


If this was interesting you may be interested in this too.


If this was interesting you may be interested in this too.


If this was interesting you may be interested in this too.


If this was interesting you may be interested in this too.


If this was interesting you may be interested in this too.


If this was interesting you may be interested in this too.


If this was interesting you may be interested in this too.

Posted in eLearning, Event-Driven Programming, Tutorials | Tagged , , , , , , , , , , , , , , , , , , , , , , , , , , , , | Leave a comment

Python GraphViz via PHP on AlmaLinux Permissions Tutorial

Python GraphViz via PHP on AlmaLinux Permissions Tutorial

Python GraphViz via PHP on AlmaLinux Permissions Tutorial

Did you guess, regarding the Python Graphviz via PHP work of yesterday’s Python GraphViz via PHP on AlmaLinux Tutorial, we were experiencing File Permission issues?

Well, yesterday, regarding the Python Graphviz via PHP work of yesterday’s Python GraphViz via PHP on AlmaLinux Tutorial, we were experiencing File Permission issues.

We thought we’d move the Python, via PHP processing, totally into the purview of the web server administration owner, by involving a …

  1. Korn Shell *.ksh … supervised by …
  2. crontab … pointing to …

    ksh -c 'for i in `find /home/rjmprogr/public_html/ -name "subgraph_example_*.ksh"`; do ksh -c `echo $i`; done'

    … very regularly

… arrangement, but even that failed, in a first incarnation using /tmp/ placement of the Korn Shell file. “Permission denied”, again. Running a Korn Shell from /tmp/ on AlmaLinux must be a no-no, so moved the place to be AlmaLinux web server’s Document Root place, and then things started happening, in the changed subgraph_example.php Python GraphViz using web application.


Previous relevant Python GraphViz via PHP on AlmaLinux Tutorial is shown below.

Python GraphViz via PHP on AlmaLinux Tutorial

Python GraphViz via PHP on AlmaLinux Tutorial

Do you remember reading, with PHP Image GraphViz via Pear on AlmaLinux Primer Tutorial below, our outlining three known GraphViz guises …

  • the recent, alas now deprecated, Google Charts Image Charts GraphViz option means of drawing SVG graphics within an HTML image … we’ve known about before about yesterday
  • today’s interest, that being PHP Image GraphViz via Pear on AlmaLinux install, via the AlmaLinux cPanel “Module Installers” Pear installer page, means by which we can use GraphViz calls in PHP code … and, for the future …
  • GraphViz installs for Python via pip

…? Well, today, we start down the road of …

  1. installing Python GraphViz package via …

    pip install graphviz

    … then …
  2. getting great help from https://graphviz.readthedocs.io/en/stable/, thanks, as the Python code basis we call subgraph_example.py … and …
  3. used and remoulded by our overseeing PHP subgraph_example.php Python GraphViz using web application

… we need to work on more after this first draft start to another road of our GraphViz journey last talked about at PHP Image GraphViz via Pear on AlmaLinux Focus Tutorial.


Previous relevant PHP Image GraphViz via Pear on AlmaLinux Focus Tutorial is shown below.

PHP Image GraphViz via Pear on AlmaLinux Focus Tutorial

PHP Image GraphViz via Pear on AlmaLinux Focus Tutorial

It reared it’s ugly head with the Animated GIF Creator here at RJM Programming (helped out by the great Jeroen van Wissen open source work, thanks). And with yesterday’s PHP Image GraphViz via Pear on AlmaLinux Recallable Tutorial it reared up again.

On non-mobile focus goes to the address bar on many web browsers unless there is a (nominally) visible input type=text or textarea next in line.

It’s hard to keep in mind except as it “rears up” in an annoying way, but if we’d thought back, yes, we allow in the linked list feel of revealing textboxes (or textareas) only as they are needed scenarios we allow for two blank ones to be (nominally) visible at any given time … not one … but two, presumably because there is a tiny Javascript DOM “refresh period” not short enough to stop the web browser “desperation measure” (of placing focus in the address bar) happening?!

Why the non-mobile mention? Well, on mobile, a user programming [HTMLelement].focus(); call has no affect, as the touch operating systems need control of focus arrangements, presumably?!

How can we forget? My liege, please accept my humble apologies?!

Why the (nominally) mentions? Well, we have, successfully, in the past, just arranged a (statically HTML placed) textbox (ie. input type=text) that sits outside the viewing screen but not (nominally) invisible (eg. style=’position:absolute;top:-200px;left:-200px;’) can help you avoid the focus going up to the web browser address bar.

So that’s that, and other progress today is to allow the emailing or SMS of a recalled URL Step arrangement via more options on that “Recall Dropdown” we started allowing for yesterday.

Please see this happening in our changed PHP coded My Recipe Steps web application you can also try below.


Previous relevant PHP Image GraphViz via Pear on AlmaLinux Recallable Tutorial is shown below.

PHP Image GraphViz via Pear on AlmaLinux Recallable Tutorial

PHP Image GraphViz via Pear on AlmaLinux Recallable Tutorial

After yesterday’s PHP Image GraphViz via Pear on AlmaLinux Sharing Tutorial some readers may be curious to understand the distinction between …

  • email and SMS sharing … and …
  • inhouse intersessional sharing via window.localStorage (ie. like HTTP Cookies)

… over yesterday’s and today’s blog posting timings. Simply put, for us, we …

  • take a deep breath before starting intersessional window.localStorage work, as it is not to be sneezed at, as any sort of doddle (at least for us) … as well as …
  • since last intersessional window.localStorage work we’ve started using email and SMS sharing hashtagging arrangements that fit in, like a glove, with this intersessional window.localStorage work … so that …
  • even though, we write the code here in PHP, all this functionality is client based … which we like because …
  • get the idea correct, with careful forward planning and implementation, we’ll be able to apply similar such thinking into the future, whether that be for clientside only web applications and/or ones that call on serverside code (like PHP) … and …
  • if we can keep things just clientside more readers can be involved, we figure

If you’re wondering about the worry of any of this, it is to do with large title and/or URL link and/or ingredient type data whose data length could be huge, where most of our concern lies, and …

  • hashtagging (where data limits are so much longer) can help it remain as a clientside only solution environment (rather than relying on some form method=POST to a serverside (eg. PHP) receiver solution) …
  • window.localStorage is a step up from the HTTP Cookie style of intersessional (personal) storage as far as amounts that can be stored is concerned

What are we aiming for here, then, with our improvements?

  • extend the existant email and SMS functionality …
    <?php echo ”

    function emailit(insg) {
    var em='', ccok='';
    if (estitle == '') {
    if (cookb.split(' Or hash delimited appended string can ')[0] != '') {
    cookb=cookb.replace(cookb.split(' Or hash delimited appended string can ')[0], '');
    }
    }
    if (('' + insg).replace(/^null/g,'').replace(/^undefined/g,'').trim() != '') {
    em='' + insg;
    } else {

    em=prompt('Please enter Email address to share with. ' + cookb, '');
    }
    if (em != null) {
    if (em.trim() == '' && estitle != '') {
    em='#' + estitle;
    } else if (em == estitle && estitle != '') {
    em='#' + estitle;
    }
    }
    if (em.indexOf('#') != -1) {
    cook=em.substring(eval(1 + eval('' + em.indexOf('#'))));
    em=em.split('#')[0].trim();
    if (cook.trim() != '') {
    deleteAVal('steps_' + cook.replace(/\ /g,'-'),'');
    setAVal('steps_' + cook.replace(/\ /g,'-'), \"" . $hashurl . $hashurld . "\" + anyhashes);
    }
    }

    if (em == null) { em=''; }
    if (em.trim() != '') {
    if (em.trim().indexOf('@') != -1) {
    em+='?subject=Steps&body=' + encodeURIComponent(\"" . $hashurl . $hashurld . "\" + anyhashes);
    document.getElementById('dimap').innerHTML=\"<a style=display:none; id=theaemail target=_blank href='mailto:\" + em + \"'>Email</a>\";
    document.getElementById('theaemail').click();
    } else if (em.trim().replace(/0/g,'').replace(/1/g,'').replace(/2/g,'').replace(/3/g,'').replace(/4/g,'').replace(/5/g,'').replace(/6/g,'').replace(/7/g,'').replace(/8/g,'').replace(/9/g,'') == '') {
    em+='&body=' + encodeURIComponent(\"" . $hashurl . $hashurld . "\" + anyhashes);
    document.getElementById('dimap').innerHTML=\"<a style=display:none; id=theasms target=_blank href='sms:\" + em + \"'>SMS</a>\";
    document.getElementById('theasms').click();
    }
    }
    return false;

    }

    function smsit(insg) {
    var em='', cook='';
    if (estitle == '') {
    if (cookb.split(' Or hash delimited appended string can ')[0] != '') {
    cookb=cookb.replace(cookb.split(' Or hash delimited appended string can ')[0], '');
    }
    }
    if (('' + insg).replace(/^null/g,'').replace(/^undefined/g,'').trim() != '') {
    em='' + insg;
    } else {

    em=prompt('Please enter SMS number to share with. ' + cookb, '');
    }
    if (em != null) {
    if (em.trim() == '' && estitle != '') {
    em='#' + estitle;
    } else if (em == estitle && estitle != '') {
    em='#' + estitle;
    }
    }
    if (em.indexOf('#') != -1) {
    cook=em.substring(eval(1 + eval('' + em.indexOf('#'))));
    em=em.split('#')[0].trim();
    if (cook.trim() != '') {
    deleteAVal('steps_' + cook.replace(/\ /g,'-'),'');
    setAVal('steps_' + cook.replace(/\ /g,'-'), \"" . $hashurl . $hashurld . "\" + anyhashes);
    }
    }

    if (em == null) { em=''; }
    if (em.trim() != '') {
    if (em.trim().replace(/0/g,'').replace(/1/g,'').replace(/2/g,'').replace(/3/g,'').replace(/4/g,'').replace(/5/g,'').replace(/6/g,'').replace(/7/g,'').replace(/8/g,'').replace(/9/g,'') == '') {
    em+='&body=' + encodeURIComponent(\"" . $hashurl . $hashurld . "\" + anyhashes);
    document.getElementById('dimap').innerHTML=\"<a style=display:none; id=theasms target=_blank href='sms:\" + em + \"'>SMS</a>\";
    document.getElementById('theasms').click();
    } else if (em.trim().indexOf('@') != -1) {
    em+='?subject=Steps&body=' + encodeURIComponent(\"" . $hashurl . $hashurld . "\" + anyhashes);
    document.getElementById('dimap').innerHTML=\"<a style=display:none; id=theaemail target=_blank href='mailto:\" + em + \"'>Email</a>\";
    document.getElementById('theaemail').click();
    }
    }
    return false;
    }

    “; ?>
    … to cater for additional personalized Title (of steps) and Content of steps (using the hashtagging email and SMS URL methods set up yesterday)
    <?php echo ”

    var estitle=\"" . $estitle . "\";
    var cookb=\"" . $cookblurb . "\";
    var lssel='';
    var woo=null;

    function deleteAVal(goodname, aparticularvalue) {
    if (window.localStorage && goodname.indexOf('steps_') == 0) {
    if (('' + localStorage.getItem(goodname)).replace(/^undefined/g,'').replace(/^null/g,'') != '') {
    if (aparticularvalue == '') {
    localStorage.removeItem(goodname);
    } else {
    if (aparticularvalue.replace('HTTP','http').toLowerCase() == ('' + localStorage.getItem(goodname)).toLowerCase()) {
    localStorage.removeItem(goodname);
    }
    }
    }
    }
    }

    function setAVal(cName, cVal) {
    if (cName.indexOf('steps_') == 0) {
    if (window.localStorage) {
    localStorage.setItem(cName, encodeURIComponent(cVal));
    cookieAVal('steps_', true);
    return ' ';
    }
    return '';
    }
    return '';
    }

    function gotothis(inu) {
    if (inu.trim() != '') {
    if (inu.indexOf('HTTP') == 0) {
    //alert('2:' + inu);
    if (inu.indexOf('#steps_') != -1) {
    //alert('22:' + inu.split('#')[eval(-1 + inu.split('#').length)]);
    deleteAVal(inu.split('#')[eval(-1 + inu.split('#').length)], encodeURIComponent(inu.replace('#' + inu.split('#')[eval(-1 + inu.split('#').length)], '').replace('HTTP','http')));
    //alert('222:' + inu.split('#')[eval(-1 + inu.split('#').length)]);
    cookieAVal('steps_', true);
    //alert('2222:' + inu.split('#')[eval(-1 + inu.split('#').length)]);
    }
    } else {
    woo=window.open(inu, '_blank', 'top=50,left=50,width=800,height=800');
    }
    }
    }

    function cookieAVal(cName, selize) {
    var key=null;
    if (selize && window.localStorage) {
    lssel=' ';
    for (var i=0; i<localStorage.length; i++) { // thanks to https://stackoverflow.com/questions/41271092/how-to-loop-through-localstorage-values
    key = localStorage.key(i);
    if (('' + key).indexOf(cName) == 0) {
    if (lssel.trim() == '') {
    lssel='<select id=sells onchange=gotothis(this.value);><option value=\"\">Recallable Steps below ...</option></select>';
    }
    lssel=lssel.replace('</select>', '<option value=\"' + decodeURIComponent(localStorage.getItem('' + key)) + '\">' + ('' + key).substring(eval('' + cName.length)).replace(/\_/g,' ').replace(/\-/g,' ') + '</option>' + '<option value=\"' + decodeURIComponent(localStorage.getItem('' + key).replace('http','HTTP')) + '#steps_' + ('' + key).substring(eval('' + cName.length)) + '\">Remove ' + ('' + key).substring(eval('' + cName.length)).replace(/\_/g,' ').replace(/\-/g,' ') + '</option>' + '</select>');
    }
    }
    if (lssel != '') {
    document.getElementById('ssel').innerHTML=lssel.trim();
    }
    }
    if (cName.indexOf('steps_') == 0) {
    if (window.localStorage) {
    if (decodeURIComponent(('' + localStorage.getItem(cName)).replace(/^undefined/g,'').replace(/^null/g,'')) != '') {
    return decodeURIComponent(localStorage.getItem(cName));
    }
    if (decodeURIComponent(('' + sessionStorage.getItem(cName)).replace(/^undefined/g,'').replace(/^null/g,'')) != '') {
    return decodeURIComponent(sessionStorage.getItem(cName));
    }
    }
    return '';
    }
    return '';
    }

    “; ?>
  • add a new …

    <a id=pcookie title='Recall this' class=share onclick="return emailit(estitle);" style='display:none;text-decoration:none;cursor:pointer;'>🍪</a>

    … emoji link for intersessional window.localStorage work that calls the email functionality modified Javascript function …
  • allowing a window.localStorage.setItem([Title (of steps)], encodeURIComponent([Content of steps])) to add a personalized and recallable record be kept on the web browser of use … recallable via …
  • new dropdown populated with existant such records, as well as a dropdown option allowing the user to remove said records, too … which …
  • can navigate the user to this recallable Steps idea in a new webpage incarnation …
  • a dropdown arrangement which is intersessional as well as intrasessional by nature, and personalized to that user’s use of the web browser on that device in question

… in our changed PHP coded My Recipe Steps web application you can also try below.


Previous relevant PHP Image GraphViz via Pear on AlmaLinux Sharing Tutorial is shown below.

PHP Image GraphViz via Pear on AlmaLinux Sharing Tutorial

PHP Image GraphViz via Pear on AlmaLinux Sharing Tutorial

Adding to yesterday’s PHP Image GraphViz via Pear on AlmaLinux Primer Tutorial

  • on many mobile devices the horizontally spreading right cell arrangements has been improved by laying out these textarea elements vertically now …
  • hashtagged URL mailto: and/or sms: “a” links to email and/or SMS communication conduits, respectively …
    <?php echo ”

    var anyhashes='';
    var aone=1;
    var tdc=0;

    function checkforlh() {
    aone=1;
    if (('' + location.hash.indexOf('dtitle')) != -1) {
    if (('' + location.hash.indexOf('dtitle=')) != -1) {
    document.getElementById('therest').value=decodeURIComponent(('' + location.hash).split('dtitle=')[1].split('#')[0].split(encodeURIComponent('#'))[0]);
    document.getElementById('therest').name='dtitle';
    } else if (('' + location.hash.indexOf('dtitle' + encodeURIComponent('='))) != -1) {
    document.getElementById('therest').value=decodeURIComponent(('' + location.hash).split('dtitle' + encodeURIComponent('='))[1].split('#')[0].split(encodeURIComponent('#'))[0]);
    document.getElementById('therest').name='dtitle';
    }
    }
    var retv='';
    while (('' + location.hash.indexOf('step' + aone)) != -1) {
    if (('' + location.hash.indexOf('step' + aone + '=')) != -1) {
    if (aone <= 1) {
    document.getElementById('tdi' + aone).value=decodeURIComponent(('' + location.hash).split('step' + aone + '=')[1].split('#')[0].split(encodeURIComponent('#'))[0]);
    } else {
    document.getElementById('tdi' + aone).value=decodeURIComponent(('' + location.hash).split('step' + aone + '=')[1].split('#')[0].split(encodeURIComponent('#'))[0]);
    obl(document.getElementById('tdi' + aone), true); //document.getElementById('tdi' + aone).blur();
    if ( document.getElementById('tdi' + eval(1 + aone))) {
    document.getElementById('tdi' + eval(1 + aone)).focus();
    }
    }
    } else if (('' + location.hash.indexOf('step' + aone + encodeURIComponent('='))) != -1) {
    if (aone <= 1) {
    document.getElementById('tdi' + aone).value=decodeURIComponent(('' + location.hash).split('step' + aone + encodeURIComponent('='))[1].split('#')[0].split(encodeURIComponent('#'))[0]);
    } else {
    document.getElementById('tdi' + aone).value=decodeURIComponent(('' + location.hash).split('step' + aone + encodeURIComponent('='))[1].split('#')[0].split(encodeURIComponent('#'))[0]);
    obl(document.getElementById('tdi' + aone), true); //document.getElementById('tdi' + aone).blur();
    if ( document.getElementById('tdi' + eval(1 + aone))) {
    document.getElementById('tdi' + eval(1 + aone)).focus();
    }
    }
    }
    aone++;
    }
    if (aone > 1 || document.getElementById('therest').value != '') { anyhashes=('' + location.hash).replace(/\%23/g,'#'); setTimeout(function(){ if (confirm('Draw now (versus add more yourself)?') == true) { document.getElementById('mysub').click(); } }, 8000); }
    }

    “; ?>
    … help out with some new sharing functionalities

… so that “a procedure made up of steps” can now be shared and/or created collaboratively in our changed PHP coded My Recipe Steps web application.


Previous relevant PHP Image GraphViz via Pear on AlmaLinux Primer Tutorial is shown below.

PHP Image GraphViz via Pear on AlmaLinux Primer Tutorial

https://en.wikipedia.org/wiki/Graphviz

The term “GraphViz”

Graphviz (short for Graph Visualization Software) is a package of open-source tools initiated by AT&T Labs Research for drawing graphs (as in nodes and edges, not as in bar charts) specified in DOT language scripts having the file name extension “gv”. It also provides libraries for software applications to use the tools. Graphviz is free software licensed under the Eclipse Public License.

… we’ve learnt recently, means a lot of things, differently (nuanced) for a range of users, three that we’ve so far become aware of being …

  • the recent, alas now deprecated, Google Charts Image Charts GraphViz option means of drawing SVG graphics within an HTML image … we’ve known about before about yesterday
  • today’s interest, that being PHP Image GraphViz via Pear on AlmaLinux install, via the AlmaLinux cPanel “Module Installers” Pear installer page, means by which we can use GraphViz calls in PHP code … and, for the future …
  • GraphViz installs for Python via pip

… in amongst many others we’ve seen programmers using … totally cute, totally useful!

It seems with our PHP Image GraphViz via Pear on AlmaLinux as what looks like a very much “pared down” version of the last mode of use above, that we add constructed graph node or edge or cluster objects, and form them into SVG based HTML image elements. It’s look got me thinking “Steps”, then “Recipe Steps”, and back, quietly, to “Any Old Steps” as the day got more generic.

At first we got, as far as Recipes go (and here we thank Italian Wedding Soup for today’s inspiration), to …

  • cooking steps showing as Image GraphViz edge graphic components (having arrows connect ellipses containing text, a bit like Speech Bubbles) … and then trying to face the “real world” a user interested in recipes might want to see happen …
  • an Image GraphViz node graphic component whose wording could be a user supplied recipe Title along with a “URL” attribute link, optionally user supplied (via our HTML div SVG hosting ondblclick event allowing its contenteditable=true attribute and onblur event means by which these optional additional data items can enter the “mix”, if you’ll pardon the pun), probably pointing back to the original recipe information saucesource … and …
  • this title and/or “URL” and/or ingredient list (for example) can all be expressed as the “on hover” title attribute of the tailored user PHP webpage (yes, here we have PHP writing PHP) … and …
  • at least on Safari, given a recipe Title defined, we can arrange any browser context menu (ie. right click) over the HTML iframe hosted recipe content “Save Iframe As” option being able to download to a reasonably self explanatory download filename … and/or …
  • any web browser’s Add Bookmark functionality can be harnessed to help the user out in such a way that our PHP coded My Recipe Steps web application could end up being your one stop shop “Recipe Organizer” online?!

See what we mean below …


Previous relevant Google Chart Image Chart Angled Text Annotation Tutorial is shown below.

Google Chart Image Chart Angled Text Annotation Tutorial

Google Chart Image Chart Angled Text Annotation Tutorial

It’s Tuesday, in places around the world, looking back at yesterday’s Google Chart Image Chart Image Map Event Editing Tutorial. Can’t help but think we’ve forgotten something. Ah yes …

You talkin’ to me? You talkin’ to me? Meanwhile, back at the questions! Welcome back, Mr De Niro, sir. We hope your Tuesday is treating you well. (Rhetorical. Let it please be Rhetorical … oh dear God … it must be Rhetorical … it must be Rhetorical) We have news regarding “the dosh” (wink, wink) we were discussing the other day. You see …

Better to be king for a night than schmuck for a lifetime. Well, at least it’s not a question. … the thing is, silly us, it turns out that angled text issue was not a problem with [element].getBoundingClientRect() but how the PHP GD imagettftext text placement emanated from the bottom left of the text always, Mr De Niro sir.

Never rat on your friends and always keep your mouth shut. Really wish we could! Yes, Mr De Niro, sir, but, you see this means the rats are completely out of the picture, just leaving us with our money spinner. Right, Mr De Niro … sir.

There are three ways of doing things around here: the right way, the wrong way and the way that I do it. [Exeunt: Stage right] Well, that’s odd? Mr De Niro wasn’t interested in the quadrant nature to our problem solution …


var rectex=extents[eval(-1 + extents.length)].getBoundingClientRect();
if (document.URL.indexOf('debug=') != -1) {
document.body.innerHTML+='<div style="position:absolute;border:1px solid rgba(255,0,0,0.5);top:' + rectex.top + 'px;left:' + rectex.left + 'px;width:' + rectex.width + 'px;height:' + rectex.height + 'px;z-index:200;" title="position:absolute;border:1px solid rgba(255,0,0,0.5);top:' + rectex.top + 'px;left:' + rectex.left + 'px;width:' + rectex.width + 'px;height:' + rectex.height + 'px;z-index:200;"></div>';
}

var invs=inv.split('.'); // angled text origin depends on angle quadrant
var wasi=inv;
var theang=eval('' + fsx);
//alert('' + inv + ' ' + theang);

if (eval('' + invs.length) > 2 && inv.indexOf(',') != -1) {
//alert('' + rectex.width + 'x' + rectex.height + ' ' + ';' + rectex.top + 'vs' + rectex.bottom + ' ' + ';' + rectex.left + 'vs' + rectex.right + ' ' + inv + ' ' + extents[-1 + extents.length].outerHTML + ' ' + rectex.x + '+' + rectex.y);
if (7 == 8) {
inv=inv.replace(invs[0], '' + Math.floor(eval(rectex.left + rectex.width / 2)));
} else {
if (theang > (315 + 45) || theang < (45 + 45)) {
inv=inv.replace(invs[0], '' + Math.floor(eval(rectex.left * 1 + rectex.right * 0 + 0 * rectex.width / 2)));
} else if (theang >= (45 + 45) && theang <= (135 + 45)) {
inv=inv.replace(invs[0], '' + Math.floor(eval(rectex.left * 0 + rectex.right * 1 + 0 * rectex.width / 2)));
} else if (theang >= (225 + 45) && theang <= (315 + 45)) {
inv=inv.replace(invs[0], '' + Math.floor(eval(rectex.left * 1 + rectex.right * 0 + 0 * rectex.width / 2)));
} else {
inv=inv.replace(invs[0], '' + Math.floor(eval(rectex.left * 0 + rectex.right * 1 + 0 * rectex.width / 2)));
}
}


if (7 == 8) {
inv=inv.replace(',' + invs[1].split(',')[1], ',' + Math.floor(eval(rectex.top + rectex.height / 2)));
} else {
if (theang > (315 + 45) || theang < (45 + 45)) {
inv=inv.replace(',' + invs[1].split(',')[1], ',' + Math.floor(eval(rectex.top * 0 + rectex.bottom * 1 + 0 * rectex.height / 2)));
//alert('' + wasi + ' vs ' + inv + ' ' + invs.length);
} else if (theang >= (225 + 45) && theang <= (315 + 45)) {
inv=inv.replace(',' + invs[1].split(',')[1], ',' + Math.floor(eval(rectex.top * 1 + rectex.bottom * 0 + 0 * rectex.height / 2)));
} else if (theang >= (45 + 45) && theang < (135 + 45)) {
inv=inv.replace(',' + invs[1].split(',')[1], ',' + Math.floor(eval(rectex.top * 0 + rectex.bottom * 1 + 0 * rectex.height / 2)));
} else {
inv=inv.replace(',' + invs[1].split(',')[1], ',' + Math.floor(eval(rectex.top * 1 + rectex.bottom * 0 + 0 * rectex.height / 2)));
}
}


//alert('was=' + wasi + ' and now=' + inv);
} else if (eval('' + invs.length) == 2 && inv.indexOf(',') != -1) {
//alert('' + rectex.width + 'x' + rectex.height + ' ' + ';' + rectex.top + 'vs' + rectex.bottom + ' ' + ';' + rectex.left + 'vs' + rectex.right + ' ' + inv + ' ' + extents[-1 + extents.length].outerHTML + ' ' + rectex.x + '+' + rectex.y);
if (theang > (315 + 45) || theang < (45 + 45)) {
inv=inv.replace(invs[0], '' + Math.floor(eval(rectex.left * 1 + rectex.right * 0 + 0 * rectex.width / 2)));
} else if (theang >= (45 + 45) && theang <= (135 + 45)) {
inv=inv.replace(invs[0], '' + Math.floor(eval(rectex.left * 0 + rectex.right * 1 + 0 * rectex.width / 2)));
} else if (theang >= (225 + 45) && theang <= (315 + 45)) {
inv=inv.replace(invs[0], '' + Math.floor(eval(rectex.left * 1 + rectex.right * 0 + 0 * rectex.width / 2)));
} else {
inv=inv.replace(invs[0], '' + Math.floor(eval(rectex.left * 0 + rectex.right * 1 + 0 * rectex.width / 2)));
}
invs=inv.split(',');
if (theang > (315 + 45) || theang <= (45 + 45)) {
inv=inv.replace(',' + invs[1].split(',')[0].split('.')[0], ',' + Math.floor(eval(rectex.top * 0 + rectex.bottom * 1 + 0 * rectex.height / 2)));
//alert('' + wasi + ' vs ' + inv + ' ' + invs.length);
} else if (theang >= (225 + 45) && theang <= (315 + 45)) {
inv=inv.replace(',' + invs[1].split(',')[0].split('.')[0], ',' + Math.floor(eval(rectex.top * 1 + rectex.bottom * 0 + 0 * rectex.height / 2)));
} else if (theang >= (45 + 45) && theang < (135 + 45)) {
inv=inv.replace(',' + invs[1].split(',')[0].split('.')[0], ',' + Math.floor(eval(rectex.top * 0 + rectex.bottom * 1 + 0 * rectex.height / 2)));
} else {
inv=inv.replace(',' + invs[1].split(',')[0].split('.')[0], ',' + Math.floor(eval(rectex.top * 1 + rectex.bottom * 0 + 0 * rectex.height / 2)));
}
//alert('was=' + wasi + ' and now=' + inv);
}

… that temporary div element text border drawing, being the crucial way to find out what was happening, and showing us, at least on Google Chrome web browser, not to worry so much about [element].getBoundingClientRect() results for transformed HTML elements. And that is a huge relief in itself.

Also taking up a lot of today, we shored up Image Map Event Editing results bubbling through to an email or SMS recipient. The size of this data, and an analysis of …

  • client pre-emptive iframe … versus …
  • Ajax methodologies

… when it comes to complex and sizeable data such as “Javascript scripting” is, we should start swinging towards Ajax thinking, even pinching it off a client pre-emptive iframe onload event logic thought/start sometimes …


var myxhr=null, rawhtml='';
var zhr=null, zform=null;

function stateChanged() {
if (myxhr.readyState == 4) {
if (myxhr.status == 200) {
console.log('myxhr=' + myxhr);
rawhtml = myxhr.responseText.replace(/\\"/g, '"').replace(/\\'/g, "'");
if (document.getElementById('jdiv')) {
//alert('1:' + rawhtml);
//alert('21111 ' + rawhtml.split('<scr')[1]);
document.getElementById('jdiv').innerHTML=rawhtml.split('<scr')[0]; //xaconto.body.innerHTML;
//alert(31111);
if (document.getElementById('talkimg')) {
document.getElementById('talkimg').useMap='#mymap';
} else {
document.getElementById('myvenn').useMap='#mymap';
}
//alert(41111);
} else {
document.body.innerHTML+=rawhtml.split('<scr')[0]; //xaconto.body.innerHTML;
if (document.getElementById('talkimg')) {
document.getElementById('talkimg').useMap='#mymap';
} else {
document.getElementById('myvenn').useMap='#mymap';
}
}
if (rawhtml.indexOf('<scr') != -1) {

if (1 == 1) {
var tag = document.createElement('script');
var nextsep=rawhtml.split('<scr')[1].split('>')[0] + '>';
//var qw=prompt(rawhtml.split('<scr')[1].split(nextsep)[1].split('</scri')[0],rawhtml.split('<scr')[1].split(nextsep)[1].split('</scri')[0]);
//alert('2:' + rawhtml.split('<scr')[1].split(nextsep)[1].split('</scri')[0]);
tag.innerHTML = rawhtml.split('<scr')[1].split(nextsep)[1].split('</scri')[0];
var firstScriptTag = document.getElementsByTagName('script')[eval(-1 + document.getElementsByTagName('script').length)];
firstScriptTag.insertAdjacentElement("afterend", tag);
}

}
}
}
}

function prehrefcheck(inso) {
if (obsuffix != '') {
zhr = new XMLHttpRequest();
zform = new FormData();
if (decodeURIComponent(obsuffix.replace('&thescript=','')).indexOf('<scr') == -1) {
zform.append('scrstuff', ('<scr' + 'ipt type="text/javascript"> ' + decodeURIComponent(obsuffix.replace('&thescript=','')) + ' </scr' + 'ipt>').replace(/\ \ \ /g, String.fromCharCode(9)).replace(/\+\=/g, ' += '));
} else {
zform.append('scrstuff', ('<scr' + decodeURIComponent(obsuffix.replace('&thescript=','')).split('<scr')[1]).replace(/\ \ \ /g, String.fromCharCode(9)).replace(/\+\=/g, ' += '));
}
if (jufr == '') {
jufr='_' + Math.floor(Math.random() * 19878675);
}
zform.append('ufr', jufr);
zhr.responseType='Document';
zhr.open('post', '//www.rjmprogramming.com.au/ITblog/' + Math.min(550,window.innerWidth) + '/' + Math.min(350,window.innerHeight) + '/?cht=' + ctype, true);
zhr.send(zform);
}
}

function sofarpj(iois) {
var aname='', partsare=[], ipis=0, areabits='', repfrom='', repto='', iv=0, variety=String.fromCharCode(10) + ' var variety=[]; ' + String.fromCharCode(10);
while (thescript.indexOf(' var variety' + ('' + iv).replace(/^0$/g, '') + '=') != -1) {
repfrom='[' + thescript.split(' var variety' + ('' + iv).replace(/^0$/g, '') + '=[')[1].split('];')[0] + '];';
iv++;
}
if (iv > 0) { variety=String.fromCharCode(10) + ' var variety' + iv + '=[]; ' + String.fromCharCode(10); }
if (iois.src != '') {
var aconto = (iois.contentWindow || iois.contentDocument);
if (aconto != null) {
if (aconto.document) { aconto = aconto.document; }
if (aconto.body.innerHTML.indexOf('<scr') != -1 || document.URL.indexOf('ufr=') != -1) {
if (document.URL.indexOf('ufr=') != -1) {
if (!document.getElementById('jdiv')) {
document.body.innerHTML+='<div id=jdiv></div>';
}
//thescript='';
myxhr = new XMLHttpRequest();
myxhr.open('GET', '//www.rjmprogramming.com.au/presentation' + (location.search.split('ufr=')[1] ? decodeURIComponent(location.search.split('ufr=')[1].split('&')[0]) : '') + '.html', true);
myxhr.responseType = "text";
myxhr.onreadystatechange=stateChanged;
myxhr.send(null);
} else if (aconto.body.innerHTML.indexOf('<scr') != -1) {

thescript='<scr' + aconto.body.innerHTML.split('<scr')[1];
var tag = document.createElement('script');
var nextsep=thescript.split('<scr')[1].split('>')[0] + '>';
tag.innerHTML = thescript.split('<scr')[1].split(nextsep)[1].split('</scri')[0];
var firstScriptTag = document.getElementsByTagName('script')[eval(-1 + document.getElementsByTagName('script').length)];
firstScriptTag.insertAdjacentElement("afterend", tag);
}
}
pjsbih=aconto.body.innerHTML.split('<scr')[0];
if (lastpjsbih != '' && pjsbih != lastpjsbih.replace(/\ $/g,'')) {
//alert('Found new Image Map data of ' + pjsbih);
// {"chartshape":[{"name":"axis0_0","type":"RECT","coords":[21,336,28,344]},{"name":"axis0_1","type":"RECT","coords":[65,336,77,344]},{"name":"axis0_2","type":"RECT","coords":[111,336,124,344]},{"name":"axis0_3","type":"RECT","coords":[158,336,170,344]},{"name":"axis0_4","type":"RECT","coords":[204,336,217,344]},{"name":"axis0_5","type":"RECT","coords":[251,336,263,344]},{"name":"axis0_6","type":"RECT","coords":[297,336,310,344]},{"name":"axis0_7","type":"RECT","coords":[344,336,356,344]},{"name":"axis0_8","type":"RECT","coords":[390,336,403,344]},{"name":"axis0_9","type":"RECT","coords":[437,336,449,344]},{"name":"axis0_10","type":"RECT","coords":[480,336,499,344]},{"name":"axis1_0","type":"RECT","coords":[14,326,20,334]},{"name":"axis1_1","type":"RECT","coords":[8,297,20,305]},{"name":"axis1_2","type":"RECT","coords":[8,267,20,275]},{"name":"axis1_3","type":"RECT","coords":[8,237,20,245]},{"name":"axis1_4","type":"RECT","coords":[8,208,20,216]},{"name":"axis1_5","type":"RECT","coords":[8,178,20,186]},{"name":"axis1_6","type":"RECT","coords":[8,148,20,156]},{"name":"axis1_7","type":"RECT","coords":[8,119,20,127]},{"name":"axis1_8","type":"RECT","coords":[8,89,20,97]},{"name":"axis1_9","type":"RECT","coords":[8,59,20,67]},{"name":"axis1_10","type":"RECT","coords":[2,29,20,37]},{"name":"legend0","type":"RECT","coords":[500,167,512,179]},{"name":"legend1","type":"RECT","coords":[500,185,512,197]},{"name":"circle0","type":"CIRCLE","coords":[80,39,4]},{"name":"circle1","type":"CIRCLE","coords":[429,152,1]},{"name":"circle2","type":"CIRCLE","coords":[373,250,3]},{"name":"circle3","type":"CIRCLE","coords":[215,230,4]},{"name":"circle4","type":"CIRCLE","coords":[131,164,2]},{"name":"circle5","type":"CIRCLE","coords":[471,96,5]},{"name":"circle6","type":"CIRCLE","coords":[341,158,3]},{"name":"circle7","type":"CIRCLE","coords":[355,111,5]},{"name":"circle8","type":"CIRCLE","coords":[183,277,3]},{"name":"circle9","type":"CIRCLE","coords":[66,105,3]}]}
if (pjsbih.replace(/\[\]/g, '').indexOf('[') != -1) {
partsare=pjsbih.split('","coords":[');
for (ipis=1; ipis<partsare.length; ipis++) {
if (partsare[eval(-1 + ipis)].split('"')[eval(-1 + partsare[eval(-1 + ipis)].split('"').length)] == 'RECT') {
aname=partsare[eval(-1 + ipis)].split('"name":"')[eval(-1 + partsare[eval(-1 + ipis)].split('"name":"').length)].split('"')[0];
if (variety.indexOf(aname.split('_')[0].split('0')[0].split('1')[0].split('2')[0].split('3')[0].split('4')[0].split('5')[0].split('6')[0].split('7')[0].split('8')[0].split('9')[0] + '/rect') == -1) {
if (variety.indexOf('[]') != -1) {
variety=variety.replace("[]", "['" + aname.split('_')[0].split('0')[0].split('1')[0].split('2')[0].split('3')[0].split('4')[0].split('5')[0].split('6')[0].split('7')[0].split('8')[0].split('9')[0] + '/rect' + "']");
} else {
variety=variety.replace("]", ",'" + aname.split('_')[0].split('0')[0].split('1')[0].split('2')[0].split('3')[0].split('4')[0].split('5')[0].split('6')[0].split('7')[0].split('8')[0].split('9')[0] + '/rect' + "']");
}
repto='[' + variety.split('[')[1].split('];')[0] + '];';
}
areabits+='<area onmousedown=defclick(event); ondblclick=defclick(event); oncontextmenu=defclick(event); ontouchend=defclick(event); ontouchstart=defclick(event); onmouseout=defclick(event); onmousemove=defclick(event); ontouchdown=defclick(event); onmouseover=defclick(event); shape="rect" coords="' + partsare[ipis].split(']')[0] + '" id="' + aname + '" name="' + aname + '" alt="' + aname + '" onclick="' + "youralert(this,'This feature name is " + aname + "'" + ');" nohref>';
} else if (partsare[eval(-1 + ipis)].split('"')[eval(-1 + partsare[eval(-1 + ipis)].split('"').length)] == 'CIRCLE') {
aname=partsare[eval(-1 + ipis)].split('"name":"')[eval(-1 + partsare[eval(-1 + ipis)].split('"name":"').length)].split('"')[0];
if (variety.indexOf(aname.split('_')[0].split('0')[0].split('1')[0].split('2')[0].split('3')[0].split('4')[0].split('5')[0].split('6')[0].split('7')[0].split('8')[0].split('9')[0] + '/circle') == -1) {
if (variety.indexOf('[]') != -1) {
variety=variety.replace("[]", "['" + aname.split('_')[0].split('0')[0].split('1')[0].split('2')[0].split('3')[0].split('4')[0].split('5')[0].split('6')[0].split('7')[0].split('8')[0].split('9')[0] + '/circle' + "']");
} else {
variety=variety.replace("]", ",'" + aname.split('_')[0].split('0')[0].split('1')[0].split('2')[0].split('3')[0].split('4')[0].split('5')[0].split('6')[0].split('7')[0].split('8')[0].split('9')[0] + '/circle' + "']");
}
repto='[' + variety.split('[')[1].split('];')[0] + '];';
}
areabits+='<area onmousedown=defclick(event); ondblclick=defclick(event); oncontextmenu=defclick(event); ontouchend=defclick(event); ontouchstart=defclick(event); onmouseout=defclick(event); onmousemove=defclick(event); ontouchdown=defclick(event); onmouseover=defclick(event); shape="circle" coords="' + partsare[ipis].split(']')[0] + '" id="' + aname + '" name="' + aname + '" alt="' + aname + '" onclick="' + "youralert(this,'This feature name is " + aname + "'" + ');" nohref>';
} else if (partsare[eval(-1 + ipis)].split('"')[eval(-1 + partsare[eval(-1 + ipis)].split('"').length)] == 'POLY') {
aname=partsare[eval(-1 + ipis)].split('"name":"')[eval(-1 + partsare[eval(-1 + ipis)].split('"name":"').length)].split('"')[0];
if (variety.indexOf(aname.split('_')[0].split('0')[0].split('1')[0].split('2')[0].split('3')[0].split('4')[0].split('5')[0].split('6')[0].split('7')[0].split('8')[0].split('9')[0] + '/poly') == -1) {
if (variety.indexOf('[]') != -1) {
variety=variety.replace("[]", "['" + aname.split('_')[0].split('0')[0].split('1')[0].split('2')[0].split('3')[0].split('4')[0].split('5')[0].split('6')[0].split('7')[0].split('8')[0].split('9')[0] + '/poly' + "']");
} else {
variety=variety.replace("]", ",'" + aname.split('_')[0].split('0')[0].split('1')[0].split('2')[0].split('3')[0].split('4')[0].split('5')[0].split('6')[0].split('7')[0].split('8')[0].split('9')[0] + '/poly' + "']");
}
repto='[' + variety.split('[')[1].split('];')[0] + '];';
}
areabits+='<area onmousedown=defclick(event); ondblclick=defclick(event); oncontextmenu=defclick(event); ontouchend=defclick(event); ontouchstart=defclick(event); onmouseout=defclick(event); onmousemove=defclick(event); ontouchdown=defclick(event); onmouseover=defclick(event); shape="poly" coords="' + partsare[ipis].split(']')[0] + '" id="' + aname + '" name="' + aname + '" alt="' + aname + '" onclick="' + "youralert(this,'This feature name is " + aname + "'" + ');" nohref>';
}
}
document.getElementById('mymap').innerHTML=areabits + '<area' + atend.split('<area')[1].split('>')[0] + '>'; //"<area onclick=defclick(event); shape='default' nohref>";
if (repto.replace('[];','') != '' && repfrom != '') { thescript=thescript.replace(repfrom, repto); } else if (thescript.indexOf('[' + variety.split('[')[1]) == -1) { thescript=thescript.replace('>', '>' + variety); }
origmap=document.getElementById('mymap').outerHTML + thescript;
}
} else if (lastpjsbih != '') {
//alert('Found the same ' + pjsbih);
if (pjsbih.replace(/\[\]/g, '').indexOf('[') != -1) {
partsare=pjsbih.split('","coords":[');
for (ipis=1; ipis<partsare.length; ipis++) {
if (partsare[eval(-1 + ipis)].split('"')[eval(-1 + partsare[eval(-1 + ipis)].split('"').length)] == 'RECT') {
aname=partsare[eval(-1 + ipis)].split('"name":"')[eval(-1 + partsare[eval(-1 + ipis)].split('"name":"').length)].split('"')[0];
if (variety.indexOf(aname.split('_')[0].split('0')[0].split('1')[0].split('2')[0].split('3')[0].split('4')[0].split('5')[0].split('6')[0].split('7')[0].split('8')[0].split('9')[0] + '/rect') == -1) {
if (variety.indexOf('[]') != -1) {
variety=variety.replace("[]", "['" + aname.split('_')[0].split('0')[0].split('1')[0].split('2')[0].split('3')[0].split('4')[0].split('5')[0].split('6')[0].split('7')[0].split('8')[0].split('9')[0] + '/rect' + "']");
} else {
variety=variety.replace("]", ",'" + aname.split('_')[0].split('0')[0].split('1')[0].split('2')[0].split('3')[0].split('4')[0].split('5')[0].split('6')[0].split('7')[0].split('8')[0].split('9')[0] + '/rect' + "']");
}
repto='[' + variety.split('[')[1].split('];')[0] + '];';
}
areabits+='<area onmousedown=defclick(event); ondblclick=defclick(event); oncontextmenu=defclick(event); ontouchend=defclick(event); ontouchstart=defclick(event); onmouseout=defclick(event); onmousemove=defclick(event); ontouchdown=defclick(event); onmouseover=defclick(event); shape="rect" coords="' + partsare[ipis].split(']')[0] + '" id="' + aname + '" name="' + aname + '" alt="' + aname + '" onclick="' + "youralert(this,'This feature name is " + aname + "'" + ');" nohref>';
} else if (partsare[eval(-1 + ipis)].split('"')[eval(-1 + partsare[eval(-1 + ipis)].split('"').length)] == 'CIRCLE') {
aname=partsare[eval(-1 + ipis)].split('"name":"')[eval(-1 + partsare[eval(-1 + ipis)].split('"name":"').length)].split('"')[0];
if (variety.indexOf(aname.split('_')[0].split('0')[0].split('1')[0].split('2')[0].split('3')[0].split('4')[0].split('5')[0].split('6')[0].split('7')[0].split('8')[0].split('9')[0] + '/circle') == -1) {
if (variety.indexOf('[]') != -1) {
variety=variety.replace("[]", "['" + aname.split('_')[0].split('0')[0].split('1')[0].split('2')[0].split('3')[0].split('4')[0].split('5')[0].split('6')[0].split('7')[0].split('8')[0].split('9')[0] + '/circle' + "']");
} else {
variety=variety.replace("]", ",'" + aname.split('_')[0].split('0')[0].split('1')[0].split('2')[0].split('3')[0].split('4')[0].split('5')[0].split('6')[0].split('7')[0].split('8')[0].split('9')[0] + '/circle' + "']");
}
repto='[' + variety.split('[')[1].split('];')[0] + '];';
}
areabits+='<area onmousedown=defclick(event); ondblclick=defclick(event); oncontextmenu=defclick(event); ontouchend=defclick(event); ontouchstart=defclick(event); onmouseout=defclick(event); onmousemove=defclick(event); ontouchdown=defclick(event); onmouseover=defclick(event); shape="circle" coords="' + partsare[ipis].split(']')[0] + '" id="' + aname + '" name="' + aname + '" alt="' + aname + '" onclick="' + "youralert(this,'This feature name is " + aname + "'" + ');" nohref>';
} else if (partsare[eval(-1 + ipis)].split('"')[eval(-1 + partsare[eval(-1 + ipis)].split('"').length)] == 'POLY') {
aname=partsare[eval(-1 + ipis)].split('"name":"')[eval(-1 + partsare[eval(-1 + ipis)].split('"name":"').length)].split('"')[0];
if (variety.indexOf(aname.split('_')[0].split('0')[0].split('1')[0].split('2')[0].split('3')[0].split('4')[0].split('5')[0].split('6')[0].split('7')[0].split('8')[0].split('9')[0] + '/poly') == -1) {
if (variety.indexOf('[]') != -1) {
variety=variety.replace("[]", "['" + aname.split('_')[0].split('0')[0].split('1')[0].split('2')[0].split('3')[0].split('4')[0].split('5')[0].split('6')[0].split('7')[0].split('8')[0].split('9')[0] + '/poly' + "']");
} else {
variety=variety.replace("]", ",'" + aname.split('_')[0].split('0')[0].split('1')[0].split('2')[0].split('3')[0].split('4')[0].split('5')[0].split('6')[0].split('7')[0].split('8')[0].split('9')[0] + '/poly' + "']");
}
repto='[' + variety.split('[')[1].split('];')[0] + '];';
}
areabits+='<area onmousedown=defclick(event); ondblclick=defclick(event); oncontextmenu=defclick(event); ontouchend=defclick(event); ontouchstart=defclick(event); onmouseout=defclick(event); onmousemove=defclick(event); ontouchdown=defclick(event); onmouseover=defclick(event); shape="poly" coords="' + partsare[ipis].split(']')[0] + '" id="' + aname + '" name="' + aname + '" alt="' + aname + '" onclick="' + "youralert(this,'This feature name is " + aname + "'" + ');" nohref>';
}
}
document.getElementById('mymap').innerHTML=areabits + '<area' + atend.split('<area')[1].split('>')[0] + '>'; //"<area onclick=defclick(event); shape='default' nohref>";
if (repto.replace('[];','') != '' && repfrom != '') { thescript=thescript.replace(repfrom, repto); } else if (thescript.indexOf('[' + variety.split('[')[1]) == -1) { thescript=thescript.replace('>', '>' + variety); }
origmap=document.getElementById('mymap').outerHTML + thescript;
}
}
lastpjsbih=pjsbih;
}
}
}


cimg=new Image;

cimg.onload = function(){
var honebit="<h2><span onclick=\"location.href=document.URL.split('?')[0].split('#')[0];\" title=Reset style=cursor:pointer;>Interfacing</span> to <a target=_blank href='https://developers.google.com/chart/interactive/docs/index' title='Google Chart Tools provide a perfect way to visualize data on your website. From simple line charts to complex hierarchical tree maps, the chart galley provides a large number of well-designed chart types. Populating your data is easy using the provided client- and server-side tools.'>Google Charts</a> <a target=_blank title='Google Charts Image Chart' href='https://developers.google.com/chart/image/docs/gallery/chart_gall'>Image Chart</a></h2><h4 id=myh3>RJM Programming - November, 2023</h4>";
var hthreebit="";
document.body.style.backgroundColor='transparent';
document.body.innerHTML=agscript.replace("'';", "'" + cht.replace('_','') + "';").replace('<canvas ','<canvas width=' + cimg.width + ' height=' + cimg.height + ' ') + "<table><tr><td><img style='border-right:1px dotted pink;border-bottom:1px dotted pink;' ondblclick=\"window.open(document.URL.split('?')[0].split('#')[0],'_blank','top=50,left=50,width=600,height=600');\" title='Talk image that will update over time (double click for Google Chart Image Chart interfacing) ... " + ("" + (new Date())) + "' id=talkimg src='" + cimg.src + "?rand=" + Math.floor(Math.random() * 198786754) + "' usemap='#mymap'></img></td><td id=tdtr style=\"opacity:0.0;background-image:url(" + cimg.src.replace('presentation_', 'presentation__') + "),url(" + cimg.src + "?rand=0);background-position:0% 0%,50% 0%;background-size:50% 50%,50% 50%;background-repeat:no-repeat,no-repeat;\"></td></tr><tr><td id=tdbl>" + honebit + hthreebit + "</td><td><img style='border-right:1px dotted pink;border-bottom:1px dotted pink;' ondblclick=\"window.open(document.URL.split('?')[0].split('#')[0],'_blank','top=50,left=50,width=600,height=600');\" title='Talk first and last images that will update over time (double click for Google Chart Image Chart interfacing) ... " + ("" + (new Date())) + "' id=talkimgg src='" + cimg.src.replace('.png','.gif') + "?rand=" + Math.floor(Math.random() * 198786754) + "'></img></td></tr></table><div id=idiv></div><iframe onload=mapsofarpj(this); id=mappjs style=display:none; src=></iframe><div id=jdiv></div>";
document.body.style.cursor='progress';
if (cht.substring(0,1) == '_') {
//alert('//www.rjmprogramming.com.au/presentation' + cht + '.html_GETME');
if (1 == 1) {
myxhr = new XMLHttpRequest();
myxhr.open('GET', '//www.rjmprogramming.com.au/presentation' + cht + '.html', true);
myxhr.responseType = "text";
myxhr.onreadystatechange=stateChanged;
myxhr.send(null);
} else {

document.getElementById('mappjs').src='//www.rjmprogramming.com.au/presentation' + cht + '.html';
}
setTimeout(canvinit, 5000);
}
setTimeout(talkupdate, eightthousand);
};

cimg.src='//www.rjmprogramming.com.au/presentation' + cht + '.png';
return '';
}

… in the changed latest draft image_venn.html Google Chart Image Chart Venn Chart or Scatter Chart or GraphViz Chart or Pie Chart or Line Chart or Bar Chart or Candlestick/Box Chart or Google-O-Meter Chart or Radar Chart or Map Chart interfacing web application you can also try below.


Previous relevant Google Chart Image Chart Image Map Event Editing Tutorial is shown below.

Google Chart Image Chart Image Map Event Editing Tutorial

Google Chart Image Chart Image Map Event Editing Tutorial

If we are talking “layers” (of functionality) again, onto the progress that yesterday’s Google Chart Image Chart Image Map Events Tutorial represented, then , it is logical …

  • that if yesterday we presented some programmer defined image map event logic … then, today, we’d want to …
  • offer the user the chance to change that default programmer defined image map event logic, to that of their own design

… in the form of

  • user defined Javascript .. editable in a …
  • HTML textarea element

… and then the coding latching onto a document.createElement(‘script’) paradigm, to add Javascript clientside logic, on the fly.

There’s a first time we can remember aspect to how we present these possibilities to the user. We present it in …

  • amongst the inhouse annotation options … as a …
  • “reveal” pairing of HTML5 details/summary element combination look … the first time we can remember aspect to that being …
  • only initially displaying within the details element innerHTML is a summary element nesting a single “icon like” image (like the other “inhouse annotation” icon images) … but if clicked …
  • the details innerHTML has added to it a textarea element …

    function fillindetsed(odet) {
    if (odet.innerHTML.split('</summary>')[1] == '') {
    document.getElementById('tdleft').style.verticalAlign='top';
    var onls=thescript.split('<scr' + 'ipt type="text/javascript">');
    var onlstuff=onls[1].split('</sc' + 'ript>')[0];
    odet.innerHTML+='<scr' + 'ipt type="text/javascript">' + "<br><textarea onblur=tproc(this); id=tscript rows=100 cols=80 value=''>" + onlstuff + "</textarea><br></script>";
    //odet.innerHTML+='<scr' + 'ipt type="text/javascript">' + "<br><textarea onblur=tproc(this); id=tscript rows=100 cols=80 value=''>" + encodeURIComponent(onlstuff) + "</textarea><br></script>";
    //document.getElementById('tscript').value=decodeURIComponent(document.getElementById('tscript').innerHTML);
    }
    }

… from which document.createElement(‘script’) code onblur event logic emanates …


function tproc(ota) {
//alert(ota.value);
var tag = document.createElement('script');
if (1 == 1) {
obsuffix='&thescript=' + encodeURIComponent(ota.value);
if (document.getElementById('aemail')) {
hrefcheck(document.getElementById('aemail'));
}
//alert('<scr' + 'ipt type="text/javascript"> ' + String.fromCharCode(10) + ota.value + String.fromCharCode(10) + ' </scr' + 'ipt>');
tag.innerHTML = ' <scr'.substring(0,1) + 'ipt type="text/javascript"> '.slice(-1) + String.fromCharCode(10) + ota.value + String.fromCharCode(10) + ' </scr'.substring(0,1) + 'ipt> '.slice(-1);
document.getElementById('dmap').innerHTML=document.getElementById('mymap').outerHTML + ' <scr' + 'ipt type="text/javascript"> ' + String.fromCharCode(10) + ota.value + String.fromCharCode(10) + ' </scr' + 'ipt> ';
}
var firstScriptTag = document.getElementsByTagName('script')[eval(-1 + document.getElementsByTagName('script').length)];
//alert(tag.outerHTML);
firstScriptTag.insertAdjacentElement("afterend", tag);
//alert(ota.value);
document.getElementById('detsed').open=false;
}

… in the changed latest draft image_venn.html Google Chart Image Chart Venn Chart or Scatter Chart or GraphViz Chart or Pie Chart or Line Chart or Bar Chart or Candlestick/Box Chart or Google-O-Meter Chart or Radar Chart or Map Chart interfacing web application you can also try below.


Previous relevant Google Chart Image Chart Image Map Events Tutorial is shown below.

Google Chart Image Chart Image Map Events Tutorial

Google Chart Image Chart Image Map Events Tutorial

We really like HTML image maps, and it occurred to us with yesterday’s Google Chart Image Chart Image Map Tutorial we were hiding its light under some bushel somewhere, because …

  • yesterday we introduced with only the onclick event coded for in the HTML area subelements to the map parent element … linked to an …
  • associated img element … via an …
  • attribute called usemap … and two aspects, at the very least, to stuff under the bushel are …
    1. many more events than onclick can be defined as you define the area subelements … and here’s the kicker …
    2. you can add area subelement event logic that, on paper, would cause interference with other event logic (ie. the same event type in an event bubbling through scenario) but it won’t if you, as a programmer, turn that use of the usemap attribute on and off like a tap

… which, to our mind, represents the bee’s knees of event management. So useful!

To tip our toes into this woooorrrrrlllllddd we’ll show you some newly added area subelement event logics in a Google Chart Image Chart Radar Chart example below …


<map name="mymap" id="mymap"><area onmousedown="defclick(event);" ondblclick="defclick(event);" oncontextmenu="defclick(event);" ontouchend="defclick(event);" ontouchstart="defclick(event);" onmouseout="defclick(event);" onmousemove="defclick(event);" ontouchdown="defclick(event);" onmouseover="defclick(event);" shape="rect" coords="151,34,157,42" id="axis0_0" name="axis0_0" alt="axis0_0" onclick="youralert(this,'This feature name is axis0_0');" nohref=""><area onmousedown="defclick(event);" ondblclick="defclick(event);" oncontextmenu="defclick(event);" ontouchend="defclick(event);" ontouchstart="defclick(event);" onmouseout="defclick(event);" onmousemove="defclick(event);" ontouchdown="defclick(event);" onmouseover="defclick(event);" shape="rect" coords="281,110,288,118" id="axis0_1" name="axis0_1" alt="axis0_1" onclick="youralert(this,'This feature name is axis0_1');" nohref=""><area onmousedown="defclick(event);" ondblclick="defclick(event);" oncontextmenu="defclick(event);" ontouchend="defclick(event);" ontouchstart="defclick(event);" onmouseout="defclick(event);" onmousemove="defclick(event);" ontouchdown="defclick(event);" onmouseover="defclick(event);" shape="rect" coords="281,260,288,268" id="axis0_2" name="axis0_2" alt="axis0_2" onclick="youralert(this,'This feature name is axis0_2');" nohref=""><area onmousedown="defclick(event);" ondblclick="defclick(event);" oncontextmenu="defclick(event);" ontouchend="defclick(event);" ontouchstart="defclick(event);" onmouseout="defclick(event);" onmousemove="defclick(event);" ontouchdown="defclick(event);" onmouseover="defclick(event);" shape="rect" coords="151,336,157,344" id="axis0_3" name="axis0_3" alt="axis0_3" onclick="youralert(this,'This feature name is axis0_3');" nohref=""><area onmousedown="defclick(event);" ondblclick="defclick(event);" oncontextmenu="defclick(event);" ontouchend="defclick(event);" ontouchstart="defclick(event);" onmouseout="defclick(event);" onmousemove="defclick(event);" ontouchdown="defclick(event);" onmouseover="defclick(event);" shape="rect" coords="20,260,27,268" id="axis0_4" name="axis0_4" alt="axis0_4" onclick="youralert(this,'This feature name is axis0_4');" nohref=""><area onmousedown="defclick(event);" ondblclick="defclick(event);" oncontextmenu="defclick(event);" ontouchend="defclick(event);" ontouchstart="defclick(event);" onmouseout="defclick(event);" onmousemove="defclick(event);" ontouchdown="defclick(event);" onmouseover="defclick(event);" shape="rect" coords="20,110,27,118" id="axis0_5" name="axis0_5" alt="axis0_5" onclick="youralert(this,'This feature name is axis0_5');" nohref=""><area id="adef" onclick=" defclick(event); if (!done) { done=false; if (atstart) { normalcall=false; ask(null); normalcall=true; atstart=false; } else { ask(event); } } " shape="default" nohref=""></map>

… with new relevant event code snippet to help add intelligence to the event logic of our Google Chart Image Chart interfacing web application …


function defclick(evt) {
switch ('' + evt.type) {
case 'click':

alert('Welcome to RJM Programming interfacing to Google Charts Image Chart ' + cname);
break;

default:
switch (('' + evt.type + ' ').substring(0,5)) {
case 'mouse':
document.getElementById('myh3').innerHTML='RJM Programming - November, 2023 ... non-mobile mouse event ' + evt.type + ' called by ' + ('' + evt.target.id);
break;

case 'touch':
document.getElementById('myh3').innerHTML='RJM Programming - November, 2023 ... mobile touch event ' + evt.type + ' called by ' + ('' + evt.target.id);
break;

default:
alert(evt.type);
break;
}
break;
}

}

Interesting, huh?!

Feel free to try this out in the changed latest draft image_venn.html Google Chart Image Chart Venn Chart or Scatter Chart or GraphViz Chart or Pie Chart or Line Chart or Bar Chart or Candlestick/Box Chart or Google-O-Meter Chart or Radar Chart or Map Chart interfacing web application you can also try below.


Previous relevant Google Chart Image Chart Image Map Tutorial is shown below.

Google Chart Image Chart Image Map Tutorial

Google Chart Image Chart Image Map Tutorial

Do you like to come at explaining things in layers? Sort of like the analogy …

  • you start a project thinking of it in terms of “2D” … and then to move forward …
  • you spend a day making it work for “3D” (and keep the “2D” working as well)

… or …

  • you start a web application project thinking of only working via a URL entered on the web browser address bar … and then to move forward …
  • you spend a day making it work for serving the same purpose and/or a difference purpose called within an HTML iframe (and keep it working for the address bar way as well)

And so we look at a “picturesque” but “kinda dumb” (as far as “action items” go) image we have coming off the interfacing to Google Charts Image Chart. Where can we go here? Well, it would be kind of you to take it to the beach, but that’s not always a possibility now, is it?! Were you pulling my leg?! Tee hee. No, we were thinking … oh no … we have a bad feeling about this … let’s open it up to the class … anyone, anyone? Yes, Louis, would you and Auguste like to share with the class what is so amusing to you?

.
.
.
.
.
.
.
.
.
.
.
.
.
.
.

Okay, thank you for your thoughts on this, and yes, you could take the “picture” to “a picture show”. Yes, very droll, indeed. Any other ideas? Okay, Johann, you say the idea just “clicked” with you. This sounds promising. Go on …

.
.
.
.
.
.
.
.
.
.
.
.
.
.
.

Indeed, a young “picturesque” might like to go tap dancing, that is true. Sheeeeesh! But given the lesson is a Computing one, rather than Drama or Dance or Music or the Arts, maybe we would be looking for a way to use the picture in an enhanced way. Okay Kevin, we’ll try you. What do you think?

.
.
.
.
.
.
.
.
.
.
.
.
.
.
.
.
.
.
.
.
.
.
.
.
.
.
.
.
.
.

Frankly, we are flabbergasted! It’s as if you invented HTML image maps (as a way to add position based event logic), or something … 93/4 points to Gryffindor!

Yes, helping out we image map enthusiasts regarding interfacing to Google Charts Image Charts is Google’s Image Map creation helping Json output tool. From that help, we can …

  • at the demonstrator’s webpage, create an Image Map … and as the user requires …
  • at the uniquifier definition phase of our WordPress 404.php’s contribution we accept the demonstrator’s image map HTML, and save it to a public resource
    <?php

    if (isset($_POST['canvcont'])) {
    if (isset($_POST['uniquifier'])) {
    $uniquifier=str_replace('+',' ',urldecode($_POST['uniquifier']));
    }
    if ($uniquifier == '') {
    $uniquifier='_' . rand(0,78654356);
    file_put_contents($_SERVER['DOCUMENT_ROOT'] . DIRECTORY_SEPARATOR . "presentation" . $uniquifier . ".png", base64_decode( explode('base64,', str_replace(' ','+',urldecode($_POST['canvcont'])))[1]));
    file_put_contents($_SERVER['DOCUMENT_ROOT'] . DIRECTORY_SEPARATOR . "presentation_" . $uniquifier . ".png", base64_decode( explode('base64,', str_replace(' ','+',urldecode($_POST['canvcont'])))[1]));
    file_put_contents($_SERVER['DOCUMENT_ROOT'] . DIRECTORY_SEPARATOR . "presentation__" . $uniquifier . ".png", base64_decode( explode('base64,', str_replace(' ','+',urldecode($_POST['canvcont'])))[1]));
    if (isset($_POST['mapstuff'])) {
    file_put_contents($_SERVER['DOCUMENT_ROOT'] . DIRECTORY_SEPARATOR . "presentation" . $uniquifier . ".html", '<html><body>' . str_replace('+',' ',urldecode($_POST['mapstuff'])) . '</body></html>');
    }

    exec("/usr/local/cpanel/3rdparty/bin/convert -delay 20 -loop 0 " . $_SERVER['DOCUMENT_ROOT'] . DIRECTORY_SEPARATOR . "presentation" . $uniquifier . ".png" . " " . $_SERVER['DOCUMENT_ROOT'] . DIRECTORY_SEPARATOR . "presentation" . $uniquifier . ".gif");
    echo "<html><body onload=\"if (parent.document.getElementById('uniquifier')) { if (parent.document.getElementById('uniquifier').value == '') { parent.document.getElementById('uniquifier').value='" . $uniquifier . "'; } }\"></body></html>";
    } else {
    file_put_contents($_SERVER['DOCUMENT_ROOT'] . DIRECTORY_SEPARATOR . "presentation" . $uniquifier . ".png", base64_decode( explode('base64,', str_replace(' ','+',urldecode($_POST['canvcont'])))[1]));
    if (file_exists($_SERVER['DOCUMENT_ROOT'] . DIRECTORY_SEPARATOR . "presentation__" . $uniquifier . ".png")) {
    $middelay='';
    $enddelay='';
    if (filesize($_SERVER['DOCUMENT_ROOT'] . DIRECTORY_SEPARATOR . "presentation__" . $uniquifier . ".png") < filesize($_SERVER['DOCUMENT_ROOT'] . DIRECTORY_SEPARATOR . "presentation_" . $uniquifier . ".png")) {
    $middelay=' -delay 800 ';
    $enddelay=' -delay 800 ';
    }
    exec("rm -f " . $_SERVER['DOCUMENT_ROOT'] . DIRECTORY_SEPARATOR . "presentation" . $uniquifier . ".gif ; /usr/local/cpanel/3rdparty/bin/convert -delay 600 -loop 0 " . $_SERVER['DOCUMENT_ROOT'] . DIRECTORY_SEPARATOR . "presentation_" . $uniquifier . ".png " . $middelay . $_SERVER['DOCUMENT_ROOT'] . DIRECTORY_SEPARATOR . "presentation__" . $uniquifier . ".png " . $enddelay . $_SERVER['DOCUMENT_ROOT'] . DIRECTORY_SEPARATOR . "presentation" . $uniquifier . ".png" . " " . $_SERVER['DOCUMENT_ROOT'] . DIRECTORY_SEPARATOR . "presentation" . $uniquifier . ".gif");
    } else {
    exec("rm -f " . $_SERVER['DOCUMENT_ROOT'] . DIRECTORY_SEPARATOR . "presentation" . $uniquifier . ".gif ; /usr/local/cpanel/3rdparty/bin/convert -delay 200 -loop 0 " . $_SERVER['DOCUMENT_ROOT'] . DIRECTORY_SEPARATOR . "presentation_" . $uniquifier . ".png " . $_SERVER['DOCUMENT_ROOT'] . DIRECTORY_SEPARATOR . "presentation" . $uniquifier . ".png" . " " . $_SERVER['DOCUMENT_ROOT'] . DIRECTORY_SEPARATOR . "presentation" . $uniquifier . ".gif");
    }
    }
    exit;
    }

    ?>
  • helping keep the image mapping going, even if the Image Chart is …
    1. shared via email or SMS … and/or …
    2. forms the basis of a Broadcast Talk demonstration session

We could use Ajax techniques for the Javascript client ways an emailee’s link’s webpage invocation can use this new resource, but we kind of like “client pre-emptive iframe” onload event thinking, for both sides of the ledger, to get this going, as per …


function htmlDecode(input) { // thanks to https://stackoverflow.com/questions/1912501/unescape-html-entities-in-javascript
var e = document.createElement('textarea');
e.innerHTML = input;
// handle case of empty input
return e.childNodes.length === 0 ? "" : e.childNodes[0].nodeValue;
}

function mapsofarpj(xiois) {
//alert(('' + xiois.src));
if (xiois.src != '' && ('' + xiois.src).indexOf('presentation') != -1) {
//alert(('' + xiois.src));
var xaconto = (xiois.contentWindow || xiois.contentDocument);
//alert(11);
if (xaconto != null) {
//alert(111);
if (xaconto.document) { xaconto = xaconto.document; }
//alert(1111);
if (xaconto.body.innerHTML.indexOf('<map') != -1) {
var ihis=xaconto.body.innerHTML;
//while (ihis.indexOf('\"') != -1) {
// ihis=ihis.replace('\"', '')
//}
ihis=htmlDecode(ihis).replace(/\\"/g,'').replace(/\\'/g,"'").replace(/\=\"\"/g,'').replace(/This\"/g,"This").replace(/\;\ nohref/g, ';" nohref');
//alert(ihis);
if (document.getElementById('jdiv')) {
//alert(21111);
document.getElementById('jdiv').innerHTML=ihis; //xaconto.body.innerHTML;
//alert(31111);
document.getElementById('talkimg').useMap='#mymap';
//alert(41111);
} else {
document.body.innerHTML+=ihis; //xaconto.body.innerHTML;
document.getElementById('talkimg').useMap='#mymap';
}
}
}
}
}

function sofarpj(iois) {
var aname='', partsare=[], ipis=0, areabits='';
if (iois.src != '') {
var aconto = (iois.contentWindow || iois.contentDocument);
if (aconto != null) {
if (aconto.document) { aconto = aconto.document; }
pjsbih=aconto.body.innerHTML;
if (lastpjsbih != '' && pjsbih != lastpjsbih.replace(/\ $/g,'')) {
//alert('Found new Image Map data of ' + pjsbih);
// {"chartshape":[{"name":"axis0_0","type":"RECT","coords":[21,336,28,344]},{"name":"axis0_1","type":"RECT","coords":[65,336,77,344]},{"name":"axis0_2","type":"RECT","coords":[111,336,124,344]},{"name":"axis0_3","type":"RECT","coords":[158,336,170,344]},{"name":"axis0_4","type":"RECT","coords":[204,336,217,344]},{"name":"axis0_5","type":"RECT","coords":[251,336,263,344]},{"name":"axis0_6","type":"RECT","coords":[297,336,310,344]},{"name":"axis0_7","type":"RECT","coords":[344,336,356,344]},{"name":"axis0_8","type":"RECT","coords":[390,336,403,344]},{"name":"axis0_9","type":"RECT","coords":[437,336,449,344]},{"name":"axis0_10","type":"RECT","coords":[480,336,499,344]},{"name":"axis1_0","type":"RECT","coords":[14,326,20,334]},{"name":"axis1_1","type":"RECT","coords":[8,297,20,305]},{"name":"axis1_2","type":"RECT","coords":[8,267,20,275]},{"name":"axis1_3","type":"RECT","coords":[8,237,20,245]},{"name":"axis1_4","type":"RECT","coords":[8,208,20,216]},{"name":"axis1_5","type":"RECT","coords":[8,178,20,186]},{"name":"axis1_6","type":"RECT","coords":[8,148,20,156]},{"name":"axis1_7","type":"RECT","coords":[8,119,20,127]},{"name":"axis1_8","type":"RECT","coords":[8,89,20,97]},{"name":"axis1_9","type":"RECT","coords":[8,59,20,67]},{"name":"axis1_10","type":"RECT","coords":[2,29,20,37]},{"name":"legend0","type":"RECT","coords":[500,167,512,179]},{"name":"legend1","type":"RECT","coords":[500,185,512,197]},{"name":"circle0","type":"CIRCLE","coords":[80,39,4]},{"name":"circle1","type":"CIRCLE","coords":[429,152,1]},{"name":"circle2","type":"CIRCLE","coords":[373,250,3]},{"name":"circle3","type":"CIRCLE","coords":[215,230,4]},{"name":"circle4","type":"CIRCLE","coords":[131,164,2]},{"name":"circle5","type":"CIRCLE","coords":[471,96,5]},{"name":"circle6","type":"CIRCLE","coords":[341,158,3]},{"name":"circle7","type":"CIRCLE","coords":[355,111,5]},{"name":"circle8","type":"CIRCLE","coords":[183,277,3]},{"name":"circle9","type":"CIRCLE","coords":[66,105,3]}]}
if (pjsbih.replace(/\[\]/g, '').indexOf('[') != -1) {
partsare=pjsbih.split('","coords":[');
for (ipis=1; ipis<partsare.length; ipis++) {
if (partsare[eval(-1 + ipis)].split('"')[eval(-1 + partsare[eval(-1 + ipis)].split('"').length)] == 'RECT') {
aname=partsare[eval(-1 + ipis)].split('"name":"')[eval(-1 + partsare[eval(-1 + ipis)].split('"name":"').length)].split('"')[0];
areabits+='<area shape="rect" coords="' + partsare[ipis].split(']')[0] + '" alt="' + aname + '" onclick="' + "alert('This feature name is " + aname + "'" + ');" nohref>';
} else if (partsare[eval(-1 + ipis)].split('"')[eval(-1 + partsare[eval(-1 + ipis)].split('"').length)] == 'CIRCLE') {
aname=partsare[eval(-1 + ipis)].split('"name":"')[eval(-1 + partsare[eval(-1 + ipis)].split('"name":"').length)].split('"')[0];
areabits+='<area shape="circle" coords="' + partsare[ipis].split(']')[0] + '" alt="' + aname + '" onclick="' + "alert('This feature name is " + aname + "'" + ');" nohref>';
} else if (partsare[eval(-1 + ipis)].split('"')[eval(-1 + partsare[eval(-1 + ipis)].split('"').length)] == 'POLY') {
aname=partsare[eval(-1 + ipis)].split('"name":"')[eval(-1 + partsare[eval(-1 + ipis)].split('"name":"').length)].split('"')[0];
areabits+='<area shape="poly" coords="' + partsare[ipis].split(']')[0] + '" alt="' + aname + '" onclick="' + "alert('This feature name is " + aname + "'" + ');" nohref>';
}
}
document.getElementById('mymap').innerHTML=areabits + '<area' + atend.split('<area')[1].split('>')[0] + '>'; //"<area onclick=defclick(event); shape='default' nohref>";
origmap=document.getElementById('mymap').outerHTML;
}
} else if (lastpjsbih != '') {
//alert('Found the same ' + pjsbih);
if (pjsbih.replace(/\[\]/g, '').indexOf('[') != -1) {
partsare=pjsbih.split('","coords":[');
for (ipis=1; ipis<partsare.length; ipis++) {
if (partsare[eval(-1 + ipis)].split('"')[eval(-1 + partsare[eval(-1 + ipis)].split('"').length)] == 'RECT') {
aname=partsare[eval(-1 + ipis)].split('"name":"')[eval(-1 + partsare[eval(-1 + ipis)].split('"name":"').length)].split('"')[0];
areabits+='<area shape="rect" coords="' + partsare[ipis].split(']')[0] + '" alt="' + aname + '" onclick="' + "alert('This feature name is " + aname + "'" + ');" nohref>';
} else if (partsare[eval(-1 + ipis)].split('"')[eval(-1 + partsare[eval(-1 + ipis)].split('"').length)] == 'CIRCLE') {
aname=partsare[eval(-1 + ipis)].split('"name":"')[eval(-1 + partsare[eval(-1 + ipis)].split('"name":"').length)].split('"')[0];
areabits+='<area shape="circle" coords="' + partsare[ipis].split(']')[0] + '" alt="' + aname + '" onclick="' + "alert('This feature name is " + aname + "'" + ');" nohref>';
} else if (partsare[eval(-1 + ipis)].split('"')[eval(-1 + partsare[eval(-1 + ipis)].split('"').length)] == 'POLY') {
aname=partsare[eval(-1 + ipis)].split('"name":"')[eval(-1 + partsare[eval(-1 + ipis)].split('"name":"').length)].split('"')[0];
areabits+='<area shape="poly" coords="' + partsare[ipis].split(']')[0] + '" alt="' + aname + '" onclick="' + "alert('This feature name is " + aname + "'" + ');" nohref>';
}
}
document.getElementById('mymap').innerHTML=areabits + '<area' + atend.split('<area')[1].split('>')[0] + '>'; //"<area onclick=defclick(event); shape='default' nohref>";
origmap=document.getElementById('mymap').outerHTML;
}
}
lastpjsbih=pjsbih;
}
}
}

… further to yesterday’s Google Chart Image Chart Dynamic Icons Tutorial in the changed latest draft image_venn.html Google Chart Image Chart Venn Chart or Scatter Chart or GraphViz Chart or Pie Chart or Line Chart or Bar Chart or Candlestick/Box Chart or Google-O-Meter Chart or Radar Chart or Map Chart interfacing web application you can also try below.


Previous relevant Google Chart Image Chart Dynamic Icons Tutorial is shown below.

Google Chart Image Chart Dynamic Icons Tutorial

Google Chart Image Chart Dynamic Icons Tutorial

Does statistics have to be staid and boring? Kitch and quiche?! Welcome to the wooorrrlllddd of Google Charts Image Chart Dynamic Icons!

Think of Dynamic Icons as a way to decorate one or more data points displayed in one of …

  • Line Chart
  • Bar Chart
  • Map Chart
  • Radar Chart

We had that certain “Wow! factor going as we remembered our state’s motto from some years back, and we tried out the Map Chart to see whether we could embellish the map with a Dynamic Icon relevant to New South Wales, as you can see with today’s tutorial picture.

We’ll show you the most recent snapshot of Javascript parameters a little later, but the change for this is an optional one up to the user to work out, with prompts such as the Map Chart one updated

Enter vertical bar separated country ISO Country and/or Region Code list. Please note that optional Dynamic Icons are available via a suffixing string example applied to the second data point such as &chem=y;s=bubble_icon_text_small;d=ski,bb,NSW%20State%20of%20Wow!,FFFFFF;dp=1;ds=0 eg. AU-NT|AU-NSW|AU-SA|NZ|IN’

And here is its relevance in a new snapshot of parameterizations …


var prefixandon='';
var dtextis='dtext';
var pretherest='';
var newtherest='';
var tmod='';
var colchange='';
var cht=location.search.split('cht=')[1] ? decodeURIComponent(location.search.split('cht=')[1].split('&')[0]) : "v";
if ((cht + ' ').substring(0,1) == 'p' && cht != 'p') { pretherest=cht.substring(1); }
//if ((cht + ' ').substring(0,2) == 'bv' && cht != 'bv') { pretherest=cht.substring(2); if (1 == 1) { cht='bv'; } }
if ((cht + ' ').substring(0,1) == 'bv'.substring(0,1) && cht != 'bv'.substring(0,1)) { pretherest=cht.substring(1); if (1 == 1) { cht='bv'.substring(0,1); } }
if ((cht + ' ').substring(0,1) == 'l' && cht != 'l') { pretherest=cht.substring(1); if (1 == 1) { cht='l'; } }
if ((cht + ' ').substring(0,1) == 'r' && cht != 'r') { pretherest=cht.substring(1); if (1 == 1) { cht='r'; } }
var ccode=location.search.split('chld=')[1] ? decodeURIComponent(location.search.split('chld=')[1].split('&')[0]) : "";
var ctype=location.search.split('type=')[1] ? decodeURIComponent(location.search.split('type=')[1].split('&')[0]) : cht;
var cname=(ctype == 'v' ? 'Venn Chart' : (ctype == 's' ? 'Scatter Chart' : (ctype == 'gv' ? 'GraphViz Chart' :
(ctype.substring(0,1) == 'p' ? 'Pie Chart' :
((ctype + ' ').substring(0,2).substring(0,1) == 'bv'.substring(0,1) ? 'Bar Chart' : (ctype.substring(0,1) == 'l' ? 'Line Chart' :
(ctype == 'map' ? 'Map Chart' :
(ctype == 'gom' ? 'Google-O-Meter Chart' :
(ctype == 'r' ? 'Radar Chart' :
'')))))))));
var cencodename=(ctype == 'v' ? 'Venn%20Diagram' : (ctype == 's' ? 'Scatter%20Chart' : (ctype == 'gv' ? 'GraphViz%20Chart' :
(ctype.substring(0,1) == 'p' ? 'Pie%20Chart' :
((ctype + ' ').substring(0,2).substring(0,1) == 'bv'.substring(0,1) ? 'Bar%20Chart' : (ctype.substring(0,1) == 'l' ? 'Line%20Chart' :
(ctype == 'map' ? 'Map%20Chart' :
(ctype == 'gom' ? 'Google-O-Meter%20Chart' :
(ctype == 'r' ? 'Radar%20Chart' :
'')))))))));
var chdt=(ctype == 'v' ? '&chd=t:' : (ctype == 's' ? '&chd=t:' : (ctype == 'gv' ? '&chl=' :
(ctype.substring(0,1) == 'p' ? pretherest + '&chd=t:' :
((ctype + ' ').substring(0,2).substring(0,1) == 'bv'.substring(0,1) ? '&chd=t:' : (ctype.substring(0,1) == 'l' ? '&chd=t:' :
(ctype == 'map' ? '' :
(ctype == 'gom' ? '&chd=t:' :
(ctype == 'r' ? pretherest + '&chd=t:' :
'')))))))));
var chdeq=(ctype == 'v' ? '&chd=' : (ctype == 's' ? '&chd=' : (ctype == 'gv' ? '&chl=' :
(ctype.substring(0,1) == 'p' ? '&chd=' :
((ctype + ' ').substring(0,2).substring(0,1) == 'bv'.substring(0,1) ? '&chd=' : (ctype.substring(0,1) == 'l' ? '&chd=' :
(ctype == 'map' ? '&chld=' :
(ctype == 'gom' ? '&chld=' :
(ctype == 'r' ? '&chd=' :
'')))))))));
var tc=(ctype == 'v' ? 't:' : (ctype == 's' ? 't:' : (ctype == 'gv' ? '' :
(ctype.substring(0,1) == 'p' ? 't:' :
((ctype + ' ').substring(0,2).substring(0,1) == 'bv'.substring(0,1) ? 't:' : (ctype.substring(0,1) == 'l' ? 't:' :
(ctype == 'map' ? '' :
(ctype == 'gom' ? 't:' :
(ctype == 'r' ? 't:' :
'')))))))));
var chdl=(ctype == 'v' ? '&chdl=' : (ctype == 's' ? '&chdl=' : (ctype == 'gv' ? '' :
(ctype.substring(0,1) == 'p' ? '&chdl=' :
((ctype + ' ').substring(0,2).substring(0,1) == 'bv'.substring(0,1) ? '&chbh=' : (ctype.substring(0,1) == 'l' ? '&chbh=' :
(ctype == 'map' ? '' :
(ctype == 'gom' ? '&chdl=' :
(ctype == 'r' ? '&chxt=x&chxl=' :
'')))))))));

var prenchtt=(ctype == 'v' ? '100,80,60,30,30,30,10' : (ctype == 's' ? '12,87,75,41,23,96,68,71,34,9|98,60,27,34,56,79,58,74,18,76|84,23,69,81,47,94,60,93,64,54' : (ctype == 'gv' ? 'graph{C_0--H_0[type=s];C_0--H_1[type=s];C_0--H_2[type=s];C_0--C_1[type=s];C_1--H_3[type=s];C_1--H_4[type=s];C_1--H_5[type=s]}' :
(ctype.substring(0,1) == 'p' ? '1,2,3,4' :
((ctype + ' ').substring(0,2).substring(0,1) == 'bv'.substring(0,1) ? '5,5,5|10,10,10|15,15,15' : (ctype.substring(0,1) == 'l' ? '5,45,5|10,60,10|15,85,15' :
(ctype == 'map' ? '' :
(ctype == 'gom' ? '20,40,60' :
(ctype == 'r' ? '10,20,30,40,50' :
'')))))))));
var preachtt=(ctype == 'v' ? 'A|B|C' : (ctype == 's' ? 'Cats|Dogs' : (ctype == 'gv' ? '' :
(ctype.substring(0,1) == 'p' ? 'January|February|March|April' :
((ctype + ' ').substring(0,2).substring(0,1) == 'bv'.substring(0,1) ? '15,4,15' : (ctype.substring(0,1) == 'l' ? '15,4,15' :
(ctype == 'map' ? '' :
(ctype == 'gom' ? 'A|B|C' :
(ctype == 'r' ? '0:|1|2|3|4|5|6' :
'')))))))));
var defchco=(ctype == 'v' ? 'ff0000,00ff00,0000ff' : (ctype == 's' ? 'FF0000|0000FF&chxt=x,y' : (ctype == 'gv' ? '' :
(ctype.substring(0,1) == 'p' ? 'ff0000,00ff00,0000ff,ff00ff' :
((ctype + ' ').substring(0,2).substring(0,1) == 'bv'.substring(0,1) ? '4D89F9,C6D9FD,C6FDD9&chxt=x,y' : (ctype.substring(0,1) == 'l' ? '3D89F9.B6D9FD,B6FDD9&chxt=x,y' :
(ctype == 'map' ? '' :
(ctype == 'gom' ? 'ff0000,00ff00,0000ff' :
(ctype == 'r' ? 'FF0000,FF9900,ff0a00,00ffb0,000cff' :
'')))))))));

var prechtt=(ctype == 'v' ? chdt + prenchtt + chdl + preachtt : (ctype == 's' ? chdt + prenchtt + chdl + preachtt + '&chxt=x,y' : (ctype == 'gv' ? chdt + prenchtt :
(ctype.substring(0,1) == 'p' ? chdt + prenchtt + chdl + preachtt :
((ctype + ' ').substring(0,2).substring(0,1) == 'bv'.substring(0,1) ? chdt + prenchtt + chdl + preachtt : (ctype.substring(0,1) == 'l' ? chdt + prenchtt + chdl + preachtt :
(ctype == 'map' ? '' :
(ctype == 'gom' ? chdt + prenchtt + chdl + preachtt :
(ctype == 'r' ? chdt + prenchtt + chdl + preachtt :
'')))))))));
var promptone=(ctype == 'v' ? "Enter delimited values string for Venn Diagram such that ... " + String.fromCharCode(10) + "The first three values specify the sizes of three circles: A, B, & C. For chart with only two circles, specify zero for the third value." + String.fromCharCode(10) + "The fourth value specifies the size of the intersection of A and B." + String.fromCharCode(10) + "The fifth value specifies the size of the intersection of A and C. For a chart with only two circles, do not specify a value here." + String.fromCharCode(10) + "The sixth value specifies the size of the intersection of B and C. For a chart with only two circles, do not specify a value here." + String.fromCharCode(10) + "The seventh value specifies the size of the common intersection of A, B, and C. For a chart with only two circles, do not specify a value here." + String.fromCharCode(10) + String.fromCharCode(10) + "" : (ctype == 's' ? "Enter delimited values string for Scatter Chart" : (ctype == 'gv' ? "Enter delimited values string for GraphViz Chart" :
(ctype.substring(0,1) == 'p' ? "Enter delimited values string for Pie Chart" :
((ctype + ' ').substring(0,2).substring(0,1) == 'bv'.substring(0,1) ? "Enter v for Vertical or h for Horizontal then one of g for Group or s for Stacked or o for Overlapped Bar Chart look then a space and then enter delimited values string for Bar Chart. Here is a Candlestick and horizontal Bar Chart idea eg. hg 1:20,10,15,25,17,30|0,5,10,7,12,6|35,25,45,47,24,46|15,40,30,27,39,54|70,55,63,59,80,6 Here is a vertical Bar Chart and Box Chart idea vs 1:-1,5,10,7,12,-1|-1,25,30,27,24,-1|-1,40,45,47,39,-1|-1,55,63,59,80,-1|-1,30,40,35,30,-1|-1,-1,5,70,90,-1|-1,-1,-1,80,5,-1&chm=F,FF9900,0,1:4,40|H,0CBF0B,0,1:4,1:20|H,000000,4,1:4,1:40|H,0000FF,3,1:4,1:20|o,FF0000,5,-1,7|o,FF0000,6,-1,7 Prefix just the delimited string you enter by 1: to additionally display Candlestick/Box Charts or by 0: to only display Candlestick/Box Chart" :
(ctype.substring(0,1) == 'l' ? "Enter c for Even or s for Sparklines or xy for Just XY Line Chart look then a space and then enter delimited values string for Line Chart. Here is a Candlestick and Line Chart idea eg. c 1:20,10,15,25,17,30|0,5,10,7,12,6|35,25,45,47,24,46|15,40,30,27,39,54|70,55,63,59,80,6 Here is a Line Chart and Box Chart idea s 1:-1,5,10,7,12,-1|-1,25,30,27,24,-1|-1,40,45,47,39,-1|-1,55,63,59,80,-1|-1,30,40,35,30,-1|-1,-1,5,70,90,-1|-1,-1,-1,80,5,-1&chm=F,FF9900,0,1:4,40|H,0CBF0B,0,1:4,1:20|H,000000,4,1:4,1:40|H,0000FF,3,1:4,1:20|o,FF0000,5,-1,7|o,FF0000,6,-1,7 Prefix just the delimited string you enter by 1: to additionally display Candlestick/Box Charts or by 0: to only display Candlestick/Box Chart" :
(ctype == 'map' ? "" :
(ctype == 'gom' ? "Enter delimited values string for Google-O-Meter Chart" :
(ctype == 'r' ? "Enter delimited values string for Radar Chart but prefix with an s for smooth lines" :
"")))))))));
var oneprompt=(ctype == 'v' ? "Enter delimited values string for your Venn Diagram collaborations, optionally, such that ... " + String.fromCharCode(10) + "The first three values specify the sizes of three circles: A, B, & C. For chart with only two circles, specify zero for the third value." + String.fromCharCode(10) + "The fourth value specifies the size of the intersection of A and B." + String.fromCharCode(10) + "The fifth value specifies the size of the intersection of A and C. For a chart with only two circles, do not specify a value here." + String.fromCharCode(10) + "The sixth value specifies the size of the intersection of B and C. For a chart with only two circles, do not specify a value here." + String.fromCharCode(10) + "The seventh value specifies the size of the common intersection of A, B, and C. For a chart with only two circles, do not specify a value here." + String.fromCharCode(10) + String.fromCharCode(10) + "" : (ctype == 's' ? "Enter delimited values string for Scatter Chart" : (ctype == 'gv' ? "Enter delimited values string for GraphViz Chart" :
(ctype.substring(0,1) == 'p' ? "Enter delimited values string for Pie Chart" :
((ctype + ' ').substring(0,2).substring(0,1) == 'bv'.substring(0,1) ? "Enter g for Grouped or s for Stacked or o for Overlapped Bar Chart look then a space and then enter delimited values string for Bar Chart. Here is a Candlestick and Bar Chart idea eg. g 1:20,10,15,25,17,30|0,5,10,7,12,6|35,25,45,47,24,46|15,40,30,27,39,54|70,55,63,59,80,6 Here is a vertical Bar Chart and Box Chart idea vs 1:-1,5,10,7,12,-1|-1,25,30,27,24,-1|-1,40,45,47,39,-1|-1,55,63,59,80,-1|-1,30,40,35,30,-1|-1,-1,5,70,90,-1|-1,-1,-1,80,5,-1&chm=F,FF9900,0,1:4,40|H,0CBF0B,0,1:4,1:20|H,000000,4,1:4,1:40|H,0000FF,3,1:4,1:20|o,FF0000,5,-1,7|o,FF0000,6,-1,7 Prefix just the delimited string you enter by 1: to additionally display Candlestick/Box Charts or by 0: to only display Candlestick/Box Chart" :
(ctype.substring(0,1) == 'l' ? "Enter c for Even or s for Sparklines or xy for Just XY Line Chart look then a space and then enter delimited values string for Line Chart. Here is a Candlestick and Line Chart idea eg. c 1:20,10,15,25,17,30|0,5,10,7,12,6|35,25,45,47,24,46|15,40,30,27,39,54|70,55,63,59,80,6 Here is a Line Chart and Box Chart idea s 1:-1,5,10,7,12,-1|-1,25,30,27,24,-1|-1,40,45,47,39,-1|-1,55,63,59,80,-1|-1,30,40,35,30,-1|-1,-1,5,70,90,-1|-1,-1,-1,80,5,-1&chm=F,FF9900,0,1:4,40|H,0CBF0B,0,1:4,1:20|H,000000,4,1:4,1:40|H,0000FF,3,1:4,1:20|o,FF0000,5,-1,7|o,FF0000,6,-1,7 Prefix just the delimited string you enter by 1: to additionally display Candlestick/Box Charts or by 0: to only display Candlestick/Box Chart" :
(ctype == 'map' ? "" :
(ctype == 'gom' ? "Enter delimited values string for Google-O-Meter Chart" :
(ctype == 'r' ? "Enter delimited values string for Radar Chart but prefix with an s for smooth lines" :
"")))))))));
var asktwo=(ctype == 'v' ? true : (ctype == 's' ? true : (ctype == 'gv' ? false :
(ctype.substring(0,1) == 'p' ? true :
((ctype + ' ').substring(0,2).substring(0,1) == 'bv'.substring(0,1) ? true : (ctype.substring(0,1) == 'l' ? true :
(ctype == 'map' ? false :
(ctype == 'gom' ? true :
(ctype == 'r' ? true :
false)))))))));

var answersuffix=(ctype.substring(0,1).replace('m','l').replace('b','l').replace('r','l') == 'l' ? '. Please note that optional Dynamic Icons are available via a suffixing string example applied to the second data point such as &chem=y;s=bubble_icon_text_small;d=ski,bb,Wheeee!,FFFFFF;dp=1;ds=0 ' : '');

var twopb=(ctype.substring(0,1) == 'p' ? 'Any optional legend or title argument snippets? Optionally prefix by 3 for 3d Pie Chart or by c for Concentric Pie Chart. Eg. 3' + chdl + preachtt + '&chtt=My%20' + cencodename + '&chco=' + defchco : 'Any optional legend or title argument snippets? Eg. ' + chdl + preachtt + '&chtt=My%20' + cencodename + '&chco=' + defchco);
var beforeanswer=(ctype.substring(0,1) == 'l' ? 'c ' : ((ctype + ' ').substring(0,2).substring(0,1) == 'bv'.substring(0,1) ? 'vg ' : ''));

var emsmlist='';

… further to yesterday’s Google Chart Image Chart Broadcast Talk Commentary Tutorial in the changed latest draft image_venn.html Google Chart Image Chart Venn Chart or Scatter Chart or GraphViz Chart or Pie Chart or Line Chart or Bar Chart or Candlestick/Box Chart or Google-O-Meter Chart or Radar Chart or Map Chart interfacing web application you can also try below.


Previous relevant Google Chart Image Chart Broadcast Talk Commentary Tutorial is shown below.

Google Chart Image Chart Broadcast Talk Commentary Tutorial

Google Chart Image Chart Broadcast Talk Commentary Tutorial

We’ll leave yesterday’s Google Chart Image Chart Radar Chart Tutorial angled text predilections for now, given we’ve got until Tuesday until tswhtf so to speak. Let’s today remedy the concern we had when we presented Google Chart Image Chart Broadcast Talk Context Tutorial regarding, the at the time new, “Broadcast Talk”, concept …

… even though it is only visual by nature, presented as an update image still presented and updated periodically. Go figure?!

… and offer a way to help the “Broadcast Talk” demonstrator “speak” during their demonstration, effectively. In so doing, we are going to add to …

  • the demonstrator’s visual inputs coming from that canvas annotator helper … with, today …
  • the demonstrator’s commentary, collected via an HTML textarea element (to optionally supplement the visuals) from that canvas annotator helper’s originator window (ie. the Google Charts Image Chart interfacing supervisor) … presented …

… via a new “middle of three slide” …

<?php

$uwidth=trim($uparts[$ioff - 2 + sizeof($uparts)]);
$uheight=trim(explode('#',explode('?',$uparts[$ioff - 1 + sizeof($uparts)])[0])[0]);
if (isset($_GET['canvcont']) && isset($_GET['uniquifier'])) {
$uniquifier=str_replace('+',' ',urldecode($_GET['uniquifier']));
if (file_exists($_SERVER['DOCUMENT_ROOT'] . DIRECTORY_SEPARATOR . "presentation__" . $uniquifier . ".png")) {
$im = imagecreatefromstring(file_get_contents($_SERVER['DOCUMENT_ROOT'] . DIRECTORY_SEPARATOR . "presentation__" . $uniquifier . ".png"));
$white = imagecolorallocate($im, 255, 255, 255);
$black = imagecolorallocate($im, 1, 1, 1);
imagefilledrectangle($im, 0, 0, $uwidth, $uheight, $white);
imagesavealpha($im, TRUE);
try {
if (function_exists('imagettftext')) {
imagettftext($im, 12, 0, 20, 20, $black, realpath('arial.ttf'), str_replace('+',' ',urldecode($_GET['canvcont'])));
}
} catch (Exception $e) { }

imagepng($im, $_SERVER['DOCUMENT_ROOT'] . DIRECTORY_SEPARATOR . "presentation__" . $uniquifier . ".png");
imagedestroy($im);
exit;
}
exit;
}


?>

… animated GIF (PHP 404.php helping) means of display in the viewer windows (off email invitation links they receive via the demonstrator) in the changed


function askaway() {
var waspis=prefixandon, nl='', newwaspis='';
if (document.getElementById('bcommentary')) {
if (document.getElementById('bcommentary').value.trim() != '') {
if (document.getElementById('bcommentary').value.trim().indexOf(String.fromCharCode(10)) == -1) {
nl=String.fromCharCode(10);
}
eightthousand=24000;
if ((' ' + document.getElementById('bcommentary').value.trim()).slice(-3) != '...' && (' ' + prefixandon.trim()).slice(-3) != '...' && (document.getElementById('bcommentary').value.trim() + ' ').substring(0,3) != '...') {
prefixandon='';
lastval='';
} else if ((document.getElementById('bcommentary').value.trim() + ' ').substring(0,3) == '...') {
if (waspis.indexOf(lastval.trim()) == -1) {
prefixandon=String.fromCharCode(10) + lastval.trim().replace(/\.\.\.NoWayJosE$/g, ' ' + nl + ('' + (new Date())) + ' ... ') + waspis;
newwaspis=prefixandon;
}
}
if ((' ' + document.getElementById('bcommentary').value.trim()).slice(-3) == '...') {
document.getElementById('ifco').src='//www.rjmprogramming.com.au/ITblog/' + Math.min(550,window.innerWidth) + '/' + Math.min(350,window.innerHeight) + '/?uniquifier=' + encodeURIComponent(document.getElementById('uniquifier').value) + '&canvcont=' + encodeURIComponent(document.getElementById('bcommentary').value.trim().replace(/\.\.\.$/g, ' ' + nl + ('' + (new Date())) + ' ... ' + String.fromCharCode(10) + String.fromCharCode(10) + prefixandon));
} else {
document.getElementById('ifco').src='//www.rjmprogramming.com.au/ITblog/' + Math.min(550,window.innerWidth) + '/' + Math.min(350,window.innerHeight) + '/?uniquifier=' + encodeURIComponent(document.getElementById('uniquifier').value) + '&canvcont=' + encodeURIComponent(document.getElementById('bcommentary').value + String.fromCharCode(10) + String.fromCharCode(10) + prefixandon);
}
document.getElementById('bcommentary').title=document.getElementById('bcommentary').value;
if ((document.getElementById('bcommentary').value.trim() + ' ').substring(0,3) == '...') {
if (newwaspis != '') { waspis=newwaspis; }
if (waspis.indexOf(document.getElementById('bcommentary').value.trim()) == -1) {
prefixandon=String.fromCharCode(10) + document.getElementById('bcommentary').value.trim().replace(/\.\.\.$/g, ' ' + nl + ('' + (new Date())) + ' ... ') + waspis;
}
}
lastval=document.getElementById('bcommentary').value;
document.getElementById('bcommentary').value='';
setTimeout(function(){ document.getElementById('subcc').click(); }, 2000);
}
}
}

function newfunction() {
if (document.getElementById('bshare')) {
document.getElementById('sbshare').innerHTML='<iframe id=ifco style=display:none; src=></iframe><br><br><textarea rows=2 cols=80 id=bcommentary placeholder="Commentary to Viewers can go here ... start with or end with ... for ongoing ..." onblur="askaway(this);" value=""></textarea><br><br>';
}
}

latest draft image_venn.html Google Chart Image Chart Venn Chart or Scatter Chart or GraphViz Chart or Pie Chart or Line Chart or Bar Chart or Candlestick/Box Chart or Google-O-Meter Chart or Radar Chart or Map Chart interfacing web application you can also try below.


Previous relevant Google Chart Image Chart Radar Chart Tutorial is shown below.

Google Chart Image Chart Radar Chart Tutorial

Google Chart Image Chart Radar Chart Tutorial

Onto yesterday’s Google Chart Image Chart Box Chart Tutorial, today we have a two part stepping forward via new …

Why the trepidation? Well, so far, when the text is angled we can’t understand what results we are getting back from a call to [element].getBoundingClientRect() just yet.

Why is this needed? Again, with the questions! Well, Mr De Niro, you see, well, somebody might want to go onto that more complex annotating.

And why would they do that? Sheesh. Well, Mr De Niro, sir, you see, sometimes things happen in life, and well, fingers slip on keyboards, and mice get awfullllly nervous around screens these days.

Yeh, well, show us the money, wiseguy. Who’s is that question? And what’s with the questions? Well, you see, Mr De Niro, the money is if we can get PHP text placement for text at an angle, where it rotates from the middle of the text, to get a similar positioning to good ol’ … pardon, Mr De Niro … good and well respected Javascript transform rotations … not with a triple pike, Mr De Niro, but you’re awfulllllly close, Mr De Niro, sir … rather, we throw in a couple of translations … no, not Latin, Mr De Niro … of co-ordinates, Mr De Niro.

And that will bring in how much by next Tuesday? Back to the questions? Why so many questions? We think it’s a pretty big money spinner, Mr De Niro, sir, and we think you should come back next Tuesday, and we can show you the ropes. Sweat, oozing from the brow, as Mr De Niro exits stage left.

And just while we have a few minutes, here’s the updated Javascript parameterization …


var dtextis='dtext';
var pretherest='';
var newtherest='';
var tmod='';
var colchange='';
var cht=location.search.split('cht=')[1] ? decodeURIComponent(location.search.split('cht=')[1].split('&')[0]) : "v";
if ((cht + ' ').substring(0,1) == 'p' && cht != 'p') { pretherest=cht.substring(1); }
//if ((cht + ' ').substring(0,2) == 'bv' && cht != 'bv') { pretherest=cht.substring(2); if (1 == 1) { cht='bv'; } }
if ((cht + ' ').substring(0,1) == 'bv'.substring(0,1) && cht != 'bv'.substring(0,1)) { pretherest=cht.substring(1); if (1 == 1) { cht='bv'.substring(0,1); } }
if ((cht + ' ').substring(0,1) == 'l' && cht != 'l') { pretherest=cht.substring(1); if (1 == 1) { cht='l'; } }
if ((cht + ' ').substring(0,1) == 'r' && cht != 'r') { pretherest=cht.substring(1); if (1 == 1) { cht='r'; } }
var ccode=location.search.split('chld=')[1] ? decodeURIComponent(location.search.split('chld=')[1].split('&')[0]) : "";
var ctype=location.search.split('type=')[1] ? decodeURIComponent(location.search.split('type=')[1].split('&')[0]) : cht;
var cname=(ctype == 'v' ? 'Venn Chart' : (ctype == 's' ? 'Scatter Chart' : (ctype == 'gv' ? 'GraphViz Chart' :
(ctype.substring(0,1) == 'p' ? 'Pie Chart' :
((ctype + ' ').substring(0,2).substring(0,1) == 'bv'.substring(0,1) ? 'Bar Chart' : (ctype.substring(0,1) == 'l' ? 'Line Chart' :
(ctype == 'map' ? 'Map Chart' :
(ctype == 'gom' ? 'Google-O-Meter Chart' :
(ctype == 'r' ? 'Radar Chart' :
'')))))))));
var cencodename=(ctype == 'v' ? 'Venn%20Diagram' : (ctype == 's' ? 'Scatter%20Chart' : (ctype == 'gv' ? 'GraphViz%20Chart' :
(ctype.substring(0,1) == 'p' ? 'Pie%20Chart' :
((ctype + ' ').substring(0,2).substring(0,1) == 'bv'.substring(0,1) ? 'Bar%20Chart' : (ctype.substring(0,1) == 'l' ? 'Line%20Chart' :
(ctype == 'map' ? 'Map%20Chart' :
(ctype == 'gom' ? 'Google-O-Meter%20Chart' :
(ctype == 'r' ? 'Radar%20Chart' :
'')))))))));
var chdt=(ctype == 'v' ? '&chd=t:' : (ctype == 's' ? '&chd=t:' : (ctype == 'gv' ? '&chl=' :
(ctype.substring(0,1) == 'p' ? pretherest + '&chd=t:' :
((ctype + ' ').substring(0,2).substring(0,1) == 'bv'.substring(0,1) ? '&chd=t:' : (ctype.substring(0,1) == 'l' ? '&chd=t:' :
(ctype == 'map' ? '' :
(ctype == 'gom' ? '&chd=t:' :
(ctype == 'r' ? pretherest + '&chd=t:' :
'')))))))));
var chdeq=(ctype == 'v' ? '&chd=' : (ctype == 's' ? '&chd=' : (ctype == 'gv' ? '&chl=' :
(ctype.substring(0,1) == 'p' ? '&chd=' :
((ctype + ' ').substring(0,2).substring(0,1) == 'bv'.substring(0,1) ? '&chd=' : (ctype.substring(0,1) == 'l' ? '&chd=' :
(ctype == 'map' ? '&chld=' :
(ctype == 'gom' ? '&chld=' :
(ctype == 'r' ? '&chd=' :
'')))))))));
var tc=(ctype == 'v' ? 't:' : (ctype == 's' ? 't:' : (ctype == 'gv' ? '' :
(ctype.substring(0,1) == 'p' ? 't:' :
((ctype + ' ').substring(0,2).substring(0,1) == 'bv'.substring(0,1) ? 't:' : (ctype.substring(0,1) == 'l' ? 't:' :
(ctype == 'map' ? '' :
(ctype == 'gom' ? 't:' :
(ctype == 'r' ? 't:' :
'')))))))));
var chdl=(ctype == 'v' ? '&chdl=' : (ctype == 's' ? '&chdl=' : (ctype == 'gv' ? '' :
(ctype.substring(0,1) == 'p' ? '&chdl=' :
((ctype + ' ').substring(0,2).substring(0,1) == 'bv'.substring(0,1) ? '&chbh=' : (ctype.substring(0,1) == 'l' ? '&chbh=' :
(ctype == 'map' ? '' :
(ctype == 'gom' ? '&chdl=' :
(ctype == 'r' ? '&chxt=x&chxl=' :
'')))))))));

var prenchtt=(ctype == 'v' ? '100,80,60,30,30,30,10' : (ctype == 's' ? '12,87,75,41,23,96,68,71,34,9|98,60,27,34,56,79,58,74,18,76|84,23,69,81,47,94,60,93,64,54' : (ctype == 'gv' ? 'graph{C_0--H_0[type=s];C_0--H_1[type=s];C_0--H_2[type=s];C_0--C_1[type=s];C_1--H_3[type=s];C_1--H_4[type=s];C_1--H_5[type=s]}' :
(ctype.substring(0,1) == 'p' ? '1,2,3,4' :
((ctype + ' ').substring(0,2).substring(0,1) == 'bv'.substring(0,1) ? '5,5,5|10,10,10|15,15,15' : (ctype.substring(0,1) == 'l' ? '5,45,5|10,60,10|15,85,15' :
(ctype == 'map' ? '' :
(ctype == 'gom' ? '20,40,60' :
(ctype == 'r' ? '10,20,30,40,50' :
'')))))))));
var preachtt=(ctype == 'v' ? 'A|B|C' : (ctype == 's' ? 'Cats|Dogs' : (ctype == 'gv' ? '' :
(ctype.substring(0,1) == 'p' ? 'January|February|March|April' :
((ctype + ' ').substring(0,2).substring(0,1) == 'bv'.substring(0,1) ? '15,4,15' : (ctype.substring(0,1) == 'l' ? '15,4,15' :
(ctype == 'map' ? '' :
(ctype == 'gom' ? 'A|B|C' :
(ctype == 'r' ? '0:|1|2|3|4|5|6' :
'')))))))));
var defchco=(ctype == 'v' ? 'ff0000,00ff00,0000ff' : (ctype == 's' ? 'FF0000|0000FF&chxt=x,y' : (ctype == 'gv' ? '' :
(ctype.substring(0,1) == 'p' ? 'ff0000,00ff00,0000ff,ff00ff' :
((ctype + ' ').substring(0,2).substring(0,1) == 'bv'.substring(0,1) ? '4D89F9,C6D9FD,C6FDD9&chxt=x,y' : (ctype.substring(0,1) == 'l' ? '3D89F9.B6D9FD,B6FDD9&chxt=x,y' :
(ctype == 'map' ? '' :
(ctype == 'gom' ? 'ff0000,00ff00,0000ff' :
(ctype == 'r' ? 'FF0000,FF9900,ff0a00,00ffb0,000cff' :
'')))))))));

var prechtt=(ctype == 'v' ? chdt + prenchtt + chdl + preachtt : (ctype == 's' ? chdt + prenchtt + chdl + preachtt + '&chxt=x,y' : (ctype == 'gv' ? chdt + prenchtt :
(ctype.substring(0,1) == 'p' ? chdt + prenchtt + chdl + preachtt :
((ctype + ' ').substring(0,2).substring(0,1) == 'bv'.substring(0,1) ? chdt + prenchtt + chdl + preachtt : (ctype.substring(0,1) == 'l' ? chdt + prenchtt + chdl + preachtt :
(ctype == 'map' ? '' :
(ctype == 'gom' ? chdt + prenchtt + chdl + preachtt :
(ctype == 'r' ? chdt + prenchtt + chdl + preachtt :
'')))))))));
var promptone=(ctype == 'v' ? "Enter delimited values string for Venn Diagram such that ... " + String.fromCharCode(10) + "The first three values specify the sizes of three circles: A, B, & C. For chart with only two circles, specify zero for the third value." + String.fromCharCode(10) + "The fourth value specifies the size of the intersection of A and B." + String.fromCharCode(10) + "The fifth value specifies the size of the intersection of A and C. For a chart with only two circles, do not specify a value here." + String.fromCharCode(10) + "The sixth value specifies the size of the intersection of B and C. For a chart with only two circles, do not specify a value here." + String.fromCharCode(10) + "The seventh value specifies the size of the common intersection of A, B, and C. For a chart with only two circles, do not specify a value here." + String.fromCharCode(10) + String.fromCharCode(10) + "" : (ctype == 's' ? "Enter delimited values string for Scatter Chart" : (ctype == 'gv' ? "Enter delimited values string for GraphViz Chart" :
(ctype.substring(0,1) == 'p' ? "Enter delimited values string for Pie Chart" :
((ctype + ' ').substring(0,2).substring(0,1) == 'bv'.substring(0,1) ? "Enter v for Vertical or h for Horizontal then one of g for Group or s for Stacked or o for Overlapped Bar Chart look then a space and then enter delimited values string for Bar Chart. Here is a Candlestick and horizontal Bar Chart idea eg. hg 1:20,10,15,25,17,30|0,5,10,7,12,6|35,25,45,47,24,46|15,40,30,27,39,54|70,55,63,59,80,6 Here is a vertical Bar Chart and Box Chart idea vs 1:-1,5,10,7,12,-1|-1,25,30,27,24,-1|-1,40,45,47,39,-1|-1,55,63,59,80,-1|-1,30,40,35,30,-1|-1,-1,5,70,90,-1|-1,-1,-1,80,5,-1&chm=F,FF9900,0,1:4,40|H,0CBF0B,0,1:4,1:20|H,000000,4,1:4,1:40|H,0000FF,3,1:4,1:20|o,FF0000,5,-1,7|o,FF0000,6,-1,7 Prefix just the delimited string you enter by 1: to additionally display Candlestick/Box Charts or by 0: to only display Candlestick/Box Chart" :
(ctype.substring(0,1) == 'l' ? "Enter c for Even or s for Sparklines or xy for Just XY Line Chart look then a space and then enter delimited values string for Line Chart. Here is a Candlestick and Line Chart idea eg. c 1:20,10,15,25,17,30|0,5,10,7,12,6|35,25,45,47,24,46|15,40,30,27,39,54|70,55,63,59,80,6 Here is a Line Chart and Box Chart idea s 1:-1,5,10,7,12,-1|-1,25,30,27,24,-1|-1,40,45,47,39,-1|-1,55,63,59,80,-1|-1,30,40,35,30,-1|-1,-1,5,70,90,-1|-1,-1,-1,80,5,-1&chm=F,FF9900,0,1:4,40|H,0CBF0B,0,1:4,1:20|H,000000,4,1:4,1:40|H,0000FF,3,1:4,1:20|o,FF0000,5,-1,7|o,FF0000,6,-1,7 Prefix just the delimited string you enter by 1: to additionally display Candlestick/Box Charts or by 0: to only display Candlestick/Box Chart" :
(ctype == 'map' ? "" :
(ctype == 'gom' ? "Enter delimited values string for Google-O-Meter Chart" :
(ctype == 'r' ? "Enter delimited values string for Radar Chart but prefix with an s for smooth lines" :
"")))))))));
var oneprompt=(ctype == 'v' ? "Enter delimited values string for your Venn Diagram collaborations, optionally, such that ... " + String.fromCharCode(10) + "The first three values specify the sizes of three circles: A, B, & C. For chart with only two circles, specify zero for the third value." + String.fromCharCode(10) + "The fourth value specifies the size of the intersection of A and B." + String.fromCharCode(10) + "The fifth value specifies the size of the intersection of A and C. For a chart with only two circles, do not specify a value here." + String.fromCharCode(10) + "The sixth value specifies the size of the intersection of B and C. For a chart with only two circles, do not specify a value here." + String.fromCharCode(10) + "The seventh value specifies the size of the common intersection of A, B, and C. For a chart with only two circles, do not specify a value here." + String.fromCharCode(10) + String.fromCharCode(10) + "" : (ctype == 's' ? "Enter delimited values string for Scatter Chart" : (ctype == 'gv' ? "Enter delimited values string for GraphViz Chart" :
(ctype.substring(0,1) == 'p' ? "Enter delimited values string for Pie Chart" :
((ctype + ' ').substring(0,2).substring(0,1) == 'bv'.substring(0,1) ? "Enter g for Grouped or s for Stacked or o for Overlapped Bar Chart look then a space and then enter delimited values string for Bar Chart. Here is a Candlestick and Bar Chart idea eg. g 1:20,10,15,25,17,30|0,5,10,7,12,6|35,25,45,47,24,46|15,40,30,27,39,54|70,55,63,59,80,6 Here is a vertical Bar Chart and Box Chart idea vs 1:-1,5,10,7,12,-1|-1,25,30,27,24,-1|-1,40,45,47,39,-1|-1,55,63,59,80,-1|-1,30,40,35,30,-1|-1,-1,5,70,90,-1|-1,-1,-1,80,5,-1&chm=F,FF9900,0,1:4,40|H,0CBF0B,0,1:4,1:20|H,000000,4,1:4,1:40|H,0000FF,3,1:4,1:20|o,FF0000,5,-1,7|o,FF0000,6,-1,7 Prefix just the delimited string you enter by 1: to additionally display Candlestick/Box Charts or by 0: to only display Candlestick/Box Chart" :
(ctype.substring(0,1) == 'l' ? "Enter c for Even or s for Sparklines or xy for Just XY Line Chart look then a space and then enter delimited values string for Line Chart. Here is a Candlestick and Line Chart idea eg. c 1:20,10,15,25,17,30|0,5,10,7,12,6|35,25,45,47,24,46|15,40,30,27,39,54|70,55,63,59,80,6 Here is a Line Chart and Box Chart idea s 1:-1,5,10,7,12,-1|-1,25,30,27,24,-1|-1,40,45,47,39,-1|-1,55,63,59,80,-1|-1,30,40,35,30,-1|-1,-1,5,70,90,-1|-1,-1,-1,80,5,-1&chm=F,FF9900,0,1:4,40|H,0CBF0B,0,1:4,1:20|H,000000,4,1:4,1:40|H,0000FF,3,1:4,1:20|o,FF0000,5,-1,7|o,FF0000,6,-1,7 Prefix just the delimited string you enter by 1: to additionally display Candlestick/Box Charts or by 0: to only display Candlestick/Box Chart" :
(ctype == 'map' ? "" :
(ctype == 'gom' ? "Enter delimited values string for Google-O-Meter Chart" :
(ctype == 'r' ? "Enter delimited values string for Radar Chart but prefix with an s for smooth lines" :
"")))))))));
var asktwo=(ctype == 'v' ? true : (ctype == 's' ? true : (ctype == 'gv' ? false :
(ctype.substring(0,1) == 'p' ? true :
((ctype + ' ').substring(0,2).substring(0,1) == 'bv'.substring(0,1) ? true : (ctype.substring(0,1) == 'l' ? true :
(ctype == 'map' ? false :
(ctype == 'gom' ? true :
(ctype == 'r' ? true :
false)))))))));

var twopb=(ctype.substring(0,1) == 'p' ? 'Any optional legend or title argument snippets? Optionally prefix by 3 for 3d Pie Chart or by c for Concentric Pie Chart. Eg. 3' + chdl + preachtt + '&chtt=My%20' + cencodename + '&chco=' + defchco : 'Any optional legend or title argument snippets? Eg. ' + chdl + preachtt + '&chtt=My%20' + cencodename + '&chco=' + defchco);
var beforeanswer=(ctype.substring(0,1) == 'l' ? 'c ' : ((ctype + ' ').substring(0,2).substring(0,1) == 'bv'.substring(0,1) ? 'vg ' : ''));


var emsmlist='';

… that goes into helping make the changed latest draft image_venn.html Google Chart Image Chart Venn Chart or Scatter Chart or GraphViz Chart or Pie Chart or Line Chart or Bar Chart or Candlestick/Box Chart or Google-O-Meter Chart or Radar Chart or Map Chart interfacing web application you can also try below, have regular sleepovers on cloud nine.

Did you know?

Did you notice the inclusion of CSS styling …

<style>

#fsangle { background-image: url("data:image/svg+xml;utf8,<svg xmlns='http://www.w3.org/2000/svg' width='24' height='24' viewport='0 0 100 100' style='font-family:Verdana;font-size:10px;'><text y='50%'> \00B0</text></svg>"); background-repeat: no-repeat; background-position: center right; }

</style>

? It styles an input type=number textbox where a placeholder is not really an option to explain a textbox’s purpose, and we do dislike set aside labels, these days. It’s also a way to explain the textbox for mobile users who do not get a hovering message to help. It’s also got an internationalization feel to it, using the degree sign emoji ° (ie. &#176; or that \u0080 UTF-16 Encoding style of definition suitable for CSS styling usage) to both associate the units we’d want, as well as that we are asking for an angle. Clockwise or anticlockwise, alas, comes down to user experience!


Previous relevant Google Chart Image Chart Box Chart Tutorial is shown below.

Google Chart Image Chart Box Chart Tutorial

Google Chart Image Chart Box Chart Tutorial

Today we offer new …

… interfacings, onto the progress up to yesterday’s Google Chart Image Chart Colour Tutorial.

As such, it’s probably timely to update you with the parameterization up the top of the Javascript code …


var pretherest='';
var newtherest='';
var tmod='';
var colchange='';
var cht=location.search.split('cht=')[1] ? decodeURIComponent(location.search.split('cht=')[1].split('&')[0]) : "v";
if ((cht + ' ').substring(0,1) == 'p' && cht != 'p') { pretherest=cht.substring(1); }
//if ((cht + ' ').substring(0,2) == 'bv' && cht != 'bv') { pretherest=cht.substring(2); if (1 == 1) { cht='bv'; } }
if ((cht + ' ').substring(0,1) == 'bv'.substring(0,1) && cht != 'bv'.substring(0,1)) { pretherest=cht.substring(1); if (1 == 1) { cht='bv'.substring(0,1); } }
if ((cht + ' ').substring(0,1) == 'l' && cht != 'l') { pretherest=cht.substring(1); if (1 == 1) { cht='l'; } }
var ccode=location.search.split('chld=')[1] ? decodeURIComponent(location.search.split('chld=')[1].split('&')[0]) : "";
var ctype=location.search.split('type=')[1] ? decodeURIComponent(location.search.split('type=')[1].split('&')[0]) : cht;
var cname=(ctype == 'v' ? 'Venn Chart' : (ctype == 's' ? 'Scatter Chart' : (ctype == 'gv' ? 'GraphViz Chart' :
(ctype.substring(0,1) == 'p' ? 'Pie Chart' :
((ctype + ' ').substring(0,2).substring(0,1) == 'bv'.substring(0,1) ? 'Bar Chart' : (ctype.substring(0,1) == 'l' ? 'Line Chart' :
(ctype == 'map' ? 'Map Chart' :
(ctype == 'gom' ? 'Google-O-Meter Chart' :
''))))))));
var cencodename=(ctype == 'v' ? 'Venn%20Diagram' : (ctype == 's' ? 'Scatter%20Chart' : (ctype == 'gv' ? 'GraphViz%20Chart' :
(ctype.substring(0,1) == 'p' ? 'Pie%20Chart' :
((ctype + ' ').substring(0,2).substring(0,1) == 'bv'.substring(0,1) ? 'Bar%20Chart' : (ctype.substring(0,1) == 'l' ? 'Line%20Chart' :
(ctype == 'map' ? 'Map%20Chart' :
(ctype == 'gom' ? 'Google-O-Meter%20Chart' :
''))))))));
var chdt=(ctype == 'v' ? '&chd=t:' : (ctype == 's' ? '&chd=t:' : (ctype == 'gv' ? '&chl=' :
(ctype.substring(0,1) == 'p' ? pretherest + '&chd=t:' :
((ctype + ' ').substring(0,2).substring(0,1) == 'bv'.substring(0,1) ? '&chd=t:' : (ctype.substring(0,1) == 'l' ? '&chd=t:' :
(ctype == 'map' ? '' :
(ctype == 'gom' ? '&chd=t:' :
''))))))));
var chdeq=(ctype == 'v' ? '&chd=' : (ctype == 's' ? '&chd=' : (ctype == 'gv' ? '&chl=' :
(ctype.substring(0,1) == 'p' ? '&chd=' :
((ctype + ' ').substring(0,2).substring(0,1) == 'bv'.substring(0,1) ? '&chd=' : (ctype.substring(0,1) == 'l' ? '&chd=' :
(ctype == 'map' ? '&chld=' :
(ctype == 'gom' ? '&chdl=' :
''))))))));
var tc=(ctype == 'v' ? 't:' : (ctype == 's' ? 't:' : (ctype == 'gv' ? '' :
(ctype.substring(0,1) == 'p' ? 't:' :
((ctype + ' ').substring(0,2).substring(0,1) == 'bv'.substring(0,1) ? 't:' : (ctype.substring(0,1) == 'l' ? 't:' :
(ctype == 'map' ? '' :
(ctype == 'gom' ? 't:' :
''))))))));
var chdl=(ctype == 'v' ? '&chdl=' : (ctype == 's' ? '&chdl=' : (ctype == 'gv' ? '' :
(ctype.substring(0,1) == 'p' ? '&chdl=' :
((ctype + ' ').substring(0,2).substring(0,1) == 'bv'.substring(0,1) ? '&chbh=' : (ctype.substring(0,1) == 'l' ? '&chbh=' :
(ctype == 'map' ? '' :
(ctype == 'gom' ? '&chdl=' :
''))))))));

var prenchtt=(ctype == 'v' ? '100,80,60,30,30,30,10' : (ctype == 's' ? '12,87,75,41,23,96,68,71,34,9|98,60,27,34,56,79,58,74,18,76|84,23,69,81,47,94,60,93,64,54' : (ctype == 'gv' ? 'graph{C_0--H_0[type=s];C_0--H_1[type=s];C_0--H_2[type=s];C_0--C_1[type=s];C_1--H_3[type=s];C_1--H_4[type=s];C_1--H_5[type=s]}' :
(ctype.substring(0,1) == 'p' ? '1,2,3,4' :
((ctype + ' ').substring(0,2).substring(0,1) == 'bv'.substring(0,1) ? '5,5,5|10,10,10|15,15,15' : (ctype.substring(0,1) == 'l' ? '5,45,5|10,60,10|15,85,15' :
(ctype == 'map' ? '' :
(ctype == 'gom' ? '20,40,60' :
''))))))));
var preachtt=(ctype == 'v' ? 'A|B|C' : (ctype == 's' ? 'Cats|Dogs' : (ctype == 'gv' ? '' :
(ctype.substring(0,1) == 'p' ? 'January|February|March|April' :
((ctype + ' ').substring(0,2).substring(0,1) == 'bv'.substring(0,1) ? '15,4,15' : (ctype.substring(0,1) == 'l' ? '15,4,15' :
(ctype == 'map' ? '' :
(ctype == 'gom' ? 'A|B|C' :
''))))))));
var defchco=(ctype == 'v' ? 'ff0000,00ff00,0000ff' : (ctype == 's' ? 'FF0000|0000FF&chxt=x,y' : (ctype == 'gv' ? '' :
(ctype.substring(0,1) == 'p' ? 'ff0000,00ff00,0000ff,ff00ff' :
((ctype + ' ').substring(0,2).substring(0,1) == 'bv'.substring(0,1) ? '4D89F9,C6D9FD,C6FDD9&chxt=x,y' : (ctype.substring(0,1) == 'l' ? '3D89F9.B6D9FD,B6FDD9&chxt=x,y' :
(ctype == 'map' ? '' :
(ctype == 'gom' ? 'ff0000,00ff00,0000ff' :
''))))))));

var prechtt=(ctype == 'v' ? chdt + prenchtt + chdl + preachtt : (ctype == 's' ? chdt + prenchtt + chdl + preachtt + '&chxt=x,y' : (ctype == 'gv' ? chdt + prenchtt :
(ctype.substring(0,1) == 'p' ? chdt + prenchtt + chdl + preachtt :
((ctype + ' ').substring(0,2).substring(0,1) == 'bv'.substring(0,1) ? chdt + prenchtt + chdl + preachtt : (ctype.substring(0,1) == 'l' ? chdt + prenchtt + chdl + preachtt :
(ctype == 'map' ? '' :
(ctype == 'gom' ? chdt + prenchtt + chdl + preachtt :
''))))))));
var promptone=(ctype == 'v' ? "Enter delimited values string for Venn Diagram such that ... " + String.fromCharCode(10) + "The first three values specify the sizes of three circles: A, B, & C. For chart with only two circles, specify zero for the third value." + String.fromCharCode(10) + "The fourth value specifies the size of the intersection of A and B." + String.fromCharCode(10) + "The fifth value specifies the size of the intersection of A and C. For a chart with only two circles, do not specify a value here." + String.fromCharCode(10) + "The sixth value specifies the size of the intersection of B and C. For a chart with only two circles, do not specify a value here." + String.fromCharCode(10) + "The seventh value specifies the size of the common intersection of A, B, and C. For a chart with only two circles, do not specify a value here." + String.fromCharCode(10) + String.fromCharCode(10) + "" : (ctype == 's' ? "Enter delimited values string for Scatter Chart" : (ctype == 'gv' ? "Enter delimited values string for GraphViz Chart" :
(ctype.substring(0,1) == 'p' ? "Enter delimited values string for Pie Chart" :
((ctype + ' ').substring(0,2).substring(0,1) == 'bv'.substring(0,1) ? "Enter v for Vertical or h for Horizontal then one of g for Group or s for Stacked or o for Overlapped Bar Chart look then a space and then enter delimited values string for Bar Chart. Here is a Candlestick and horizontal Bar Chart idea eg. hg 1:20,10,15,25,17,30|0,5,10,7,12,6|35,25,45,47,24,46|15,40,30,27,39,54|70,55,63,59,80,6 Here is a vertical Bar Chart and Box Chart idea vs 1:-1,5,10,7,12,-1|-1,25,30,27,24,-1|-1,40,45,47,39,-1|-1,55,63,59,80,-1|-1,30,40,35,30,-1|-1,-1,5,70,90,-1|-1,-1,-1,80,5,-1&chm=F,FF9900,0,1:4,40|H,0CBF0B,0,1:4,1:20|H,000000,4,1:4,1:40|H,0000FF,3,1:4,1:20|o,FF0000,5,-1,7|o,FF0000,6,-1,7 Prefix just the delimited string you enter by 1: to additionally display Candlestick/Box Charts or by 0: to only display Candlestick/Box Chart" :
(ctype.substring(0,1) == 'l' ? "Enter c for Even or s for Sparklines or xy for Just XY Line Chart look then a space and then enter delimited values string for Line Chart. Here is a Candlestick and Line Chart idea eg. c 1:20,10,15,25,17,30|0,5,10,7,12,6|35,25,45,47,24,46|15,40,30,27,39,54|70,55,63,59,80,6 Here is a Line Chart and Box Chart idea s 1:-1,5,10,7,12,-1|-1,25,30,27,24,-1|-1,40,45,47,39,-1|-1,55,63,59,80,-1|-1,30,40,35,30,-1|-1,-1,5,70,90,-1|-1,-1,-1,80,5,-1&chm=F,FF9900,0,1:4,40|H,0CBF0B,0,1:4,1:20|H,000000,4,1:4,1:40|H,0000FF,3,1:4,1:20|o,FF0000,5,-1,7|o,FF0000,6,-1,7 Prefix just the delimited string you enter by 1: to additionally display Candlestick/Box Charts or by 0: to only display Candlestick/Box Chart" :
(ctype == 'map' ? "" :
(ctype == 'gom' ? "Enter delimited values string for Google-O-Meter Chart" :
""))))))));
var oneprompt=(ctype == 'v' ? "Enter delimited values string for your Venn Diagram collaborations, optionally, such that ... " + String.fromCharCode(10) + "The first three values specify the sizes of three circles: A, B, & C. For chart with only two circles, specify zero for the third value." + String.fromCharCode(10) + "The fourth value specifies the size of the intersection of A and B." + String.fromCharCode(10) + "The fifth value specifies the size of the intersection of A and C. For a chart with only two circles, do not specify a value here." + String.fromCharCode(10) + "The sixth value specifies the size of the intersection of B and C. For a chart with only two circles, do not specify a value here." + String.fromCharCode(10) + "The seventh value specifies the size of the common intersection of A, B, and C. For a chart with only two circles, do not specify a value here." + String.fromCharCode(10) + String.fromCharCode(10) + "" : (ctype == 's' ? "Enter delimited values string for Scatter Chart" : (ctype == 'gv' ? "Enter delimited values string for GraphViz Chart" :
(ctype.substring(0,1) == 'p' ? "Enter delimited values string for Pie Chart" :
((ctype + ' ').substring(0,2).substring(0,1) == 'bv'.substring(0,1) ? "Enter g for Grouped or s for Stacked or o for Overlapped Bar Chart look then a space and then enter delimited values string for Bar Chart. Here is a Candlestick and Bar Chart idea eg. g 1:20,10,15,25,17,30|0,5,10,7,12,6|35,25,45,47,24,46|15,40,30,27,39,54|70,55,63,59,80,6 Here is a vertical Bar Chart and Box Chart idea vs 1:-1,5,10,7,12,-1|-1,25,30,27,24,-1|-1,40,45,47,39,-1|-1,55,63,59,80,-1|-1,30,40,35,30,-1|-1,-1,5,70,90,-1|-1,-1,-1,80,5,-1&chm=F,FF9900,0,1:4,40|H,0CBF0B,0,1:4,1:20|H,000000,4,1:4,1:40|H,0000FF,3,1:4,1:20|o,FF0000,5,-1,7|o,FF0000,6,-1,7 Prefix just the delimited string you enter by 1: to additionally display Candlestick/Box Charts or by 0: to only display Candlestick/Box Chart" :
(ctype.substring(0,1) == 'l' ? "Enter c for Even or s for Sparklines or xy for Just XY Line Chart look then a space and then enter delimited values string for Line Chart. Here is a Candlestick and Line Chart idea eg. c 1:20,10,15,25,17,30|0,5,10,7,12,6|35,25,45,47,24,46|15,40,30,27,39,54|70,55,63,59,80,6 Here is a Line Chart and Box Chart idea s 1:-1,5,10,7,12,-1|-1,25,30,27,24,-1|-1,40,45,47,39,-1|-1,55,63,59,80,-1|-1,30,40,35,30,-1|-1,-1,5,70,90,-1|-1,-1,-1,80,5,-1&chm=F,FF9900,0,1:4,40|H,0CBF0B,0,1:4,1:20|H,000000,4,1:4,1:40|H,0000FF,3,1:4,1:20|o,FF0000,5,-1,7|o,FF0000,6,-1,7 Prefix just the delimited string you enter by 1: to additionally display Candlestick/Box Charts or by 0: to only display Candlestick/Box Chart" :
(ctype == 'map' ? "" :
(ctype == 'gom' ? "Enter delimited values string for Google-O-Meter Chart" :
""))))))));
var asktwo=(ctype == 'v' ? true : (ctype == 's' ? true : (ctype == 'gv' ? false :
(ctype.substring(0,1) == 'p' ? true :
((ctype + ' ').substring(0,2).substring(0,1) == 'bv'.substring(0,1) ? true : (ctype.substring(0,1) == 'l' ? true :
(ctype == 'map' ? false :
(ctype == 'gom' ? true :
false))))))));

var twopb=(ctype.substring(0,1) == 'p' ? 'Any optional legend or title argument snippets? Optionally prefix by 3 for 3d Pie Chart or by c for Concentric Pie Chart. Eg. 3' + chdl + preachtt + '&chtt=My%20' + cencodename + '&chco=' + defchco : 'Any optional legend or title argument snippets? Eg. ' + chdl + preachtt + '&chtt=My%20' + cencodename + '&chco=' + defchco);
var beforeanswer=(ctype.substring(0,1) == 'l' ? 'c ' : ((ctype + ' ').substring(0,2).substring(0,1) == 'bv'.substring(0,1) ? 'vg ' : ''));

var emsmlist='';

… that goes into helping make the changed latest draft image_venn.html Google Chart Image Chart Venn Chart or Scatter Chart or GraphViz Chart or Pie Chart or Line Chart or Bar Chart or Candlestick/Box Chart or Google-O-Meter Chart or Map Chart interfacing web application you can also try below, one of the happiest little vegemites we know.


Previous relevant Google Chart Image Chart Colour Tutorial is shown below.

Google Chart Image Chart Colour Tutorial

Google Chart Image Chart Colour Tutorial

Restricting you creatives to “inhouse annotations” of the “gray variety” might be seen as a bit boooorrrriiiinnnngggg! And so, onto the progress up to yesterday’s Google Chart Image Chart Rubber Banding Tutorial, today we’ve added a …

  • colour picker … way user can define an “inhouse annotations” colour … and while we were at it …
  • as far as text “inhouse annotations” go we’ve added a counterclockwise from the horizon, in degrees, way to define an angle the text should be placed at … and …
  • we’ve stopped closing off the text font size dropdown too early, allowing the user to mix it up with their annotations, and so …

    We now recommend, for those users pushing the boundaries of functionality, to gather all their “inhouse annotations” together before any “graphical canvas annotations” are thought about.

Which begs the question …

Where do you get it?

Well, here, via … dare we say it?! … … via …

Mantissa Madness Monday

Both colour and degree counterclockwise angle became “Mantissa Madness Monday” tragics, a bit like moi, really?

How did we express these two measures?

  • colour can be derived at the 404.php end via mantissae that are 9 or more long where a number of the form rrrgggbbb is numerical and passed across to 404.php in the y co-ordinate mantissa … while … kind of crazily …
  • angle can be a set of zeros in the x co-ordinate mantissa represented by zero characters to the length of the angle from 1 to 359 in front of a pre-existant font size (in px) usage, from last “Mantissa Madness Monday” (us getting away with this because no font size should start with a zero)

Oh! We have such fun around here?! Below is PHP WordPress blog 404.php code …

<?php

// text placement
$black = imagecolorallocatealpha($im, 1, 1, 1, 0);
$blackish = imagecolorallocatealpha($im, 127, 127, 127, 64);
$yis=$csv[1];
$mantissae=explode('.', ('' . $csv[1]));
if (sizeof($mantissae) > 1) {
if (strlen($mantissae[1]) >= 9) {
$black = imagecolorallocatealpha($im, intval(substr($mantissae[1],0,3)), intval(substr(substr($mantissae[1],3),0,3)), intval(substr(substr($mantissae[1],6),0,3)), 0);
$blackish = imagecolorallocatealpha($im, intval(substr($mantissae[1],0,3)), intval(substr(substr($mantissae[1],3),0,3)), intval(substr(substr($mantissae[1],6),0,3)), 64);
}
$yis=$mantissae[0];
}

$za=0;
$xis=$csv[0];

$mantissae=explode('.', ('' . $csv[0]));
if (sizeof($mantissae) > 1) {
if (substr($mantissae[1],0,1) == '0') {
if (str_replace('0','',$mantissae[1]) != '') {
while (substr($mantissae[1],0,1) == '0') {
$za++;
$mantiss=substr($mantissae[1],1);
$mantissae[1]=$mantiss;
}
}
}

$tenpx=$mantissae[1];
$xis=$mantissae[0];
}
try {
if (function_exists('imagettftext')) {
if (explode('' . $csv[0] . ',' . $csv[1] . ',', $plotstring)[1] !== '') {
//echo explode('' . $csv[0] . ',' . $csv[1] . ',', $plotstring)[1];
//exit;
imagettftext($im, $tenpx, $za, $xis, $yis, $black, realpath('arial.ttf'), explode('' . $csv[0] . ',' . $csv[1] . ',', $plotstring)[1]);
}
}
} catch (Exception $e) { }

?>

… used by our changed latest draft image_venn.html Google Chart Image Chart Venn Chart or Scatter Chart or GraphViz Chart or Pie Chart or Line Chart or Bar Chart or Candlestick Chart or Map Chart interfacing web application you can also try below.


Previous relevant Google Chart Image Chart Rubber Banding Tutorial is shown below.

Google Chart Image Chart Rubber Banding Tutorial

Google Chart Image Chart Rubber Banding Tutorial

The Javascript clientside idea of “Rubber Banding”

Rubber banding is a popular technique of drawing geometric primitives such as line, polylines, rectangle, circle and ellipse on the computer screen.

… really appeals to our “inner programmer” … damn! … come, thou, out into the open, reveal thyself! … the sunshine is wonderful down here, and we’ve done away with death duties! … mostly! but it is …

  • only really a non-mobile prospect …

    function checkforaction(rubberbanding,nx,ny) {
    var bcbit='background-color:rgba(127,127,127,0.5);';
    var zeroes='';
    var classbit='';
    var brbit='';
    var ourdist=0;
    var ioff=(rubberbanding == true ? 1 : 0);
    var mone=1;

    curno=eval('' + xneeds.length);
    if (eval(ioff + curno) >= needtohave) {
    if (!rubberbanding) {
    document.getElementById('fauxdtext').innerHTML='';
    }
    if (curmode == 8) {
    zeroes='00000000';
    classbit=' class="crerect" ';
    } else if (curmode == -5) {
    //alert(1);
    bcbit='border:2px solid rgba(127,127,127,0.5);';
    if (rubberbanding) {
    ourdist=eval(2.0 * Math.sqrt((nx - xneeds[0]) * (nx - xneeds[0]) + (ny - yneeds[0]) * (ny - yneeds[0])));
    ourdist-=10;
    bcbit='border:2px solid gray;background-color:transparent;';
    } else {
    ourdist=eval(2.0 * Math.sqrt((xneeds[1] - xneeds[0]) * (xneeds[1] - xneeds[0]) + (yneeds[1] - yneeds[0]) * (yneeds[1] - yneeds[0])));
    }
    //alert(ourdist);
    //xneeds[1]=Math.floor('' + ourdist);
    //yneeds[1]=xneeds[1];
    brbit='border-radius:' + Math.floor(eval(ourdist / 2)) + 'px;';
    zeroes='00000';
    classbit=' class="ocirc" ';
    //alert('open circle');
    } else if (curmode == 6) {
    if (rubberbanding) {
    ourdist=eval(2.0 * Math.sqrt((nx - xneeds[0]) * (nx - xneeds[0]) + (ny - yneeds[0]) * (ny - yneeds[0])));
    ourdist-=10;
    } else {
    ourdist=eval(2.0 * Math.sqrt((xneeds[1] - xneeds[0]) * (xneeds[1] - xneeds[0]) + (yneeds[1] - yneeds[0]) * (yneeds[1] - yneeds[0])));
    }
    //xneeds[1]=Math.floor('' + ourdist);
    //yneeds[1]=xneeds[1];
    brbit='border-radius:' + Math.floor(eval(ourdist / 2)) + 'px;';
    //bcbit='border:2px solid rgba(127,127,127,0.5);';
    zeroes='000000';
    classbit=' class="ccirc" ';
    //alert('closed circle ' + bcbit);
    } else if (curmode == -4) {
    if (rubberbanding) {
    mone=0.90;
    bcbit='border:2px solid gray;background-color:transparent;';
    } else {
    bcbit='border:2px solid rgba(127,127,127,0.5);';
    }
    zeroes='00';
    classbit=' class="orect" ';
    } else if (curmode == 2) {
    zeroes='0';
    if (rubberbanding) {
    if (Math.min(xneeds[0],nx) == xneeds[0] && Math.min(yneeds[0],ny) == ny) { // thanks to https://stackoverflow.com/questions/18012420/draw-diagonal-lines-in-div-background-with-css
    classbit=' class="crossedtotl" ';
    } else if (Math.min(xneeds[0],nx) == nx && Math.min(yneeds[0],ny) == yneeds[0]) { // thanks to https://stackoverflow.com/questions/18012420/draw-diagonal-lines-in-div-background-with-css
    classbit=' class="crossedtotl" ';
    } else {
    classbit=' class="crossedtotr" ';
    }
    } else {
    if (Math.min(xneeds[0],xneeds[1]) == xneeds[0] && Math.min(yneeds[0],yneeds[1]) == yneeds[1]) { // thanks to https://stackoverflow.com/questions/18012420/draw-diagonal-lines-in-div-background-with-css
    classbit=' class="crossedtotl" ';
    } else if (Math.min(xneeds[0],xneeds[1]) == xneeds[1] && Math.min(yneeds[0],yneeds[1]) == yneeds[0]) { // thanks to https://stackoverflow.com/questions/18012420/draw-diagonal-lines-in-div-background-with-css
    classbit=' class="crossedtotl" ';
    } else {
    classbit=' class="crossedtotr" ';
    }
    }
    bcbit='';
    } else if (curmode == 4) {
    if (rubberbanding) {
    mone=0.90;
    }
    zeroes='0000';
    classbit=' class="crect" ';
    }
    if (!rubberbanding) {
    curno=-1;
    //if (brbit != '') {
    //document.getElementById('dtext').innerHTML+='<div' + classbit + ' style="' + brbit + 'position:absolute;left:' + Math.min(xneeds[0],nx) + 'px;top:' + Math.min(yneeds[0],ny) + 'px;width:' + Math.abs(xneeds[0] - nx) + 'px;height:' + Math.abs(yneeds[0] - ny) + 'px;z-index:98;' + bcbit + '"></div>';
    //} else {
    //document.getElementById('dtext').innerHTML+='<div' + classbit + ' style="' + brbit + 'position:absolute;left:' + Math.min(xneeds[0],xneeds[1]) + 'px;top:' + Math.min(yneeds[0],yneeds[1]) + 'px;width:' + Math.abs(xneeds[0] - xneeds[1]) + 'px;height:' + Math.abs(yneeds[0] - yneeds[1]) + 'px;z-index:98;' + bcbit + '"></div>';
    //}
    document.getElementById('aemail').href+='&text' + textnum + '=' + encodeURIComponent('' + xneeds[0] + '.' + zeroes + xneeds[1] + ',' + yneeds[0] + '.' + yneeds[1] + ',') + '';
    document.getElementById('asms').href+='&text' + textnum + '=' + encodeURIComponent('' + xneeds[0] + '.' + zeroes + xneeds[1] + ',' + yneeds[0] + '.' + yneeds[1] + ',') + '';
    aemailurl+='&text' + textnum + '=' + encodeURIComponent('' + xneeds[0] + '.' + zeroes + xneeds[1] + ',' + yneeds[0] + '.' + yneeds[1] + ',') + '';
    asmsurl+='&text' + textnum + '=' + encodeURIComponent('' + xneeds[0] + '.' + zeroes + xneeds[1] + ',' + yneeds[0] + '.' + yneeds[1] + ',') + '';
    arest+='&text' + textnum + '=' + encodeURIComponent('' + xneeds[0] + '.' + zeroes + xneeds[1] + ',' + yneeds[0] + '.' + yneeds[1] + ',') + '';
    }
    if (brbit != '') {
    //alert('brbit=' + brbit);
    //xneeds[0]-=(xneeds[1] - xneeds[0]);
    //yneeds[0]-=(yneeds[1] - yneeds[0]);
    //alert('xneeds[0]=' + xneeds[0]);
    if (rubberbanding) {
    document.getElementById('fauxdtext').innerHTML='<div' + classbit + ' style="' + brbit + 'z-index:-89;position:absolute;left:' + Math.floor(eval(Math.min(xneeds[0],xneeds[0]) - ourdist / 2)) + 'px;top:' + Math.floor(eval(Math.min(yneeds[0],yneeds[0]) - ourdist / 2)) + 'px;width:' + ourdist + 'px;height:' + ourdist + 'px;z-index:98;' + bcbit + '"></div>';
    } else {
    document.getElementById('dtext').innerHTML+='<div' + classbit + ' style="' + brbit + 'position:absolute;left:' + Math.floor(eval(Math.min(xneeds[0],xneeds[0]) - ourdist / 2)) + 'px;top:' + Math.floor(eval(Math.min(yneeds[0],yneeds[0]) - ourdist / 2)) + 'px;width:' + ourdist + 'px;height:' + ourdist + 'px;z-index:98;' + bcbit + '"></div>';
    }
    } else {
    if (rubberbanding) {
    document.getElementById('fauxdtext').innerHTML='<div' + classbit + ' style="' + brbit + 'z-index:-89;position:absolute;left:' + Math.min(xneeds[0],nx) + 'px;top:' + Math.min(yneeds[0],ny) + 'px;width:' + Math.max(Math.floor(eval(-30 + Math.abs(xneeds[0] - nx))),Math.floor(eval(mone * Math.abs(xneeds[0] - nx)))) + 'px;height:' + Math.max(Math.floor(eval(-30 + Math.abs(yneeds[0] - ny))),Math.floor(eval(mone * Math.abs(yneeds[0] - ny)))) + 'px;z-index:98;' + bcbit + '"></div>';
    } else {
    document.getElementById('dtext').innerHTML+='<div' + classbit + ' style="' + brbit + 'position:absolute;left:' + Math.min(xneeds[0],xneeds[1]) + 'px;top:' + Math.min(yneeds[0],yneeds[1]) + 'px;width:' + Math.abs(xneeds[0] - xneeds[1]) + 'px;height:' + Math.abs(yneeds[0] - yneeds[1]) + 'px;z-index:98;' + bcbit + '"></div>';
    }
    }
    if (!rubberbanding) {
    textnum++;
    xneeds=[];
    yneeds=[];
    //alert('arest=' + arest);
    document.getElementById('tdright').innerHTML="  <span id=spemail><a target=_blank href='mailto:?subject=My%20" + cencodename + "%20...%20best%20viewed%20in%20landscape%20...&body=" + encodeURIComponent((document.getElementById('myvenn').src + arest).replace((document.getElementById('myvenn').src + arest).split('?')[0].split('#')[0], document.URL.split('?')[0].split('#')[0])) + "' id=aemail title=Email>&#128231;</a></span>      <span id=spsms><a target=_blank onmouseover=\"if (smsee.length == 0 && origsmsurl.indexOf('sms:&') != -1) { smsee=prompt('Please enter SMS number to send to.', ''); if (smsee == null) { smsee=''; } else { origsmsurl=origsmsurl.replace('sms:&','sms:' + smsee + '&'); asmsurl=asmsurl.replace('sms:&','sms:' + smsee + '&'); this.href=asmsurl; } }\" ontouchstart=\"if (smsee.length == 0 && origsmsurl.indexOf('sms:&') != -1) { smsee=prompt('Please enter SMS number to send to.', ''); if (smsee == null) { smsee=''; } else { origsmsurl=origsmsurl.replace('sms:&','sms:' + smsee + '&'); asmsurl=asmsurl.replace('sms:&','sms:' + smsee + '&'); this.href=asmsurl; } }\" href='sms:&body=" + encodeURIComponent((document.getElementById('myvenn').src + arest).replace(document.getElementById('myvenn').src.split('?')[0].split('#')[0], document.URL.split('?')[0].split('#')[0])) + "' id=asms title=SMS>&#128223;</a></span><br><br>  <input title=\"\" onclick=\"event.stopPropagation();\" id=ilp onblur=\"waitfortwo(0); lasttext=this.value.replace(/\~\~/g, '<br>'); this.title=lasttext; if (!navigator.userAgent.match(/Android|BlackBerry|iPhone|iPad|iPod|Opera Mini|IEMobile/i)) { this.value=''; } this.placeholder='Click where you want ... ' + lasttext.replace(/\<br\>/g, String.fromCharCode(10)); mvp.setAttribute('content','initial-scale=1'); document.getElementById('myvenn').scrollIntoView();\" placeholder='Enter text and later click place for it on " + decodeURIComponent(cencodename) + " to left (line feed is ~~)' type=text style=width:500px; value=''></input>" + fszbit + "<br><br>  <img id=line src='/MarkItUp/line.png' onclick=\"event.stopPropagation(); this.style.border='1px dotted red'; waitfortwo(2);\"></img>  <img id=rectangle src='/MarkItUp/rectangle.png' onclick=\"event.stopPropagation(); this.style.border='1px dotted red'; waitfortwo(4);\"></img>  <img id=orectangle src='/MarkItUp/orectangle.png' onclick=\"event.stopPropagation(); this.style.border='1px dotted red'; waitfortwo(-4);\"></img>  <img id=circle src='/MarkItUp/circlefill.png' onclick=\"event.stopPropagation(); this.style.border='1px dotted red'; waitfortwo(6);\"></img>  <img id=ocircle src='/MarkItUp/circle.png' onclick=\"event.stopPropagation(); this.style.border='1px dotted red'; waitfortwo(-5);\"></img>  <button id=orerect onclick=\"event.stopPropagation(); this.style.border='1px dotted red'; waitfortwo(8);\" title=\"Zoom in on rectangle you define via two clicks\" style=display:none;>&#128270;</button>" + lastbit + atend;
    //alert(1);
    if (!navigator.userAgent.match(/Android|BlackBerry|iPhone|iPad|iPod|Opera Mini|IEMobile/i)) { document.getElementById('ilp').focus(); }
    document.getElementById('ilp').placeholder='Enter text and later click place for it on ' + decodeURIComponent(cencodename) + ' to left (line feed is ~~)';
    }
    } else if (curmode == 2 && !rubberbanding) {
    document.getElementById('line').style.border='1px dashed yellow';
    } else if (curmode == -4 && !rubberbanding) {
    document.getElementById('orectangle').style.border='1px dashed yellow';
    } else if (curmode == 4 && !rubberbanding) {
    document.getElementById('rectangle').style.border='1px dashed yellow';
    } else if (curmode == -5 && !rubberbanding) {
    document.getElementById('ocircle').style.border='1px dashed yellow';
    } else if (curmode == 6 && !rubberbanding) {
    document.getElementById('circle').style.border='1px dashed yellow';
    } else if (curmode == 8 && !rubberbanding) {
    document.getElementById('orerect').style.border='1px dashed yellow';
    }
    }

    // Rubber banding
    document.body.addEventListener('mousemove', function(evt){
    evt = evt || window.event;

    evt.preventDefault();

    elemLeft = document.getElementById('myvenn').offsetLeft;
    elemTop = document.getElementById('myvenn').offsetTop;

    //document.getElementById('myh3').innerHTML+=' ' + elemLeft + ':' + elemTop;
    //document.getElementById('myh3').innerHTML+=' ' + document.body.scrollLeft + '.' + document.body.scrollTop;

    if (evt.touches) {
    if (evt.touches[0].pageX) {
    //alert('here');
    xx = evt.touches[0].pageX + document.body.scrollLeft - elemLeft;
    yy = evt.touches[0].pageY + document.body.scrollTop - elemTop;
    if (xx >= 0 && xx <= eval(('' + document.getElementById('myvenn').width).replace('px','')) && yy >= 0 && yy <= eval(('' + document.getElementById('myvenn').height).replace('px',''))) {
    if (curno == 1 && (lastx != xx || lasty != yy)) {
    checkforaction(true,xx,yy);
    }
    //lastx=xx;
    //lasty=yy;
    //alert('x:' + x + ' and y:' + y);
    }
    } else {
    //alert('Here');
    xx = evt.touches[0].clientX + document.body.scrollLeft - elemLeft;
    yy = evt.touches[0].clientY + document.body.scrollTop - elemTop;
    if (xx >= 0 && xx <= eval(('' + document.getElementById('myvenn').width).replace('px','')) && yy >= 0 && yy <= eval(('' + document.getElementById('myvenn').height).replace('px',''))) {
    if (curno == 1 && (lastx != xx || lasty != yy)) {
    checkforaction(true,xx,yy);
    }
    //lastx=xx;
    //lasty=yy;
    //alert('x:' + x + ' and y:' + y);
    }
    }
    } else if (evt.clientX || ev.clientY) {
    //alert('HERE');
    xx = evt.clientX + document.body.scrollLeft - elemLeft;
    yy = evt.clientY + document.body.scrollTop - elemTop;
    if (xx >= 0 && xx <= eval(('' + document.getElementById('myvenn').width).replace('px','')) && yy >= 0 && yy <= eval(('' + document.getElementById('myvenn').height).replace('px',''))) {
    if (curno == 1 && (lastx != xx || lasty != yy)) {
    checkforaction(true,xx,yy);
    }
    //lastx=xx;
    //lasty=yy;
    }
    } else {
    //alert('HEre');
    xx = evt.pageX + document.body.scrollLeft - elemLeft;
    yy = evt.pageY + document.body.scrollTop - elemTop;
    if (xx >= 0 && xx <= eval(('' + document.getElementById('myvenn').width).replace('px','')) && yy >= 0 && yy <= eval(('' + document.getElementById('myvenn').height).replace('px',''))) {
    if (curno == 1 && (lastx != xx || lasty != yy)) {
    checkforaction(true,xx,yy);
    }
    //lastx=xx;
    //lasty=yy;
    }
    }
    });

    … at least for us (being as we do not want to clobber any pinch or spread gesture ideas, for the user)
  • is only a really, “nice to have” functionality idea

Even so, achieving even a 95% percent working “rubber band” is like … is like …

Barracking for Hairtie United …
You little beauty, Untied!

And so, further to yesterday’s Google Chart Image Chart Circle Annotation Tutorial we have this non-mobile “Rubber Banding” inhouse annotation functionality included in our changed latest draft image_venn.html Google Chart Image Chart Venn Chart or Scatter Chart or GraphViz Chart or Pie Chart or Line Chart or Bar Chart or Candlestick Chart or Map Chart interfacing web application you can also try below.

But there’s more! Despite how long out of the day it takes to barrack for Hairtie United, there was a mobile matter we resolved. A slide in today’s animated GIF presentation shows the issue. On mobile platforms, with these inhouse annotations, it would immediately show a tiny annotation. There panned out to be two event programming related issues we needed to fix related to this problem …

  1. change looking for a “touchstart” event, and instead look for a “touchdown” event for a document.body scope (else we might have restricted the “scope” to just document.getEleementById(‘myvenn’) as another approach (and you should note our event.stopPropagation() statements in lots of places as another research point for you)) because we are talking “discrete click” user behaviour we are targeting … as well as …
  2. start checking that the co-ordinates calculated fall into the range of the Google Charts Image Chart image dimensions … doh!


document.body.addEventListener('touchdown', function(evt){
//alert(8);
evt = evt || window.event;

evt.preventDefault();

elemLeft = document.getElementById('myvenn').offsetLeft;
elemTop = document.getElementById('myvenn').offsetTop;

//document.getElementById('myh3').innerHTML+=' ' + elemLeft + ';' + elemTop;

if (evt.touches) {
if (evt.touches[0].pageX) {
//alert('here');
x = evt.touches[0].pageX + document.body.scrollLeft - elemLeft;
y = evt.touches[0].pageY + document.body.scrollTop - elemTop;
if (x >= 0 && x <= eval(('' + document.getElementById('myvenn').width).replace('px','')) && y >= 0 && y <= eval(('' + document.getElementById('myvenn').height).replace('px',''))) {
if (curno >= 0 && (lastx != x || lasty != y)) {
xneeds.push(x);
yneeds.push(y);
checkforaction(false,-1,-1);
}
lastx=x;
lasty=y;
}
//alert('x:' + x + ' and y:' + y);
} else {
//alert('Here');
x = evt.touches[0].clientX + document.body.scrollLeft - elemLeft;
y = evt.touches[0].clientY + document.body.scrollTop - elemTop;
if (x >= 0 && x <= eval(('' + document.getElementById('myvenn').width).replace('px','')) && y >= 0 && y <= eval(('' + document.getElementById('myvenn').height).replace('px',''))) {
if (curno >= 0 && (lastx != x || lasty != y)) {
xneeds.push(x);
yneeds.push(y);
checkforaction(false,-1,-1);
}
lastx=x;
lasty=y;
}
//alert('x:' + x + ' and y:' + y);
}
} else if (evt.clientX || ev.clientY) {
//alert('HERE');
x = evt.clientX + document.body.scrollLeft - elemLeft;
y = evt.clientY + document.body.scrollTop - elemTop;
if (x >= 0 && x <= eval(('' + document.getElementById('myvenn').width).replace('px','')) && y >= 0 && y <= eval(('' + document.getElementById('myvenn').height).replace('px',''))) {
if (curno >= 0 && (lastx != x || lasty != y)) {
xneeds.push(x);
yneeds.push(y);
checkforaction(false,-1,-1);
}
lastx=x;
lasty=y;
}
} else {
//alert('HEre');
x = evt.pageX + document.body.scrollLeft - elemLeft;
y = evt.pageY + document.body.scrollTop - elemTop;
if (x >= 0 && x <= eval(('' + document.getElementById('myvenn').width).replace('px','')) && y >= 0 && y <= eval(('' + document.getElementById('myvenn').height).replace('px',''))) {
if (curno >= 0 && (lastx != x || lasty != y)) {
xneeds.push(x);
yneeds.push(y);
checkforaction(false,-1,-1);
}
lastx=x;
lasty=y;
}
}
});

Did you know?

Well … we didn’t?! We happened to try the web application above on a tiny iPad and saw that HTML button elements with an innerHTML label containing a line feed ( ie. <br> ) only showed the top line, and, alas, for that button in question, the vital new information used to be on the second line. Hence our fix …


//document.getElementById('bshare').innerHTML='Repainting Top Left Image Periodically ... <br>Click here to Broadcast this session to other interested parties ...';
document.getElementById('bshare').innerHTML='Click here to Broadcast this session to other interested parties ...<br>Repainting Top Left Image Periodically ...';


Previous relevant Google Chart Image Chart Circle Annotation Tutorial is shown below.

Google Chart Image Chart Circle Annotation Tutorial

Google Chart Image Chart Circle Annotation Tutorial

Today, we add …

  • open circle
  • filled circle

… annotation possibilities onto the “Broadcast Talk” work in yesterday’s Google Chart Image Chart Broadcast Talk Context Tutorial.

The CSS border-radius property has come to the rescue of many a programmer, saving us from resorting to SVG to display circle or ellipses or arcs of various sorts …


function checkforaction() {
var bcbit='background-color:rgba(127,127,127,0.5);';
var zeroes='';
var classbit='';
var brbit='';
var ourdist=0;


curno=eval('' + xneeds.length);
if (curno >= needtohave) {
if (curmode == 8) {
zeroes='00000000';
classbit=' class="crerect" ';
} else if (curmode == -5) {
//alert(1);
ourdist=eval(2.0 * Math.sqrt((xneeds[1] - xneeds[0]) * (xneeds[1] - xneeds[0]) + (yneeds[1] - yneeds[0]) * (yneeds[1] - yneeds[0])));
//alert(ourdist);
//xneeds[1]=Math.floor('' + ourdist);
//yneeds[1]=xneeds[1];
brbit='border-radius:' + Math.floor(eval(ourdist / 2)) + 'px;';
bcbit='border:2px solid rgba(127,127,127,0.5);';
zeroes='00000';
classbit=' class="ocirc" ';
//alert('open circle');
} else if (curmode == 6) {
ourdist=eval(2.0 * Math.sqrt((xneeds[1] - xneeds[0]) * (xneeds[1] - xneeds[0]) + (yneeds[1] - yneeds[0]) * (yneeds[1] - yneeds[0])));
//xneeds[1]=Math.floor('' + ourdist);
//yneeds[1]=xneeds[1];
brbit='border-radius:' + Math.floor(eval(ourdist / 2)) + 'px;';
//bcbit='border:2px solid rgba(127,127,127,0.5);';
zeroes='000000';
classbit=' class="ccirc" ';
//alert('closed circle ' + bcbit);
}
else if (curmode == -4) {
bcbit='border:2px solid rgba(127,127,127,0.5);';
zeroes='00';
classbit=' class="orect" ';
} else if (curmode == 2) {
zeroes='0';
if (Math.min(xneeds[0],xneeds[1]) == xneeds[0] && Math.min(yneeds[0],yneeds[1]) == yneeds[1]) { // thanks to https://stackoverflow.com/questions/18012420/draw-diagonal-lines-in-div-background-with-css
classbit=' class="crossedtotl" ';
} else if (Math.min(xneeds[0],xneeds[1]) == xneeds[1] && Math.min(yneeds[0],yneeds[1]) == yneeds[0]) { // thanks to https://stackoverflow.com/questions/18012420/draw-diagonal-lines-in-div-background-with-css
classbit=' class="crossedtotl" ';
} else {
classbit=' class="crossedtotr" ';
}
bcbit='';
} else if (curmode == 4) {
zeroes='0000';
classbit=' class="crect" ';
}
curno=-1;
//if (brbit != '') {
//document.getElementById('dtext').innerHTML+='<div' + classbit + ' style="' + brbit + 'position:absolute;left:' + Math.min(xneeds[0],xneeds[1]) + 'px;top:' + Math.min(yneeds[0],yneeds[1]) + 'px;width:' + Math.abs(xneeds[0] - xneeds[1]) + 'px;height:' + Math.abs(yneeds[0] - yneeds[1]) + 'px;z-index:98;' + bcbit + '"></div>';
//} else {
//document.getElementById('dtext').innerHTML+='<div' + classbit + ' style="' + brbit + 'position:absolute;left:' + Math.min(xneeds[0],xneeds[1]) + 'px;top:' + Math.min(yneeds[0],yneeds[1]) + 'px;width:' + Math.abs(xneeds[0] - xneeds[1]) + 'px;height:' + Math.abs(yneeds[0] - yneeds[1]) + 'px;z-index:98;' + bcbit + '"></div>';
//}
document.getElementById('aemail').href+='&text' + textnum + '=' + encodeURIComponent('' + xneeds[0] + '.' + zeroes + xneeds[1] + ',' + yneeds[0] + '.' + yneeds[1] + ',') + '';
document.getElementById('asms').href+='&text' + textnum + '=' + encodeURIComponent('' + xneeds[0] + '.' + zeroes + xneeds[1] + ',' + yneeds[0] + '.' + yneeds[1] + ',') + '';
aemailurl+='&text' + textnum + '=' + encodeURIComponent('' + xneeds[0] + '.' + zeroes + xneeds[1] + ',' + yneeds[0] + '.' + yneeds[1] + ',') + '';
asmsurl+='&text' + textnum + '=' + encodeURIComponent('' + xneeds[0] + '.' + zeroes + xneeds[1] + ',' + yneeds[0] + '.' + yneeds[1] + ',') + '';
arest+='&text' + textnum + '=' + encodeURIComponent('' + xneeds[0] + '.' + zeroes + xneeds[1] + ',' + yneeds[0] + '.' + yneeds[1] + ',') + '';
if (brbit != '') {
//alert('brbit=' + brbit);
//xneeds[0]-=(xneeds[1] - xneeds[0]);
//yneeds[0]-=(yneeds[1] - yneeds[0]);
//alert('xneeds[0]=' + xneeds[0]);
document.getElementById('dtext').innerHTML+='<div' + classbit + ' style="' + brbit + 'position:absolute;left:' + Math.floor(eval(Math.min(xneeds[0],xneeds[0]) - ourdist / 2)) + 'px;top:' + Math.floor(eval(Math.min(yneeds[0],yneeds[0]) - ourdist / 2)) + 'px;width:' + ourdist + 'px;height:' + ourdist + 'px;z-index:98;' + bcbit + '"></div>';
} else {

document.getElementById('dtext').innerHTML+='<div' + classbit + ' style="' + brbit + 'position:absolute;left:' + Math.min(xneeds[0],xneeds[1]) + 'px;top:' + Math.min(yneeds[0],yneeds[1]) + 'px;width:' + Math.abs(xneeds[0] - xneeds[1]) + 'px;height:' + Math.abs(yneeds[0] - yneeds[1]) + 'px;z-index:98;' + bcbit + '"></div>';
}
textnum++;
xneeds=[];
yneeds=[];
//alert('arest=' + arest);
document.getElementById('tdright').innerHTML="  <span id=spemail><a target=_blank href='mailto:?subject=My%20" + cencodename + "%20...%20best%20viewed%20in%20landscape%20...&body=" + encodeURIComponent((document.getElementById('myvenn').src + arest).replace((document.getElementById('myvenn').src + arest).split('?')[0].split('#')[0], document.URL.split('?')[0].split('#')[0])) + "' id=aemail title=Email>&#128231;</a></span>      <span id=spsms><a target=_blank onmouseover=\"if (smsee.length == 0 && origsmsurl.indexOf('sms:&') != -1) { smsee=prompt('Please enter SMS number to send to.', ''); if (smsee == null) { smsee=''; } else { origsmsurl=origsmsurl.replace('sms:&','sms:' + smsee + '&'); asmsurl=asmsurl.replace('sms:&','sms:' + smsee + '&'); this.href=asmsurl; } }\" ontouchstart=\"if (smsee.length == 0 && origsmsurl.indexOf('sms:&') != -1) { smsee=prompt('Please enter SMS number to send to.', ''); if (smsee == null) { smsee=''; } else { origsmsurl=origsmsurl.replace('sms:&','sms:' + smsee + '&'); asmsurl=asmsurl.replace('sms:&','sms:' + smsee + '&'); this.href=asmsurl; } }\" href='sms:&body=" + encodeURIComponent((document.getElementById('myvenn').src + arest).replace(document.getElementById('myvenn').src.split('?')[0].split('#')[0], document.URL.split('?')[0].split('#')[0])) + "' id=asms title=SMS>&#128223;</a></span><br><br>  <input title=\"\" onclick=\"event.stopPropagation();\" id=ilp onblur=\"waitfortwo(0); lasttext=this.value.replace(/\~\~/g, '<br>'); this.title=lasttext; if (!navigator.userAgent.match(/Android|BlackBerry|iPhone|iPad|iPod|Opera Mini|IEMobile/i)) { this.value=''; } this.placeholder='Click where you want ... ' + lasttext.replace(/\<br\>/g, String.fromCharCode(10)); mvp.setAttribute('content','initial-scale=1'); document.getElementById('myvenn').scrollIntoView();\" placeholder='Enter text and later click place for it on " + decodeURIComponent(cencodename) + " to left (line feed is ~~)' type=text style=width:500px; value=''></input>" + fszbit + "<br><br>  <img id=line src='/MarkItUp/line.png' onclick=\"event.stopPropagation(); this.style.border='1px dotted red'; waitfortwo(2);\"></img>  <img id=rectangle src='/MarkItUp/rectangle.png' onclick=\"event.stopPropagation(); this.style.border='1px dotted red'; waitfortwo(4);\"></img>  <img id=orectangle src='/MarkItUp/orectangle.png' onclick=\"event.stopPropagation(); this.style.border='1px dotted red'; waitfortwo(-4);\"></img>  <img id=circle src='/MarkItUp/circlefill.png' onclick=\"event.stopPropagation(); this.style.border='1px dotted red'; waitfortwo(6);\"></img>  <img id=ocircle src='/MarkItUp/circle.png' onclick=\"event.stopPropagation(); this.style.border='1px dotted red'; waitfortwo(-5);\"></img>  <button id=orerect onclick=\"event.stopPropagation(); this.style.border='1px dotted red'; waitfortwo(8);\" title=\"Zoom in on rectangle you define via two clicks\" style=display:none;>&#128270;</button>" + lastbit + atend;
//alert(1);
if (!navigator.userAgent.match(/Android|BlackBerry|iPhone|iPad|iPod|Opera Mini|IEMobile/i)) { document.getElementById('ilp').focus(); }
document.getElementById('ilp').placeholder='Enter text and later click place for it on ' + decodeURIComponent(cencodename) + ' to left (line feed is ~~)';
} else if (curmode == 2) {
document.getElementById('line').style.border='1px dashed yellow';
} else if (curmode == -4) {
document.getElementById('orectangle').style.border='1px dashed yellow';
} else if (curmode == 4) {
document.getElementById('rectangle').style.border='1px dashed yellow';
} else if (curmode == -5) {
document.getElementById('ocircle').style.border='1px dashed yellow';
} else if (curmode == 6) {
document.getElementById('circle').style.border='1px dashed yellow';
} else if (curmode == 8) {
document.getElementById('orerect').style.border='1px dashed yellow';
}
}

… to team up with WordPress blog 404.php changes …

<?php

if (strlen($zeroesbit) == 6) { // filled in circle
if (sizeof($csv) == 3) {
array_push($csv, $csv[2]);
} else if (sizeof($csv) >= 4) {
$dist=(2.0 * sqrt(($csv[0] - $csv[2]) * ($csv[0] - $csv[2]) + ($csv[1] - $csv[3]) * ($csv[1] - $csv[3])));
$csv[2]=$dist;
$csv[3]=$dist;
}
imagefilledellipse($im, $csv[0], $csv[1], $csv[2], $csv[3], $blackish);
} else if (strlen($zeroesbit) == 5) { // circle
if (sizeof($csv) == 3) {
array_push($csv, $csv[2]);
} else if (sizeof($csv) >= 4) {
$dist=(2.0 * sqrt(($csv[0] - $csv[2]) * ($csv[0] - $csv[2]) + ($csv[1] - $csv[3]) * ($csv[1] - $csv[3])));
$csv[2]=$dist;
$csv[3]=$dist;
}
imageellipse($im, $csv[0], $csv[1], $csv[2], $csv[3], $black);
}

?>

… with our changed ninth draft image_venn.html Google Chart Image Chart Venn Chart or Scatter Chart or GraphViz Chart or Pie Chart or Line Chart or Bar Chart or Candlestick Chart or Map Chart interfacing web application you can also try below.


Previous relevant Google Chart Image Chart Broadcast Talk Context Tutorial is shown below.

Google Chart Image Chart Broadcast Talk Context Tutorial

Google Chart Image Chart Broadcast Talk Context Tutorial

The progress, today, along the same lines as yesterday’s Google Chart Image Chart Broadcast Talk Tutorial‘s introduction of a “Broadcast Talk” functionality, was to …

  • improve “Broadcast Talk” context, by adding onto yesterday’s …

    presented as an update image still presented and updated periodically

    … only display option, with, as of today …

  • a presenter’s first snapshotted image retained for user display (in case they arrive late to the lesson … tutt tutt) … and …
  • ImageMagick created animated GIF with slides for just this first image and the most recent image, updated periodically, in bottom right cell of user display …
    <?php

    if (isset($_POST['canvcont']) && isset($_POST['uniquifier']) && strpos(('?' . $_SERVER['QUERY_STRING']), 'cht=') === false) {
    if (isset($_POST['uniquifier'])) {
    $uniquifier=str_replace('+',' ',urldecode($_POST['uniquifier']));
    }
    if ($uniquifier == '') {
    $uniquifier='_' . rand(0,78654356);
    file_put_contents($_SERVER['DOCUMENT_ROOT'] . DIRECTORY_SEPARATOR . "presentation" . $uniquifier . ".png", base64_decode( explode('base64,', str_replace(' ','+',urldecode($_POST['canvcont'])))[1]));
    exec("/usr/local/cpanel/3rdparty/bin/convert -delay 20 -loop 0 " . $_SERVER['DOCUMENT_ROOT'] . DIRECTORY_SEPARATOR . "presentation" . $uniquifier . ".png" . " " . $_SERVER['DOCUMENT_ROOT'] . DIRECTORY_SEPARATOR . "presentation" . $uniquifier . ".gif");
    echo "<html><body onload=\"if (parent.document.getElementById('uniquifier')) { if (parent.document.getElementById('uniquifier').value == '') { parent.document.getElementById('uniquifier').value='" . $uniquifier . "'; } }\"></body></html>";
    } else {
    file_put_contents($_SERVER['DOCUMENT_ROOT'] . DIRECTORY_SEPARATOR . "presentation" . $uniquifier . ".png", base64_decode( explode('base64,', str_replace(' ','+',urldecode($_POST['canvcont'])))[1]));
    exec("rm -f " . $_SERVER['DOCUMENT_ROOT'] . DIRECTORY_SEPARATOR . "presentation" . $uniquifier . ".gif ; /usr/local/cpanel/3rdparty/bin/convert -delay 200 -loop 0 " . $_SERVER['DOCUMENT_ROOT'] . DIRECTORY_SEPARATOR . "presentation_" . $uniquifier . ".png " . $_SERVER['DOCUMENT_ROOT'] . DIRECTORY_SEPARATOR . "presentation" . $uniquifier . ".png" . " " . $_SERVER['DOCUMENT_ROOT'] . DIRECTORY_SEPARATOR . "presentation" . $uniquifier . ".gif");
    }
    exit;
    }

    ?>
    … and …
  • images saved as changes are detected gathered, as ever smaller thumbnails, in the top right of four table cells of the user display …

    var iijk=0, uniquif=''; snapshots=[], elem=null, elemcontext=null, oimg=null, checkforsquare=2;

    function canvinit() {
    var kkii=0, wpx=0, hpx=0;
    var tdr=document.getElementById('tdtr').getBoundingClientRect();
    wpx=eval('' + tdr.width);
    hpx=eval('' + tdr.height);
    elem=document.getElementById('agcanvas');
    elemcontext=elem.getContext('2d');
    elem.width=elem.width;
    elemcontext.drawImage(document.getElementById('talkimg'),0,0);
    if (iijk == 0 || ('' + document.getElementById('tdtr').style.backgroundImage).indexOf('rand=0') != -1) {
    //alert('89 ' + elem.toDataURL().length);
    //snapshots.push(elem.toDataURL());
    iijk=eval(-1 + eval('' + ('' + document.getElementById('tdtr').style.backgroundImage).split('),').length));
    document.getElementById('tdtr').style.backgroundImage=('' + document.getElementById('tdtr').style.backgroundImage).replace(('' + document.getElementById('tdtr').style.backgroundImage).split('),')[iijk], '' + 'url(' + elem.toDataURL() + '),' + ('' + document.getElementById('tdtr').style.backgroundImage).split('),')[iijk]).replace('rand=0', 'rand=x');
    iijk=eval(0 + eval('' + ('' + document.getElementById('tdtr').style.backgroundImage).split('),').length));
    setInterval(canvinit, 9000);
    } else {
    elem.width=elem.width;
    elemcontext.drawImage(document.getElementById('talkimg'),0,0);
    if (document.body.innerHTML.indexOf(elem.toDataURL()) == -1) {
    //snapshots.push(elem.toDataURL());
    iijk=eval(-1 + eval('' + ('' + document.getElementById('tdtr').style.backgroundImage).split('),').length));
    document.getElementById('tdtr').style.backgroundImage=('' + document.getElementById('tdtr').style.backgroundImage).replace(('' + document.getElementById('tdtr').style.backgroundImage).split('),')[iijk], '' + 'url(' + elem.toDataURL() + '),' + ('' + document.getElementById('tdtr').style.backgroundImage).split('),')[iijk]).replace('rand=x','rand=x' + Math.floor(Math.random() * 9));
    iijk=eval(0 + eval('' + ('' + document.getElementById('tdtr').style.backgroundImage).split('),').length));
    }
    }
    var bpx='background-position:;';
    var bbpx='background-position:;';
    var bsx='background-size:;';
    var brx='background-repeat:;';
    var xstart=0;
    var ystart=0;
    var xxstart=eval('' + tdr.left);
    var yystart=eval('' + tdr.top);
    if (iijk > eval(checkforsquare * checkforsquare)) { checkforsquare++; }
    for (kkii=1; kkii<=iijk; kkii++) {
    if (bsx.indexOf(':;') != -1) {
    bsx=bsx.replace(':;', ':' + Math.round(eval(wpx / checkforsquare)) + 'px ' + Math.round(eval(hpx /checkforsquare)) + 'px;');
    brx=brx.replace(':;', ':no-repeat;');
    bpx=bpx.replace(':;', ':' + Math.round(xstart) + 'px ' + Math.round(ystart) + 'px;');
    bbpx=bbpx.replace(':;', ':' + Math.round(xxstart) + 'px ' + Math.round(yystart) + 'px;');
    } else {
    bsx=bsx.replace(';', ',' + Math.round(eval(wpx / checkforsquare)) + 'px ' + Math.round(eval(hpx /checkforsquare)) + 'px;');
    brx=brx.replace(';', ',no-repeat;');
    bpx=bpx.replace(';', ',' + Math.round(xstart) + 'px ' + Math.round(ystart) + 'px;');
    bbpx=bbpx.replace(';', ',' + Math.round(xxstart) + 'px ' + Math.round(yystart) + 'px;');
    }
    if (eval(kkii % checkforsquare) == 0) {
    xstart=0;
    xxstart=eval('' + tdr.left);
    ystart+=eval(hpx / checkforsquare);
    yystart+=eval(hpx / checkforsquare);
    } else {
    xstart+=eval(wpx / checkforsquare);
    xxstart+=eval(wpx / checkforsquare);
    }
    }
    //alert('iijk=' + iijk + ' ' + bbpx + ' ' + bpx + ' ' + bsx + ' ' + brx);
    document.getElementById('tdtr').style.backgroundRepeat=brx.split(':')[1];
    document.getElementById('tdtr').style.backgroundSize=bsx.split(':')[1];
    document.getElementById('tdtr').style.backgroundPosition=bpx.split(':')[1];
    //document.body.style.backgroundImage=('' + document.getElementById('tdtr').style.backgroundImage);
    //document.body.style.backgroundRepeat=brx.split(':')[1];
    //document.body.style.backgroundSize=bsx.split(':')[1];

    document.body.style.backgroundPosition=bbpx.split(':')[1];
    var kdss=bsx.split(':')[1].replace(/\;/g,'').split(',');
    var idss=bbpx.split(':')[1].replace(/\;/g,'').split(',');
    var jdss=(('' + document.getElementById('tdtr').style.backgroundImage) + ',').replace(';,',',').replace(/url\(/g,'').replace(/URL\(/g,'').replace(/\"\;/g,'').replace(/\"/g,'').split('),');
    document.getElementById('idiv').innerHTML='';
    var istuff='', laststuff='';
    for (var iop=0; iop<idss.length; iop++) {
    //while (istuff == laststuff) {
    if (('' + jdss[iop]) != 'undefined' && ('' + jdss[iop]).trim() != '') {
    if (jdss[iop].trim().indexOf('iVBOR') != -1) {
    istuff+='<img style="position:absolute;width:' + kdss[iop].split(' ')[0] + ';height:' + kdss[iop].split(' ')[1] + ';left:' + idss[iop].split(' ')[0] + ';top:' + idss[iop].split(' ')[1] + ';" src="data:image/png;base64,iVBOR' + jdss[iop].trim().split('iVBOR')[1] + '"></img>';
    } else if (jdss[iop].trim() .indexOf('//') != -1) {
    istuff+='<img style="position:absolute;width:' + kdss[iop].split(' ')[0] + ';height:' + kdss[iop].split(' ')[1] + ';left:' + idss[iop].split(' ')[0] + ';top:' + idss[iop].split(' ')[1] + ';" src="' + jdss[iop].trim() + '"></img>';
    }
    //}
    laststuff=istuff;
    }
    }
    document.getElementById('idiv').innerHTML=istuff;
    }

We hope you try new functionality in our changed eighth draft image_venn.html Google Chart Image Chart Venn Chart or Scatter Chart or GraphViz Chart or Pie Chart or Line Chart or Bar Chart or Candlestick Chart or Map Chart interfacing web application you can also try below.


Previous relevant Google Chart Image Chart Broadcast Talk Tutorial is shown below.

Google Chart Image Chart Broadcast Talk Tutorial

Google Chart Image Chart Broadcast Talk Tutorial

Onto yesterday’s Google Chart Image Chart Statistical Charts Tutorial progress we want to offer …

  • once a user has that “More Annotation” annotating happening … offer the chance to …
  • Broadcast … their work as it happens, dynamically …
  • to an emailee list audience

… and we’re calling this …

Broadcast Talk

… even though it is only visual by nature, presented as an update image still presented and updated periodically. Go figure?! We’re blaming that supper time two back. We’re not sure?!

Anyway, we hope you try out the new arrangements in our changed seventh draft image_venn.html Google Chart Image Chart Venn Chart or Scatter Chart or GraphViz Chart or Pie Chart or Line Chart or Bar Chart or Candlestick Chart or Map Chart interfacing web application you can also try below, and helped out by a WordPress blog good ol’ TwentyTen theme 404.php which now includes …

<?php

if (isset($_POST['canvcont']) && isset($_POST['uniquifier']) && strpos(('?' . $_SERVER['QUERY_STRING']), 'cht=') === false) {
if (isset($_POST['uniquifier'])) {
$uniquifier=str_replace('+',' ',urldecode($_POST['uniquifier']));
}
if ($uniquifier == '') {
$uniquifier='_' . rand(0,78654356);
file_put_contents($_SERVER['DOCUMENT_ROOT'] . DIRECTORY_SEPARATOR . "presentation" . $uniquifier . ".png", base64_decode( explode('base64,', str_replace(' ','+',urldecode($_POST['canvcont'])))[1]));
echo "<html><body onload=\"if (parent.document.getElementById('uniquifier')) { if (parent.document.getElementById('uniquifier').value == '') { parent.document.getElementById('uniquifier').value='" . $uniquifier . "'; } }\"></body></html>";
} else {
file_put_contents($_SERVER['DOCUMENT_ROOT'] . DIRECTORY_SEPARATOR . "presentation" . $uniquifier . ".png", base64_decode( explode('base64,', str_replace(' ','+',urldecode($_POST['canvcont'])))[1]));
}
exit;
}

?>

… featuring our first use of this 404.php in response to a method=POST form call. Verrrrrryyyy interesting!


Previous relevant Google Chart Image Chart Statistical Charts Tutorial is shown below.

Google Chart Image Chart Statistical Charts Tutorial

Google Chart Image Chart Statistical Charts Tutorial

Further to yesterday’s Google Chart Image Chart Pie Chart Tutorial, today, we embark on our first ventures into composite charts, along what we like to think of as “statistical lines”, regarding interfacing to Google Charts Image Chart

… the latter being like a “parasite” display idea off the more conventional Statistical Graph favourites, the Line Chart and Bar Chart, where you have a relationship between a numerical concept (eg. sales) and another type of concept (eg. month of the year), and you want to present the data in a graphical form.

Again, we haven’t stopped our “retweaking”. We might “retweak” in the morning or we might “retweak” over a coffee break or we might “retweak” at supper time, but the end result is, well, you’re reading it now!


var pretherest='';
var newtherest='';
var tmod='';
var cht=location.search.split('cht=')[1] ? decodeURIComponent(location.search.split('cht=')[1].split('&')[0]) : "v";
if ((cht + ' ').substring(0,1) == 'p' && cht != 'p') { pretherest=cht.substring(1); }
if ((cht + ' ').substring(0,2) == 'bv' && cht != 'bv') { pretherest=cht.substring(2); if (1 == 1) { cht='bv'; } }
if ((cht + ' ').substring(0,1) == 'l' && cht != 'l') { pretherest=cht.substring(1); if (1 == 1) { cht='l'; } }
var ctype=location.search.split('type=')[1] ? decodeURIComponent(location.search.split('type=')[1].split('&')[0]) : cht;
var cname=(ctype == 'v' ? 'Venn Chart' : (ctype == 's' ? 'Scatter Chart' : (ctype == 'gv' ? 'GraphViz Chart' :
(ctype.substring(0,1) == 'p' ? 'Pie Chart' :
((ctype + ' ').substring(0,2) == 'bv' ? 'Bar Chart' : (ctype.substring(0,1) == 'l' ? 'Line Chart' : ''))))));
var cencodename=(ctype == 'v' ? 'Venn%20Diagram' : (ctype == 's' ? 'Scatter%20Chart' : (ctype == 'gv' ? 'GraphViz%20Chart' :
(ctype.substring(0,1) == 'p' ? 'Pie%20Chart' :
((ctype + ' ').substring(0,2) == 'bv' ? 'Bar%20Chart' : (ctype.substring(0,1) == 'l' ? 'Line%20Chart' : ''))))));
var chdt=(ctype == 'v' ? '&chd=t:' : (ctype == 's' ? '&chd=t:' : (ctype == 'gv' ? '&chl=' :
(ctype.substring(0,1) == 'p' ? pretherest + '&chd=t:' :
((ctype + ' ').substring(0,2) == 'bv' ? '&chd=t:' : (ctype.substring(0,1) == 'l' ? '&chd=t:' : ''))))));
var chdeq=(ctype == 'v' ? '&chd=' : (ctype == 's' ? '&chd=' : (ctype == 'gv' ? '&chl=' :
(ctype.substring(0,1) == 'p' ? '&chd=' :
((ctype + ' ').substring(0,2) == 'bv' ? '&chd=' : (ctype.substring(0,1) == 'l' ? '&chd=' : ''))))));
var tc=(ctype == 'v' ? 't:' : (ctype == 's' ? 't:' : (ctype == 'gv' ? '' :
(ctype.substring(0,1) == 'p' ? 't:' :
((ctype + ' ').substring(0,2) == 'bv' ? 't:' : (ctype.substring(0,1) == 'l' ? 't:' : ''))))));
var chdl=(ctype == 'v' ? '&chdl=' : (ctype == 's' ? '&chdl=' : (ctype == 'gv' ? '' :
(ctype.substring(0,1) == 'p' ? '&chdl=' :
((ctype + ' ').substring(0,2) == 'bv' ? '&chbh=' : (ctype.substring(0,1) == 'l' ? '&chbh=' : ''))))));

var prenchtt=(ctype == 'v' ? '100,80,60,30,30,30,10' : (ctype == 's' ? '12,87,75,41,23,96,68,71,34,9|98,60,27,34,56,79,58,74,18,76|84,23,69,81,47,94,60,93,64,54' : (ctype == 'gv' ? 'graph{C_0--H_0[type=s];C_0--H_1[type=s];C_0--H_2[type=s];C_0--C_1[type=s];C_1--H_3[type=s];C_1--H_4[type=s];C_1--H_5[type=s]}' :
(ctype.substring(0,1) == 'p' ? '1,2,3,4' :
((ctype + ' ').substring(0,2) == 'bv' ? '5,5,5|10,10,10|15,15,15' : (ctype.substring(0,1) == 'l' ? '5,45,5|10,60,10|15,85,15' : ''))))));
var preachtt=(ctype == 'v' ? 'A|B|C' : (ctype == 's' ? 'Cats|Dogs' : (ctype == 'gv' ? '' :
(ctype.substring(0,1) == 'p' ? 'January|February|March|April' :
((ctype + ' ').substring(0,2) == 'bv' ? '15,4,15' : (ctype.substring(0,1) == 'l' ? '15,4,15' : ''))))));
var defchco=(ctype == 'v' ? 'ff0000,00ff00,0000ff' : (ctype == 's' ? 'FF0000|0000FF&chxt=x,y' : (ctype == 'gv' ? '' :
(ctype.substring(0,1) == 'p' ? 'ff0000,00ff00,0000ff,ff00ff' :
((ctype + ' ').substring(0,2) == 'bv' ? '4D89F9,C6D9FD,C6FDD9&chxt=x,y' : (ctype.substring(0,1) == 'l' ? '3D89F9.B6D9FD,B6FDD9&chxt=x,y' : ''))))));

var prechtt=(ctype == 'v' ? chdt + prenchtt + chdl + preachtt : (ctype == 's' ? chdt + prenchtt + chdl + preachtt + '&chxt=x,y' : (ctype == 'gv' ? chdt + prenchtt :
(ctype.substring(0,1) == 'p' ? chdt + prenchtt + chdl + preachtt :
((ctype + ' ').substring(0,2) == 'bv' ? chdt + prenchtt + chdl + preachtt : (ctype.substring(0,1) == 'l' ? chdt + prenchtt + chdl + preachtt : ''))))));
var promptone=(ctype == 'v' ? "Enter delimited values string for Venn Diagram such that ... " + String.fromCharCode(10) + "The first three values specify the sizes of three circles: A, B, & C. For chart with only two circles, specify zero for the third value." + String.fromCharCode(10) + "The fourth value specifies the size of the intersection of A and B." + String.fromCharCode(10) + "The fifth value specifies the size of the intersection of A and C. For a chart with only two circles, do not specify a value here." + String.fromCharCode(10) + "The sixth value specifies the size of the intersection of B and C. For a chart with only two circles, do not specify a value here." + String.fromCharCode(10) + "The seventh value specifies the size of the common intersection of A, B, and C. For a chart with only two circles, do not specify a value here." + String.fromCharCode(10) + String.fromCharCode(10) + "" : (ctype == 's' ? "Enter delimited values string for Scatter Chart" : (ctype == 'gv' ? "Enter delimited values string for GraphViz Chart" :
(ctype.substring(0,1) == 'p' ? "Enter delimited values string for Pie Chart" :
((ctype + ' ').substring(0,2) == 'bv' ? "Enter g for Group or s for Stacked or o for Overlapped Bar Chart look then a space and then enter delimited values string for Bar Chart. Here is a Candlestick and Bar Chart idea eg. g 1:20,10,15,25,17,30|0,5,10,7,12,6|35,25,45,47,24,46|15,40,30,27,39,54|70,55,63,59,80,6 Prefix just the delimited string you enter by 1: to additionally display Candlestick Charts or by 0: to only display Candlestick Chart" :
(ctype.substring(0,1) == 'l' ? "Enter c for Even or s for Sparklines or xy for Just XY Line Chart look then a space and then enter delimited values string for Line Chart. Here is a Candlestick and Line Chart idea eg. c 1:20,10,15,25,17,30|0,5,10,7,12,6|35,25,45,47,24,46|15,40,30,27,39,54|70,55,63,59,80,6 Prefix just the delimited string you enter by 1: to additionally display Candlestick Charts or by 0: to only display Candlestick Chart" : ""))))));
var oneprompt=(ctype == 'v' ? "Enter delimited values string for your Venn Diagram collaborations, optionally, such that ... " + String.fromCharCode(10) + "The first three values specify the sizes of three circles: A, B, & C. For chart with only two circles, specify zero for the third value." + String.fromCharCode(10) + "The fourth value specifies the size of the intersection of A and B." + String.fromCharCode(10) + "The fifth value specifies the size of the intersection of A and C. For a chart with only two circles, do not specify a value here." + String.fromCharCode(10) + "The sixth value specifies the size of the intersection of B and C. For a chart with only two circles, do not specify a value here." + String.fromCharCode(10) + "The seventh value specifies the size of the common intersection of A, B, and C. For a chart with only two circles, do not specify a value here." + String.fromCharCode(10) + String.fromCharCode(10) + "" : (ctype == 's' ? "Enter delimited values string for Scatter Chart" : (ctype == 'gv' ? "Enter delimited values string for GraphViz Chart" :
(ctype.substring(0,1) == 'p' ? "Enter delimited values string for Pie Chart" :
((ctype + ' ').substring(0,2) == 'bv' ? "Enter g for Grouped or s for Stacked or o for Overlapped Bar Chart look then a space and then enter delimited values string for Bar Chart. Here is a Candlestick and Bar Chart idea eg. g 1:20,10,15,25,17,30|0,5,10,7,12,6|35,25,45,47,24,46|15,40,30,27,39,54|70,55,63,59,80,6 Prefix just the delimited string you enter by 1: to additionally display Candlestick Charts or by 0: to only display Candlestick Chart" :
(ctype.substring(0,1) == 'l' ? "Enter c for Even or s for Sparklines or xy for Just XY Line Chart look then a space and then enter delimited values string for Line Chart. Here is a Candlestick and Line Chart idea eg. c 1:20,10,15,25,17,30|0,5,10,7,12,6|35,25,45,47,24,46|15,40,30,27,39,54|70,55,63,59,80,6 Prefix just the delimited string you enter by 1: to additionally display Candlestick Charts or by 0: to only display Candlestick Chart" : ""))))));
var asktwo=(ctype == 'v' ? true : (ctype == 's' ? true : (ctype == 'gv' ? false :
(ctype.substring(0,1) == 'p' ? true :
((ctype + ' ').substring(0,2) == 'bv' ? true : (ctype.substring(0,1) == 'l' ? true : false))))));
var twopb=(ce.substring(0,1) == 'p' ? 'Any optional legend or title argument snippets? Optionally prefix by 3 for 3d Pie Chart or by c for Concentric Pie Chart. Eg. 3' + chdl + preachtt + '&chtt=My%20' + cencodename + '&chco=' + defchco : 'Any optional legend or title argument snippets? Eg. ' + chdl + preachtt + '&chtt=My%20' + cencodename + '&chco=' + defchco);
var beforeanswer=(ctype.substring(0,1) == 'l' ? 'c ' : ((ctype + ' ').substring(0,2) == 'bv' ? 'g ' : ''));

if ((document.URL.toLowerCase().indexOf('chd=t%3a') == -1 && document.URL.toLowerCase().indexOf('chd=t:') == -1) && document.URL.toLowerCase().indexOf('chd=t') != -1 && document.URL.toLowerCase().indexOf('%3a') != -1) {
tmod=document.URL.toLowerCase().split('chd=t')[1].split('%3')[0];
//tc='t' + tmod + ':';
//chdt=chdt.replace('t:', 't' + tmod + ':');
//answer=answer.trim().replace(tmod + ':','');
//therest+='&chm=F,,1,1:4,20';
} else if ((document.URL.toLowerCase().indexOf('chd=t%3a') == -1 && document.URL.toLowerCase().indexOf('chd=t:') == -1) && document.URL.toLowerCase().indexOf('chd=t') != -1 && document.URL.toLowerCase().substring(8).indexOf(':') != -1) {
tmod=document.URL.toLowerCase().split('chd=t')[1].split(':')[0];
//tc='t' + tmod + ':';
//chdt=chdt.replace('t:', 't' + tmod + ':');
//answer=answer.trim().replace(tmod + ':','');
//therest+='&chm=F,,1,1:4,20';
}

var atend="<canvas id=sharecanvas style=display:none;></canvas><div style=display:none;><label for='shareurl'><input type=button onclick='downloadmaybe(); shareurl();' id='sbut' value='Share URL Link'></input>: </label><input onblur=changeu(this.value); title='Suffix by hashtag 1 is text and hashtag 2 is title' style='width:45%;' type=url value='' placeholder='https://www.rjmprogramming.com.au/ITblog/#RJM Programming Blog#IT Blog' id=shareurl ondblclick='this.value=trythis(this.placeholder);'></input><br><br><span> ... and/or ... </span><br><br><label for='files'><input type=button onclick=document.getElementById('share').click(); value='Share media or document files'></input>: </label><input id='files' type='file' accept='image/*,video/*,audio/*,application/*,text/*' multiple></div><br><br><button id='share' type='button'>Share your media or documents or link!</button><output id='output'></output><scr" + "ipt type='text/javascript' src='/web_share_api_test.js?canv" + "asshare=as_necessary9867654' defer></scr" + "ipt>";
atend='';

var vals=[], annowin=null;


var lastbit="<br><br><br><br>  <button title='Other complex canvas annotation functionalities (forgoes the simpler ones above) ...' id=annobut onclick=\"document.getElementById('tdleft').style.verticalAlign='top'; setTimeout(prerepaint, 12000); if (arest.length != 0) { alert('arest=' + arest); if (document.getElementById('myvenn').src.indexOf(arest) == -1) { pdivhide(); document.getElementById('myvenn').src=document.getElementById('myvenn').src.split(arest.substring(0,5))[0] + arest; document.getElementById('tdleft').style.verticalAlign='top'; } } annowin=window.open('/HTMLCSS/user_of_signature_signature.htm?elemode=img','_blank','top=420,left=620,width=900,height=420'); \" style=\"background-color:yellow;\">More Annotations</button>  <button id=bshare onclick=repaint(); style=display:none;>Repaint <font size=1>(but lose sharing emojis above)</font></button><br><div id=divcanvas style=display:none;><canvas id=bottomcanvas></canvas></div>";
var fszbit='  <span id=spanfsz><select id=fsz onchange="fsz=this.value;"><option value=".10">10px</option><option value=".6">6px</option><option value=".8">8px</option><option value=".9">9px</option><option value=".11">11px</option><option value=".12">12px</option><option value=".14">14px</option><option value=".16">16px</option><option value=".18">18px</option><option value=".20">20px</option><option value=".24">24px</option><option value=".30">30px</option><option value=".36">36px</option><option value=".40">40px</option><option value=".48">48px</option><option value=".50">50px</option><option value=".64">64px</option></select></span>';
var origemailurl='mailto:?subject=My%20' + cencodename + '%20...%20best%20viewed%20in%20landscape%20...&body=';
var origsmsurl='sms:&body=My%20' + cencodename + '%20...%20best%20viewed%20in%20landscape%20...';
var smsee='';
var chd=location.search.split(chdeq)[1] ? (tc + dectypodeURIComponent(location.search.split(chdeq)[1].split('&')[0])).replace('t:t:', 't:').replace(/^t\:$/g, '') : "";
var therest=location.search.split(chdeq)[1] ? (pretherest + document.URL.split(document.URL.split('#')[0].split(chdeq)[1].split('&')[0])[1].split('#')[0]) : "";
newtherest=((ctype + ' ').substring(0,2) == 'bv' ? therest : '');

And yes, you can, and we did, put line feeds into those ternery statements to help with their readability as we add complexity to the parameterization, as we go along, in our changed sixth draft image_venn.html Google Chart Image Chart Venn Chart or Scatter Chart or GraphViz Chart or Pie Chart or Line Chart or Bar Chart or Candlestick Chart interfacing web application you can also try below.


Previous relevant Google Chart Image Chart Pie Chart Tutorial is shown below.

Google Chart Image Chart Pie Chart Tutorial

Google Chart Image Chart Pie Chart Tutorial

As we intimated in yesterday’s Google Chart Image Chart GraphViz Chart Tutorial

start with an at least two part “inhouse phase” of additional “extra to text” annotation functionality possibilities …

… we would return! And so, here thou lingers. It’s “part two” day, even bigger than “Ben Hur” in certain outback towns we’re a little bit shy to divulge until we get to know our readers that little bit better.

Yes, we are dovetailing with work we’ve done in the past using the excellent …

  • canvas … element introduced with HTML5 … whereby …
  • annotations like …
    1. scribble … as the default, and various other …
    2. discrete click shapes … and …
    3. text … including emojis … and …
    4. image

    … annotating modus operandi

… can be part of the arrangements. It works that the Annotation Helper is opened …

  • in a new “known about” popup window … looking out for …
  • parent based “img” element (in the modus operandi we use, calling it, regarding the parent top left image) … so as to be able to …
  • populate its canvas element with a clone of that calling “img” graphical content … but add into the mix …
  • menu driven annotation functionality which can change that canvas look and underlying data … and …
  • the caller can keep track of this and arrange, or not, for these changes to be reflected back at its top left “img” element … the catch being …
  • the “within range of GET argument” limits are ruined by this introduction of graphical data, and so in agreeing to this, a user forgoes those simpler sharing and annotating functionalities of yesterday’s (and before) work … though your normal image sharing capabilities via the web browser remain in the caller and the called

As well, today, we are introducing new Google Charts Image Chart Pie Chart interfacing, and because this chart type can have the three …

  • Normal
  • 3D
  • Concentric

… guises, there was some work to keep us off this street (okay … so we divulgedagain)


var pretherest='';
var cht=location.search.split('cht=')[1] ? decodeURIComponent(location.search.split('cht=')[1].split('&')[0]) : "v";
if ((cht + ' ').substring(0,1) == 'p' && cht != 'p') { pretherest=cht.substring(1); }
var ctype=location.search.split('type=')[1] ? decodeURIComponent(location.search.split('type=')[1].split('&')[0]) : cht;
var cname=(ctype == 'v' ? 'Venn Chart' : (ctype == 's' ? 'Scatter Chart' : (ctype == 'gv' ? 'GraphViz Chart' : (ctype.substring(0,1) == 'p' ? 'Pie Chart' : ''))));
var cencodename=(ctype == 'v' ? 'Venn%20Diagram' : (ctype == 's' ? 'Scatter%20Chart' : (ctype == 'gv' ? 'GraphViz%20Chart' : (ctype.substring(0,1) == 'p' ? 'Pie%20Chart' : ''))));
var chdt=(ctype == 'v' ? '&chd=t:' : (ctype == 's' ? '&chd=t:' : (ctype == 'gv' ? '&chl=' : (ctype.substring(0,1) == 'p' ? pretherest + '&chd=t:' : ''))));
var chdeq=(ctype == 'v' ? '&chd=' : (ctype == 's' ? '&chd=' : (ctype == 'gv' ? '&chl=' : (ctype.substring(0,1) == 'p' ? '&chd=' : ''))));
var tc=(ctype == 'v' ? 't:' : (ctype == 's' ? 't:' : (ctype == 'gv' ? '' : (ctype.substring(0,1) == 'p' ? 't:' : ''))));
var chdl=(ctype == 'v' ? '&chdl=' : (ctype == 's' ? '&chdl=' : (ctype == 'gv' ? '' : (ctype.substring(0,1) == 'p' ? '&chdl=' : ''))));
var prenchtt=(ctype == 'v' ? '100,80,60,30,30,30,10' : (ctype == 's' ? '12,87,75,41,23,96,68,71,34,9|98,60,27,34,56,79,58,74,18,76|84,23,69,81,47,94,60,93,64,54' : (ctype == 'gv' ? 'graph{C_0--H_0[type=s];C_0--H_1[type=s];C_0--H_2[type=s];C_0--C_1[type=s];C_1--H_3[type=s];C_1--H_4[type=s];C_1--H_5[type=s]}' : (ctype.substring(0,1) == 'p' ? '1,2,3,4' : ''))));
var preachtt=(ctype == 'v' ? 'A|B|C' : (ctype == 's' ? 'Cats|Dogs' : (ctype == 'gv' ? '' : (ctype.substring(0,1) == 'p' ? 'January|February|March|April' : ''))));
var prechtt=(ctype == 'v' ? chdt + prenchtt + chdl + preachtt : (ctype == 's' ? chdt + prenchtt + chdl + preachtt + '&chxt=x,y' : (ctype == 'gv' ? chdt + prenchtt : (ctype.substring(0,1) == 'p' ? chdt + prenchtt + chdl + preachtt : ''))));
var defchco=(ctype == 'v' ? 'ff0000,00ff00,0000ff' : (ctype == 's' ? 'FF0000|0000FF&chxt=x,y' : (ctype == 'gv' ? '' : (ctype.substring(0,1) == 'p' ? 'ff0000,00ff00,0000ff,ff00ff' : ''))));
var promptone=(ctype == 'v' ? "Enter delimited values string for Venn Diagram such that ... " + String.fromCharCode(10) + "The first three values specify the sizes of three circles: A, B, & C. For chart with only two circles, specify zero for the third value." + String.fromCharCode(10) + "The fourth value specifies the size of the intersection of A and B." + String.fromCharCode(10) + "The fifth value specifies the size of the intersection of A and C. For a chart with only two circles, do not specify a value here." + String.fromCharCode(10) + "The sixth value specifies the size of the intersection of B and C. For a chart with only two circles, do not specify a value here." + String.fromCharCode(10) + "The seventh value specifies the size of the common intersection of A, B, and C. For a chart with only two circles, do not specify a value here." + String.fromCharCode(10) + String.fromCharCode(10) + "" : (ctype == 's' ? "Enter delimited values string for Scatter Chart" : (ctype == 'gv' ? "Enter delimited values string for GraphViz Chart" : (ctype.substring(0,1) == 'p' ? "Enter delimited values string for Pie Chart" : ""))));
var oneprompt=(ctype == 'v' ? "Enter delimited values string for your Venn Diagram collaborations, optionally, such that ... " + String.fromCharCode(10) + "The first three values specify the sizes of three circles: A, B, & C. For chart with only two circles, specify zero for the third value." + String.fromCharCode(10) + "The fourth value specifies the size of the intersection of A and B." + String.fromCharCode(10) + "The fifth value specifies the size of the intersection of A and C. For a chart with only two circles, do not specify a value here." + String.fromCharCode(10) + "The sixth value specifies the size of the intersection of B and C. For a chart with only two circles, do not specify a value here." + String.fromCharCode(10) + "The seventh value specifies the size of the common intersection of A, B, and C. For a chart with only two circles, do not specify a value here." + String.fromCharCode(10) + String.fromCharCode(10) + "" : (ctype == 's' ? "Enter delimited values string for Scatter Chart" : (ctype == 'gv' ? "Enter delimited values string for GraphViz Chart" : (ctype.substring(0,1) == 'p' ? "Enter delimited values string for Pie Chart" : ""))));
var asktwo=(ctype == 'v' ? true : (ctype == 's' ? true : (ctype == 'gv' ? false : (ctype.substring(0,1) == 'p' ? true : false))));
var twopb=(ctype.substring(0,1) == 'p' ? 'Any optional legend or title argument snippets? Optionally prefix by 3 for 3d Pie Chart or by c for Concentric Pie Chart. Eg. 3' + chdl + preachtt + '&chtt=My%20' + cencodename + '&chco=' + defchco : 'Any optional legend or title argument snippets? Eg. ' + chdl + preachtt + '&chtt=My%20' + cencodename + '&chco=' + defchco);

var atend="<canvas id=sharecanvas style=display:none;></canvas><div style=display:none;><label for='shareurl'><input type=button onclick='downloadmaybe(); shareurl();' id='sbut' value='Share URL Link'></input>: </label><input onblur=changeu(this.value); title='Suffix by hashtag 1 is text and hashtag 2 is title' style='width:45%;' type=url value='' placeholder='https://www.rjmprogramming.com.au/ITblog/#RJM Programming Blog#IT Blog' id=shareurl ondblclick='this.value=trythis(this.placeholder);'></input><br><br><span> ... and/or ... </span><br><br><label for='files'><input type=button onclick=document.getElementById('share').click(); value='Share media or document files'></input>: </label><input id='files' type='file' accept='image/*,video/*,audio/*,application/*,text/*' multiple></div><br><br><button id='share' type='button'>Share your media or documents or link!</button><output id='output'></output><scr" + "ipt type='text/javascript' src='/web_share_api_test.js?canv" + "asshare=as_necessary9867654' defer></scr" + "ipt>";
atend='';

var vals=[], annowin=null;
var lastbit="<br><br><br><br>  <button title='Other complex canvas annotation functionalities (forgoes the simpler ones above) ...' id=annobut onclick=\"document.getElementById('tdleft').style.verticalAlign='top'; setTimeout(prerepaint, 12000); if (arest.length != 0) { if (document.getElementById('myvenn').src.indexOf(arest) == -1) { pdivhide(); document.getElementById('myvenn').src=document.getElementById('myvenn').src.split(arest.substring(0,5))[0] + arest; document.getElementById('tdleft').style.verticalAlign='top'; } } annowin=window.open('/HTMLCSS/user_of_signature_signature.htm?elemode=img','_blank','top=420,left=620,width=900,height=420'); \" style=\"background-color:yellow;\">More Annotations</button>  <button id=bshare onclick=repaint(); style=display:none;>Repaint <font size=1>(but lose sharing emojis above)</font></button><br><div id=divcanvas style=display:none;><canvas id=bottomcanvas></canvas></div>";
var fszbit='  <span id=spanfsz><select id=fsz onchange="fsz=this.value;"><option value=".10">10px</option><option value=".6">6px</option><option value=".8">8px</option><option value=".9">9px</option><option value=".11">11px</option><option value=".12">12px</option><option value=".14">14px</option><option value=".16">16px</option><option value=".18">18px</option><option value=".20">20px</option><option value=".24">24px</option><option value=".30">30px</option><option value=".36">36px</option><option value=".40">40px</option><option value=".48">48px</option><option value=".50">50px</option><option value=".64">64px</option></select></span>';
var origemailurl='mailto:?subject=My%20' + cencodename + '%20...%20best%20viewed%20in%20landscape%20...&body=';
var origsmsurl='sms:&body=My%20' + cencodename + '%20...%20best%20viewed%20in%20landscape%20...';
var smsee='';
var chd=location.search.split(chdeq)[1] ? (tc + decodeURIComponent(location.search.split(chdeq)[1].split('&')[0])).replace('t:t:', 't:').replace(/^t\:$/g, '') : "";
var therest=location.search.split(chdeq)[1] ? (pretherest + document.URL.split(document.URL.split('#')[0].split(chdeq)[1].split('&')[0])[1].split('#')[0]) : "";

Please acquaint yourself with these new annotating features in our changed fifth draft image_venn.html Google Chart Image Chart Venn Chart or Scatter Chart or GraphViz Chart or Pie Chart interfacing web application you can also try below.


Previous relevant Google Chart Image Chart GraphViz Chart Tutorial is shown below.

Google Chart Image Chart GraphViz Chart Tutorial

Google Chart Image Chart GraphViz Chart Tutorial

Today we have two strands of forward progress, onto the progress up to yesterday’s Google Chart Image Chart Scatter Chart Tutorial, they being …

  • establish a new interfacing to GraphViz Chart

    GraphViz is a package of open source tools for visualizing connectivity graphs. You can create GraphViz graphs using the DOT language and your choice of layout engines.

    … a chart looking a bit like Organization Charts

    Org charts are diagrams of a hierarchy of nodes, commonly used to portray superior/subordinate relationships in an organization. A family tree is a type of org chart.


  • start with an at least two part “inhouse phase” of additional “extra to text” annotation functionality possibilities … just starting with …
    1. line
    2. open rectangle
    3. filled rectangle

… additional functionality, that we may well add to, but being as we feel a change we’ll leave that for another time.

The WordPress blog “404.php” code snippet becomes …

<?php

if (strpos(('?' . $_SERVER['QUERY_STRING']), '?cht=') !== false || strpos(('?' . $_SERVER['QUERY_STRING']), '&cht=') !== false) {

$theqs=str_replace('??','?',('?' . $_SERVER['QUERY_STRING']));
if (strpos($theqs, '?chs=') === false && strpos($theqs, '&chs=') === false) {
$theqs='?chs=' . $newWidth . 'x' . $newHeight . '&' . explode('?', $theqs)[1];
}


if (strpos(('?' . $_SERVER['QUERY_STRING']), 'text1=') !== false) {
$theone=2;
$im = imagecreatefromstring(file_get_contents('http://chart.googleapis.com/chart' . explode('&text1=', $theqs)[0]));

if (7 == 7) {

$plotstring=str_replace('+',' ',urldecode($_GET['text1']));
$csv=explode(',', $plotstring);
$black = imagecolorallocatealpha($im, 1, 1, 1, 0);
$blackish = imagecolorallocatealpha($im, 127, 127, 127, 64);
if (sizeof($csv) >= 3) {
if (trim($csv[2]) == '') { // non text annotations

$zeroesbit='';
$izeroes=0;
$xmantissae=explode('.', ('' . $csv[0]));
if (sizeof($xmantissae) > 1) {
$csv[0]=$xmantissae[0];
while (substr($xmantissae[1],0,1) == '0') {
$zeroesbit.='0';
$xmantissae[1]=substr($xmantissae[1],1);
}
$csv[2]=$xmantissae[1];
}
$ymantissae=explode('.', ('' . $csv[1]));
if (sizeof($ymantissae) > 1) {
$csv[1]=$ymantissae[0];
if (sizeof($csv) > 3) {
$csv[3]=$ymantissae[1];
} else {
array_push($csv, $ymantissae[1]);
}
}


if (strlen($zeroesbit) == 4) { // filled in rectangle
imagefilledrectangle($im, $csv[0], $csv[1], $csv[2], $csv[3], $blackish);
} else if (strlen($zeroesbit) == 2) { // rectangle
imagerectangle($im, $csv[0], $csv[1], $csv[2], $csv[3], $black);
} else if (strlen($zeroesbit) == 1) { // line
imageline($im, $csv[0], $csv[1], $csv[2], $csv[3], $black);
}

} else { // text placement
$xis=$csv[0];
$mantissae=explode('.', ('' . $csv[0]));
if (sizeof($mantissae) > 1) {
$tenpx=$mantissae[1];
$xis=$mantissae[0];
}
try {
if (function_exists('imagettftext')) {
if (explode('' . $csv[0] . ',' . $csv[1] . ',', $plotstring)[1] !== '') {
//echo explode('' . $csv[0] . ',' . $csv[1] . ',', $plotstring)[1];
//exit;
imagettftext($im, $tenpx, 0, $xis, $csv[1], $black, realpath('arial.ttf'), explode('' . $csv[0] . ',' . $csv[1] . ',', $plotstring)[1]);
}
}
} catch (Exception $e) { }
}
while (isset($_GET['text' . $theone])) {
$plotstring=str_replace('+',' ',urldecode($_GET['text' . $theone]));
$csv=explode(',', $plotstring);
if (sizeof($csv) >= 3) {
if (trim($csv[2]) == '') { // non text annotations

$zeroesbit='';
$izeroes=0;
$xmantissae=explode('.', ('' . $csv[0]));
if (sizeof($xmantissae) > 1) {
$csv[0]=$xmantissae[0];
while (substr($xmantissae[1],0,1) == '0') {
$zeroesbit.='0';
$xmantissae[1]=substr($xmantissae[1],1);
}
$csv[2]=$xmantissae[1];
}
$ymantissae=explode('.', ('' . $csv[1]));
if (sizeof($ymantissae) > 1) {
$csv[1]=$ymantissae[0];
if (sizeof($csv) > 3) {
$csv[3]=$ymantissae[1];
} else {
array_push($csv, $ymantissae[1]);
}
}


if (strlen($zeroesbit) == 4) { // filled in rectangle
imagefilledrectangle($im, $csv[0], $csv[1], $csv[2], $csv[3], $blackish);
} else if (strlen($zeroesbit) == 2) { // rectangle
imagerectangle($im, $csv[0], $csv[1], $csv[2], $csv[3], $black);
} else if (strlen($zeroesbit) == 1) { // line
imageline($im, $csv[0], $csv[1], $csv[2], $csv[3], $black);
}

} else { // text placement
try {
$xis=$csv[0];
$mantissae=explode('.', ('' . $csv[0]));
if (sizeof($mantissae) > 1) {
$tenpx=$mantissae[1];
$xis=$mantissae[0];
}
if (function_exists('imagettftext')) {
if (explode('' . $csv[0] . ',' . $csv[1] . ',', $plotstring)[1] !== '') {
imagettftext($im, $tenpx, 0, $xis, $csv[1], $black, realpath('arial.ttf'), explode('' . $csv[0] . ',' . $csv[1] . ',', $plotstring)[1]);
}
}
} catch (Exception $e) { }
}
$theone++;
}
}
//}
}


}

header('Content-Type: image/png');

imagepng($im);
imagedestroy($im);
} else {
header('Content-Type: image/png');
echo file_get_contents('http://chart.googleapis.com/chart' . $theqs);
}
exit;

}

?>

… utilizing that good ol’ PHP GD image library.

We hope you enjoy the …

Mantissa Madness Monday

… coding feel utilized to retain yesterday’s …


&textn=x,y,Text

… argument snippet basis, adding “x” and “y” mantissa arrangement smarts with a “nothing” Text in our changed fourth draft image_venn.html Google Chart Image Chart Venn Chart or Scatter Chart or GraphViz Chart interfacing web application you can also try below.

Did you know?

Would you believe, at least to us, it is far less obvious how to display a straight line (that is perhaps not horizontal nor vertical) within a webpage, than it is to display a rectangle, filled or not?! Talk about irony! Over time, we have developed …

  • HTML hr elements (with a rotation) … and the less kludgy …
  • HTML div (defining a box with defined dimensions) for a nested SVG element containing the line definition using percentage dimensions

… in the past, for when we needed to do this. But, today, we’d like to thank this great webpage for its suggestion to involve linear gradients …


<style>

.crossedtotl {
background:
linear-gradient(to top left,
rgba(0,0,0,0) 0%,
rgba(0,0,0,0) calc(50% - 0.8px),
rgba(0,0,0,1) 50%,
rgba(0,0,0,0) calc(50% + 0.8px),
rgba(0,0,0,0) 100%);
}
.crossedtotr {
background:
linear-gradient(to top right,
rgba(0,0,0,0) 0%,
rgba(0,0,0,0) calc(50% - 0.8px),
rgba(0,0,0,1) 50%,
rgba(0,0,0,0) calc(50% + 0.8px),
rgba(0,0,0,0) 100%);
}
</style>

… in a, basically, CSS solution. Great stuff, thanks!


Previous relevant Google Chart Image Chart Scatter Chart Tutorial is shown below.

Google Chart Image Chart Scatter Chart Tutorial

Google Chart Image Chart Scatter Chart Tutorial

Today, we bring the Google Charts Image Chart

… making distributing “Venn Chart” hardcodings into a dropdown selectable arrangement, because there are more commonalities than differences, really, and we do like to parameterize … even in the shower, with a fairly loud rendition of this, perhaps.

Here is our framework for parameterization, here, and into the future


<title>Interfacing to Google Charts Image Chart Venn Chart or Scatter Chart - RJM Programming - November, 2023</title>
<script type=text/javascript>
var cht=location.search.split('cht=')[1] ? decodeURIComponent(location.search.split('cht=')[1].split('&')[0]) : "v";
var ctype=location.search.split('type=')[1] ? decodeURIComponent(location.search.split('type=')[1].split('&')[0]) : cht;
var cname=(ctype == 'v' ? 'Venn Chart' : (ctype == 's' ? 'Scatter Chart' : ''));
var cencodename=(ctype == 'v' ? 'Venn%20Diagram' : (ctype == 's' ? 'Scatter%20Chart' : ''));
var prenchtt=(ctype == 'v' ? '100,80,60,30,30,30,10' : (ctype == 's' ? '12,87,75,41,23,96,68,71,34,9|98,60,27,34,56,79,58,74,18,76|84,23,69,81,47,94,60,93,64,54' : ''));
var preachtt=(ctype == 'v' ? 'A|B|C' : (ctype == 's' ? 'Cats|Dogs' : ''));
var prechtt=(ctype == 'v' ? '&chd=t:' + prenchtt + '&chdl=' + preachtt : (ctype == 's' ? '&chd=t:' + prenchtt + '&chdl=' + preachtt + '&chxt=x,y' : ''));
var defchco=(ctype == 'v' ? 'ff0000,00ff00,0000ff' : (ctype == 's' ? 'FF0000|0000FF&chxt=x,y' : ''));
var promptone=(ctype == 'v' ? "Enter delimited values string for Venn Diagram such that ... " + String.fromCharCode(10) + "The first three values specify the sizes of three circles: A, B, & C. For chart with only two circles, specify zero for the third value." + String.fromCharCode(10) + "The fourth value specifies the size of the intersection of A and B." + String.fromCharCode(10) + "The fifth value specifies the size of the intersection of A and C. For a chart with only two circles, do not specify a value here." + String.fromCharCode(10) + "The sixth value specifies the size of the intersection of B and C. For a chart with only two circles, do not specify a value here." + String.fromCharCode(10) + "The seventh value specifies the size of the common intersection of A, B, and C. For a chart with only two circles, do not specify a value here." + String.fromCharCode(10) + String.fromCharCode(10) + "" : (ctype == 's' ? "Enter delimited values string for Scatter Chart" : ""));
var oneprompt=(ctype == 'v' ? "Enter delimited values string for your Venn Diagram collaborations, optionally, such that ... " + String.fromCharCode(10) + "The first three values specify the sizes of three circles: A, B, & C. For chart with only two circles, specify zero for the third value." + String.fromCharCode(10) + "The fourth value specifies the size of the intersection of A and B." + String.fromCharCode(10) + "The fifth value specifies the size of the intersection of A and C. For a chart with only two circles, do not specify a value here." + String.fromCharCode(10) + "The sixth value specifies the size of the intersection of B and C. For a chart with only two circles, do not specify a value here." + String.fromCharCode(10) + "The seventh value specifies the size of the common intersection of A, B, and C. For a chart with only two circles, do not specify a value here." + String.fromCharCode(10) + String.fromCharCode(10) + "" : (ctype == 's' ? "Enter delimited values string for Scatter Chart" : ""));

// etcetera etcetera etcetera

… but, as you can imagine, there will probably be small retweaks of this arrangement, which is holding out okay so far for Scatter Charts in our changed third draft image_venn.html Google Chart Image Chart Venn Chart or Scatter Chart interfacing web application you can also try below.

Did you know?

In this online world with so many platforms and devices and software choices, there is no need to ever be embarrassed by what might seem an obvious feature you’ve missed.

Take the way on macOS, but not iOS, using a web browser to get to YouTube, you can flag that a video should loop. Especially good for …

  • song obsessions …
  • earworms you need to salve

… and what about if your shower is taking an awfully long time?! Please be careful with moisture and devices, though, in the bathroom!

How does it happen? Right click the play button, and looping is there as the top option. Now back to that shower song obsession.


Previous relevant Google Chart Image Chart Venn Chart User Text Tutorial is shown below.

Google Chart Image Chart Venn Chart User Text Tutorial

Google Chart Image Chart Venn Chart User Text Tutorial

We think a way to improve on our interfacing web application start regarding yesterday’s Google Chart Image Chart Venn Chart Interfacing Primer Tutorial would be to offer the user the chance to enter their own text onto the Venn Diagrams …

But we would say that.

… given what we learnt in Primary school … or should we say …

“Gryffindor Slytherin Ravenclaw Hufflepuff Junior Business College”

… and, yes, is that you, Aoife? What did you want to point out? After you swallow those Rice Bubbles, that is?! Class is waiting …

.
.
.
.
.
.
.
.
.
.
.
.
.
.
.
.
.
.
.
.
.
.
.
.
.

Yes … miss something … and …

.
.
.
.
.
.
.
.
.
.
.
.
.
.
.
.
.
.
.
.
.
.
.
.
.

Use your words … okay … missing … don’t worry, the bus will wait … no … there’s no need to point … oh! …

… do you mean …

missing ewe … no … missing you … oh! … missing u … oh! … “Gryffindor Slytherin Ravenclaw Hufflepuff Juniour Business College” … quite so, Aiofe … 3 points for Hufflepuff!

Anyway we needed a fleshed out “function ask” to cater for potential onclick event logic catering for co-ordinates


function ask(evt) {
var answer='', answertherest='';
if (lasttext != '' && evt && normalcall) {
document.getElementById('ilp').placeholder='Enter text and later click place for it on Venn Diagram to left (line feed is ~~)';

elemLeft = document.getElementById('myvenn').offsetLeft;
elemTop = document.getElementById('myvenn').offsetTop;

if (evt.touches) {
if (evt.touches[0].pageX) {
x = evt.touches[0].pageX + document.body.scrollLeft - elemLeft;
y = evt.touches[0].pageY + document.body.scrollTop - elemTop;
} else {
x = evt.touches[0].clientX + document.body.scrollLeft - elemLeft;
y = evt.touches[0].clientY + document.body.scrollTop - elemTop;
}
} else if (evt.clientX || ev.clientY) {
x = evt.clientX + document.body.scrollLeft - elemLeft;
y = evt.clientY + document.body.scrollTop - elemTop;
} else {
x = evt.pageX + document.body.scrollLeft - elemLeft;
y = evt.pageY + document.body.scrollTop - elemTop;
}


document.getElementById('dtext').innerHTML+='<p style="position:absolute;font-size:10px;font-family:Arial;left:' + x + 'px;top:' + y + 'px;z-index:98;">' + lasttext + '</p>';

document.getElementById('aemail').href+='&text' + textnum + '=' + encodeURIComponent('' + x + ',' + y + ',') + encodeURIComponent(lasttext.replace(/\<br\>/g, String.fromCharCode(10)));
document.getElementById('asms').href+='&text' + textnum + '=' + encodeURIComponent('' + x + ',' + y + ',') + encodeURIComponent(lasttext.replace(/\<br\>/g, String.fromCharCode(10)));
arest+='&text' + textnum + '=' + encodeURIComponent('' + x + ',' + y + ',') + encodeURIComponent(lasttext.replace(/\<br\>/g, String.fromCharCode(10)));
therest+='&text' + textnum + '=' + encodeURIComponent('' + x + ',' + y + ',') + encodeURIComponent(lasttext.replace(/\<br\>/g, String.fromCharCode(10)));
asmsurl+='&text' + textnum + '=' + encodeURIComponent('' + x + ',' + y + ',') + encodeURIComponent(lasttext.replace(/\<br\>/g, String.fromCharCode(10)));
aemailurl+='&text' + textnum + '=' + encodeURIComponent('' + x + ',' + y + ',') + encodeURIComponent(lasttext.replace(/\<br\>/g, String.fromCharCode(10)));
document.getElementById('tdright').innerHTML="  <span id=spemail><a target=_blank href='mailto:?subject=My%20Venn%20Diagram%20...%20best%20viewed%20in%20landscape%20...&body=" + encodeURIComponent((document.getElementById('myvenn').src + arest).replace((document.getElementById('myvenn').src + arest).split('?')[0].split('#')[0], document.URL.split('?')[0].split('#')[0])) + "' id=aemail title=Email>&#128231;</a></span>      <span id=spsms><a target=_blank onmouseover=\"if (smsee.length == 0 && origsmsurl.indexOf('sms:&') != -1) { smsee=prompt('Please enter SMS number to send to.', ''); if (smsee == null) { smsee=''; } else { origsmsurl=origsmsurl.replace('sms:&','sms:' + smsee + '&'); asmsurl=asmsurl.replace('sms:&','sms:' + smsee + '&'); this.href=asmsurl; } }\" ontouchstart=\"if (smsee.length == 0 && origsmsurl.indexOf('sms:&') != -1) { smsee=prompt('Please enter SMS number to send to.', ''); if (smsee == null) { smsee=''; } else { origsmsurl=origsmsurl.replace('sms:&','sms:' + smsee + '&'); asmsurl=asmsurl.replace('sms:&','sms:' + smsee + '&'); this.href=asmsurl; } }\" href='sms:&body=" + encodeURIComponent((document.getElementById('myvenn').src + arest).replace(document.getElementById('myvenn').src.split('?')[0].split('#')[0], document.URL.split('?')[0].split('#')[0])) + "' id=asms title=SMS>&#128223;</a></span><br><br>  <input id=ilp onblur=\"lasttext=this.value.replace(/\~\~/g, '<br>'); this.value=''; this.placeholder='Click where you want ... ' + lasttext.replace(/\<br\>/g, String.fromCharCode(10)); mvp.setAttribute('content','initial-scale=1'); document.getElementById('myvenn').scrollIntoView();\" placeholder='Enter text and later click place for it on Venn Diagram to left (line feed is ~~)' type=text style=width:500px; value=''></input>";
//alert( document.getElementById('aemail').outerHTML );
//alert( document.getElementById('asms').outerHTML );
textnum++;
lasttext='';
} else if (!evt || !normalcall) {
if (chd == '') {
answer=prompt("Enter delimited values string for Venn Diagram such that ... " + String.fromCharCode(10) + "The first three values specify the sizes of three circles: A, B, & C. For chart with only two circles, specify zero for the third value." + String.fromCharCode(10) + "The fourth value specifies the size of the intersection of A and B." + String.fromCharCode(10) + "The fifth value specifies the size of the intersection of A and C. For a chart with only two circles, do not specify a value here." + String.fromCharCode(10) + "The sixth value specifies the size of the intersection of B and C. For a chart with only two circles, do not specify a value here." + String.fromCharCode(10) + "The seventh value specifies the size of the common intersection of A, B, and C. For a chart with only two circles, do not specify a value here." + String.fromCharCode(10) + String.fromCharCode(10) + "", (chd == '' ? "100,80,60,30,30,30,10" : (chd.replace('t:',''))));
} else {
answer=prompt("Enter delimited values string for your Venn Diagram collaborations, optionally, such that ... " + String.fromCharCode(10) + "The first three values specify the sizes of three circles: A, B, & C. For chart with only two circles, specify zero for the third value." + String.fromCharCode(10) + "The fourth value specifies the size of the intersection of A and B." + String.fromCharCode(10) + "The fifth value specifies the size of the intersection of A and C. For a chart with only two circles, do not specify a value here." + String.fromCharCode(10) + "The sixth value specifies the size of the intersection of B and C. For a chart with only two circles, do not specify a value here." + String.fromCharCode(10) + "The seventh value specifies the size of the common intersection of A, B, and C. For a chart with only two circles, do not specify a value here." + String.fromCharCode(10) + String.fromCharCode(10) + "", (chd == '' ? "100,80,60,30,30,30,10" : (chd.replace('t:',''))));
}
vals=[];
if (answer != null) {
answer=answer.trim();
if (answer.trim() != '') {
var delimis='';
for (var ii=0; ii<answer.length; ii++) {
if (delimis == '' && (answer.substring(ii).substring(0,1) < '0' || answer.substring(ii).substring(0,1) > '9')) {
delimis=answer.substring(ii).substring(0,1);
}
}
}
if (delimis != '') {
vals=answer.split(delimis);
}
if (vals.length == 6 || vals.length == 7) {
answertherest=prompt('Any optional legend or title argument snippets? Eg. &chdl=A|B|C&chtt=My%20Venn%20Diagram&chco=ff0000,00ff00,0000ff', therest);
if (answertherest == null) { answertherest=''; }
therest=answertherest.trim();
var aone=1;
var plotstring='';
var flds=[];
if (therest.indexOf('&text' + aone + '=') != -1) {
while (therest.indexOf('&text' + aone + '=') != -1) {
if (chd == '') {
plotstring=decodeURIComponent(therest.split('&text' + aone + '=')[1].split('&')[0]);
while (plotstring.indexOf(String.fromCharCode(10)) != -1) {
plotstring=plotstring.replace(String.fromCharCode(10), '<br>');
}
flds=plotstring.split(',');
if (eval('' + flds.length) >= 3) {
document.getElementById('dtext').innerHTML+='<p style="position:absolute;font-size:10px;font-family:Arial;left:' + flds[0] + 'px;top:' + flds[1] + 'px;z-index:98;">' + plotstring.split('' + flds[0] + ',' + flds[1] + ',')[1] + '</p>';
}
}
aone++;
textnum=aone;
}
}
//document.getElementById('myvenn').style.backgroundImage='URL(//www.rjmprogramming.com.au/ITblog/' + Math.min(550,window.innerWidth) + '/' + Math.min(350,window.innerHeight) + '/?cht=v&chd=t:' + encodeURIComponent(answer + therest) + ')';
document.getElementById('myvenn').src='//www.rjmprogramming.com.au/ITblog/' + Math.min(550,window.innerWidth) + '/' + Math.min(350,window.innerHeight) + '/?cht=v&chd=t:' + encodeURIComponent(answer) + therest + '';
if (document.getElementById('tdright').innerHTML == '') {
document.getElementById('tdright').innerHTML="  <span id=spemail><a target=_blank href='mailto:?subject=My%20Venn%20Diagram%20...%20best%20viewed%20in%20landscape%20...&body=" + encodeURIComponent((document.getElementById('myvenn').src + arest).replace(document.getElementById('myvenn').src.split('?')[0].split('#')[0], document.URL.split('?')[0].split('#')[0])) + "' id=aemail title=Email>&#128231;</a></span>      <span id=spsms><a target=_blank onmouseover=\"if (smsee.length == 0 && origsmsurl.indexOf('sms:&') != -1) { smsee=prompt('Please enter SMS number to send to.', ''); if (smsee == null) { smsee=''; } else { origsmsurl=origsmsurl.replace('sms:&','sms:' + smsee + '&'); asmsurl=asmsurl.replace('sms:&','sms:' + smsee + '&'); this.href=asmsurl; } }\" ontouchstart=\"if (smsee.length == 0 && origsmsurl.indexOf('sms:&') != -1) { smsee=prompt('Please enter SMS number to send to.', ''); if (smsee == null) { smsee=''; } else { origsmsurl=origsmsurl.replace('sms:&','sms:' + smsee + '&'); asmsurl=asmsurl.replace('sms:&','sms:' + smsee + '&'); this.href=asmsurl; } }\" href='sms:&body=" + encodeURIComponent((document.getElementById('myvenn').src + arest).replace(document.getElementById('myvenn').src.split('?')[0].split('#')[0], document.URL.split('?')[0].split('#')[0])) + "' id=asms title=SMS>&#128223;</a></span><br><br>  <input id=ilp onblur=\"lasttext=this.value.replace(/\~\~/g, '<br>'); this.value=''; this.placeholder='Click where you want ... ' + lasttext.replace(/\<br\>/g, String.fromCharCode(10));\" placeholder='Enter text and later click place for it on Venn Diagram to left (line feed is ~~)' type=text style=width:500px; value=''></input>";
}
} else {
alert('Try again.');
ask(null);
}
}
}
atstart=false;
normalcall=true;
}

… in our changed second draft image_venn.html Google Chart Image Chart Venn Chart interfacing web application you can also try below.

Did you know?

As far as this WordPress blog’s 404.php role goes in all this, we were keen to maintain Venn Diagrams that were purely image based data, because the web browser sharing mechanisms are so much better this way, else we were tempted to just construct a webpage HTML dataset positioning text in an absolute way with a Venn Chart background image. In order to do these purely image based Venn Diagrams we used PHP’s GD image library as per

<?php

if (strpos(('?' . $_SERVER['QUERY_STRING']), '?cht=') !== false || strpos(('?' . $_SERVER['QUERY_STRING']), '&cht=') !== false) {

$theqs=str_replace('??','?',('?' . $_SERVER['QUERY_STRING']));
if (strpos($theqs, '?chs=') === false && strpos($theqs, '&chs=') === false) {
$theqs='?chs=' . $newWidth . 'x' . $newHeight . '&' . explode('?', $theqs)[1];
}

if (strpos(('?' . $_SERVER['QUERY_STRING']), 'text1=') !== false) {
$theone=2;
$im = imagecreatefromstring(file_get_contents('ht
tp://chart.googleapis.com/chart' . explode('&text1=', $theqs)[0]));

if (7 == 7) {

$plotstring=str_replace('+',' ',urldecode($_GET['text1']));
$csv=explode(',', $plotstring);
$black = imagecolorallocatealpha($im, 1, 1, 1, 0);
if (sizeof($csv) >= 3) {
try {
if (function_exists('imagettftext')) {
if (explode('' . $csv[0] . ',' . $csv[1] . ',', $plotstring)[1] !== '') {
//echo explode('' . $csv[0] . ',' . $csv[1] . ',', $plotstring)[1];
//exit;
imagettftext($im, 10, 0, $csv[0], $csv[1], $black, realpath('arial.ttf'), explode('' . $csv[0] . ',' . $csv[1] . ',', $plotstring)[1]);
}
}
} catch (Exception $e) { }
while (isset($_GET['text' . $theone])) {
$plotstring=str_replace('+',' ',urldecode($_GET['text' . $theone]));
$csv=explode(',', $plotstring);
if (sizeof($csv) >= 3) {
try {
if (function_exists('imagettftext')) {
if (explode('' . $csv[0] . ',' . $csv[1] . ',', $plotstring)[1] !== '') {
imagettftext($im, 10, 0, $csv[0], $csv[1], $black, realpath('arial.ttf'), explode('' . $csv[0] . ',' . $csv[1] . ',', $plotstring)[1]);
}
}
} catch (Exception $e) { }
}
$theone++;
}
}

}


header('Content-Type: image/png');

imagepng($im);
imagedestroy($im);
} else {

header('Content-Type: image/png');
echo file_get_contents('http://chart.googleapis.com/chart' . $theqs);
}
exit;

}

?>


Previous relevant Google Chart Image Chart Venn Chart Interfacing Primer Tutorial is shown below.

Google Chart Image Chart Venn Chart Interfacing Primer Tutorial

Google Chart Image Chart Venn Chart Interfacing Primer Tutorial

So, moving on from Google Charts Image Chart Map Charts, today, let’s turn our attention to Google Charts Image Chart Venn Charts which we were dead set curious about given work we’d done in the past regarding Venn Diagrams, which we referenced when we presented Flowchart and Venn Diagram and Mind Map Token Subject Emoji Tutorial some time back. Gobsmackingly good is the Google approach, again, as you’d expect, but the approach covers different ground, so one feels one should go back to Primary School! You thought we were going to give away the answer to one of those security questions, didn’t you?! Didn’t you!?! Well, the answer is “Gryffindor Slytherin Ravenclaw Hufflepuff Junior Business College” … if you must know.

The sharing capabilities are good with the Google Charts approach too, given we are creating an HTML image, as our WordPress blog good ol’ 404.php has been woken up to address via …

<?php

if (strpos(('?' . $_SERVER['QUERY_STRING']), '?cht=') !== false || strpos(('?' . $_SERVER['QUERY_STRING']), '&cht=') !== false) {

$theqs=str_replace('??','?',('?' . $_SERVER['QUERY_STRING']));
if (strpos($theqs, '?chs=') === false && strpos($theqs, '&chs=') === false) {
$theqs='?chs=' . $newWidth . 'x' . $newHeight . '&' . explode('?', $theqs)[1];
}


header('Content-Type: image/png');
echo file_get_contents('http://chart.googleapis.com/chart' . $theqs);
exit;

}

?>

Yes, all these Image Chart smarts come, essentially, from a “one line” calling URL! Who’d have believed it! Shiver me timbers!

Well, it’s early days with this Venn Chart interfacing where we allow for …

  • circle (think up to three) definition … and the rest, in this first draft (hoping you’ve done some reading)
  • legend and title and colour selection user definitions dumped into a fairly unfriendly “the rest” Javascript prompt entry we ask of the user should they go ahead with the previous definition … and …
  • sharing and collaboration email and SMS functionality

… we hope you try via our “proof of concept” first draft image_venn.html Google Chart Image Chart Venn Chart interfacing web application you can also try below …


If this was interesting you may be interested in this too.


If this was interesting you may be interested in this too.


If this was interesting you may be interested in this too.


If this was interesting you may be interested in this too.


If this was interesting you may be interested in this too.


If this was interesting you may be interested in this too.


If this was interesting you may be interested in this too.


If this was interesting you may be interested in this too.


If this was interesting you may be interested in this too.


If this was interesting you may be interested in this too.


If this was interesting you may be interested in this too.


If this was interesting you may be interested in this too.


If this was interesting you may be interested in this too.


If this was interesting you may be interested in this too.


If this was interesting you may be interested in this too.


If this was interesting you may be interested in this too.


If this was interesting you may be interested in this too.


If this was interesting you may be interested in this too.


If this was interesting you may be interested in this too.


If this was interesting you may be interested in this too.


If this was interesting you may be interested in this too.


If this was interesting you may be interested in this too.


If this was interesting you may be interested in this too.


If this was interesting you may be interested in this too.


If this was interesting you may be interested in this too.

Posted in eLearning, Event-Driven Programming, Tutorials | Tagged , , , , , , , , , , , , , , , , , , , , , | Leave a comment

Python GraphViz via PHP on AlmaLinux Tutorial

Python GraphViz via PHP on AlmaLinux Tutorial

Python GraphViz via PHP on AlmaLinux Tutorial

Do you remember reading, with PHP Image GraphViz via Pear on AlmaLinux Primer Tutorial below, our outlining three known GraphViz guises …

  • the recent, alas now deprecated, Google Charts Image Charts GraphViz option means of drawing SVG graphics within an HTML image … we’ve known about before about yesterday
  • today’s interest, that being PHP Image GraphViz via Pear on AlmaLinux install, via the AlmaLinux cPanel “Module Installers” Pear installer page, means by which we can use GraphViz calls in PHP code … and, for the future …
  • GraphViz installs for Python via pip

…? Well, today, we start down the road of …

  1. installing Python GraphViz package via …

    pip install graphviz

    … then …
  2. getting great help from https://graphviz.readthedocs.io/en/stable/, thanks, as the Python code basis we call subgraph_example.py … and …
  3. used and remoulded by our overseeing PHP subgraph_example.php Python GraphViz using web application

… we need to work on more after this first draft start to another road of our GraphViz journey last talked about at PHP Image GraphViz via Pear on AlmaLinux Focus Tutorial.


Previous relevant PHP Image GraphViz via Pear on AlmaLinux Focus Tutorial is shown below.

PHP Image GraphViz via Pear on AlmaLinux Focus Tutorial

PHP Image GraphViz via Pear on AlmaLinux Focus Tutorial

It reared it’s ugly head with the Animated GIF Creator here at RJM Programming (helped out by the great Jeroen van Wissen open source work, thanks). And with yesterday’s PHP Image GraphViz via Pear on AlmaLinux Recallable Tutorial it reared up again.

On non-mobile focus goes to the address bar on many web browsers unless there is a (nominally) visible input type=text or textarea next in line.

It’s hard to keep in mind except as it “rears up” in an annoying way, but if we’d thought back, yes, we allow in the linked list feel of revealing textboxes (or textareas) only as they are needed scenarios we allow for two blank ones to be (nominally) visible at any given time … not one … but two, presumably because there is a tiny Javascript DOM “refresh period” not short enough to stop the web browser “desperation measure” (of placing focus in the address bar) happening?!

Why the non-mobile mention? Well, on mobile, a user programming [HTMLelement].focus(); call has no affect, as the touch operating systems need control of focus arrangements, presumably?!

How can we forget? My liege, please accept my humble apologies?!

Why the (nominally) mentions? Well, we have, successfully, in the past, just arranged a (statically HTML placed) textbox (ie. input type=text) that sits outside the viewing screen but not (nominally) invisible (eg. style=’position:absolute;top:-200px;left:-200px;’) can help you avoid the focus going up to the web browser address bar.

So that’s that, and other progress today is to allow the emailing or SMS of a recalled URL Step arrangement via more options on that “Recall Dropdown” we started allowing for yesterday.

Please see this happening in our changed PHP coded My Recipe Steps web application you can also try below.


Previous relevant PHP Image GraphViz via Pear on AlmaLinux Recallable Tutorial is shown below.

PHP Image GraphViz via Pear on AlmaLinux Recallable Tutorial

PHP Image GraphViz via Pear on AlmaLinux Recallable Tutorial

After yesterday’s PHP Image GraphViz via Pear on AlmaLinux Sharing Tutorial some readers may be curious to understand the distinction between …

  • email and SMS sharing … and …
  • inhouse intersessional sharing via window.localStorage (ie. like HTTP Cookies)

… over yesterday’s and today’s blog posting timings. Simply put, for us, we …

  • take a deep breath before starting intersessional window.localStorage work, as it is not to be sneezed at, as any sort of doddle (at least for us) … as well as …
  • since last intersessional window.localStorage work we’ve started using email and SMS sharing hashtagging arrangements that fit in, like a glove, with this intersessional window.localStorage work … so that …
  • even though, we write the code here in PHP, all this functionality is client based … which we like because …
  • get the idea correct, with careful forward planning and implementation, we’ll be able to apply similar such thinking into the future, whether that be for clientside only web applications and/or ones that call on serverside code (like PHP) … and …
  • if we can keep things just clientside more readers can be involved, we figure

If you’re wondering about the worry of any of this, it is to do with large title and/or URL link and/or ingredient type data whose data length could be huge, where most of our concern lies, and …

  • hashtagging (where data limits are so much longer) can help it remain as a clientside only solution environment (rather than relying on some form method=POST to a serverside (eg. PHP) receiver solution) …
  • window.localStorage is a step up from the HTTP Cookie style of intersessional (personal) storage as far as amounts that can be stored is concerned

What are we aiming for here, then, with our improvements?

  • extend the existant email and SMS functionality …
    <?php echo ”

    function emailit(insg) {
    var em='', ccok='';
    if (estitle == '') {
    if (cookb.split(' Or hash delimited appended string can ')[0] != '') {
    cookb=cookb.replace(cookb.split(' Or hash delimited appended string can ')[0], '');
    }
    }
    if (('' + insg).replace(/^null/g,'').replace(/^undefined/g,'').trim() != '') {
    em='' + insg;
    } else {

    em=prompt('Please enter Email address to share with. ' + cookb, '');
    }
    if (em != null) {
    if (em.trim() == '' && estitle != '') {
    em='#' + estitle;
    } else if (em == estitle && estitle != '') {
    em='#' + estitle;
    }
    }
    if (em.indexOf('#') != -1) {
    cook=em.substring(eval(1 + eval('' + em.indexOf('#'))));
    em=em.split('#')[0].trim();
    if (cook.trim() != '') {
    deleteAVal('steps_' + cook.replace(/\ /g,'-'),'');
    setAVal('steps_' + cook.replace(/\ /g,'-'), \"" . $hashurl . $hashurld . "\" + anyhashes);
    }
    }

    if (em == null) { em=''; }
    if (em.trim() != '') {
    if (em.trim().indexOf('@') != -1) {
    em+='?subject=Steps&body=' + encodeURIComponent(\"" . $hashurl . $hashurld . "\" + anyhashes);
    document.getElementById('dimap').innerHTML=\"<a style=display:none; id=theaemail target=_blank href='mailto:\" + em + \"'>Email</a>\";
    document.getElementById('theaemail').click();
    } else if (em.trim().replace(/0/g,'').replace(/1/g,'').replace(/2/g,'').replace(/3/g,'').replace(/4/g,'').replace(/5/g,'').replace(/6/g,'').replace(/7/g,'').replace(/8/g,'').replace(/9/g,'') == '') {
    em+='&body=' + encodeURIComponent(\"" . $hashurl . $hashurld . "\" + anyhashes);
    document.getElementById('dimap').innerHTML=\"<a style=display:none; id=theasms target=_blank href='sms:\" + em + \"'>SMS</a>\";
    document.getElementById('theasms').click();
    }
    }
    return false;

    }

    function smsit(insg) {
    var em='', cook='';
    if (estitle == '') {
    if (cookb.split(' Or hash delimited appended string can ')[0] != '') {
    cookb=cookb.replace(cookb.split(' Or hash delimited appended string can ')[0], '');
    }
    }
    if (('' + insg).replace(/^null/g,'').replace(/^undefined/g,'').trim() != '') {
    em='' + insg;
    } else {

    em=prompt('Please enter SMS number to share with. ' + cookb, '');
    }
    if (em != null) {
    if (em.trim() == '' && estitle != '') {
    em='#' + estitle;
    } else if (em == estitle && estitle != '') {
    em='#' + estitle;
    }
    }
    if (em.indexOf('#') != -1) {
    cook=em.substring(eval(1 + eval('' + em.indexOf('#'))));
    em=em.split('#')[0].trim();
    if (cook.trim() != '') {
    deleteAVal('steps_' + cook.replace(/\ /g,'-'),'');
    setAVal('steps_' + cook.replace(/\ /g,'-'), \"" . $hashurl . $hashurld . "\" + anyhashes);
    }
    }

    if (em == null) { em=''; }
    if (em.trim() != '') {
    if (em.trim().replace(/0/g,'').replace(/1/g,'').replace(/2/g,'').replace(/3/g,'').replace(/4/g,'').replace(/5/g,'').replace(/6/g,'').replace(/7/g,'').replace(/8/g,'').replace(/9/g,'') == '') {
    em+='&body=' + encodeURIComponent(\"" . $hashurl . $hashurld . "\" + anyhashes);
    document.getElementById('dimap').innerHTML=\"<a style=display:none; id=theasms target=_blank href='sms:\" + em + \"'>SMS</a>\";
    document.getElementById('theasms').click();
    } else if (em.trim().indexOf('@') != -1) {
    em+='?subject=Steps&body=' + encodeURIComponent(\"" . $hashurl . $hashurld . "\" + anyhashes);
    document.getElementById('dimap').innerHTML=\"<a style=display:none; id=theaemail target=_blank href='mailto:\" + em + \"'>Email</a>\";
    document.getElementById('theaemail').click();
    }
    }
    return false;
    }

    “; ?>
    … to cater for additional personalized Title (of steps) and Content of steps (using the hashtagging email and SMS URL methods set up yesterday)
    <?php echo ”

    var estitle=\"" . $estitle . "\";
    var cookb=\"" . $cookblurb . "\";
    var lssel='';
    var woo=null;

    function deleteAVal(goodname, aparticularvalue) {
    if (window.localStorage && goodname.indexOf('steps_') == 0) {
    if (('' + localStorage.getItem(goodname)).replace(/^undefined/g,'').replace(/^null/g,'') != '') {
    if (aparticularvalue == '') {
    localStorage.removeItem(goodname);
    } else {
    if (aparticularvalue.replace('HTTP','http').toLowerCase() == ('' + localStorage.getItem(goodname)).toLowerCase()) {
    localStorage.removeItem(goodname);
    }
    }
    }
    }
    }

    function setAVal(cName, cVal) {
    if (cName.indexOf('steps_') == 0) {
    if (window.localStorage) {
    localStorage.setItem(cName, encodeURIComponent(cVal));
    cookieAVal('steps_', true);
    return ' ';
    }
    return '';
    }
    return '';
    }

    function gotothis(inu) {
    if (inu.trim() != '') {
    if (inu.indexOf('HTTP') == 0) {
    //alert('2:' + inu);
    if (inu.indexOf('#steps_') != -1) {
    //alert('22:' + inu.split('#')[eval(-1 + inu.split('#').length)]);
    deleteAVal(inu.split('#')[eval(-1 + inu.split('#').length)], encodeURIComponent(inu.replace('#' + inu.split('#')[eval(-1 + inu.split('#').length)], '').replace('HTTP','http')));
    //alert('222:' + inu.split('#')[eval(-1 + inu.split('#').length)]);
    cookieAVal('steps_', true);
    //alert('2222:' + inu.split('#')[eval(-1 + inu.split('#').length)]);
    }
    } else {
    woo=window.open(inu, '_blank', 'top=50,left=50,width=800,height=800');
    }
    }
    }

    function cookieAVal(cName, selize) {
    var key=null;
    if (selize && window.localStorage) {
    lssel=' ';
    for (var i=0; i<localStorage.length; i++) { // thanks to https://stackoverflow.com/questions/41271092/how-to-loop-through-localstorage-values
    key = localStorage.key(i);
    if (('' + key).indexOf(cName) == 0) {
    if (lssel.trim() == '') {
    lssel='<select id=sells onchange=gotothis(this.value);><option value=\"\">Recallable Steps below ...</option></select>';
    }
    lssel=lssel.replace('</select>', '<option value=\"' + decodeURIComponent(localStorage.getItem('' + key)) + '\">' + ('' + key).substring(eval('' + cName.length)).replace(/\_/g,' ').replace(/\-/g,' ') + '</option>' + '<option value=\"' + decodeURIComponent(localStorage.getItem('' + key).replace('http','HTTP')) + '#steps_' + ('' + key).substring(eval('' + cName.length)) + '\">Remove ' + ('' + key).substring(eval('' + cName.length)).replace(/\_/g,' ').replace(/\-/g,' ') + '</option>' + '</select>');
    }
    }
    if (lssel != '') {
    document.getElementById('ssel').innerHTML=lssel.trim();
    }
    }
    if (cName.indexOf('steps_') == 0) {
    if (window.localStorage) {
    if (decodeURIComponent(('' + localStorage.getItem(cName)).replace(/^undefined/g,'').replace(/^null/g,'')) != '') {
    return decodeURIComponent(localStorage.getItem(cName));
    }
    if (decodeURIComponent(('' + sessionStorage.getItem(cName)).replace(/^undefined/g,'').replace(/^null/g,'')) != '') {
    return decodeURIComponent(sessionStorage.getItem(cName));
    }
    }
    return '';
    }
    return '';
    }

    “; ?>
  • add a new …

    <a id=pcookie title='Recall this' class=share onclick="return emailit(estitle);" style='display:none;text-decoration:none;cursor:pointer;'>🍪</a>

    … emoji link for intersessional window.localStorage work that calls the email functionality modified Javascript function …
  • allowing a window.localStorage.setItem([Title (of steps)], encodeURIComponent([Content of steps])) to add a personalized and recallable record be kept on the web browser of use … recallable via …
  • new dropdown populated with existant such records, as well as a dropdown option allowing the user to remove said records, too … which …
  • can navigate the user to this recallable Steps idea in a new webpage incarnation …
  • a dropdown arrangement which is intersessional as well as intrasessional by nature, and personalized to that user’s use of the web browser on that device in question

… in our changed PHP coded My Recipe Steps web application you can also try below.


Previous relevant PHP Image GraphViz via Pear on AlmaLinux Sharing Tutorial is shown below.

PHP Image GraphViz via Pear on AlmaLinux Sharing Tutorial

PHP Image GraphViz via Pear on AlmaLinux Sharing Tutorial

Adding to yesterday’s PHP Image GraphViz via Pear on AlmaLinux Primer Tutorial

  • on many mobile devices the horizontally spreading right cell arrangements has been improved by laying out these textarea elements vertically now …
  • hashtagged URL mailto: and/or sms: “a” links to email and/or SMS communication conduits, respectively …
    <?php echo ”

    var anyhashes='';
    var aone=1;
    var tdc=0;

    function checkforlh() {
    aone=1;
    if (('' + location.hash.indexOf('dtitle')) != -1) {
    if (('' + location.hash.indexOf('dtitle=')) != -1) {
    document.getElementById('therest').value=decodeURIComponent(('' + location.hash).split('dtitle=')[1].split('#')[0].split(encodeURIComponent('#'))[0]);
    document.getElementById('therest').name='dtitle';
    } else if (('' + location.hash.indexOf('dtitle' + encodeURIComponent('='))) != -1) {
    document.getElementById('therest').value=decodeURIComponent(('' + location.hash).split('dtitle' + encodeURIComponent('='))[1].split('#')[0].split(encodeURIComponent('#'))[0]);
    document.getElementById('therest').name='dtitle';
    }
    }
    var retv='';
    while (('' + location.hash.indexOf('step' + aone)) != -1) {
    if (('' + location.hash.indexOf('step' + aone + '=')) != -1) {
    if (aone <= 1) {
    document.getElementById('tdi' + aone).value=decodeURIComponent(('' + location.hash).split('step' + aone + '=')[1].split('#')[0].split(encodeURIComponent('#'))[0]);
    } else {
    document.getElementById('tdi' + aone).value=decodeURIComponent(('' + location.hash).split('step' + aone + '=')[1].split('#')[0].split(encodeURIComponent('#'))[0]);
    obl(document.getElementById('tdi' + aone), true); //document.getElementById('tdi' + aone).blur();
    if ( document.getElementById('tdi' + eval(1 + aone))) {
    document.getElementById('tdi' + eval(1 + aone)).focus();
    }
    }
    } else if (('' + location.hash.indexOf('step' + aone + encodeURIComponent('='))) != -1) {
    if (aone <= 1) {
    document.getElementById('tdi' + aone).value=decodeURIComponent(('' + location.hash).split('step' + aone + encodeURIComponent('='))[1].split('#')[0].split(encodeURIComponent('#'))[0]);
    } else {
    document.getElementById('tdi' + aone).value=decodeURIComponent(('' + location.hash).split('step' + aone + encodeURIComponent('='))[1].split('#')[0].split(encodeURIComponent('#'))[0]);
    obl(document.getElementById('tdi' + aone), true); //document.getElementById('tdi' + aone).blur();
    if ( document.getElementById('tdi' + eval(1 + aone))) {
    document.getElementById('tdi' + eval(1 + aone)).focus();
    }
    }
    }
    aone++;
    }
    if (aone > 1 || document.getElementById('therest').value != '') { anyhashes=('' + location.hash).replace(/\%23/g,'#'); setTimeout(function(){ if (confirm('Draw now (versus add more yourself)?') == true) { document.getElementById('mysub').click(); } }, 8000); }
    }

    “; ?>
    … help out with some new sharing functionalities

… so that “a procedure made up of steps” can now be shared and/or created collaboratively in our changed PHP coded My Recipe Steps web application.


Previous relevant PHP Image GraphViz via Pear on AlmaLinux Primer Tutorial is shown below.

PHP Image GraphViz via Pear on AlmaLinux Primer Tutorial

https://en.wikipedia.org/wiki/Graphviz

The term “GraphViz”

Graphviz (short for Graph Visualization Software) is a package of open-source tools initiated by AT&T Labs Research for drawing graphs (as in nodes and edges, not as in bar charts) specified in DOT language scripts having the file name extension “gv”. It also provides libraries for software applications to use the tools. Graphviz is free software licensed under the Eclipse Public License.

… we’ve learnt recently, means a lot of things, differently (nuanced) for a range of users, three that we’ve so far become aware of being …

  • the recent, alas now deprecated, Google Charts Image Charts GraphViz option means of drawing SVG graphics within an HTML image … we’ve known about before about yesterday
  • today’s interest, that being PHP Image GraphViz via Pear on AlmaLinux install, via the AlmaLinux cPanel “Module Installers” Pear installer page, means by which we can use GraphViz calls in PHP code … and, for the future …
  • GraphViz installs for Python via pip

… in amongst many others we’ve seen programmers using … totally cute, totally useful!

It seems with our PHP Image GraphViz via Pear on AlmaLinux as what looks like a very much “pared down” version of the last mode of use above, that we add constructed graph node or edge or cluster objects, and form them into SVG based HTML image elements. It’s look got me thinking “Steps”, then “Recipe Steps”, and back, quietly, to “Any Old Steps” as the day got more generic.

At first we got, as far as Recipes go (and here we thank Italian Wedding Soup for today’s inspiration), to …

  • cooking steps showing as Image GraphViz edge graphic components (having arrows connect ellipses containing text, a bit like Speech Bubbles) … and then trying to face the “real world” a user interested in recipes might want to see happen …
  • an Image GraphViz node graphic component whose wording could be a user supplied recipe Title along with a “URL” attribute link, optionally user supplied (via our HTML div SVG hosting ondblclick event allowing its contenteditable=true attribute and onblur event means by which these optional additional data items can enter the “mix”, if you’ll pardon the pun), probably pointing back to the original recipe information saucesource … and …
  • this title and/or “URL” and/or ingredient list (for example) can all be expressed as the “on hover” title attribute of the tailored user PHP webpage (yes, here we have PHP writing PHP) … and …
  • at least on Safari, given a recipe Title defined, we can arrange any browser context menu (ie. right click) over the HTML iframe hosted recipe content “Save Iframe As” option being able to download to a reasonably self explanatory download filename … and/or …
  • any web browser’s Add Bookmark functionality can be harnessed to help the user out in such a way that our PHP coded My Recipe Steps web application could end up being your one stop shop “Recipe Organizer” online?!

See what we mean below …


Previous relevant Google Chart Image Chart Angled Text Annotation Tutorial is shown below.

Google Chart Image Chart Angled Text Annotation Tutorial

Google Chart Image Chart Angled Text Annotation Tutorial

It’s Tuesday, in places around the world, looking back at yesterday’s Google Chart Image Chart Image Map Event Editing Tutorial. Can’t help but think we’ve forgotten something. Ah yes …

You talkin’ to me? You talkin’ to me? Meanwhile, back at the questions! Welcome back, Mr De Niro, sir. We hope your Tuesday is treating you well. (Rhetorical. Let it please be Rhetorical … oh dear God … it must be Rhetorical … it must be Rhetorical) We have news regarding “the dosh” (wink, wink) we were discussing the other day. You see …

Better to be king for a night than schmuck for a lifetime. Well, at least it’s not a question. … the thing is, silly us, it turns out that angled text issue was not a problem with [element].getBoundingClientRect() but how the PHP GD imagettftext text placement emanated from the bottom left of the text always, Mr De Niro sir.

Never rat on your friends and always keep your mouth shut. Really wish we could! Yes, Mr De Niro, sir, but, you see this means the rats are completely out of the picture, just leaving us with our money spinner. Right, Mr De Niro … sir.

There are three ways of doing things around here: the right way, the wrong way and the way that I do it. [Exeunt: Stage right] Well, that’s odd? Mr De Niro wasn’t interested in the quadrant nature to our problem solution …


var rectex=extents[eval(-1 + extents.length)].getBoundingClientRect();
if (document.URL.indexOf('debug=') != -1) {
document.body.innerHTML+='<div style="position:absolute;border:1px solid rgba(255,0,0,0.5);top:' + rectex.top + 'px;left:' + rectex.left + 'px;width:' + rectex.width + 'px;height:' + rectex.height + 'px;z-index:200;" title="position:absolute;border:1px solid rgba(255,0,0,0.5);top:' + rectex.top + 'px;left:' + rectex.left + 'px;width:' + rectex.width + 'px;height:' + rectex.height + 'px;z-index:200;"></div>';
}

var invs=inv.split('.'); // angled text origin depends on angle quadrant
var wasi=inv;
var theang=eval('' + fsx);
//alert('' + inv + ' ' + theang);

if (eval('' + invs.length) > 2 && inv.indexOf(',') != -1) {
//alert('' + rectex.width + 'x' + rectex.height + ' ' + ';' + rectex.top + 'vs' + rectex.bottom + ' ' + ';' + rectex.left + 'vs' + rectex.right + ' ' + inv + ' ' + extents[-1 + extents.length].outerHTML + ' ' + rectex.x + '+' + rectex.y);
if (7 == 8) {
inv=inv.replace(invs[0], '' + Math.floor(eval(rectex.left + rectex.width / 2)));
} else {
if (theang > (315 + 45) || theang < (45 + 45)) {
inv=inv.replace(invs[0], '' + Math.floor(eval(rectex.left * 1 + rectex.right * 0 + 0 * rectex.width / 2)));
} else if (theang >= (45 + 45) && theang <= (135 + 45)) {
inv=inv.replace(invs[0], '' + Math.floor(eval(rectex.left * 0 + rectex.right * 1 + 0 * rectex.width / 2)));
} else if (theang >= (225 + 45) && theang <= (315 + 45)) {
inv=inv.replace(invs[0], '' + Math.floor(eval(rectex.left * 1 + rectex.right * 0 + 0 * rectex.width / 2)));
} else {
inv=inv.replace(invs[0], '' + Math.floor(eval(rectex.left * 0 + rectex.right * 1 + 0 * rectex.width / 2)));
}
}


if (7 == 8) {
inv=inv.replace(',' + invs[1].split(',')[1], ',' + Math.floor(eval(rectex.top + rectex.height / 2)));
} else {
if (theang > (315 + 45) || theang < (45 + 45)) {
inv=inv.replace(',' + invs[1].split(',')[1], ',' + Math.floor(eval(rectex.top * 0 + rectex.bottom * 1 + 0 * rectex.height / 2)));
//alert('' + wasi + ' vs ' + inv + ' ' + invs.length);
} else if (theang >= (225 + 45) && theang <= (315 + 45)) {
inv=inv.replace(',' + invs[1].split(',')[1], ',' + Math.floor(eval(rectex.top * 1 + rectex.bottom * 0 + 0 * rectex.height / 2)));
} else if (theang >= (45 + 45) && theang < (135 + 45)) {
inv=inv.replace(',' + invs[1].split(',')[1], ',' + Math.floor(eval(rectex.top * 0 + rectex.bottom * 1 + 0 * rectex.height / 2)));
} else {
inv=inv.replace(',' + invs[1].split(',')[1], ',' + Math.floor(eval(rectex.top * 1 + rectex.bottom * 0 + 0 * rectex.height / 2)));
}
}


//alert('was=' + wasi + ' and now=' + inv);
} else if (eval('' + invs.length) == 2 && inv.indexOf(',') != -1) {
//alert('' + rectex.width + 'x' + rectex.height + ' ' + ';' + rectex.top + 'vs' + rectex.bottom + ' ' + ';' + rectex.left + 'vs' + rectex.right + ' ' + inv + ' ' + extents[-1 + extents.length].outerHTML + ' ' + rectex.x + '+' + rectex.y);
if (theang > (315 + 45) || theang < (45 + 45)) {
inv=inv.replace(invs[0], '' + Math.floor(eval(rectex.left * 1 + rectex.right * 0 + 0 * rectex.width / 2)));
} else if (theang >= (45 + 45) && theang <= (135 + 45)) {
inv=inv.replace(invs[0], '' + Math.floor(eval(rectex.left * 0 + rectex.right * 1 + 0 * rectex.width / 2)));
} else if (theang >= (225 + 45) && theang <= (315 + 45)) {
inv=inv.replace(invs[0], '' + Math.floor(eval(rectex.left * 1 + rectex.right * 0 + 0 * rectex.width / 2)));
} else {
inv=inv.replace(invs[0], '' + Math.floor(eval(rectex.left * 0 + rectex.right * 1 + 0 * rectex.width / 2)));
}
invs=inv.split(',');
if (theang > (315 + 45) || theang <= (45 + 45)) {
inv=inv.replace(',' + invs[1].split(',')[0].split('.')[0], ',' + Math.floor(eval(rectex.top * 0 + rectex.bottom * 1 + 0 * rectex.height / 2)));
//alert('' + wasi + ' vs ' + inv + ' ' + invs.length);
} else if (theang >= (225 + 45) && theang <= (315 + 45)) {
inv=inv.replace(',' + invs[1].split(',')[0].split('.')[0], ',' + Math.floor(eval(rectex.top * 1 + rectex.bottom * 0 + 0 * rectex.height / 2)));
} else if (theang >= (45 + 45) && theang < (135 + 45)) {
inv=inv.replace(',' + invs[1].split(',')[0].split('.')[0], ',' + Math.floor(eval(rectex.top * 0 + rectex.bottom * 1 + 0 * rectex.height / 2)));
} else {
inv=inv.replace(',' + invs[1].split(',')[0].split('.')[0], ',' + Math.floor(eval(rectex.top * 1 + rectex.bottom * 0 + 0 * rectex.height / 2)));
}
//alert('was=' + wasi + ' and now=' + inv);
}

… that temporary div element text border drawing, being the crucial way to find out what was happening, and showing us, at least on Google Chrome web browser, not to worry so much about [element].getBoundingClientRect() results for transformed HTML elements. And that is a huge relief in itself.

Also taking up a lot of today, we shored up Image Map Event Editing results bubbling through to an email or SMS recipient. The size of this data, and an analysis of …

  • client pre-emptive iframe … versus …
  • Ajax methodologies

… when it comes to complex and sizeable data such as “Javascript scripting” is, we should start swinging towards Ajax thinking, even pinching it off a client pre-emptive iframe onload event logic thought/start sometimes …


var myxhr=null, rawhtml='';
var zhr=null, zform=null;

function stateChanged() {
if (myxhr.readyState == 4) {
if (myxhr.status == 200) {
console.log('myxhr=' + myxhr);
rawhtml = myxhr.responseText.replace(/\\"/g, '"').replace(/\\'/g, "'");
if (document.getElementById('jdiv')) {
//alert('1:' + rawhtml);
//alert('21111 ' + rawhtml.split('<scr')[1]);
document.getElementById('jdiv').innerHTML=rawhtml.split('<scr')[0]; //xaconto.body.innerHTML;
//alert(31111);
if (document.getElementById('talkimg')) {
document.getElementById('talkimg').useMap='#mymap';
} else {
document.getElementById('myvenn').useMap='#mymap';
}
//alert(41111);
} else {
document.body.innerHTML+=rawhtml.split('<scr')[0]; //xaconto.body.innerHTML;
if (document.getElementById('talkimg')) {
document.getElementById('talkimg').useMap='#mymap';
} else {
document.getElementById('myvenn').useMap='#mymap';
}
}
if (rawhtml.indexOf('<scr') != -1) {

if (1 == 1) {
var tag = document.createElement('script');
var nextsep=rawhtml.split('<scr')[1].split('>')[0] + '>';
//var qw=prompt(rawhtml.split('<scr')[1].split(nextsep)[1].split('</scri')[0],rawhtml.split('<scr')[1].split(nextsep)[1].split('</scri')[0]);
//alert('2:' + rawhtml.split('<scr')[1].split(nextsep)[1].split('</scri')[0]);
tag.innerHTML = rawhtml.split('<scr')[1].split(nextsep)[1].split('</scri')[0];
var firstScriptTag = document.getElementsByTagName('script')[eval(-1 + document.getElementsByTagName('script').length)];
firstScriptTag.insertAdjacentElement("afterend", tag);
}

}
}
}
}

function prehrefcheck(inso) {
if (obsuffix != '') {
zhr = new XMLHttpRequest();
zform = new FormData();
if (decodeURIComponent(obsuffix.replace('&thescript=','')).indexOf('<scr') == -1) {
zform.append('scrstuff', ('<scr' + 'ipt type="text/javascript"> ' + decodeURIComponent(obsuffix.replace('&thescript=','')) + ' </scr' + 'ipt>').replace(/\ \ \ /g, String.fromCharCode(9)).replace(/\+\=/g, ' += '));
} else {
zform.append('scrstuff', ('<scr' + decodeURIComponent(obsuffix.replace('&thescript=','')).split('<scr')[1]).replace(/\ \ \ /g, String.fromCharCode(9)).replace(/\+\=/g, ' += '));
}
if (jufr == '') {
jufr='_' + Math.floor(Math.random() * 19878675);
}
zform.append('ufr', jufr);
zhr.responseType='Document';
zhr.open('post', '//www.rjmprogramming.com.au/ITblog/' + Math.min(550,window.innerWidth) + '/' + Math.min(350,window.innerHeight) + '/?cht=' + ctype, true);
zhr.send(zform);
}
}

function sofarpj(iois) {
var aname='', partsare=[], ipis=0, areabits='', repfrom='', repto='', iv=0, variety=String.fromCharCode(10) + ' var variety=[]; ' + String.fromCharCode(10);
while (thescript.indexOf(' var variety' + ('' + iv).replace(/^0$/g, '') + '=') != -1) {
repfrom='[' + thescript.split(' var variety' + ('' + iv).replace(/^0$/g, '') + '=[')[1].split('];')[0] + '];';
iv++;
}
if (iv > 0) { variety=String.fromCharCode(10) + ' var variety' + iv + '=[]; ' + String.fromCharCode(10); }
if (iois.src != '') {
var aconto = (iois.contentWindow || iois.contentDocument);
if (aconto != null) {
if (aconto.document) { aconto = aconto.document; }
if (aconto.body.innerHTML.indexOf('<scr') != -1 || document.URL.indexOf('ufr=') != -1) {
if (document.URL.indexOf('ufr=') != -1) {
if (!document.getElementById('jdiv')) {
document.body.innerHTML+='<div id=jdiv></div>';
}
//thescript='';
myxhr = new XMLHttpRequest();
myxhr.open('GET', '//www.rjmprogramming.com.au/presentation' + (location.search.split('ufr=')[1] ? decodeURIComponent(location.search.split('ufr=')[1].split('&')[0]) : '') + '.html', true);
myxhr.responseType = "text";
myxhr.onreadystatechange=stateChanged;
myxhr.send(null);
} else if (aconto.body.innerHTML.indexOf('<scr') != -1) {

thescript='<scr' + aconto.body.innerHTML.split('<scr')[1];
var tag = document.createElement('script');
var nextsep=thescript.split('<scr')[1].split('>')[0] + '>';
tag.innerHTML = thescript.split('<scr')[1].split(nextsep)[1].split('</scri')[0];
var firstScriptTag = document.getElementsByTagName('script')[eval(-1 + document.getElementsByTagName('script').length)];
firstScriptTag.insertAdjacentElement("afterend", tag);
}
}
pjsbih=aconto.body.innerHTML.split('<scr')[0];
if (lastpjsbih != '' && pjsbih != lastpjsbih.replace(/\ $/g,'')) {
//alert('Found new Image Map data of ' + pjsbih);
// {"chartshape":[{"name":"axis0_0","type":"RECT","coords":[21,336,28,344]},{"name":"axis0_1","type":"RECT","coords":[65,336,77,344]},{"name":"axis0_2","type":"RECT","coords":[111,336,124,344]},{"name":"axis0_3","type":"RECT","coords":[158,336,170,344]},{"name":"axis0_4","type":"RECT","coords":[204,336,217,344]},{"name":"axis0_5","type":"RECT","coords":[251,336,263,344]},{"name":"axis0_6","type":"RECT","coords":[297,336,310,344]},{"name":"axis0_7","type":"RECT","coords":[344,336,356,344]},{"name":"axis0_8","type":"RECT","coords":[390,336,403,344]},{"name":"axis0_9","type":"RECT","coords":[437,336,449,344]},{"name":"axis0_10","type":"RECT","coords":[480,336,499,344]},{"name":"axis1_0","type":"RECT","coords":[14,326,20,334]},{"name":"axis1_1","type":"RECT","coords":[8,297,20,305]},{"name":"axis1_2","type":"RECT","coords":[8,267,20,275]},{"name":"axis1_3","type":"RECT","coords":[8,237,20,245]},{"name":"axis1_4","type":"RECT","coords":[8,208,20,216]},{"name":"axis1_5","type":"RECT","coords":[8,178,20,186]},{"name":"axis1_6","type":"RECT","coords":[8,148,20,156]},{"name":"axis1_7","type":"RECT","coords":[8,119,20,127]},{"name":"axis1_8","type":"RECT","coords":[8,89,20,97]},{"name":"axis1_9","type":"RECT","coords":[8,59,20,67]},{"name":"axis1_10","type":"RECT","coords":[2,29,20,37]},{"name":"legend0","type":"RECT","coords":[500,167,512,179]},{"name":"legend1","type":"RECT","coords":[500,185,512,197]},{"name":"circle0","type":"CIRCLE","coords":[80,39,4]},{"name":"circle1","type":"CIRCLE","coords":[429,152,1]},{"name":"circle2","type":"CIRCLE","coords":[373,250,3]},{"name":"circle3","type":"CIRCLE","coords":[215,230,4]},{"name":"circle4","type":"CIRCLE","coords":[131,164,2]},{"name":"circle5","type":"CIRCLE","coords":[471,96,5]},{"name":"circle6","type":"CIRCLE","coords":[341,158,3]},{"name":"circle7","type":"CIRCLE","coords":[355,111,5]},{"name":"circle8","type":"CIRCLE","coords":[183,277,3]},{"name":"circle9","type":"CIRCLE","coords":[66,105,3]}]}
if (pjsbih.replace(/\[\]/g, '').indexOf('[') != -1) {
partsare=pjsbih.split('","coords":[');
for (ipis=1; ipis<partsare.length; ipis++) {
if (partsare[eval(-1 + ipis)].split('"')[eval(-1 + partsare[eval(-1 + ipis)].split('"').length)] == 'RECT') {
aname=partsare[eval(-1 + ipis)].split('"name":"')[eval(-1 + partsare[eval(-1 + ipis)].split('"name":"').length)].split('"')[0];
if (variety.indexOf(aname.split('_')[0].split('0')[0].split('1')[0].split('2')[0].split('3')[0].split('4')[0].split('5')[0].split('6')[0].split('7')[0].split('8')[0].split('9')[0] + '/rect') == -1) {
if (variety.indexOf('[]') != -1) {
variety=variety.replace("[]", "['" + aname.split('_')[0].split('0')[0].split('1')[0].split('2')[0].split('3')[0].split('4')[0].split('5')[0].split('6')[0].split('7')[0].split('8')[0].split('9')[0] + '/rect' + "']");
} else {
variety=variety.replace("]", ",'" + aname.split('_')[0].split('0')[0].split('1')[0].split('2')[0].split('3')[0].split('4')[0].split('5')[0].split('6')[0].split('7')[0].split('8')[0].split('9')[0] + '/rect' + "']");
}
repto='[' + variety.split('[')[1].split('];')[0] + '];';
}
areabits+='<area onmousedown=defclick(event); ondblclick=defclick(event); oncontextmenu=defclick(event); ontouchend=defclick(event); ontouchstart=defclick(event); onmouseout=defclick(event); onmousemove=defclick(event); ontouchdown=defclick(event); onmouseover=defclick(event); shape="rect" coords="' + partsare[ipis].split(']')[0] + '" id="' + aname + '" name="' + aname + '" alt="' + aname + '" onclick="' + "youralert(this,'This feature name is " + aname + "'" + ');" nohref>';
} else if (partsare[eval(-1 + ipis)].split('"')[eval(-1 + partsare[eval(-1 + ipis)].split('"').length)] == 'CIRCLE') {
aname=partsare[eval(-1 + ipis)].split('"name":"')[eval(-1 + partsare[eval(-1 + ipis)].split('"name":"').length)].split('"')[0];
if (variety.indexOf(aname.split('_')[0].split('0')[0].split('1')[0].split('2')[0].split('3')[0].split('4')[0].split('5')[0].split('6')[0].split('7')[0].split('8')[0].split('9')[0] + '/circle') == -1) {
if (variety.indexOf('[]') != -1) {
variety=variety.replace("[]", "['" + aname.split('_')[0].split('0')[0].split('1')[0].split('2')[0].split('3')[0].split('4')[0].split('5')[0].split('6')[0].split('7')[0].split('8')[0].split('9')[0] + '/circle' + "']");
} else {
variety=variety.replace("]", ",'" + aname.split('_')[0].split('0')[0].split('1')[0].split('2')[0].split('3')[0].split('4')[0].split('5')[0].split('6')[0].split('7')[0].split('8')[0].split('9')[0] + '/circle' + "']");
}
repto='[' + variety.split('[')[1].split('];')[0] + '];';
}
areabits+='<area onmousedown=defclick(event); ondblclick=defclick(event); oncontextmenu=defclick(event); ontouchend=defclick(event); ontouchstart=defclick(event); onmouseout=defclick(event); onmousemove=defclick(event); ontouchdown=defclick(event); onmouseover=defclick(event); shape="circle" coords="' + partsare[ipis].split(']')[0] + '" id="' + aname + '" name="' + aname + '" alt="' + aname + '" onclick="' + "youralert(this,'This feature name is " + aname + "'" + ');" nohref>';
} else if (partsare[eval(-1 + ipis)].split('"')[eval(-1 + partsare[eval(-1 + ipis)].split('"').length)] == 'POLY') {
aname=partsare[eval(-1 + ipis)].split('"name":"')[eval(-1 + partsare[eval(-1 + ipis)].split('"name":"').length)].split('"')[0];
if (variety.indexOf(aname.split('_')[0].split('0')[0].split('1')[0].split('2')[0].split('3')[0].split('4')[0].split('5')[0].split('6')[0].split('7')[0].split('8')[0].split('9')[0] + '/poly') == -1) {
if (variety.indexOf('[]') != -1) {
variety=variety.replace("[]", "['" + aname.split('_')[0].split('0')[0].split('1')[0].split('2')[0].split('3')[0].split('4')[0].split('5')[0].split('6')[0].split('7')[0].split('8')[0].split('9')[0] + '/poly' + "']");
} else {
variety=variety.replace("]", ",'" + aname.split('_')[0].split('0')[0].split('1')[0].split('2')[0].split('3')[0].split('4')[0].split('5')[0].split('6')[0].split('7')[0].split('8')[0].split('9')[0] + '/poly' + "']");
}
repto='[' + variety.split('[')[1].split('];')[0] + '];';
}
areabits+='<area onmousedown=defclick(event); ondblclick=defclick(event); oncontextmenu=defclick(event); ontouchend=defclick(event); ontouchstart=defclick(event); onmouseout=defclick(event); onmousemove=defclick(event); ontouchdown=defclick(event); onmouseover=defclick(event); shape="poly" coords="' + partsare[ipis].split(']')[0] + '" id="' + aname + '" name="' + aname + '" alt="' + aname + '" onclick="' + "youralert(this,'This feature name is " + aname + "'" + ');" nohref>';
}
}
document.getElementById('mymap').innerHTML=areabits + '<area' + atend.split('<area')[1].split('>')[0] + '>'; //"<area onclick=defclick(event); shape='default' nohref>";
if (repto.replace('[];','') != '' && repfrom != '') { thescript=thescript.replace(repfrom, repto); } else if (thescript.indexOf('[' + variety.split('[')[1]) == -1) { thescript=thescript.replace('>', '>' + variety); }
origmap=document.getElementById('mymap').outerHTML + thescript;
}
} else if (lastpjsbih != '') {
//alert('Found the same ' + pjsbih);
if (pjsbih.replace(/\[\]/g, '').indexOf('[') != -1) {
partsare=pjsbih.split('","coords":[');
for (ipis=1; ipis<partsare.length; ipis++) {
if (partsare[eval(-1 + ipis)].split('"')[eval(-1 + partsare[eval(-1 + ipis)].split('"').length)] == 'RECT') {
aname=partsare[eval(-1 + ipis)].split('"name":"')[eval(-1 + partsare[eval(-1 + ipis)].split('"name":"').length)].split('"')[0];
if (variety.indexOf(aname.split('_')[0].split('0')[0].split('1')[0].split('2')[0].split('3')[0].split('4')[0].split('5')[0].split('6')[0].split('7')[0].split('8')[0].split('9')[0] + '/rect') == -1) {
if (variety.indexOf('[]') != -1) {
variety=variety.replace("[]", "['" + aname.split('_')[0].split('0')[0].split('1')[0].split('2')[0].split('3')[0].split('4')[0].split('5')[0].split('6')[0].split('7')[0].split('8')[0].split('9')[0] + '/rect' + "']");
} else {
variety=variety.replace("]", ",'" + aname.split('_')[0].split('0')[0].split('1')[0].split('2')[0].split('3')[0].split('4')[0].split('5')[0].split('6')[0].split('7')[0].split('8')[0].split('9')[0] + '/rect' + "']");
}
repto='[' + variety.split('[')[1].split('];')[0] + '];';
}
areabits+='<area onmousedown=defclick(event); ondblclick=defclick(event); oncontextmenu=defclick(event); ontouchend=defclick(event); ontouchstart=defclick(event); onmouseout=defclick(event); onmousemove=defclick(event); ontouchdown=defclick(event); onmouseover=defclick(event); shape="rect" coords="' + partsare[ipis].split(']')[0] + '" id="' + aname + '" name="' + aname + '" alt="' + aname + '" onclick="' + "youralert(this,'This feature name is " + aname + "'" + ');" nohref>';
} else if (partsare[eval(-1 + ipis)].split('"')[eval(-1 + partsare[eval(-1 + ipis)].split('"').length)] == 'CIRCLE') {
aname=partsare[eval(-1 + ipis)].split('"name":"')[eval(-1 + partsare[eval(-1 + ipis)].split('"name":"').length)].split('"')[0];
if (variety.indexOf(aname.split('_')[0].split('0')[0].split('1')[0].split('2')[0].split('3')[0].split('4')[0].split('5')[0].split('6')[0].split('7')[0].split('8')[0].split('9')[0] + '/circle') == -1) {
if (variety.indexOf('[]') != -1) {
variety=variety.replace("[]", "['" + aname.split('_')[0].split('0')[0].split('1')[0].split('2')[0].split('3')[0].split('4')[0].split('5')[0].split('6')[0].split('7')[0].split('8')[0].split('9')[0] + '/circle' + "']");
} else {
variety=variety.replace("]", ",'" + aname.split('_')[0].split('0')[0].split('1')[0].split('2')[0].split('3')[0].split('4')[0].split('5')[0].split('6')[0].split('7')[0].split('8')[0].split('9')[0] + '/circle' + "']");
}
repto='[' + variety.split('[')[1].split('];')[0] + '];';
}
areabits+='<area onmousedown=defclick(event); ondblclick=defclick(event); oncontextmenu=defclick(event); ontouchend=defclick(event); ontouchstart=defclick(event); onmouseout=defclick(event); onmousemove=defclick(event); ontouchdown=defclick(event); onmouseover=defclick(event); shape="circle" coords="' + partsare[ipis].split(']')[0] + '" id="' + aname + '" name="' + aname + '" alt="' + aname + '" onclick="' + "youralert(this,'This feature name is " + aname + "'" + ');" nohref>';
} else if (partsare[eval(-1 + ipis)].split('"')[eval(-1 + partsare[eval(-1 + ipis)].split('"').length)] == 'POLY') {
aname=partsare[eval(-1 + ipis)].split('"name":"')[eval(-1 + partsare[eval(-1 + ipis)].split('"name":"').length)].split('"')[0];
if (variety.indexOf(aname.split('_')[0].split('0')[0].split('1')[0].split('2')[0].split('3')[0].split('4')[0].split('5')[0].split('6')[0].split('7')[0].split('8')[0].split('9')[0] + '/poly') == -1) {
if (variety.indexOf('[]') != -1) {
variety=variety.replace("[]", "['" + aname.split('_')[0].split('0')[0].split('1')[0].split('2')[0].split('3')[0].split('4')[0].split('5')[0].split('6')[0].split('7')[0].split('8')[0].split('9')[0] + '/poly' + "']");
} else {
variety=variety.replace("]", ",'" + aname.split('_')[0].split('0')[0].split('1')[0].split('2')[0].split('3')[0].split('4')[0].split('5')[0].split('6')[0].split('7')[0].split('8')[0].split('9')[0] + '/poly' + "']");
}
repto='[' + variety.split('[')[1].split('];')[0] + '];';
}
areabits+='<area onmousedown=defclick(event); ondblclick=defclick(event); oncontextmenu=defclick(event); ontouchend=defclick(event); ontouchstart=defclick(event); onmouseout=defclick(event); onmousemove=defclick(event); ontouchdown=defclick(event); onmouseover=defclick(event); shape="poly" coords="' + partsare[ipis].split(']')[0] + '" id="' + aname + '" name="' + aname + '" alt="' + aname + '" onclick="' + "youralert(this,'This feature name is " + aname + "'" + ');" nohref>';
}
}
document.getElementById('mymap').innerHTML=areabits + '<area' + atend.split('<area')[1].split('>')[0] + '>'; //"<area onclick=defclick(event); shape='default' nohref>";
if (repto.replace('[];','') != '' && repfrom != '') { thescript=thescript.replace(repfrom, repto); } else if (thescript.indexOf('[' + variety.split('[')[1]) == -1) { thescript=thescript.replace('>', '>' + variety); }
origmap=document.getElementById('mymap').outerHTML + thescript;
}
}
lastpjsbih=pjsbih;
}
}
}


cimg=new Image;

cimg.onload = function(){
var honebit="<h2><span onclick=\"location.href=document.URL.split('?')[0].split('#')[0];\" title=Reset style=cursor:pointer;>Interfacing</span> to <a target=_blank href='https://developers.google.com/chart/interactive/docs/index' title='Google Chart Tools provide a perfect way to visualize data on your website. From simple line charts to complex hierarchical tree maps, the chart galley provides a large number of well-designed chart types. Populating your data is easy using the provided client- and server-side tools.'>Google Charts</a> <a target=_blank title='Google Charts Image Chart' href='https://developers.google.com/chart/image/docs/gallery/chart_gall'>Image Chart</a></h2><h4 id=myh3>RJM Programming - November, 2023</h4>";
var hthreebit="";
document.body.style.backgroundColor='transparent';
document.body.innerHTML=agscript.replace("'';", "'" + cht.replace('_','') + "';").replace('<canvas ','<canvas width=' + cimg.width + ' height=' + cimg.height + ' ') + "<table><tr><td><img style='border-right:1px dotted pink;border-bottom:1px dotted pink;' ondblclick=\"window.open(document.URL.split('?')[0].split('#')[0],'_blank','top=50,left=50,width=600,height=600');\" title='Talk image that will update over time (double click for Google Chart Image Chart interfacing) ... " + ("" + (new Date())) + "' id=talkimg src='" + cimg.src + "?rand=" + Math.floor(Math.random() * 198786754) + "' usemap='#mymap'></img></td><td id=tdtr style=\"opacity:0.0;background-image:url(" + cimg.src.replace('presentation_', 'presentation__') + "),url(" + cimg.src + "?rand=0);background-position:0% 0%,50% 0%;background-size:50% 50%,50% 50%;background-repeat:no-repeat,no-repeat;\"></td></tr><tr><td id=tdbl>" + honebit + hthreebit + "</td><td><img style='border-right:1px dotted pink;border-bottom:1px dotted pink;' ondblclick=\"window.open(document.URL.split('?')[0].split('#')[0],'_blank','top=50,left=50,width=600,height=600');\" title='Talk first and last images that will update over time (double click for Google Chart Image Chart interfacing) ... " + ("" + (new Date())) + "' id=talkimgg src='" + cimg.src.replace('.png','.gif') + "?rand=" + Math.floor(Math.random() * 198786754) + "'></img></td></tr></table><div id=idiv></div><iframe onload=mapsofarpj(this); id=mappjs style=display:none; src=></iframe><div id=jdiv></div>";
document.body.style.cursor='progress';
if (cht.substring(0,1) == '_') {
//alert('//www.rjmprogramming.com.au/presentation' + cht + '.html_GETME');
if (1 == 1) {
myxhr = new XMLHttpRequest();
myxhr.open('GET', '//www.rjmprogramming.com.au/presentation' + cht + '.html', true);
myxhr.responseType = "text";
myxhr.onreadystatechange=stateChanged;
myxhr.send(null);
} else {

document.getElementById('mappjs').src='//www.rjmprogramming.com.au/presentation' + cht + '.html';
}
setTimeout(canvinit, 5000);
}
setTimeout(talkupdate, eightthousand);
};

cimg.src='//www.rjmprogramming.com.au/presentation' + cht + '.png';
return '';
}

… in the changed latest draft image_venn.html Google Chart Image Chart Venn Chart or Scatter Chart or GraphViz Chart or Pie Chart or Line Chart or Bar Chart or Candlestick/Box Chart or Google-O-Meter Chart or Radar Chart or Map Chart interfacing web application you can also try below.


Previous relevant Google Chart Image Chart Image Map Event Editing Tutorial is shown below.

Google Chart Image Chart Image Map Event Editing Tutorial

Google Chart Image Chart Image Map Event Editing Tutorial

If we are talking “layers” (of functionality) again, onto the progress that yesterday’s Google Chart Image Chart Image Map Events Tutorial represented, then , it is logical …

  • that if yesterday we presented some programmer defined image map event logic … then, today, we’d want to …
  • offer the user the chance to change that default programmer defined image map event logic, to that of their own design

… in the form of

  • user defined Javascript .. editable in a …
  • HTML textarea element

… and then the coding latching onto a document.createElement(‘script’) paradigm, to add Javascript clientside logic, on the fly.

There’s a first time we can remember aspect to how we present these possibilities to the user. We present it in …

  • amongst the inhouse annotation options … as a …
  • “reveal” pairing of HTML5 details/summary element combination look … the first time we can remember aspect to that being …
  • only initially displaying within the details element innerHTML is a summary element nesting a single “icon like” image (like the other “inhouse annotation” icon images) … but if clicked …
  • the details innerHTML has added to it a textarea element …

    function fillindetsed(odet) {
    if (odet.innerHTML.split('</summary>')[1] == '') {
    document.getElementById('tdleft').style.verticalAlign='top';
    var onls=thescript.split('<scr' + 'ipt type="text/javascript">');
    var onlstuff=onls[1].split('</sc' + 'ript>')[0];
    odet.innerHTML+='<scr' + 'ipt type="text/javascript">' + "<br><textarea onblur=tproc(this); id=tscript rows=100 cols=80 value=''>" + onlstuff + "</textarea><br></script>";
    //odet.innerHTML+='<scr' + 'ipt type="text/javascript">' + "<br><textarea onblur=tproc(this); id=tscript rows=100 cols=80 value=''>" + encodeURIComponent(onlstuff) + "</textarea><br></script>";
    //document.getElementById('tscript').value=decodeURIComponent(document.getElementById('tscript').innerHTML);
    }
    }

… from which document.createElement(‘script’) code onblur event logic emanates …


function tproc(ota) {
//alert(ota.value);
var tag = document.createElement('script');
if (1 == 1) {
obsuffix='&thescript=' + encodeURIComponent(ota.value);
if (document.getElementById('aemail')) {
hrefcheck(document.getElementById('aemail'));
}
//alert('<scr' + 'ipt type="text/javascript"> ' + String.fromCharCode(10) + ota.value + String.fromCharCode(10) + ' </scr' + 'ipt>');
tag.innerHTML = ' <scr'.substring(0,1) + 'ipt type="text/javascript"> '.slice(-1) + String.fromCharCode(10) + ota.value + String.fromCharCode(10) + ' </scr'.substring(0,1) + 'ipt> '.slice(-1);
document.getElementById('dmap').innerHTML=document.getElementById('mymap').outerHTML + ' <scr' + 'ipt type="text/javascript"> ' + String.fromCharCode(10) + ota.value + String.fromCharCode(10) + ' </scr' + 'ipt> ';
}
var firstScriptTag = document.getElementsByTagName('script')[eval(-1 + document.getElementsByTagName('script').length)];
//alert(tag.outerHTML);
firstScriptTag.insertAdjacentElement("afterend", tag);
//alert(ota.value);
document.getElementById('detsed').open=false;
}

… in the changed latest draft image_venn.html Google Chart Image Chart Venn Chart or Scatter Chart or GraphViz Chart or Pie Chart or Line Chart or Bar Chart or Candlestick/Box Chart or Google-O-Meter Chart or Radar Chart or Map Chart interfacing web application you can also try below.


Previous relevant Google Chart Image Chart Image Map Events Tutorial is shown below.

Google Chart Image Chart Image Map Events Tutorial

Google Chart Image Chart Image Map Events Tutorial

We really like HTML image maps, and it occurred to us with yesterday’s Google Chart Image Chart Image Map Tutorial we were hiding its light under some bushel somewhere, because …

  • yesterday we introduced with only the onclick event coded for in the HTML area subelements to the map parent element … linked to an …
  • associated img element … via an …
  • attribute called usemap … and two aspects, at the very least, to stuff under the bushel are …
    1. many more events than onclick can be defined as you define the area subelements … and here’s the kicker …
    2. you can add area subelement event logic that, on paper, would cause interference with other event logic (ie. the same event type in an event bubbling through scenario) but it won’t if you, as a programmer, turn that use of the usemap attribute on and off like a tap

… which, to our mind, represents the bee’s knees of event management. So useful!

To tip our toes into this woooorrrrrlllllddd we’ll show you some newly added area subelement event logics in a Google Chart Image Chart Radar Chart example below …


<map name="mymap" id="mymap"><area onmousedown="defclick(event);" ondblclick="defclick(event);" oncontextmenu="defclick(event);" ontouchend="defclick(event);" ontouchstart="defclick(event);" onmouseout="defclick(event);" onmousemove="defclick(event);" ontouchdown="defclick(event);" onmouseover="defclick(event);" shape="rect" coords="151,34,157,42" id="axis0_0" name="axis0_0" alt="axis0_0" onclick="youralert(this,'This feature name is axis0_0');" nohref=""><area onmousedown="defclick(event);" ondblclick="defclick(event);" oncontextmenu="defclick(event);" ontouchend="defclick(event);" ontouchstart="defclick(event);" onmouseout="defclick(event);" onmousemove="defclick(event);" ontouchdown="defclick(event);" onmouseover="defclick(event);" shape="rect" coords="281,110,288,118" id="axis0_1" name="axis0_1" alt="axis0_1" onclick="youralert(this,'This feature name is axis0_1');" nohref=""><area onmousedown="defclick(event);" ondblclick="defclick(event);" oncontextmenu="defclick(event);" ontouchend="defclick(event);" ontouchstart="defclick(event);" onmouseout="defclick(event);" onmousemove="defclick(event);" ontouchdown="defclick(event);" onmouseover="defclick(event);" shape="rect" coords="281,260,288,268" id="axis0_2" name="axis0_2" alt="axis0_2" onclick="youralert(this,'This feature name is axis0_2');" nohref=""><area onmousedown="defclick(event);" ondblclick="defclick(event);" oncontextmenu="defclick(event);" ontouchend="defclick(event);" ontouchstart="defclick(event);" onmouseout="defclick(event);" onmousemove="defclick(event);" ontouchdown="defclick(event);" onmouseover="defclick(event);" shape="rect" coords="151,336,157,344" id="axis0_3" name="axis0_3" alt="axis0_3" onclick="youralert(this,'This feature name is axis0_3');" nohref=""><area onmousedown="defclick(event);" ondblclick="defclick(event);" oncontextmenu="defclick(event);" ontouchend="defclick(event);" ontouchstart="defclick(event);" onmouseout="defclick(event);" onmousemove="defclick(event);" ontouchdown="defclick(event);" onmouseover="defclick(event);" shape="rect" coords="20,260,27,268" id="axis0_4" name="axis0_4" alt="axis0_4" onclick="youralert(this,'This feature name is axis0_4');" nohref=""><area onmousedown="defclick(event);" ondblclick="defclick(event);" oncontextmenu="defclick(event);" ontouchend="defclick(event);" ontouchstart="defclick(event);" onmouseout="defclick(event);" onmousemove="defclick(event);" ontouchdown="defclick(event);" onmouseover="defclick(event);" shape="rect" coords="20,110,27,118" id="axis0_5" name="axis0_5" alt="axis0_5" onclick="youralert(this,'This feature name is axis0_5');" nohref=""><area id="adef" onclick=" defclick(event); if (!done) { done=false; if (atstart) { normalcall=false; ask(null); normalcall=true; atstart=false; } else { ask(event); } } " shape="default" nohref=""></map>

… with new relevant event code snippet to help add intelligence to the event logic of our Google Chart Image Chart interfacing web application …


function defclick(evt) {
switch ('' + evt.type) {
case 'click':

alert('Welcome to RJM Programming interfacing to Google Charts Image Chart ' + cname);
break;

default:
switch (('' + evt.type + ' ').substring(0,5)) {
case 'mouse':
document.getElementById('myh3').innerHTML='RJM Programming - November, 2023 ... non-mobile mouse event ' + evt.type + ' called by ' + ('' + evt.target.id);
break;

case 'touch':
document.getElementById('myh3').innerHTML='RJM Programming - November, 2023 ... mobile touch event ' + evt.type + ' called by ' + ('' + evt.target.id);
break;

default:
alert(evt.type);
break;
}
break;
}

}

Interesting, huh?!

Feel free to try this out in the changed latest draft image_venn.html Google Chart Image Chart Venn Chart or Scatter Chart or GraphViz Chart or Pie Chart or Line Chart or Bar Chart or Candlestick/Box Chart or Google-O-Meter Chart or Radar Chart or Map Chart interfacing web application you can also try below.


Previous relevant Google Chart Image Chart Image Map Tutorial is shown below.

Google Chart Image Chart Image Map Tutorial

Google Chart Image Chart Image Map Tutorial

Do you like to come at explaining things in layers? Sort of like the analogy …

  • you start a project thinking of it in terms of “2D” … and then to move forward …
  • you spend a day making it work for “3D” (and keep the “2D” working as well)

… or …

  • you start a web application project thinking of only working via a URL entered on the web browser address bar … and then to move forward …
  • you spend a day making it work for serving the same purpose and/or a difference purpose called within an HTML iframe (and keep it working for the address bar way as well)

And so we look at a “picturesque” but “kinda dumb” (as far as “action items” go) image we have coming off the interfacing to Google Charts Image Chart. Where can we go here? Well, it would be kind of you to take it to the beach, but that’s not always a possibility now, is it?! Were you pulling my leg?! Tee hee. No, we were thinking … oh no … we have a bad feeling about this … let’s open it up to the class … anyone, anyone? Yes, Louis, would you and Auguste like to share with the class what is so amusing to you?

.
.
.
.
.
.
.
.
.
.
.
.
.
.
.

Okay, thank you for your thoughts on this, and yes, you could take the “picture” to “a picture show”. Yes, very droll, indeed. Any other ideas? Okay, Johann, you say the idea just “clicked” with you. This sounds promising. Go on …

.
.
.
.
.
.
.
.
.
.
.
.
.
.
.

Indeed, a young “picturesque” might like to go tap dancing, that is true. Sheeeeesh! But given the lesson is a Computing one, rather than Drama or Dance or Music or the Arts, maybe we would be looking for a way to use the picture in an enhanced way. Okay Kevin, we’ll try you. What do you think?

.
.
.
.
.
.
.
.
.
.
.
.
.
.
.
.
.
.
.
.
.
.
.
.
.
.
.
.
.
.

Frankly, we are flabbergasted! It’s as if you invented HTML image maps (as a way to add position based event logic), or something … 93/4 points to Gryffindor!

Yes, helping out we image map enthusiasts regarding interfacing to Google Charts Image Charts is Google’s Image Map creation helping Json output tool. From that help, we can …

  • at the demonstrator’s webpage, create an Image Map … and as the user requires …
  • at the uniquifier definition phase of our WordPress 404.php’s contribution we accept the demonstrator’s image map HTML, and save it to a public resource
    <?php

    if (isset($_POST['canvcont'])) {
    if (isset($_POST['uniquifier'])) {
    $uniquifier=str_replace('+',' ',urldecode($_POST['uniquifier']));
    }
    if ($uniquifier == '') {
    $uniquifier='_' . rand(0,78654356);
    file_put_contents($_SERVER['DOCUMENT_ROOT'] . DIRECTORY_SEPARATOR . "presentation" . $uniquifier . ".png", base64_decode( explode('base64,', str_replace(' ','+',urldecode($_POST['canvcont'])))[1]));
    file_put_contents($_SERVER['DOCUMENT_ROOT'] . DIRECTORY_SEPARATOR . "presentation_" . $uniquifier . ".png", base64_decode( explode('base64,', str_replace(' ','+',urldecode($_POST['canvcont'])))[1]));
    file_put_contents($_SERVER['DOCUMENT_ROOT'] . DIRECTORY_SEPARATOR . "presentation__" . $uniquifier . ".png", base64_decode( explode('base64,', str_replace(' ','+',urldecode($_POST['canvcont'])))[1]));
    if (isset($_POST['mapstuff'])) {
    file_put_contents($_SERVER['DOCUMENT_ROOT'] . DIRECTORY_SEPARATOR . "presentation" . $uniquifier . ".html", '<html><body>' . str_replace('+',' ',urldecode($_POST['mapstuff'])) . '</body></html>');
    }

    exec("/usr/local/cpanel/3rdparty/bin/convert -delay 20 -loop 0 " . $_SERVER['DOCUMENT_ROOT'] . DIRECTORY_SEPARATOR . "presentation" . $uniquifier . ".png" . " " . $_SERVER['DOCUMENT_ROOT'] . DIRECTORY_SEPARATOR . "presentation" . $uniquifier . ".gif");
    echo "<html><body onload=\"if (parent.document.getElementById('uniquifier')) { if (parent.document.getElementById('uniquifier').value == '') { parent.document.getElementById('uniquifier').value='" . $uniquifier . "'; } }\"></body></html>";
    } else {
    file_put_contents($_SERVER['DOCUMENT_ROOT'] . DIRECTORY_SEPARATOR . "presentation" . $uniquifier . ".png", base64_decode( explode('base64,', str_replace(' ','+',urldecode($_POST['canvcont'])))[1]));
    if (file_exists($_SERVER['DOCUMENT_ROOT'] . DIRECTORY_SEPARATOR . "presentation__" . $uniquifier . ".png")) {
    $middelay='';
    $enddelay='';
    if (filesize($_SERVER['DOCUMENT_ROOT'] . DIRECTORY_SEPARATOR . "presentation__" . $uniquifier . ".png") < filesize($_SERVER['DOCUMENT_ROOT'] . DIRECTORY_SEPARATOR . "presentation_" . $uniquifier . ".png")) {
    $middelay=' -delay 800 ';
    $enddelay=' -delay 800 ';
    }
    exec("rm -f " . $_SERVER['DOCUMENT_ROOT'] . DIRECTORY_SEPARATOR . "presentation" . $uniquifier . ".gif ; /usr/local/cpanel/3rdparty/bin/convert -delay 600 -loop 0 " . $_SERVER['DOCUMENT_ROOT'] . DIRECTORY_SEPARATOR . "presentation_" . $uniquifier . ".png " . $middelay . $_SERVER['DOCUMENT_ROOT'] . DIRECTORY_SEPARATOR . "presentation__" . $uniquifier . ".png " . $enddelay . $_SERVER['DOCUMENT_ROOT'] . DIRECTORY_SEPARATOR . "presentation" . $uniquifier . ".png" . " " . $_SERVER['DOCUMENT_ROOT'] . DIRECTORY_SEPARATOR . "presentation" . $uniquifier . ".gif");
    } else {
    exec("rm -f " . $_SERVER['DOCUMENT_ROOT'] . DIRECTORY_SEPARATOR . "presentation" . $uniquifier . ".gif ; /usr/local/cpanel/3rdparty/bin/convert -delay 200 -loop 0 " . $_SERVER['DOCUMENT_ROOT'] . DIRECTORY_SEPARATOR . "presentation_" . $uniquifier . ".png " . $_SERVER['DOCUMENT_ROOT'] . DIRECTORY_SEPARATOR . "presentation" . $uniquifier . ".png" . " " . $_SERVER['DOCUMENT_ROOT'] . DIRECTORY_SEPARATOR . "presentation" . $uniquifier . ".gif");
    }
    }
    exit;
    }

    ?>
  • helping keep the image mapping going, even if the Image Chart is …
    1. shared via email or SMS … and/or …
    2. forms the basis of a Broadcast Talk demonstration session

We could use Ajax techniques for the Javascript client ways an emailee’s link’s webpage invocation can use this new resource, but we kind of like “client pre-emptive iframe” onload event thinking, for both sides of the ledger, to get this going, as per …


function htmlDecode(input) { // thanks to https://stackoverflow.com/questions/1912501/unescape-html-entities-in-javascript
var e = document.createElement('textarea');
e.innerHTML = input;
// handle case of empty input
return e.childNodes.length === 0 ? "" : e.childNodes[0].nodeValue;
}

function mapsofarpj(xiois) {
//alert(('' + xiois.src));
if (xiois.src != '' && ('' + xiois.src).indexOf('presentation') != -1) {
//alert(('' + xiois.src));
var xaconto = (xiois.contentWindow || xiois.contentDocument);
//alert(11);
if (xaconto != null) {
//alert(111);
if (xaconto.document) { xaconto = xaconto.document; }
//alert(1111);
if (xaconto.body.innerHTML.indexOf('<map') != -1) {
var ihis=xaconto.body.innerHTML;
//while (ihis.indexOf('\"') != -1) {
// ihis=ihis.replace('\"', '')
//}
ihis=htmlDecode(ihis).replace(/\\"/g,'').replace(/\\'/g,"'").replace(/\=\"\"/g,'').replace(/This\"/g,"This").replace(/\;\ nohref/g, ';" nohref');
//alert(ihis);
if (document.getElementById('jdiv')) {
//alert(21111);
document.getElementById('jdiv').innerHTML=ihis; //xaconto.body.innerHTML;
//alert(31111);
document.getElementById('talkimg').useMap='#mymap';
//alert(41111);
} else {
document.body.innerHTML+=ihis; //xaconto.body.innerHTML;
document.getElementById('talkimg').useMap='#mymap';
}
}
}
}
}

function sofarpj(iois) {
var aname='', partsare=[], ipis=0, areabits='';
if (iois.src != '') {
var aconto = (iois.contentWindow || iois.contentDocument);
if (aconto != null) {
if (aconto.document) { aconto = aconto.document; }
pjsbih=aconto.body.innerHTML;
if (lastpjsbih != '' && pjsbih != lastpjsbih.replace(/\ $/g,'')) {
//alert('Found new Image Map data of ' + pjsbih);
// {"chartshape":[{"name":"axis0_0","type":"RECT","coords":[21,336,28,344]},{"name":"axis0_1","type":"RECT","coords":[65,336,77,344]},{"name":"axis0_2","type":"RECT","coords":[111,336,124,344]},{"name":"axis0_3","type":"RECT","coords":[158,336,170,344]},{"name":"axis0_4","type":"RECT","coords":[204,336,217,344]},{"name":"axis0_5","type":"RECT","coords":[251,336,263,344]},{"name":"axis0_6","type":"RECT","coords":[297,336,310,344]},{"name":"axis0_7","type":"RECT","coords":[344,336,356,344]},{"name":"axis0_8","type":"RECT","coords":[390,336,403,344]},{"name":"axis0_9","type":"RECT","coords":[437,336,449,344]},{"name":"axis0_10","type":"RECT","coords":[480,336,499,344]},{"name":"axis1_0","type":"RECT","coords":[14,326,20,334]},{"name":"axis1_1","type":"RECT","coords":[8,297,20,305]},{"name":"axis1_2","type":"RECT","coords":[8,267,20,275]},{"name":"axis1_3","type":"RECT","coords":[8,237,20,245]},{"name":"axis1_4","type":"RECT","coords":[8,208,20,216]},{"name":"axis1_5","type":"RECT","coords":[8,178,20,186]},{"name":"axis1_6","type":"RECT","coords":[8,148,20,156]},{"name":"axis1_7","type":"RECT","coords":[8,119,20,127]},{"name":"axis1_8","type":"RECT","coords":[8,89,20,97]},{"name":"axis1_9","type":"RECT","coords":[8,59,20,67]},{"name":"axis1_10","type":"RECT","coords":[2,29,20,37]},{"name":"legend0","type":"RECT","coords":[500,167,512,179]},{"name":"legend1","type":"RECT","coords":[500,185,512,197]},{"name":"circle0","type":"CIRCLE","coords":[80,39,4]},{"name":"circle1","type":"CIRCLE","coords":[429,152,1]},{"name":"circle2","type":"CIRCLE","coords":[373,250,3]},{"name":"circle3","type":"CIRCLE","coords":[215,230,4]},{"name":"circle4","type":"CIRCLE","coords":[131,164,2]},{"name":"circle5","type":"CIRCLE","coords":[471,96,5]},{"name":"circle6","type":"CIRCLE","coords":[341,158,3]},{"name":"circle7","type":"CIRCLE","coords":[355,111,5]},{"name":"circle8","type":"CIRCLE","coords":[183,277,3]},{"name":"circle9","type":"CIRCLE","coords":[66,105,3]}]}
if (pjsbih.replace(/\[\]/g, '').indexOf('[') != -1) {
partsare=pjsbih.split('","coords":[');
for (ipis=1; ipis<partsare.length; ipis++) {
if (partsare[eval(-1 + ipis)].split('"')[eval(-1 + partsare[eval(-1 + ipis)].split('"').length)] == 'RECT') {
aname=partsare[eval(-1 + ipis)].split('"name":"')[eval(-1 + partsare[eval(-1 + ipis)].split('"name":"').length)].split('"')[0];
areabits+='<area shape="rect" coords="' + partsare[ipis].split(']')[0] + '" alt="' + aname + '" onclick="' + "alert('This feature name is " + aname + "'" + ');" nohref>';
} else if (partsare[eval(-1 + ipis)].split('"')[eval(-1 + partsare[eval(-1 + ipis)].split('"').length)] == 'CIRCLE') {
aname=partsare[eval(-1 + ipis)].split('"name":"')[eval(-1 + partsare[eval(-1 + ipis)].split('"name":"').length)].split('"')[0];
areabits+='<area shape="circle" coords="' + partsare[ipis].split(']')[0] + '" alt="' + aname + '" onclick="' + "alert('This feature name is " + aname + "'" + ');" nohref>';
} else if (partsare[eval(-1 + ipis)].split('"')[eval(-1 + partsare[eval(-1 + ipis)].split('"').length)] == 'POLY') {
aname=partsare[eval(-1 + ipis)].split('"name":"')[eval(-1 + partsare[eval(-1 + ipis)].split('"name":"').length)].split('"')[0];
areabits+='<area shape="poly" coords="' + partsare[ipis].split(']')[0] + '" alt="' + aname + '" onclick="' + "alert('This feature name is " + aname + "'" + ');" nohref>';
}
}
document.getElementById('mymap').innerHTML=areabits + '<area' + atend.split('<area')[1].split('>')[0] + '>'; //"<area onclick=defclick(event); shape='default' nohref>";
origmap=document.getElementById('mymap').outerHTML;
}
} else if (lastpjsbih != '') {
//alert('Found the same ' + pjsbih);
if (pjsbih.replace(/\[\]/g, '').indexOf('[') != -1) {
partsare=pjsbih.split('","coords":[');
for (ipis=1; ipis<partsare.length; ipis++) {
if (partsare[eval(-1 + ipis)].split('"')[eval(-1 + partsare[eval(-1 + ipis)].split('"').length)] == 'RECT') {
aname=partsare[eval(-1 + ipis)].split('"name":"')[eval(-1 + partsare[eval(-1 + ipis)].split('"name":"').length)].split('"')[0];
areabits+='<area shape="rect" coords="' + partsare[ipis].split(']')[0] + '" alt="' + aname + '" onclick="' + "alert('This feature name is " + aname + "'" + ');" nohref>';
} else if (partsare[eval(-1 + ipis)].split('"')[eval(-1 + partsare[eval(-1 + ipis)].split('"').length)] == 'CIRCLE') {
aname=partsare[eval(-1 + ipis)].split('"name":"')[eval(-1 + partsare[eval(-1 + ipis)].split('"name":"').length)].split('"')[0];
areabits+='<area shape="circle" coords="' + partsare[ipis].split(']')[0] + '" alt="' + aname + '" onclick="' + "alert('This feature name is " + aname + "'" + ');" nohref>';
} else if (partsare[eval(-1 + ipis)].split('"')[eval(-1 + partsare[eval(-1 + ipis)].split('"').length)] == 'POLY') {
aname=partsare[eval(-1 + ipis)].split('"name":"')[eval(-1 + partsare[eval(-1 + ipis)].split('"name":"').length)].split('"')[0];
areabits+='<area shape="poly" coords="' + partsare[ipis].split(']')[0] + '" alt="' + aname + '" onclick="' + "alert('This feature name is " + aname + "'" + ');" nohref>';
}
}
document.getElementById('mymap').innerHTML=areabits + '<area' + atend.split('<area')[1].split('>')[0] + '>'; //"<area onclick=defclick(event); shape='default' nohref>";
origmap=document.getElementById('mymap').outerHTML;
}
}
lastpjsbih=pjsbih;
}
}
}

… further to yesterday’s Google Chart Image Chart Dynamic Icons Tutorial in the changed latest draft image_venn.html Google Chart Image Chart Venn Chart or Scatter Chart or GraphViz Chart or Pie Chart or Line Chart or Bar Chart or Candlestick/Box Chart or Google-O-Meter Chart or Radar Chart or Map Chart interfacing web application you can also try below.


Previous relevant Google Chart Image Chart Dynamic Icons Tutorial is shown below.

Google Chart Image Chart Dynamic Icons Tutorial

Google Chart Image Chart Dynamic Icons Tutorial

Does statistics have to be staid and boring? Kitch and quiche?! Welcome to the wooorrrlllddd of Google Charts Image Chart Dynamic Icons!

Think of Dynamic Icons as a way to decorate one or more data points displayed in one of …

  • Line Chart
  • Bar Chart
  • Map Chart
  • Radar Chart

We had that certain “Wow! factor going as we remembered our state’s motto from some years back, and we tried out the Map Chart to see whether we could embellish the map with a Dynamic Icon relevant to New South Wales, as you can see with today’s tutorial picture.

We’ll show you the most recent snapshot of Javascript parameters a little later, but the change for this is an optional one up to the user to work out, with prompts such as the Map Chart one updated

Enter vertical bar separated country ISO Country and/or Region Code list. Please note that optional Dynamic Icons are available via a suffixing string example applied to the second data point such as &chem=y;s=bubble_icon_text_small;d=ski,bb,NSW%20State%20of%20Wow!,FFFFFF;dp=1;ds=0 eg. AU-NT|AU-NSW|AU-SA|NZ|IN’

And here is its relevance in a new snapshot of parameterizations …


var prefixandon='';
var dtextis='dtext';
var pretherest='';
var newtherest='';
var tmod='';
var colchange='';
var cht=location.search.split('cht=')[1] ? decodeURIComponent(location.search.split('cht=')[1].split('&')[0]) : "v";
if ((cht + ' ').substring(0,1) == 'p' && cht != 'p') { pretherest=cht.substring(1); }
//if ((cht + ' ').substring(0,2) == 'bv' && cht != 'bv') { pretherest=cht.substring(2); if (1 == 1) { cht='bv'; } }
if ((cht + ' ').substring(0,1) == 'bv'.substring(0,1) && cht != 'bv'.substring(0,1)) { pretherest=cht.substring(1); if (1 == 1) { cht='bv'.substring(0,1); } }
if ((cht + ' ').substring(0,1) == 'l' && cht != 'l') { pretherest=cht.substring(1); if (1 == 1) { cht='l'; } }
if ((cht + ' ').substring(0,1) == 'r' && cht != 'r') { pretherest=cht.substring(1); if (1 == 1) { cht='r'; } }
var ccode=location.search.split('chld=')[1] ? decodeURIComponent(location.search.split('chld=')[1].split('&')[0]) : "";
var ctype=location.search.split('type=')[1] ? decodeURIComponent(location.search.split('type=')[1].split('&')[0]) : cht;
var cname=(ctype == 'v' ? 'Venn Chart' : (ctype == 's' ? 'Scatter Chart' : (ctype == 'gv' ? 'GraphViz Chart' :
(ctype.substring(0,1) == 'p' ? 'Pie Chart' :
((ctype + ' ').substring(0,2).substring(0,1) == 'bv'.substring(0,1) ? 'Bar Chart' : (ctype.substring(0,1) == 'l' ? 'Line Chart' :
(ctype == 'map' ? 'Map Chart' :
(ctype == 'gom' ? 'Google-O-Meter Chart' :
(ctype == 'r' ? 'Radar Chart' :
'')))))))));
var cencodename=(ctype == 'v' ? 'Venn%20Diagram' : (ctype == 's' ? 'Scatter%20Chart' : (ctype == 'gv' ? 'GraphViz%20Chart' :
(ctype.substring(0,1) == 'p' ? 'Pie%20Chart' :
((ctype + ' ').substring(0,2).substring(0,1) == 'bv'.substring(0,1) ? 'Bar%20Chart' : (ctype.substring(0,1) == 'l' ? 'Line%20Chart' :
(ctype == 'map' ? 'Map%20Chart' :
(ctype == 'gom' ? 'Google-O-Meter%20Chart' :
(ctype == 'r' ? 'Radar%20Chart' :
'')))))))));
var chdt=(ctype == 'v' ? '&chd=t:' : (ctype == 's' ? '&chd=t:' : (ctype == 'gv' ? '&chl=' :
(ctype.substring(0,1) == 'p' ? pretherest + '&chd=t:' :
((ctype + ' ').substring(0,2).substring(0,1) == 'bv'.substring(0,1) ? '&chd=t:' : (ctype.substring(0,1) == 'l' ? '&chd=t:' :
(ctype == 'map' ? '' :
(ctype == 'gom' ? '&chd=t:' :
(ctype == 'r' ? pretherest + '&chd=t:' :
'')))))))));
var chdeq=(ctype == 'v' ? '&chd=' : (ctype == 's' ? '&chd=' : (ctype == 'gv' ? '&chl=' :
(ctype.substring(0,1) == 'p' ? '&chd=' :
((ctype + ' ').substring(0,2).substring(0,1) == 'bv'.substring(0,1) ? '&chd=' : (ctype.substring(0,1) == 'l' ? '&chd=' :
(ctype == 'map' ? '&chld=' :
(ctype == 'gom' ? '&chld=' :
(ctype == 'r' ? '&chd=' :
'')))))))));
var tc=(ctype == 'v' ? 't:' : (ctype == 's' ? 't:' : (ctype == 'gv' ? '' :
(ctype.substring(0,1) == 'p' ? 't:' :
((ctype + ' ').substring(0,2).substring(0,1) == 'bv'.substring(0,1) ? 't:' : (ctype.substring(0,1) == 'l' ? 't:' :
(ctype == 'map' ? '' :
(ctype == 'gom' ? 't:' :
(ctype == 'r' ? 't:' :
'')))))))));
var chdl=(ctype == 'v' ? '&chdl=' : (ctype == 's' ? '&chdl=' : (ctype == 'gv' ? '' :
(ctype.substring(0,1) == 'p' ? '&chdl=' :
((ctype + ' ').substring(0,2).substring(0,1) == 'bv'.substring(0,1) ? '&chbh=' : (ctype.substring(0,1) == 'l' ? '&chbh=' :
(ctype == 'map' ? '' :
(ctype == 'gom' ? '&chdl=' :
(ctype == 'r' ? '&chxt=x&chxl=' :
'')))))))));

var prenchtt=(ctype == 'v' ? '100,80,60,30,30,30,10' : (ctype == 's' ? '12,87,75,41,23,96,68,71,34,9|98,60,27,34,56,79,58,74,18,76|84,23,69,81,47,94,60,93,64,54' : (ctype == 'gv' ? 'graph{C_0--H_0[type=s];C_0--H_1[type=s];C_0--H_2[type=s];C_0--C_1[type=s];C_1--H_3[type=s];C_1--H_4[type=s];C_1--H_5[type=s]}' :
(ctype.substring(0,1) == 'p' ? '1,2,3,4' :
((ctype + ' ').substring(0,2).substring(0,1) == 'bv'.substring(0,1) ? '5,5,5|10,10,10|15,15,15' : (ctype.substring(0,1) == 'l' ? '5,45,5|10,60,10|15,85,15' :
(ctype == 'map' ? '' :
(ctype == 'gom' ? '20,40,60' :
(ctype == 'r' ? '10,20,30,40,50' :
'')))))))));
var preachtt=(ctype == 'v' ? 'A|B|C' : (ctype == 's' ? 'Cats|Dogs' : (ctype == 'gv' ? '' :
(ctype.substring(0,1) == 'p' ? 'January|February|March|April' :
((ctype + ' ').substring(0,2).substring(0,1) == 'bv'.substring(0,1) ? '15,4,15' : (ctype.substring(0,1) == 'l' ? '15,4,15' :
(ctype == 'map' ? '' :
(ctype == 'gom' ? 'A|B|C' :
(ctype == 'r' ? '0:|1|2|3|4|5|6' :
'')))))))));
var defchco=(ctype == 'v' ? 'ff0000,00ff00,0000ff' : (ctype == 's' ? 'FF0000|0000FF&chxt=x,y' : (ctype == 'gv' ? '' :
(ctype.substring(0,1) == 'p' ? 'ff0000,00ff00,0000ff,ff00ff' :
((ctype + ' ').substring(0,2).substring(0,1) == 'bv'.substring(0,1) ? '4D89F9,C6D9FD,C6FDD9&chxt=x,y' : (ctype.substring(0,1) == 'l' ? '3D89F9.B6D9FD,B6FDD9&chxt=x,y' :
(ctype == 'map' ? '' :
(ctype == 'gom' ? 'ff0000,00ff00,0000ff' :
(ctype == 'r' ? 'FF0000,FF9900,ff0a00,00ffb0,000cff' :
'')))))))));

var prechtt=(ctype == 'v' ? chdt + prenchtt + chdl + preachtt : (ctype == 's' ? chdt + prenchtt + chdl + preachtt + '&chxt=x,y' : (ctype == 'gv' ? chdt + prenchtt :
(ctype.substring(0,1) == 'p' ? chdt + prenchtt + chdl + preachtt :
((ctype + ' ').substring(0,2).substring(0,1) == 'bv'.substring(0,1) ? chdt + prenchtt + chdl + preachtt : (ctype.substring(0,1) == 'l' ? chdt + prenchtt + chdl + preachtt :
(ctype == 'map' ? '' :
(ctype == 'gom' ? chdt + prenchtt + chdl + preachtt :
(ctype == 'r' ? chdt + prenchtt + chdl + preachtt :
'')))))))));
var promptone=(ctype == 'v' ? "Enter delimited values string for Venn Diagram such that ... " + String.fromCharCode(10) + "The first three values specify the sizes of three circles: A, B, & C. For chart with only two circles, specify zero for the third value." + String.fromCharCode(10) + "The fourth value specifies the size of the intersection of A and B." + String.fromCharCode(10) + "The fifth value specifies the size of the intersection of A and C. For a chart with only two circles, do not specify a value here." + String.fromCharCode(10) + "The sixth value specifies the size of the intersection of B and C. For a chart with only two circles, do not specify a value here." + String.fromCharCode(10) + "The seventh value specifies the size of the common intersection of A, B, and C. For a chart with only two circles, do not specify a value here." + String.fromCharCode(10) + String.fromCharCode(10) + "" : (ctype == 's' ? "Enter delimited values string for Scatter Chart" : (ctype == 'gv' ? "Enter delimited values string for GraphViz Chart" :
(ctype.substring(0,1) == 'p' ? "Enter delimited values string for Pie Chart" :
((ctype + ' ').substring(0,2).substring(0,1) == 'bv'.substring(0,1) ? "Enter v for Vertical or h for Horizontal then one of g for Group or s for Stacked or o for Overlapped Bar Chart look then a space and then enter delimited values string for Bar Chart. Here is a Candlestick and horizontal Bar Chart idea eg. hg 1:20,10,15,25,17,30|0,5,10,7,12,6|35,25,45,47,24,46|15,40,30,27,39,54|70,55,63,59,80,6 Here is a vertical Bar Chart and Box Chart idea vs 1:-1,5,10,7,12,-1|-1,25,30,27,24,-1|-1,40,45,47,39,-1|-1,55,63,59,80,-1|-1,30,40,35,30,-1|-1,-1,5,70,90,-1|-1,-1,-1,80,5,-1&chm=F,FF9900,0,1:4,40|H,0CBF0B,0,1:4,1:20|H,000000,4,1:4,1:40|H,0000FF,3,1:4,1:20|o,FF0000,5,-1,7|o,FF0000,6,-1,7 Prefix just the delimited string you enter by 1: to additionally display Candlestick/Box Charts or by 0: to only display Candlestick/Box Chart" :
(ctype.substring(0,1) == 'l' ? "Enter c for Even or s for Sparklines or xy for Just XY Line Chart look then a space and then enter delimited values string for Line Chart. Here is a Candlestick and Line Chart idea eg. c 1:20,10,15,25,17,30|0,5,10,7,12,6|35,25,45,47,24,46|15,40,30,27,39,54|70,55,63,59,80,6 Here is a Line Chart and Box Chart idea s 1:-1,5,10,7,12,-1|-1,25,30,27,24,-1|-1,40,45,47,39,-1|-1,55,63,59,80,-1|-1,30,40,35,30,-1|-1,-1,5,70,90,-1|-1,-1,-1,80,5,-1&chm=F,FF9900,0,1:4,40|H,0CBF0B,0,1:4,1:20|H,000000,4,1:4,1:40|H,0000FF,3,1:4,1:20|o,FF0000,5,-1,7|o,FF0000,6,-1,7 Prefix just the delimited string you enter by 1: to additionally display Candlestick/Box Charts or by 0: to only display Candlestick/Box Chart" :
(ctype == 'map' ? "" :
(ctype == 'gom' ? "Enter delimited values string for Google-O-Meter Chart" :
(ctype == 'r' ? "Enter delimited values string for Radar Chart but prefix with an s for smooth lines" :
"")))))))));
var oneprompt=(ctype == 'v' ? "Enter delimited values string for your Venn Diagram collaborations, optionally, such that ... " + String.fromCharCode(10) + "The first three values specify the sizes of three circles: A, B, & C. For chart with only two circles, specify zero for the third value." + String.fromCharCode(10) + "The fourth value specifies the size of the intersection of A and B." + String.fromCharCode(10) + "The fifth value specifies the size of the intersection of A and C. For a chart with only two circles, do not specify a value here." + String.fromCharCode(10) + "The sixth value specifies the size of the intersection of B and C. For a chart with only two circles, do not specify a value here." + String.fromCharCode(10) + "The seventh value specifies the size of the common intersection of A, B, and C. For a chart with only two circles, do not specify a value here." + String.fromCharCode(10) + String.fromCharCode(10) + "" : (ctype == 's' ? "Enter delimited values string for Scatter Chart" : (ctype == 'gv' ? "Enter delimited values string for GraphViz Chart" :
(ctype.substring(0,1) == 'p' ? "Enter delimited values string for Pie Chart" :
((ctype + ' ').substring(0,2).substring(0,1) == 'bv'.substring(0,1) ? "Enter g for Grouped or s for Stacked or o for Overlapped Bar Chart look then a space and then enter delimited values string for Bar Chart. Here is a Candlestick and Bar Chart idea eg. g 1:20,10,15,25,17,30|0,5,10,7,12,6|35,25,45,47,24,46|15,40,30,27,39,54|70,55,63,59,80,6 Here is a vertical Bar Chart and Box Chart idea vs 1:-1,5,10,7,12,-1|-1,25,30,27,24,-1|-1,40,45,47,39,-1|-1,55,63,59,80,-1|-1,30,40,35,30,-1|-1,-1,5,70,90,-1|-1,-1,-1,80,5,-1&chm=F,FF9900,0,1:4,40|H,0CBF0B,0,1:4,1:20|H,000000,4,1:4,1:40|H,0000FF,3,1:4,1:20|o,FF0000,5,-1,7|o,FF0000,6,-1,7 Prefix just the delimited string you enter by 1: to additionally display Candlestick/Box Charts or by 0: to only display Candlestick/Box Chart" :
(ctype.substring(0,1) == 'l' ? "Enter c for Even or s for Sparklines or xy for Just XY Line Chart look then a space and then enter delimited values string for Line Chart. Here is a Candlestick and Line Chart idea eg. c 1:20,10,15,25,17,30|0,5,10,7,12,6|35,25,45,47,24,46|15,40,30,27,39,54|70,55,63,59,80,6 Here is a Line Chart and Box Chart idea s 1:-1,5,10,7,12,-1|-1,25,30,27,24,-1|-1,40,45,47,39,-1|-1,55,63,59,80,-1|-1,30,40,35,30,-1|-1,-1,5,70,90,-1|-1,-1,-1,80,5,-1&chm=F,FF9900,0,1:4,40|H,0CBF0B,0,1:4,1:20|H,000000,4,1:4,1:40|H,0000FF,3,1:4,1:20|o,FF0000,5,-1,7|o,FF0000,6,-1,7 Prefix just the delimited string you enter by 1: to additionally display Candlestick/Box Charts or by 0: to only display Candlestick/Box Chart" :
(ctype == 'map' ? "" :
(ctype == 'gom' ? "Enter delimited values string for Google-O-Meter Chart" :
(ctype == 'r' ? "Enter delimited values string for Radar Chart but prefix with an s for smooth lines" :
"")))))))));
var asktwo=(ctype == 'v' ? true : (ctype == 's' ? true : (ctype == 'gv' ? false :
(ctype.substring(0,1) == 'p' ? true :
((ctype + ' ').substring(0,2).substring(0,1) == 'bv'.substring(0,1) ? true : (ctype.substring(0,1) == 'l' ? true :
(ctype == 'map' ? false :
(ctype == 'gom' ? true :
(ctype == 'r' ? true :
false)))))))));

var answersuffix=(ctype.substring(0,1).replace('m','l').replace('b','l').replace('r','l') == 'l' ? '. Please note that optional Dynamic Icons are available via a suffixing string example applied to the second data point such as &chem=y;s=bubble_icon_text_small;d=ski,bb,Wheeee!,FFFFFF;dp=1;ds=0 ' : '');

var twopb=(ctype.substring(0,1) == 'p' ? 'Any optional legend or title argument snippets? Optionally prefix by 3 for 3d Pie Chart or by c for Concentric Pie Chart. Eg. 3' + chdl + preachtt + '&chtt=My%20' + cencodename + '&chco=' + defchco : 'Any optional legend or title argument snippets? Eg. ' + chdl + preachtt + '&chtt=My%20' + cencodename + '&chco=' + defchco);
var beforeanswer=(ctype.substring(0,1) == 'l' ? 'c ' : ((ctype + ' ').substring(0,2).substring(0,1) == 'bv'.substring(0,1) ? 'vg ' : ''));

var emsmlist='';

… further to yesterday’s Google Chart Image Chart Broadcast Talk Commentary Tutorial in the changed latest draft image_venn.html Google Chart Image Chart Venn Chart or Scatter Chart or GraphViz Chart or Pie Chart or Line Chart or Bar Chart or Candlestick/Box Chart or Google-O-Meter Chart or Radar Chart or Map Chart interfacing web application you can also try below.


Previous relevant Google Chart Image Chart Broadcast Talk Commentary Tutorial is shown below.

Google Chart Image Chart Broadcast Talk Commentary Tutorial

Google Chart Image Chart Broadcast Talk Commentary Tutorial

We’ll leave yesterday’s Google Chart Image Chart Radar Chart Tutorial angled text predilections for now, given we’ve got until Tuesday until tswhtf so to speak. Let’s today remedy the concern we had when we presented Google Chart Image Chart Broadcast Talk Context Tutorial regarding, the at the time new, “Broadcast Talk”, concept …

… even though it is only visual by nature, presented as an update image still presented and updated periodically. Go figure?!

… and offer a way to help the “Broadcast Talk” demonstrator “speak” during their demonstration, effectively. In so doing, we are going to add to …

  • the demonstrator’s visual inputs coming from that canvas annotator helper … with, today …
  • the demonstrator’s commentary, collected via an HTML textarea element (to optionally supplement the visuals) from that canvas annotator helper’s originator window (ie. the Google Charts Image Chart interfacing supervisor) … presented …

… via a new “middle of three slide” …

<?php

$uwidth=trim($uparts[$ioff - 2 + sizeof($uparts)]);
$uheight=trim(explode('#',explode('?',$uparts[$ioff - 1 + sizeof($uparts)])[0])[0]);
if (isset($_GET['canvcont']) && isset($_GET['uniquifier'])) {
$uniquifier=str_replace('+',' ',urldecode($_GET['uniquifier']));
if (file_exists($_SERVER['DOCUMENT_ROOT'] . DIRECTORY_SEPARATOR . "presentation__" . $uniquifier . ".png")) {
$im = imagecreatefromstring(file_get_contents($_SERVER['DOCUMENT_ROOT'] . DIRECTORY_SEPARATOR . "presentation__" . $uniquifier . ".png"));
$white = imagecolorallocate($im, 255, 255, 255);
$black = imagecolorallocate($im, 1, 1, 1);
imagefilledrectangle($im, 0, 0, $uwidth, $uheight, $white);
imagesavealpha($im, TRUE);
try {
if (function_exists('imagettftext')) {
imagettftext($im, 12, 0, 20, 20, $black, realpath('arial.ttf'), str_replace('+',' ',urldecode($_GET['canvcont'])));
}
} catch (Exception $e) { }

imagepng($im, $_SERVER['DOCUMENT_ROOT'] . DIRECTORY_SEPARATOR . "presentation__" . $uniquifier . ".png");
imagedestroy($im);
exit;
}
exit;
}


?>

… animated GIF (PHP 404.php helping) means of display in the viewer windows (off email invitation links they receive via the demonstrator) in the changed


function askaway() {
var waspis=prefixandon, nl='', newwaspis='';
if (document.getElementById('bcommentary')) {
if (document.getElementById('bcommentary').value.trim() != '') {
if (document.getElementById('bcommentary').value.trim().indexOf(String.fromCharCode(10)) == -1) {
nl=String.fromCharCode(10);
}
eightthousand=24000;
if ((' ' + document.getElementById('bcommentary').value.trim()).slice(-3) != '...' && (' ' + prefixandon.trim()).slice(-3) != '...' && (document.getElementById('bcommentary').value.trim() + ' ').substring(0,3) != '...') {
prefixandon='';
lastval='';
} else if ((document.getElementById('bcommentary').value.trim() + ' ').substring(0,3) == '...') {
if (waspis.indexOf(lastval.trim()) == -1) {
prefixandon=String.fromCharCode(10) + lastval.trim().replace(/\.\.\.NoWayJosE$/g, ' ' + nl + ('' + (new Date())) + ' ... ') + waspis;
newwaspis=prefixandon;
}
}
if ((' ' + document.getElementById('bcommentary').value.trim()).slice(-3) == '...') {
document.getElementById('ifco').src='//www.rjmprogramming.com.au/ITblog/' + Math.min(550,window.innerWidth) + '/' + Math.min(350,window.innerHeight) + '/?uniquifier=' + encodeURIComponent(document.getElementById('uniquifier').value) + '&canvcont=' + encodeURIComponent(document.getElementById('bcommentary').value.trim().replace(/\.\.\.$/g, ' ' + nl + ('' + (new Date())) + ' ... ' + String.fromCharCode(10) + String.fromCharCode(10) + prefixandon));
} else {
document.getElementById('ifco').src='//www.rjmprogramming.com.au/ITblog/' + Math.min(550,window.innerWidth) + '/' + Math.min(350,window.innerHeight) + '/?uniquifier=' + encodeURIComponent(document.getElementById('uniquifier').value) + '&canvcont=' + encodeURIComponent(document.getElementById('bcommentary').value + String.fromCharCode(10) + String.fromCharCode(10) + prefixandon);
}
document.getElementById('bcommentary').title=document.getElementById('bcommentary').value;
if ((document.getElementById('bcommentary').value.trim() + ' ').substring(0,3) == '...') {
if (newwaspis != '') { waspis=newwaspis; }
if (waspis.indexOf(document.getElementById('bcommentary').value.trim()) == -1) {
prefixandon=String.fromCharCode(10) + document.getElementById('bcommentary').value.trim().replace(/\.\.\.$/g, ' ' + nl + ('' + (new Date())) + ' ... ') + waspis;
}
}
lastval=document.getElementById('bcommentary').value;
document.getElementById('bcommentary').value='';
setTimeout(function(){ document.getElementById('subcc').click(); }, 2000);
}
}
}

function newfunction() {
if (document.getElementById('bshare')) {
document.getElementById('sbshare').innerHTML='<iframe id=ifco style=display:none; src=></iframe><br><br><textarea rows=2 cols=80 id=bcommentary placeholder="Commentary to Viewers can go here ... start with or end with ... for ongoing ..." onblur="askaway(this);" value=""></textarea><br><br>';
}
}

latest draft image_venn.html Google Chart Image Chart Venn Chart or Scatter Chart or GraphViz Chart or Pie Chart or Line Chart or Bar Chart or Candlestick/Box Chart or Google-O-Meter Chart or Radar Chart or Map Chart interfacing web application you can also try below.


Previous relevant Google Chart Image Chart Radar Chart Tutorial is shown below.

Google Chart Image Chart Radar Chart Tutorial

Google Chart Image Chart Radar Chart Tutorial

Onto yesterday’s Google Chart Image Chart Box Chart Tutorial, today we have a two part stepping forward via new …

Why the trepidation? Well, so far, when the text is angled we can’t understand what results we are getting back from a call to [element].getBoundingClientRect() just yet.

Why is this needed? Again, with the questions! Well, Mr De Niro, you see, well, somebody might want to go onto that more complex annotating.

And why would they do that? Sheesh. Well, Mr De Niro, sir, you see, sometimes things happen in life, and well, fingers slip on keyboards, and mice get awfullllly nervous around screens these days.

Yeh, well, show us the money, wiseguy. Who’s is that question? And what’s with the questions? Well, you see, Mr De Niro, the money is if we can get PHP text placement for text at an angle, where it rotates from the middle of the text, to get a similar positioning to good ol’ … pardon, Mr De Niro … good and well respected Javascript transform rotations … not with a triple pike, Mr De Niro, but you’re awfulllllly close, Mr De Niro, sir … rather, we throw in a couple of translations … no, not Latin, Mr De Niro … of co-ordinates, Mr De Niro.

And that will bring in how much by next Tuesday? Back to the questions? Why so many questions? We think it’s a pretty big money spinner, Mr De Niro, sir, and we think you should come back next Tuesday, and we can show you the ropes. Sweat, oozing from the brow, as Mr De Niro exits stage left.

And just while we have a few minutes, here’s the updated Javascript parameterization …


var dtextis='dtext';
var pretherest='';
var newtherest='';
var tmod='';
var colchange='';
var cht=location.search.split('cht=')[1] ? decodeURIComponent(location.search.split('cht=')[1].split('&')[0]) : "v";
if ((cht + ' ').substring(0,1) == 'p' && cht != 'p') { pretherest=cht.substring(1); }
//if ((cht + ' ').substring(0,2) == 'bv' && cht != 'bv') { pretherest=cht.substring(2); if (1 == 1) { cht='bv'; } }
if ((cht + ' ').substring(0,1) == 'bv'.substring(0,1) && cht != 'bv'.substring(0,1)) { pretherest=cht.substring(1); if (1 == 1) { cht='bv'.substring(0,1); } }
if ((cht + ' ').substring(0,1) == 'l' && cht != 'l') { pretherest=cht.substring(1); if (1 == 1) { cht='l'; } }
if ((cht + ' ').substring(0,1) == 'r' && cht != 'r') { pretherest=cht.substring(1); if (1 == 1) { cht='r'; } }
var ccode=location.search.split('chld=')[1] ? decodeURIComponent(location.search.split('chld=')[1].split('&')[0]) : "";
var ctype=location.search.split('type=')[1] ? decodeURIComponent(location.search.split('type=')[1].split('&')[0]) : cht;
var cname=(ctype == 'v' ? 'Venn Chart' : (ctype == 's' ? 'Scatter Chart' : (ctype == 'gv' ? 'GraphViz Chart' :
(ctype.substring(0,1) == 'p' ? 'Pie Chart' :
((ctype + ' ').substring(0,2).substring(0,1) == 'bv'.substring(0,1) ? 'Bar Chart' : (ctype.substring(0,1) == 'l' ? 'Line Chart' :
(ctype == 'map' ? 'Map Chart' :
(ctype == 'gom' ? 'Google-O-Meter Chart' :
(ctype == 'r' ? 'Radar Chart' :
'')))))))));
var cencodename=(ctype == 'v' ? 'Venn%20Diagram' : (ctype == 's' ? 'Scatter%20Chart' : (ctype == 'gv' ? 'GraphViz%20Chart' :
(ctype.substring(0,1) == 'p' ? 'Pie%20Chart' :
((ctype + ' ').substring(0,2).substring(0,1) == 'bv'.substring(0,1) ? 'Bar%20Chart' : (ctype.substring(0,1) == 'l' ? 'Line%20Chart' :
(ctype == 'map' ? 'Map%20Chart' :
(ctype == 'gom' ? 'Google-O-Meter%20Chart' :
(ctype == 'r' ? 'Radar%20Chart' :
'')))))))));
var chdt=(ctype == 'v' ? '&chd=t:' : (ctype == 's' ? '&chd=t:' : (ctype == 'gv' ? '&chl=' :
(ctype.substring(0,1) == 'p' ? pretherest + '&chd=t:' :
((ctype + ' ').substring(0,2).substring(0,1) == 'bv'.substring(0,1) ? '&chd=t:' : (ctype.substring(0,1) == 'l' ? '&chd=t:' :
(ctype == 'map' ? '' :
(ctype == 'gom' ? '&chd=t:' :
(ctype == 'r' ? pretherest + '&chd=t:' :
'')))))))));
var chdeq=(ctype == 'v' ? '&chd=' : (ctype == 's' ? '&chd=' : (ctype == 'gv' ? '&chl=' :
(ctype.substring(0,1) == 'p' ? '&chd=' :
((ctype + ' ').substring(0,2).substring(0,1) == 'bv'.substring(0,1) ? '&chd=' : (ctype.substring(0,1) == 'l' ? '&chd=' :
(ctype == 'map' ? '&chld=' :
(ctype == 'gom' ? '&chld=' :
(ctype == 'r' ? '&chd=' :
'')))))))));
var tc=(ctype == 'v' ? 't:' : (ctype == 's' ? 't:' : (ctype == 'gv' ? '' :
(ctype.substring(0,1) == 'p' ? 't:' :
((ctype + ' ').substring(0,2).substring(0,1) == 'bv'.substring(0,1) ? 't:' : (ctype.substring(0,1) == 'l' ? 't:' :
(ctype == 'map' ? '' :
(ctype == 'gom' ? 't:' :
(ctype == 'r' ? 't:' :
'')))))))));
var chdl=(ctype == 'v' ? '&chdl=' : (ctype == 's' ? '&chdl=' : (ctype == 'gv' ? '' :
(ctype.substring(0,1) == 'p' ? '&chdl=' :
((ctype + ' ').substring(0,2).substring(0,1) == 'bv'.substring(0,1) ? '&chbh=' : (ctype.substring(0,1) == 'l' ? '&chbh=' :
(ctype == 'map' ? '' :
(ctype == 'gom' ? '&chdl=' :
(ctype == 'r' ? '&chxt=x&chxl=' :
'')))))))));

var prenchtt=(ctype == 'v' ? '100,80,60,30,30,30,10' : (ctype == 's' ? '12,87,75,41,23,96,68,71,34,9|98,60,27,34,56,79,58,74,18,76|84,23,69,81,47,94,60,93,64,54' : (ctype == 'gv' ? 'graph{C_0--H_0[type=s];C_0--H_1[type=s];C_0--H_2[type=s];C_0--C_1[type=s];C_1--H_3[type=s];C_1--H_4[type=s];C_1--H_5[type=s]}' :
(ctype.substring(0,1) == 'p' ? '1,2,3,4' :
((ctype + ' ').substring(0,2).substring(0,1) == 'bv'.substring(0,1) ? '5,5,5|10,10,10|15,15,15' : (ctype.substring(0,1) == 'l' ? '5,45,5|10,60,10|15,85,15' :
(ctype == 'map' ? '' :
(ctype == 'gom' ? '20,40,60' :
(ctype == 'r' ? '10,20,30,40,50' :
'')))))))));
var preachtt=(ctype == 'v' ? 'A|B|C' : (ctype == 's' ? 'Cats|Dogs' : (ctype == 'gv' ? '' :
(ctype.substring(0,1) == 'p' ? 'January|February|March|April' :
((ctype + ' ').substring(0,2).substring(0,1) == 'bv'.substring(0,1) ? '15,4,15' : (ctype.substring(0,1) == 'l' ? '15,4,15' :
(ctype == 'map' ? '' :
(ctype == 'gom' ? 'A|B|C' :
(ctype == 'r' ? '0:|1|2|3|4|5|6' :
'')))))))));
var defchco=(ctype == 'v' ? 'ff0000,00ff00,0000ff' : (ctype == 's' ? 'FF0000|0000FF&chxt=x,y' : (ctype == 'gv' ? '' :
(ctype.substring(0,1) == 'p' ? 'ff0000,00ff00,0000ff,ff00ff' :
((ctype + ' ').substring(0,2).substring(0,1) == 'bv'.substring(0,1) ? '4D89F9,C6D9FD,C6FDD9&chxt=x,y' : (ctype.substring(0,1) == 'l' ? '3D89F9.B6D9FD,B6FDD9&chxt=x,y' :
(ctype == 'map' ? '' :
(ctype == 'gom' ? 'ff0000,00ff00,0000ff' :
(ctype == 'r' ? 'FF0000,FF9900,ff0a00,00ffb0,000cff' :
'')))))))));

var prechtt=(ctype == 'v' ? chdt + prenchtt + chdl + preachtt : (ctype == 's' ? chdt + prenchtt + chdl + preachtt + '&chxt=x,y' : (ctype == 'gv' ? chdt + prenchtt :
(ctype.substring(0,1) == 'p' ? chdt + prenchtt + chdl + preachtt :
((ctype + ' ').substring(0,2).substring(0,1) == 'bv'.substring(0,1) ? chdt + prenchtt + chdl + preachtt : (ctype.substring(0,1) == 'l' ? chdt + prenchtt + chdl + preachtt :
(ctype == 'map' ? '' :
(ctype == 'gom' ? chdt + prenchtt + chdl + preachtt :
(ctype == 'r' ? chdt + prenchtt + chdl + preachtt :
'')))))))));
var promptone=(ctype == 'v' ? "Enter delimited values string for Venn Diagram such that ... " + String.fromCharCode(10) + "The first three values specify the sizes of three circles: A, B, & C. For chart with only two circles, specify zero for the third value." + String.fromCharCode(10) + "The fourth value specifies the size of the intersection of A and B." + String.fromCharCode(10) + "The fifth value specifies the size of the intersection of A and C. For a chart with only two circles, do not specify a value here." + String.fromCharCode(10) + "The sixth value specifies the size of the intersection of B and C. For a chart with only two circles, do not specify a value here." + String.fromCharCode(10) + "The seventh value specifies the size of the common intersection of A, B, and C. For a chart with only two circles, do not specify a value here." + String.fromCharCode(10) + String.fromCharCode(10) + "" : (ctype == 's' ? "Enter delimited values string for Scatter Chart" : (ctype == 'gv' ? "Enter delimited values string for GraphViz Chart" :
(ctype.substring(0,1) == 'p' ? "Enter delimited values string for Pie Chart" :
((ctype + ' ').substring(0,2).substring(0,1) == 'bv'.substring(0,1) ? "Enter v for Vertical or h for Horizontal then one of g for Group or s for Stacked or o for Overlapped Bar Chart look then a space and then enter delimited values string for Bar Chart. Here is a Candlestick and horizontal Bar Chart idea eg. hg 1:20,10,15,25,17,30|0,5,10,7,12,6|35,25,45,47,24,46|15,40,30,27,39,54|70,55,63,59,80,6 Here is a vertical Bar Chart and Box Chart idea vs 1:-1,5,10,7,12,-1|-1,25,30,27,24,-1|-1,40,45,47,39,-1|-1,55,63,59,80,-1|-1,30,40,35,30,-1|-1,-1,5,70,90,-1|-1,-1,-1,80,5,-1&chm=F,FF9900,0,1:4,40|H,0CBF0B,0,1:4,1:20|H,000000,4,1:4,1:40|H,0000FF,3,1:4,1:20|o,FF0000,5,-1,7|o,FF0000,6,-1,7 Prefix just the delimited string you enter by 1: to additionally display Candlestick/Box Charts or by 0: to only display Candlestick/Box Chart" :
(ctype.substring(0,1) == 'l' ? "Enter c for Even or s for Sparklines or xy for Just XY Line Chart look then a space and then enter delimited values string for Line Chart. Here is a Candlestick and Line Chart idea eg. c 1:20,10,15,25,17,30|0,5,10,7,12,6|35,25,45,47,24,46|15,40,30,27,39,54|70,55,63,59,80,6 Here is a Line Chart and Box Chart idea s 1:-1,5,10,7,12,-1|-1,25,30,27,24,-1|-1,40,45,47,39,-1|-1,55,63,59,80,-1|-1,30,40,35,30,-1|-1,-1,5,70,90,-1|-1,-1,-1,80,5,-1&chm=F,FF9900,0,1:4,40|H,0CBF0B,0,1:4,1:20|H,000000,4,1:4,1:40|H,0000FF,3,1:4,1:20|o,FF0000,5,-1,7|o,FF0000,6,-1,7 Prefix just the delimited string you enter by 1: to additionally display Candlestick/Box Charts or by 0: to only display Candlestick/Box Chart" :
(ctype == 'map' ? "" :
(ctype == 'gom' ? "Enter delimited values string for Google-O-Meter Chart" :
(ctype == 'r' ? "Enter delimited values string for Radar Chart but prefix with an s for smooth lines" :
"")))))))));
var oneprompt=(ctype == 'v' ? "Enter delimited values string for your Venn Diagram collaborations, optionally, such that ... " + String.fromCharCode(10) + "The first three values specify the sizes of three circles: A, B, & C. For chart with only two circles, specify zero for the third value." + String.fromCharCode(10) + "The fourth value specifies the size of the intersection of A and B." + String.fromCharCode(10) + "The fifth value specifies the size of the intersection of A and C. For a chart with only two circles, do not specify a value here." + String.fromCharCode(10) + "The sixth value specifies the size of the intersection of B and C. For a chart with only two circles, do not specify a value here." + String.fromCharCode(10) + "The seventh value specifies the size of the common intersection of A, B, and C. For a chart with only two circles, do not specify a value here." + String.fromCharCode(10) + String.fromCharCode(10) + "" : (ctype == 's' ? "Enter delimited values string for Scatter Chart" : (ctype == 'gv' ? "Enter delimited values string for GraphViz Chart" :
(ctype.substring(0,1) == 'p' ? "Enter delimited values string for Pie Chart" :
((ctype + ' ').substring(0,2).substring(0,1) == 'bv'.substring(0,1) ? "Enter g for Grouped or s for Stacked or o for Overlapped Bar Chart look then a space and then enter delimited values string for Bar Chart. Here is a Candlestick and Bar Chart idea eg. g 1:20,10,15,25,17,30|0,5,10,7,12,6|35,25,45,47,24,46|15,40,30,27,39,54|70,55,63,59,80,6 Here is a vertical Bar Chart and Box Chart idea vs 1:-1,5,10,7,12,-1|-1,25,30,27,24,-1|-1,40,45,47,39,-1|-1,55,63,59,80,-1|-1,30,40,35,30,-1|-1,-1,5,70,90,-1|-1,-1,-1,80,5,-1&chm=F,FF9900,0,1:4,40|H,0CBF0B,0,1:4,1:20|H,000000,4,1:4,1:40|H,0000FF,3,1:4,1:20|o,FF0000,5,-1,7|o,FF0000,6,-1,7 Prefix just the delimited string you enter by 1: to additionally display Candlestick/Box Charts or by 0: to only display Candlestick/Box Chart" :
(ctype.substring(0,1) == 'l' ? "Enter c for Even or s for Sparklines or xy for Just XY Line Chart look then a space and then enter delimited values string for Line Chart. Here is a Candlestick and Line Chart idea eg. c 1:20,10,15,25,17,30|0,5,10,7,12,6|35,25,45,47,24,46|15,40,30,27,39,54|70,55,63,59,80,6 Here is a Line Chart and Box Chart idea s 1:-1,5,10,7,12,-1|-1,25,30,27,24,-1|-1,40,45,47,39,-1|-1,55,63,59,80,-1|-1,30,40,35,30,-1|-1,-1,5,70,90,-1|-1,-1,-1,80,5,-1&chm=F,FF9900,0,1:4,40|H,0CBF0B,0,1:4,1:20|H,000000,4,1:4,1:40|H,0000FF,3,1:4,1:20|o,FF0000,5,-1,7|o,FF0000,6,-1,7 Prefix just the delimited string you enter by 1: to additionally display Candlestick/Box Charts or by 0: to only display Candlestick/Box Chart" :
(ctype == 'map' ? "" :
(ctype == 'gom' ? "Enter delimited values string for Google-O-Meter Chart" :
(ctype == 'r' ? "Enter delimited values string for Radar Chart but prefix with an s for smooth lines" :
"")))))))));
var asktwo=(ctype == 'v' ? true : (ctype == 's' ? true : (ctype == 'gv' ? false :
(ctype.substring(0,1) == 'p' ? true :
((ctype + ' ').substring(0,2).substring(0,1) == 'bv'.substring(0,1) ? true : (ctype.substring(0,1) == 'l' ? true :
(ctype == 'map' ? false :
(ctype == 'gom' ? true :
(ctype == 'r' ? true :
false)))))))));

var twopb=(ctype.substring(0,1) == 'p' ? 'Any optional legend or title argument snippets? Optionally prefix by 3 for 3d Pie Chart or by c for Concentric Pie Chart. Eg. 3' + chdl + preachtt + '&chtt=My%20' + cencodename + '&chco=' + defchco : 'Any optional legend or title argument snippets? Eg. ' + chdl + preachtt + '&chtt=My%20' + cencodename + '&chco=' + defchco);
var beforeanswer=(ctype.substring(0,1) == 'l' ? 'c ' : ((ctype + ' ').substring(0,2).substring(0,1) == 'bv'.substring(0,1) ? 'vg ' : ''));


var emsmlist='';

… that goes into helping make the changed latest draft image_venn.html Google Chart Image Chart Venn Chart or Scatter Chart or GraphViz Chart or Pie Chart or Line Chart or Bar Chart or Candlestick/Box Chart or Google-O-Meter Chart or Radar Chart or Map Chart interfacing web application you can also try below, have regular sleepovers on cloud nine.

Did you know?

Did you notice the inclusion of CSS styling …

<style>

#fsangle { background-image: url("data:image/svg+xml;utf8,<svg xmlns='http://www.w3.org/2000/svg' width='24' height='24' viewport='0 0 100 100' style='font-family:Verdana;font-size:10px;'><text y='50%'> \00B0</text></svg>"); background-repeat: no-repeat; background-position: center right; }

</style>

? It styles an input type=number textbox where a placeholder is not really an option to explain a textbox’s purpose, and we do dislike set aside labels, these days. It’s also a way to explain the textbox for mobile users who do not get a hovering message to help. It’s also got an internationalization feel to it, using the degree sign emoji ° (ie. &#176; or that \u0080 UTF-16 Encoding style of definition suitable for CSS styling usage) to both associate the units we’d want, as well as that we are asking for an angle. Clockwise or anticlockwise, alas, comes down to user experience!


Previous relevant Google Chart Image Chart Box Chart Tutorial is shown below.

Google Chart Image Chart Box Chart Tutorial

Google Chart Image Chart Box Chart Tutorial

Today we offer new …

… interfacings, onto the progress up to yesterday’s Google Chart Image Chart Colour Tutorial.

As such, it’s probably timely to update you with the parameterization up the top of the Javascript code …


var pretherest='';
var newtherest='';
var tmod='';
var colchange='';
var cht=location.search.split('cht=')[1] ? decodeURIComponent(location.search.split('cht=')[1].split('&')[0]) : "v";
if ((cht + ' ').substring(0,1) == 'p' && cht != 'p') { pretherest=cht.substring(1); }
//if ((cht + ' ').substring(0,2) == 'bv' && cht != 'bv') { pretherest=cht.substring(2); if (1 == 1) { cht='bv'; } }
if ((cht + ' ').substring(0,1) == 'bv'.substring(0,1) && cht != 'bv'.substring(0,1)) { pretherest=cht.substring(1); if (1 == 1) { cht='bv'.substring(0,1); } }
if ((cht + ' ').substring(0,1) == 'l' && cht != 'l') { pretherest=cht.substring(1); if (1 == 1) { cht='l'; } }
var ccode=location.search.split('chld=')[1] ? decodeURIComponent(location.search.split('chld=')[1].split('&')[0]) : "";
var ctype=location.search.split('type=')[1] ? decodeURIComponent(location.search.split('type=')[1].split('&')[0]) : cht;
var cname=(ctype == 'v' ? 'Venn Chart' : (ctype == 's' ? 'Scatter Chart' : (ctype == 'gv' ? 'GraphViz Chart' :
(ctype.substring(0,1) == 'p' ? 'Pie Chart' :
((ctype + ' ').substring(0,2).substring(0,1) == 'bv'.substring(0,1) ? 'Bar Chart' : (ctype.substring(0,1) == 'l' ? 'Line Chart' :
(ctype == 'map' ? 'Map Chart' :
(ctype == 'gom' ? 'Google-O-Meter Chart' :
''))))))));
var cencodename=(ctype == 'v' ? 'Venn%20Diagram' : (ctype == 's' ? 'Scatter%20Chart' : (ctype == 'gv' ? 'GraphViz%20Chart' :
(ctype.substring(0,1) == 'p' ? 'Pie%20Chart' :
((ctype + ' ').substring(0,2).substring(0,1) == 'bv'.substring(0,1) ? 'Bar%20Chart' : (ctype.substring(0,1) == 'l' ? 'Line%20Chart' :
(ctype == 'map' ? 'Map%20Chart' :
(ctype == 'gom' ? 'Google-O-Meter%20Chart' :
''))))))));
var chdt=(ctype == 'v' ? '&chd=t:' : (ctype == 's' ? '&chd=t:' : (ctype == 'gv' ? '&chl=' :
(ctype.substring(0,1) == 'p' ? pretherest + '&chd=t:' :
((ctype + ' ').substring(0,2).substring(0,1) == 'bv'.substring(0,1) ? '&chd=t:' : (ctype.substring(0,1) == 'l' ? '&chd=t:' :
(ctype == 'map' ? '' :
(ctype == 'gom' ? '&chd=t:' :
''))))))));
var chdeq=(ctype == 'v' ? '&chd=' : (ctype == 's' ? '&chd=' : (ctype == 'gv' ? '&chl=' :
(ctype.substring(0,1) == 'p' ? '&chd=' :
((ctype + ' ').substring(0,2).substring(0,1) == 'bv'.substring(0,1) ? '&chd=' : (ctype.substring(0,1) == 'l' ? '&chd=' :
(ctype == 'map' ? '&chld=' :
(ctype == 'gom' ? '&chdl=' :
''))))))));
var tc=(ctype == 'v' ? 't:' : (ctype == 's' ? 't:' : (ctype == 'gv' ? '' :
(ctype.substring(0,1) == 'p' ? 't:' :
((ctype + ' ').substring(0,2).substring(0,1) == 'bv'.substring(0,1) ? 't:' : (ctype.substring(0,1) == 'l' ? 't:' :
(ctype == 'map' ? '' :
(ctype == 'gom' ? 't:' :
''))))))));
var chdl=(ctype == 'v' ? '&chdl=' : (ctype == 's' ? '&chdl=' : (ctype == 'gv' ? '' :
(ctype.substring(0,1) == 'p' ? '&chdl=' :
((ctype + ' ').substring(0,2).substring(0,1) == 'bv'.substring(0,1) ? '&chbh=' : (ctype.substring(0,1) == 'l' ? '&chbh=' :
(ctype == 'map' ? '' :
(ctype == 'gom' ? '&chdl=' :
''))))))));

var prenchtt=(ctype == 'v' ? '100,80,60,30,30,30,10' : (ctype == 's' ? '12,87,75,41,23,96,68,71,34,9|98,60,27,34,56,79,58,74,18,76|84,23,69,81,47,94,60,93,64,54' : (ctype == 'gv' ? 'graph{C_0--H_0[type=s];C_0--H_1[type=s];C_0--H_2[type=s];C_0--C_1[type=s];C_1--H_3[type=s];C_1--H_4[type=s];C_1--H_5[type=s]}' :
(ctype.substring(0,1) == 'p' ? '1,2,3,4' :
((ctype + ' ').substring(0,2).substring(0,1) == 'bv'.substring(0,1) ? '5,5,5|10,10,10|15,15,15' : (ctype.substring(0,1) == 'l' ? '5,45,5|10,60,10|15,85,15' :
(ctype == 'map' ? '' :
(ctype == 'gom' ? '20,40,60' :
''))))))));
var preachtt=(ctype == 'v' ? 'A|B|C' : (ctype == 's' ? 'Cats|Dogs' : (ctype == 'gv' ? '' :
(ctype.substring(0,1) == 'p' ? 'January|February|March|April' :
((ctype + ' ').substring(0,2).substring(0,1) == 'bv'.substring(0,1) ? '15,4,15' : (ctype.substring(0,1) == 'l' ? '15,4,15' :
(ctype == 'map' ? '' :
(ctype == 'gom' ? 'A|B|C' :
''))))))));
var defchco=(ctype == 'v' ? 'ff0000,00ff00,0000ff' : (ctype == 's' ? 'FF0000|0000FF&chxt=x,y' : (ctype == 'gv' ? '' :
(ctype.substring(0,1) == 'p' ? 'ff0000,00ff00,0000ff,ff00ff' :
((ctype + ' ').substring(0,2).substring(0,1) == 'bv'.substring(0,1) ? '4D89F9,C6D9FD,C6FDD9&chxt=x,y' : (ctype.substring(0,1) == 'l' ? '3D89F9.B6D9FD,B6FDD9&chxt=x,y' :
(ctype == 'map' ? '' :
(ctype == 'gom' ? 'ff0000,00ff00,0000ff' :
''))))))));

var prechtt=(ctype == 'v' ? chdt + prenchtt + chdl + preachtt : (ctype == 's' ? chdt + prenchtt + chdl + preachtt + '&chxt=x,y' : (ctype == 'gv' ? chdt + prenchtt :
(ctype.substring(0,1) == 'p' ? chdt + prenchtt + chdl + preachtt :
((ctype + ' ').substring(0,2).substring(0,1) == 'bv'.substring(0,1) ? chdt + prenchtt + chdl + preachtt : (ctype.substring(0,1) == 'l' ? chdt + prenchtt + chdl + preachtt :
(ctype == 'map' ? '' :
(ctype == 'gom' ? chdt + prenchtt + chdl + preachtt :
''))))))));
var promptone=(ctype == 'v' ? "Enter delimited values string for Venn Diagram such that ... " + String.fromCharCode(10) + "The first three values specify the sizes of three circles: A, B, & C. For chart with only two circles, specify zero for the third value." + String.fromCharCode(10) + "The fourth value specifies the size of the intersection of A and B." + String.fromCharCode(10) + "The fifth value specifies the size of the intersection of A and C. For a chart with only two circles, do not specify a value here." + String.fromCharCode(10) + "The sixth value specifies the size of the intersection of B and C. For a chart with only two circles, do not specify a value here." + String.fromCharCode(10) + "The seventh value specifies the size of the common intersection of A, B, and C. For a chart with only two circles, do not specify a value here." + String.fromCharCode(10) + String.fromCharCode(10) + "" : (ctype == 's' ? "Enter delimited values string for Scatter Chart" : (ctype == 'gv' ? "Enter delimited values string for GraphViz Chart" :
(ctype.substring(0,1) == 'p' ? "Enter delimited values string for Pie Chart" :
((ctype + ' ').substring(0,2).substring(0,1) == 'bv'.substring(0,1) ? "Enter v for Vertical or h for Horizontal then one of g for Group or s for Stacked or o for Overlapped Bar Chart look then a space and then enter delimited values string for Bar Chart. Here is a Candlestick and horizontal Bar Chart idea eg. hg 1:20,10,15,25,17,30|0,5,10,7,12,6|35,25,45,47,24,46|15,40,30,27,39,54|70,55,63,59,80,6 Here is a vertical Bar Chart and Box Chart idea vs 1:-1,5,10,7,12,-1|-1,25,30,27,24,-1|-1,40,45,47,39,-1|-1,55,63,59,80,-1|-1,30,40,35,30,-1|-1,-1,5,70,90,-1|-1,-1,-1,80,5,-1&chm=F,FF9900,0,1:4,40|H,0CBF0B,0,1:4,1:20|H,000000,4,1:4,1:40|H,0000FF,3,1:4,1:20|o,FF0000,5,-1,7|o,FF0000,6,-1,7 Prefix just the delimited string you enter by 1: to additionally display Candlestick/Box Charts or by 0: to only display Candlestick/Box Chart" :
(ctype.substring(0,1) == 'l' ? "Enter c for Even or s for Sparklines or xy for Just XY Line Chart look then a space and then enter delimited values string for Line Chart. Here is a Candlestick and Line Chart idea eg. c 1:20,10,15,25,17,30|0,5,10,7,12,6|35,25,45,47,24,46|15,40,30,27,39,54|70,55,63,59,80,6 Here is a Line Chart and Box Chart idea s 1:-1,5,10,7,12,-1|-1,25,30,27,24,-1|-1,40,45,47,39,-1|-1,55,63,59,80,-1|-1,30,40,35,30,-1|-1,-1,5,70,90,-1|-1,-1,-1,80,5,-1&chm=F,FF9900,0,1:4,40|H,0CBF0B,0,1:4,1:20|H,000000,4,1:4,1:40|H,0000FF,3,1:4,1:20|o,FF0000,5,-1,7|o,FF0000,6,-1,7 Prefix just the delimited string you enter by 1: to additionally display Candlestick/Box Charts or by 0: to only display Candlestick/Box Chart" :
(ctype == 'map' ? "" :
(ctype == 'gom' ? "Enter delimited values string for Google-O-Meter Chart" :
""))))))));
var oneprompt=(ctype == 'v' ? "Enter delimited values string for your Venn Diagram collaborations, optionally, such that ... " + String.fromCharCode(10) + "The first three values specify the sizes of three circles: A, B, & C. For chart with only two circles, specify zero for the third value." + String.fromCharCode(10) + "The fourth value specifies the size of the intersection of A and B." + String.fromCharCode(10) + "The fifth value specifies the size of the intersection of A and C. For a chart with only two circles, do not specify a value here." + String.fromCharCode(10) + "The sixth value specifies the size of the intersection of B and C. For a chart with only two circles, do not specify a value here." + String.fromCharCode(10) + "The seventh value specifies the size of the common intersection of A, B, and C. For a chart with only two circles, do not specify a value here." + String.fromCharCode(10) + String.fromCharCode(10) + "" : (ctype == 's' ? "Enter delimited values string for Scatter Chart" : (ctype == 'gv' ? "Enter delimited values string for GraphViz Chart" :
(ctype.substring(0,1) == 'p' ? "Enter delimited values string for Pie Chart" :
((ctype + ' ').substring(0,2).substring(0,1) == 'bv'.substring(0,1) ? "Enter g for Grouped or s for Stacked or o for Overlapped Bar Chart look then a space and then enter delimited values string for Bar Chart. Here is a Candlestick and Bar Chart idea eg. g 1:20,10,15,25,17,30|0,5,10,7,12,6|35,25,45,47,24,46|15,40,30,27,39,54|70,55,63,59,80,6 Here is a vertical Bar Chart and Box Chart idea vs 1:-1,5,10,7,12,-1|-1,25,30,27,24,-1|-1,40,45,47,39,-1|-1,55,63,59,80,-1|-1,30,40,35,30,-1|-1,-1,5,70,90,-1|-1,-1,-1,80,5,-1&chm=F,FF9900,0,1:4,40|H,0CBF0B,0,1:4,1:20|H,000000,4,1:4,1:40|H,0000FF,3,1:4,1:20|o,FF0000,5,-1,7|o,FF0000,6,-1,7 Prefix just the delimited string you enter by 1: to additionally display Candlestick/Box Charts or by 0: to only display Candlestick/Box Chart" :
(ctype.substring(0,1) == 'l' ? "Enter c for Even or s for Sparklines or xy for Just XY Line Chart look then a space and then enter delimited values string for Line Chart. Here is a Candlestick and Line Chart idea eg. c 1:20,10,15,25,17,30|0,5,10,7,12,6|35,25,45,47,24,46|15,40,30,27,39,54|70,55,63,59,80,6 Here is a Line Chart and Box Chart idea s 1:-1,5,10,7,12,-1|-1,25,30,27,24,-1|-1,40,45,47,39,-1|-1,55,63,59,80,-1|-1,30,40,35,30,-1|-1,-1,5,70,90,-1|-1,-1,-1,80,5,-1&chm=F,FF9900,0,1:4,40|H,0CBF0B,0,1:4,1:20|H,000000,4,1:4,1:40|H,0000FF,3,1:4,1:20|o,FF0000,5,-1,7|o,FF0000,6,-1,7 Prefix just the delimited string you enter by 1: to additionally display Candlestick/Box Charts or by 0: to only display Candlestick/Box Chart" :
(ctype == 'map' ? "" :
(ctype == 'gom' ? "Enter delimited values string for Google-O-Meter Chart" :
""))))))));
var asktwo=(ctype == 'v' ? true : (ctype == 's' ? true : (ctype == 'gv' ? false :
(ctype.substring(0,1) == 'p' ? true :
((ctype + ' ').substring(0,2).substring(0,1) == 'bv'.substring(0,1) ? true : (ctype.substring(0,1) == 'l' ? true :
(ctype == 'map' ? false :
(ctype == 'gom' ? true :
false))))))));

var twopb=(ctype.substring(0,1) == 'p' ? 'Any optional legend or title argument snippets? Optionally prefix by 3 for 3d Pie Chart or by c for Concentric Pie Chart. Eg. 3' + chdl + preachtt + '&chtt=My%20' + cencodename + '&chco=' + defchco : 'Any optional legend or title argument snippets? Eg. ' + chdl + preachtt + '&chtt=My%20' + cencodename + '&chco=' + defchco);
var beforeanswer=(ctype.substring(0,1) == 'l' ? 'c ' : ((ctype + ' ').substring(0,2).substring(0,1) == 'bv'.substring(0,1) ? 'vg ' : ''));

var emsmlist='';

… that goes into helping make the changed latest draft image_venn.html Google Chart Image Chart Venn Chart or Scatter Chart or GraphViz Chart or Pie Chart or Line Chart or Bar Chart or Candlestick/Box Chart or Google-O-Meter Chart or Map Chart interfacing web application you can also try below, one of the happiest little vegemites we know.


Previous relevant Google Chart Image Chart Colour Tutorial is shown below.

Google Chart Image Chart Colour Tutorial

Google Chart Image Chart Colour Tutorial

Restricting you creatives to “inhouse annotations” of the “gray variety” might be seen as a bit boooorrrriiiinnnngggg! And so, onto the progress up to yesterday’s Google Chart Image Chart Rubber Banding Tutorial, today we’ve added a …

  • colour picker … way user can define an “inhouse annotations” colour … and while we were at it …
  • as far as text “inhouse annotations” go we’ve added a counterclockwise from the horizon, in degrees, way to define an angle the text should be placed at … and …
  • we’ve stopped closing off the text font size dropdown too early, allowing the user to mix it up with their annotations, and so …

    We now recommend, for those users pushing the boundaries of functionality, to gather all their “inhouse annotations” together before any “graphical canvas annotations” are thought about.

Which begs the question …

Where do you get it?

Well, here, via … dare we say it?! … … via …

Mantissa Madness Monday

Both colour and degree counterclockwise angle became “Mantissa Madness Monday” tragics, a bit like moi, really?

How did we express these two measures?

  • colour can be derived at the 404.php end via mantissae that are 9 or more long where a number of the form rrrgggbbb is numerical and passed across to 404.php in the y co-ordinate mantissa … while … kind of crazily …
  • angle can be a set of zeros in the x co-ordinate mantissa represented by zero characters to the length of the angle from 1 to 359 in front of a pre-existant font size (in px) usage, from last “Mantissa Madness Monday” (us getting away with this because no font size should start with a zero)

Oh! We have such fun around here?! Below is PHP WordPress blog 404.php code …

<?php

// text placement
$black = imagecolorallocatealpha($im, 1, 1, 1, 0);
$blackish = imagecolorallocatealpha($im, 127, 127, 127, 64);
$yis=$csv[1];
$mantissae=explode('.', ('' . $csv[1]));
if (sizeof($mantissae) > 1) {
if (strlen($mantissae[1]) >= 9) {
$black = imagecolorallocatealpha($im, intval(substr($mantissae[1],0,3)), intval(substr(substr($mantissae[1],3),0,3)), intval(substr(substr($mantissae[1],6),0,3)), 0);
$blackish = imagecolorallocatealpha($im, intval(substr($mantissae[1],0,3)), intval(substr(substr($mantissae[1],3),0,3)), intval(substr(substr($mantissae[1],6),0,3)), 64);
}
$yis=$mantissae[0];
}

$za=0;
$xis=$csv[0];

$mantissae=explode('.', ('' . $csv[0]));
if (sizeof($mantissae) > 1) {
if (substr($mantissae[1],0,1) == '0') {
if (str_replace('0','',$mantissae[1]) != '') {
while (substr($mantissae[1],0,1) == '0') {
$za++;
$mantiss=substr($mantissae[1],1);
$mantissae[1]=$mantiss;
}
}
}

$tenpx=$mantissae[1];
$xis=$mantissae[0];
}
try {
if (function_exists('imagettftext')) {
if (explode('' . $csv[0] . ',' . $csv[1] . ',', $plotstring)[1] !== '') {
//echo explode('' . $csv[0] . ',' . $csv[1] . ',', $plotstring)[1];
//exit;
imagettftext($im, $tenpx, $za, $xis, $yis, $black, realpath('arial.ttf'), explode('' . $csv[0] . ',' . $csv[1] . ',', $plotstring)[1]);
}
}
} catch (Exception $e) { }

?>

… used by our changed latest draft image_venn.html Google Chart Image Chart Venn Chart or Scatter Chart or GraphViz Chart or Pie Chart or Line Chart or Bar Chart or Candlestick Chart or Map Chart interfacing web application you can also try below.


Previous relevant Google Chart Image Chart Rubber Banding Tutorial is shown below.

Google Chart Image Chart Rubber Banding Tutorial

Google Chart Image Chart Rubber Banding Tutorial

The Javascript clientside idea of “Rubber Banding”

Rubber banding is a popular technique of drawing geometric primitives such as line, polylines, rectangle, circle and ellipse on the computer screen.

… really appeals to our “inner programmer” … damn! … come, thou, out into the open, reveal thyself! … the sunshine is wonderful down here, and we’ve done away with death duties! … mostly! but it is …

  • only really a non-mobile prospect …

    function checkforaction(rubberbanding,nx,ny) {
    var bcbit='background-color:rgba(127,127,127,0.5);';
    var zeroes='';
    var classbit='';
    var brbit='';
    var ourdist=0;
    var ioff=(rubberbanding == true ? 1 : 0);
    var mone=1;

    curno=eval('' + xneeds.length);
    if (eval(ioff + curno) >= needtohave) {
    if (!rubberbanding) {
    document.getElementById('fauxdtext').innerHTML='';
    }
    if (curmode == 8) {
    zeroes='00000000';
    classbit=' class="crerect" ';
    } else if (curmode == -5) {
    //alert(1);
    bcbit='border:2px solid rgba(127,127,127,0.5);';
    if (rubberbanding) {
    ourdist=eval(2.0 * Math.sqrt((nx - xneeds[0]) * (nx - xneeds[0]) + (ny - yneeds[0]) * (ny - yneeds[0])));
    ourdist-=10;
    bcbit='border:2px solid gray;background-color:transparent;';
    } else {
    ourdist=eval(2.0 * Math.sqrt((xneeds[1] - xneeds[0]) * (xneeds[1] - xneeds[0]) + (yneeds[1] - yneeds[0]) * (yneeds[1] - yneeds[0])));
    }
    //alert(ourdist);
    //xneeds[1]=Math.floor('' + ourdist);
    //yneeds[1]=xneeds[1];
    brbit='border-radius:' + Math.floor(eval(ourdist / 2)) + 'px;';
    zeroes='00000';
    classbit=' class="ocirc" ';
    //alert('open circle');
    } else if (curmode == 6) {
    if (rubberbanding) {
    ourdist=eval(2.0 * Math.sqrt((nx - xneeds[0]) * (nx - xneeds[0]) + (ny - yneeds[0]) * (ny - yneeds[0])));
    ourdist-=10;
    } else {
    ourdist=eval(2.0 * Math.sqrt((xneeds[1] - xneeds[0]) * (xneeds[1] - xneeds[0]) + (yneeds[1] - yneeds[0]) * (yneeds[1] - yneeds[0])));
    }
    //xneeds[1]=Math.floor('' + ourdist);
    //yneeds[1]=xneeds[1];
    brbit='border-radius:' + Math.floor(eval(ourdist / 2)) + 'px;';
    //bcbit='border:2px solid rgba(127,127,127,0.5);';
    zeroes='000000';
    classbit=' class="ccirc" ';
    //alert('closed circle ' + bcbit);
    } else if (curmode == -4) {
    if (rubberbanding) {
    mone=0.90;
    bcbit='border:2px solid gray;background-color:transparent;';
    } else {
    bcbit='border:2px solid rgba(127,127,127,0.5);';
    }
    zeroes='00';
    classbit=' class="orect" ';
    } else if (curmode == 2) {
    zeroes='0';
    if (rubberbanding) {
    if (Math.min(xneeds[0],nx) == xneeds[0] && Math.min(yneeds[0],ny) == ny) { // thanks to https://stackoverflow.com/questions/18012420/draw-diagonal-lines-in-div-background-with-css
    classbit=' class="crossedtotl" ';
    } else if (Math.min(xneeds[0],nx) == nx && Math.min(yneeds[0],ny) == yneeds[0]) { // thanks to https://stackoverflow.com/questions/18012420/draw-diagonal-lines-in-div-background-with-css
    classbit=' class="crossedtotl" ';
    } else {
    classbit=' class="crossedtotr" ';
    }
    } else {
    if (Math.min(xneeds[0],xneeds[1]) == xneeds[0] && Math.min(yneeds[0],yneeds[1]) == yneeds[1]) { // thanks to https://stackoverflow.com/questions/18012420/draw-diagonal-lines-in-div-background-with-css
    classbit=' class="crossedtotl" ';
    } else if (Math.min(xneeds[0],xneeds[1]) == xneeds[1] && Math.min(yneeds[0],yneeds[1]) == yneeds[0]) { // thanks to https://stackoverflow.com/questions/18012420/draw-diagonal-lines-in-div-background-with-css
    classbit=' class="crossedtotl" ';
    } else {
    classbit=' class="crossedtotr" ';
    }
    }
    bcbit='';
    } else if (curmode == 4) {
    if (rubberbanding) {
    mone=0.90;
    }
    zeroes='0000';
    classbit=' class="crect" ';
    }
    if (!rubberbanding) {
    curno=-1;
    //if (brbit != '') {
    //document.getElementById('dtext').innerHTML+='<div' + classbit + ' style="' + brbit + 'position:absolute;left:' + Math.min(xneeds[0],nx) + 'px;top:' + Math.min(yneeds[0],ny) + 'px;width:' + Math.abs(xneeds[0] - nx) + 'px;height:' + Math.abs(yneeds[0] - ny) + 'px;z-index:98;' + bcbit + '"></div>';
    //} else {
    //document.getElementById('dtext').innerHTML+='<div' + classbit + ' style="' + brbit + 'position:absolute;left:' + Math.min(xneeds[0],xneeds[1]) + 'px;top:' + Math.min(yneeds[0],yneeds[1]) + 'px;width:' + Math.abs(xneeds[0] - xneeds[1]) + 'px;height:' + Math.abs(yneeds[0] - yneeds[1]) + 'px;z-index:98;' + bcbit + '"></div>';
    //}
    document.getElementById('aemail').href+='&text' + textnum + '=' + encodeURIComponent('' + xneeds[0] + '.' + zeroes + xneeds[1] + ',' + yneeds[0] + '.' + yneeds[1] + ',') + '';
    document.getElementById('asms').href+='&text' + textnum + '=' + encodeURIComponent('' + xneeds[0] + '.' + zeroes + xneeds[1] + ',' + yneeds[0] + '.' + yneeds[1] + ',') + '';
    aemailurl+='&text' + textnum + '=' + encodeURIComponent('' + xneeds[0] + '.' + zeroes + xneeds[1] + ',' + yneeds[0] + '.' + yneeds[1] + ',') + '';
    asmsurl+='&text' + textnum + '=' + encodeURIComponent('' + xneeds[0] + '.' + zeroes + xneeds[1] + ',' + yneeds[0] + '.' + yneeds[1] + ',') + '';
    arest+='&text' + textnum + '=' + encodeURIComponent('' + xneeds[0] + '.' + zeroes + xneeds[1] + ',' + yneeds[0] + '.' + yneeds[1] + ',') + '';
    }
    if (brbit != '') {
    //alert('brbit=' + brbit);
    //xneeds[0]-=(xneeds[1] - xneeds[0]);
    //yneeds[0]-=(yneeds[1] - yneeds[0]);
    //alert('xneeds[0]=' + xneeds[0]);
    if (rubberbanding) {
    document.getElementById('fauxdtext').innerHTML='<div' + classbit + ' style="' + brbit + 'z-index:-89;position:absolute;left:' + Math.floor(eval(Math.min(xneeds[0],xneeds[0]) - ourdist / 2)) + 'px;top:' + Math.floor(eval(Math.min(yneeds[0],yneeds[0]) - ourdist / 2)) + 'px;width:' + ourdist + 'px;height:' + ourdist + 'px;z-index:98;' + bcbit + '"></div>';
    } else {
    document.getElementById('dtext').innerHTML+='<div' + classbit + ' style="' + brbit + 'position:absolute;left:' + Math.floor(eval(Math.min(xneeds[0],xneeds[0]) - ourdist / 2)) + 'px;top:' + Math.floor(eval(Math.min(yneeds[0],yneeds[0]) - ourdist / 2)) + 'px;width:' + ourdist + 'px;height:' + ourdist + 'px;z-index:98;' + bcbit + '"></div>';
    }
    } else {
    if (rubberbanding) {
    document.getElementById('fauxdtext').innerHTML='<div' + classbit + ' style="' + brbit + 'z-index:-89;position:absolute;left:' + Math.min(xneeds[0],nx) + 'px;top:' + Math.min(yneeds[0],ny) + 'px;width:' + Math.max(Math.floor(eval(-30 + Math.abs(xneeds[0] - nx))),Math.floor(eval(mone * Math.abs(xneeds[0] - nx)))) + 'px;height:' + Math.max(Math.floor(eval(-30 + Math.abs(yneeds[0] - ny))),Math.floor(eval(mone * Math.abs(yneeds[0] - ny)))) + 'px;z-index:98;' + bcbit + '"></div>';
    } else {
    document.getElementById('dtext').innerHTML+='<div' + classbit + ' style="' + brbit + 'position:absolute;left:' + Math.min(xneeds[0],xneeds[1]) + 'px;top:' + Math.min(yneeds[0],yneeds[1]) + 'px;width:' + Math.abs(xneeds[0] - xneeds[1]) + 'px;height:' + Math.abs(yneeds[0] - yneeds[1]) + 'px;z-index:98;' + bcbit + '"></div>';
    }
    }
    if (!rubberbanding) {
    textnum++;
    xneeds=[];
    yneeds=[];
    //alert('arest=' + arest);
    document.getElementById('tdright').innerHTML="  <span id=spemail><a target=_blank href='mailto:?subject=My%20" + cencodename + "%20...%20best%20viewed%20in%20landscape%20...&body=" + encodeURIComponent((document.getElementById('myvenn').src + arest).replace((document.getElementById('myvenn').src + arest).split('?')[0].split('#')[0], document.URL.split('?')[0].split('#')[0])) + "' id=aemail title=Email>&#128231;</a></span>      <span id=spsms><a target=_blank onmouseover=\"if (smsee.length == 0 && origsmsurl.indexOf('sms:&') != -1) { smsee=prompt('Please enter SMS number to send to.', ''); if (smsee == null) { smsee=''; } else { origsmsurl=origsmsurl.replace('sms:&','sms:' + smsee + '&'); asmsurl=asmsurl.replace('sms:&','sms:' + smsee + '&'); this.href=asmsurl; } }\" ontouchstart=\"if (smsee.length == 0 && origsmsurl.indexOf('sms:&') != -1) { smsee=prompt('Please enter SMS number to send to.', ''); if (smsee == null) { smsee=''; } else { origsmsurl=origsmsurl.replace('sms:&','sms:' + smsee + '&'); asmsurl=asmsurl.replace('sms:&','sms:' + smsee + '&'); this.href=asmsurl; } }\" href='sms:&body=" + encodeURIComponent((document.getElementById('myvenn').src + arest).replace(document.getElementById('myvenn').src.split('?')[0].split('#')[0], document.URL.split('?')[0].split('#')[0])) + "' id=asms title=SMS>&#128223;</a></span><br><br>  <input title=\"\" onclick=\"event.stopPropagation();\" id=ilp onblur=\"waitfortwo(0); lasttext=this.value.replace(/\~\~/g, '<br>'); this.title=lasttext; if (!navigator.userAgent.match(/Android|BlackBerry|iPhone|iPad|iPod|Opera Mini|IEMobile/i)) { this.value=''; } this.placeholder='Click where you want ... ' + lasttext.replace(/\<br\>/g, String.fromCharCode(10)); mvp.setAttribute('content','initial-scale=1'); document.getElementById('myvenn').scrollIntoView();\" placeholder='Enter text and later click place for it on " + decodeURIComponent(cencodename) + " to left (line feed is ~~)' type=text style=width:500px; value=''></input>" + fszbit + "<br><br>  <img id=line src='/MarkItUp/line.png' onclick=\"event.stopPropagation(); this.style.border='1px dotted red'; waitfortwo(2);\"></img>  <img id=rectangle src='/MarkItUp/rectangle.png' onclick=\"event.stopPropagation(); this.style.border='1px dotted red'; waitfortwo(4);\"></img>  <img id=orectangle src='/MarkItUp/orectangle.png' onclick=\"event.stopPropagation(); this.style.border='1px dotted red'; waitfortwo(-4);\"></img>  <img id=circle src='/MarkItUp/circlefill.png' onclick=\"event.stopPropagation(); this.style.border='1px dotted red'; waitfortwo(6);\"></img>  <img id=ocircle src='/MarkItUp/circle.png' onclick=\"event.stopPropagation(); this.style.border='1px dotted red'; waitfortwo(-5);\"></img>  <button id=orerect onclick=\"event.stopPropagation(); this.style.border='1px dotted red'; waitfortwo(8);\" title=\"Zoom in on rectangle you define via two clicks\" style=display:none;>&#128270;</button>" + lastbit + atend;
    //alert(1);
    if (!navigator.userAgent.match(/Android|BlackBerry|iPhone|iPad|iPod|Opera Mini|IEMobile/i)) { document.getElementById('ilp').focus(); }
    document.getElementById('ilp').placeholder='Enter text and later click place for it on ' + decodeURIComponent(cencodename) + ' to left (line feed is ~~)';
    }
    } else if (curmode == 2 && !rubberbanding) {
    document.getElementById('line').style.border='1px dashed yellow';
    } else if (curmode == -4 && !rubberbanding) {
    document.getElementById('orectangle').style.border='1px dashed yellow';
    } else if (curmode == 4 && !rubberbanding) {
    document.getElementById('rectangle').style.border='1px dashed yellow';
    } else if (curmode == -5 && !rubberbanding) {
    document.getElementById('ocircle').style.border='1px dashed yellow';
    } else if (curmode == 6 && !rubberbanding) {
    document.getElementById('circle').style.border='1px dashed yellow';
    } else if (curmode == 8 && !rubberbanding) {
    document.getElementById('orerect').style.border='1px dashed yellow';
    }
    }

    // Rubber banding
    document.body.addEventListener('mousemove', function(evt){
    evt = evt || window.event;

    evt.preventDefault();

    elemLeft = document.getElementById('myvenn').offsetLeft;
    elemTop = document.getElementById('myvenn').offsetTop;

    //document.getElementById('myh3').innerHTML+=' ' + elemLeft + ':' + elemTop;
    //document.getElementById('myh3').innerHTML+=' ' + document.body.scrollLeft + '.' + document.body.scrollTop;

    if (evt.touches) {
    if (evt.touches[0].pageX) {
    //alert('here');
    xx = evt.touches[0].pageX + document.body.scrollLeft - elemLeft;
    yy = evt.touches[0].pageY + document.body.scrollTop - elemTop;
    if (xx >= 0 && xx <= eval(('' + document.getElementById('myvenn').width).replace('px','')) && yy >= 0 && yy <= eval(('' + document.getElementById('myvenn').height).replace('px',''))) {
    if (curno == 1 && (lastx != xx || lasty != yy)) {
    checkforaction(true,xx,yy);
    }
    //lastx=xx;
    //lasty=yy;
    //alert('x:' + x + ' and y:' + y);
    }
    } else {
    //alert('Here');
    xx = evt.touches[0].clientX + document.body.scrollLeft - elemLeft;
    yy = evt.touches[0].clientY + document.body.scrollTop - elemTop;
    if (xx >= 0 && xx <= eval(('' + document.getElementById('myvenn').width).replace('px','')) && yy >= 0 && yy <= eval(('' + document.getElementById('myvenn').height).replace('px',''))) {
    if (curno == 1 && (lastx != xx || lasty != yy)) {
    checkforaction(true,xx,yy);
    }
    //lastx=xx;
    //lasty=yy;
    //alert('x:' + x + ' and y:' + y);
    }
    }
    } else if (evt.clientX || ev.clientY) {
    //alert('HERE');
    xx = evt.clientX + document.body.scrollLeft - elemLeft;
    yy = evt.clientY + document.body.scrollTop - elemTop;
    if (xx >= 0 && xx <= eval(('' + document.getElementById('myvenn').width).replace('px','')) && yy >= 0 && yy <= eval(('' + document.getElementById('myvenn').height).replace('px',''))) {
    if (curno == 1 && (lastx != xx || lasty != yy)) {
    checkforaction(true,xx,yy);
    }
    //lastx=xx;
    //lasty=yy;
    }
    } else {
    //alert('HEre');
    xx = evt.pageX + document.body.scrollLeft - elemLeft;
    yy = evt.pageY + document.body.scrollTop - elemTop;
    if (xx >= 0 && xx <= eval(('' + document.getElementById('myvenn').width).replace('px','')) && yy >= 0 && yy <= eval(('' + document.getElementById('myvenn').height).replace('px',''))) {
    if (curno == 1 && (lastx != xx || lasty != yy)) {
    checkforaction(true,xx,yy);
    }
    //lastx=xx;
    //lasty=yy;
    }
    }
    });

    … at least for us (being as we do not want to clobber any pinch or spread gesture ideas, for the user)
  • is only a really, “nice to have” functionality idea

Even so, achieving even a 95% percent working “rubber band” is like … is like …

Barracking for Hairtie United …
You little beauty, Untied!

And so, further to yesterday’s Google Chart Image Chart Circle Annotation Tutorial we have this non-mobile “Rubber Banding” inhouse annotation functionality included in our changed latest draft image_venn.html Google Chart Image Chart Venn Chart or Scatter Chart or GraphViz Chart or Pie Chart or Line Chart or Bar Chart or Candlestick Chart or Map Chart interfacing web application you can also try below.

But there’s more! Despite how long out of the day it takes to barrack for Hairtie United, there was a mobile matter we resolved. A slide in today’s animated GIF presentation shows the issue. On mobile platforms, with these inhouse annotations, it would immediately show a tiny annotation. There panned out to be two event programming related issues we needed to fix related to this problem …

  1. change looking for a “touchstart” event, and instead look for a “touchdown” event for a document.body scope (else we might have restricted the “scope” to just document.getEleementById(‘myvenn’) as another approach (and you should note our event.stopPropagation() statements in lots of places as another research point for you)) because we are talking “discrete click” user behaviour we are targeting … as well as …
  2. start checking that the co-ordinates calculated fall into the range of the Google Charts Image Chart image dimensions … doh!


document.body.addEventListener('touchdown', function(evt){
//alert(8);
evt = evt || window.event;

evt.preventDefault();

elemLeft = document.getElementById('myvenn').offsetLeft;
elemTop = document.getElementById('myvenn').offsetTop;

//document.getElementById('myh3').innerHTML+=' ' + elemLeft + ';' + elemTop;

if (evt.touches) {
if (evt.touches[0].pageX) {
//alert('here');
x = evt.touches[0].pageX + document.body.scrollLeft - elemLeft;
y = evt.touches[0].pageY + document.body.scrollTop - elemTop;
if (x >= 0 && x <= eval(('' + document.getElementById('myvenn').width).replace('px','')) && y >= 0 && y <= eval(('' + document.getElementById('myvenn').height).replace('px',''))) {
if (curno >= 0 && (lastx != x || lasty != y)) {
xneeds.push(x);
yneeds.push(y);
checkforaction(false,-1,-1);
}
lastx=x;
lasty=y;
}
//alert('x:' + x + ' and y:' + y);
} else {
//alert('Here');
x = evt.touches[0].clientX + document.body.scrollLeft - elemLeft;
y = evt.touches[0].clientY + document.body.scrollTop - elemTop;
if (x >= 0 && x <= eval(('' + document.getElementById('myvenn').width).replace('px','')) && y >= 0 && y <= eval(('' + document.getElementById('myvenn').height).replace('px',''))) {
if (curno >= 0 && (lastx != x || lasty != y)) {
xneeds.push(x);
yneeds.push(y);
checkforaction(false,-1,-1);
}
lastx=x;
lasty=y;
}
//alert('x:' + x + ' and y:' + y);
}
} else if (evt.clientX || ev.clientY) {
//alert('HERE');
x = evt.clientX + document.body.scrollLeft - elemLeft;
y = evt.clientY + document.body.scrollTop - elemTop;
if (x >= 0 && x <= eval(('' + document.getElementById('myvenn').width).replace('px','')) && y >= 0 && y <= eval(('' + document.getElementById('myvenn').height).replace('px',''))) {
if (curno >= 0 && (lastx != x || lasty != y)) {
xneeds.push(x);
yneeds.push(y);
checkforaction(false,-1,-1);
}
lastx=x;
lasty=y;
}
} else {
//alert('HEre');
x = evt.pageX + document.body.scrollLeft - elemLeft;
y = evt.pageY + document.body.scrollTop - elemTop;
if (x >= 0 && x <= eval(('' + document.getElementById('myvenn').width).replace('px','')) && y >= 0 && y <= eval(('' + document.getElementById('myvenn').height).replace('px',''))) {
if (curno >= 0 && (lastx != x || lasty != y)) {
xneeds.push(x);
yneeds.push(y);
checkforaction(false,-1,-1);
}
lastx=x;
lasty=y;
}
}
});

Did you know?

Well … we didn’t?! We happened to try the web application above on a tiny iPad and saw that HTML button elements with an innerHTML label containing a line feed ( ie. <br> ) only showed the top line, and, alas, for that button in question, the vital new information used to be on the second line. Hence our fix …


//document.getElementById('bshare').innerHTML='Repainting Top Left Image Periodically ... <br>Click here to Broadcast this session to other interested parties ...';
document.getElementById('bshare').innerHTML='Click here to Broadcast this session to other interested parties ...<br>Repainting Top Left Image Periodically ...';


Previous relevant Google Chart Image Chart Circle Annotation Tutorial is shown below.

Google Chart Image Chart Circle Annotation Tutorial

Google Chart Image Chart Circle Annotation Tutorial

Today, we add …

  • open circle
  • filled circle

… annotation possibilities onto the “Broadcast Talk” work in yesterday’s Google Chart Image Chart Broadcast Talk Context Tutorial.

The CSS border-radius property has come to the rescue of many a programmer, saving us from resorting to SVG to display circle or ellipses or arcs of various sorts …


function checkforaction() {
var bcbit='background-color:rgba(127,127,127,0.5);';
var zeroes='';
var classbit='';
var brbit='';
var ourdist=0;


curno=eval('' + xneeds.length);
if (curno >= needtohave) {
if (curmode == 8) {
zeroes='00000000';
classbit=' class="crerect" ';
} else if (curmode == -5) {
//alert(1);
ourdist=eval(2.0 * Math.sqrt((xneeds[1] - xneeds[0]) * (xneeds[1] - xneeds[0]) + (yneeds[1] - yneeds[0]) * (yneeds[1] - yneeds[0])));
//alert(ourdist);
//xneeds[1]=Math.floor('' + ourdist);
//yneeds[1]=xneeds[1];
brbit='border-radius:' + Math.floor(eval(ourdist / 2)) + 'px;';
bcbit='border:2px solid rgba(127,127,127,0.5);';
zeroes='00000';
classbit=' class="ocirc" ';
//alert('open circle');
} else if (curmode == 6) {
ourdist=eval(2.0 * Math.sqrt((xneeds[1] - xneeds[0]) * (xneeds[1] - xneeds[0]) + (yneeds[1] - yneeds[0]) * (yneeds[1] - yneeds[0])));
//xneeds[1]=Math.floor('' + ourdist);
//yneeds[1]=xneeds[1];
brbit='border-radius:' + Math.floor(eval(ourdist / 2)) + 'px;';
//bcbit='border:2px solid rgba(127,127,127,0.5);';
zeroes='000000';
classbit=' class="ccirc" ';
//alert('closed circle ' + bcbit);
}
else if (curmode == -4) {
bcbit='border:2px solid rgba(127,127,127,0.5);';
zeroes='00';
classbit=' class="orect" ';
} else if (curmode == 2) {
zeroes='0';
if (Math.min(xneeds[0],xneeds[1]) == xneeds[0] && Math.min(yneeds[0],yneeds[1]) == yneeds[1]) { // thanks to https://stackoverflow.com/questions/18012420/draw-diagonal-lines-in-div-background-with-css
classbit=' class="crossedtotl" ';
} else if (Math.min(xneeds[0],xneeds[1]) == xneeds[1] && Math.min(yneeds[0],yneeds[1]) == yneeds[0]) { // thanks to https://stackoverflow.com/questions/18012420/draw-diagonal-lines-in-div-background-with-css
classbit=' class="crossedtotl" ';
} else {
classbit=' class="crossedtotr" ';
}
bcbit='';
} else if (curmode == 4) {
zeroes='0000';
classbit=' class="crect" ';
}
curno=-1;
//if (brbit != '') {
//document.getElementById('dtext').innerHTML+='<div' + classbit + ' style="' + brbit + 'position:absolute;left:' + Math.min(xneeds[0],xneeds[1]) + 'px;top:' + Math.min(yneeds[0],yneeds[1]) + 'px;width:' + Math.abs(xneeds[0] - xneeds[1]) + 'px;height:' + Math.abs(yneeds[0] - yneeds[1]) + 'px;z-index:98;' + bcbit + '"></div>';
//} else {
//document.getElementById('dtext').innerHTML+='<div' + classbit + ' style="' + brbit + 'position:absolute;left:' + Math.min(xneeds[0],xneeds[1]) + 'px;top:' + Math.min(yneeds[0],yneeds[1]) + 'px;width:' + Math.abs(xneeds[0] - xneeds[1]) + 'px;height:' + Math.abs(yneeds[0] - yneeds[1]) + 'px;z-index:98;' + bcbit + '"></div>';
//}
document.getElementById('aemail').href+='&text' + textnum + '=' + encodeURIComponent('' + xneeds[0] + '.' + zeroes + xneeds[1] + ',' + yneeds[0] + '.' + yneeds[1] + ',') + '';
document.getElementById('asms').href+='&text' + textnum + '=' + encodeURIComponent('' + xneeds[0] + '.' + zeroes + xneeds[1] + ',' + yneeds[0] + '.' + yneeds[1] + ',') + '';
aemailurl+='&text' + textnum + '=' + encodeURIComponent('' + xneeds[0] + '.' + zeroes + xneeds[1] + ',' + yneeds[0] + '.' + yneeds[1] + ',') + '';
asmsurl+='&text' + textnum + '=' + encodeURIComponent('' + xneeds[0] + '.' + zeroes + xneeds[1] + ',' + yneeds[0] + '.' + yneeds[1] + ',') + '';
arest+='&text' + textnum + '=' + encodeURIComponent('' + xneeds[0] + '.' + zeroes + xneeds[1] + ',' + yneeds[0] + '.' + yneeds[1] + ',') + '';
if (brbit != '') {
//alert('brbit=' + brbit);
//xneeds[0]-=(xneeds[1] - xneeds[0]);
//yneeds[0]-=(yneeds[1] - yneeds[0]);
//alert('xneeds[0]=' + xneeds[0]);
document.getElementById('dtext').innerHTML+='<div' + classbit + ' style="' + brbit + 'position:absolute;left:' + Math.floor(eval(Math.min(xneeds[0],xneeds[0]) - ourdist / 2)) + 'px;top:' + Math.floor(eval(Math.min(yneeds[0],yneeds[0]) - ourdist / 2)) + 'px;width:' + ourdist + 'px;height:' + ourdist + 'px;z-index:98;' + bcbit + '"></div>';
} else {

document.getElementById('dtext').innerHTML+='<div' + classbit + ' style="' + brbit + 'position:absolute;left:' + Math.min(xneeds[0],xneeds[1]) + 'px;top:' + Math.min(yneeds[0],yneeds[1]) + 'px;width:' + Math.abs(xneeds[0] - xneeds[1]) + 'px;height:' + Math.abs(yneeds[0] - yneeds[1]) + 'px;z-index:98;' + bcbit + '"></div>';
}
textnum++;
xneeds=[];
yneeds=[];
//alert('arest=' + arest);
document.getElementById('tdright').innerHTML="  <span id=spemail><a target=_blank href='mailto:?subject=My%20" + cencodename + "%20...%20best%20viewed%20in%20landscape%20...&body=" + encodeURIComponent((document.getElementById('myvenn').src + arest).replace((document.getElementById('myvenn').src + arest).split('?')[0].split('#')[0], document.URL.split('?')[0].split('#')[0])) + "' id=aemail title=Email>&#128231;</a></span>      <span id=spsms><a target=_blank onmouseover=\"if (smsee.length == 0 && origsmsurl.indexOf('sms:&') != -1) { smsee=prompt('Please enter SMS number to send to.', ''); if (smsee == null) { smsee=''; } else { origsmsurl=origsmsurl.replace('sms:&','sms:' + smsee + '&'); asmsurl=asmsurl.replace('sms:&','sms:' + smsee + '&'); this.href=asmsurl; } }\" ontouchstart=\"if (smsee.length == 0 && origsmsurl.indexOf('sms:&') != -1) { smsee=prompt('Please enter SMS number to send to.', ''); if (smsee == null) { smsee=''; } else { origsmsurl=origsmsurl.replace('sms:&','sms:' + smsee + '&'); asmsurl=asmsurl.replace('sms:&','sms:' + smsee + '&'); this.href=asmsurl; } }\" href='sms:&body=" + encodeURIComponent((document.getElementById('myvenn').src + arest).replace(document.getElementById('myvenn').src.split('?')[0].split('#')[0], document.URL.split('?')[0].split('#')[0])) + "' id=asms title=SMS>&#128223;</a></span><br><br>  <input title=\"\" onclick=\"event.stopPropagation();\" id=ilp onblur=\"waitfortwo(0); lasttext=this.value.replace(/\~\~/g, '<br>'); this.title=lasttext; if (!navigator.userAgent.match(/Android|BlackBerry|iPhone|iPad|iPod|Opera Mini|IEMobile/i)) { this.value=''; } this.placeholder='Click where you want ... ' + lasttext.replace(/\<br\>/g, String.fromCharCode(10)); mvp.setAttribute('content','initial-scale=1'); document.getElementById('myvenn').scrollIntoView();\" placeholder='Enter text and later click place for it on " + decodeURIComponent(cencodename) + " to left (line feed is ~~)' type=text style=width:500px; value=''></input>" + fszbit + "<br><br>  <img id=line src='/MarkItUp/line.png' onclick=\"event.stopPropagation(); this.style.border='1px dotted red'; waitfortwo(2);\"></img>  <img id=rectangle src='/MarkItUp/rectangle.png' onclick=\"event.stopPropagation(); this.style.border='1px dotted red'; waitfortwo(4);\"></img>  <img id=orectangle src='/MarkItUp/orectangle.png' onclick=\"event.stopPropagation(); this.style.border='1px dotted red'; waitfortwo(-4);\"></img>  <img id=circle src='/MarkItUp/circlefill.png' onclick=\"event.stopPropagation(); this.style.border='1px dotted red'; waitfortwo(6);\"></img>  <img id=ocircle src='/MarkItUp/circle.png' onclick=\"event.stopPropagation(); this.style.border='1px dotted red'; waitfortwo(-5);\"></img>  <button id=orerect onclick=\"event.stopPropagation(); this.style.border='1px dotted red'; waitfortwo(8);\" title=\"Zoom in on rectangle you define via two clicks\" style=display:none;>&#128270;</button>" + lastbit + atend;
//alert(1);
if (!navigator.userAgent.match(/Android|BlackBerry|iPhone|iPad|iPod|Opera Mini|IEMobile/i)) { document.getElementById('ilp').focus(); }
document.getElementById('ilp').placeholder='Enter text and later click place for it on ' + decodeURIComponent(cencodename) + ' to left (line feed is ~~)';
} else if (curmode == 2) {
document.getElementById('line').style.border='1px dashed yellow';
} else if (curmode == -4) {
document.getElementById('orectangle').style.border='1px dashed yellow';
} else if (curmode == 4) {
document.getElementById('rectangle').style.border='1px dashed yellow';
} else if (curmode == -5) {
document.getElementById('ocircle').style.border='1px dashed yellow';
} else if (curmode == 6) {
document.getElementById('circle').style.border='1px dashed yellow';
} else if (curmode == 8) {
document.getElementById('orerect').style.border='1px dashed yellow';
}
}

… to team up with WordPress blog 404.php changes …

<?php

if (strlen($zeroesbit) == 6) { // filled in circle
if (sizeof($csv) == 3) {
array_push($csv, $csv[2]);
} else if (sizeof($csv) >= 4) {
$dist=(2.0 * sqrt(($csv[0] - $csv[2]) * ($csv[0] - $csv[2]) + ($csv[1] - $csv[3]) * ($csv[1] - $csv[3])));
$csv[2]=$dist;
$csv[3]=$dist;
}
imagefilledellipse($im, $csv[0], $csv[1], $csv[2], $csv[3], $blackish);
} else if (strlen($zeroesbit) == 5) { // circle
if (sizeof($csv) == 3) {
array_push($csv, $csv[2]);
} else if (sizeof($csv) >= 4) {
$dist=(2.0 * sqrt(($csv[0] - $csv[2]) * ($csv[0] - $csv[2]) + ($csv[1] - $csv[3]) * ($csv[1] - $csv[3])));
$csv[2]=$dist;
$csv[3]=$dist;
}
imageellipse($im, $csv[0], $csv[1], $csv[2], $csv[3], $black);
}

?>

… with our changed ninth draft image_venn.html Google Chart Image Chart Venn Chart or Scatter Chart or GraphViz Chart or Pie Chart or Line Chart or Bar Chart or Candlestick Chart or Map Chart interfacing web application you can also try below.


Previous relevant Google Chart Image Chart Broadcast Talk Context Tutorial is shown below.

Google Chart Image Chart Broadcast Talk Context Tutorial

Google Chart Image Chart Broadcast Talk Context Tutorial

The progress, today, along the same lines as yesterday’s Google Chart Image Chart Broadcast Talk Tutorial‘s introduction of a “Broadcast Talk” functionality, was to …

  • improve “Broadcast Talk” context, by adding onto yesterday’s …

    presented as an update image still presented and updated periodically

    … only display option, with, as of today …

  • a presenter’s first snapshotted image retained for user display (in case they arrive late to the lesson … tutt tutt) … and …
  • ImageMagick created animated GIF with slides for just this first image and the most recent image, updated periodically, in bottom right cell of user display …
    <?php

    if (isset($_POST['canvcont']) && isset($_POST['uniquifier']) && strpos(('?' . $_SERVER['QUERY_STRING']), 'cht=') === false) {
    if (isset($_POST['uniquifier'])) {
    $uniquifier=str_replace('+',' ',urldecode($_POST['uniquifier']));
    }
    if ($uniquifier == '') {
    $uniquifier='_' . rand(0,78654356);
    file_put_contents($_SERVER['DOCUMENT_ROOT'] . DIRECTORY_SEPARATOR . "presentation" . $uniquifier . ".png", base64_decode( explode('base64,', str_replace(' ','+',urldecode($_POST['canvcont'])))[1]));
    exec("/usr/local/cpanel/3rdparty/bin/convert -delay 20 -loop 0 " . $_SERVER['DOCUMENT_ROOT'] . DIRECTORY_SEPARATOR . "presentation" . $uniquifier . ".png" . " " . $_SERVER['DOCUMENT_ROOT'] . DIRECTORY_SEPARATOR . "presentation" . $uniquifier . ".gif");
    echo "<html><body onload=\"if (parent.document.getElementById('uniquifier')) { if (parent.document.getElementById('uniquifier').value == '') { parent.document.getElementById('uniquifier').value='" . $uniquifier . "'; } }\"></body></html>";
    } else {
    file_put_contents($_SERVER['DOCUMENT_ROOT'] . DIRECTORY_SEPARATOR . "presentation" . $uniquifier . ".png", base64_decode( explode('base64,', str_replace(' ','+',urldecode($_POST['canvcont'])))[1]));
    exec("rm -f " . $_SERVER['DOCUMENT_ROOT'] . DIRECTORY_SEPARATOR . "presentation" . $uniquifier . ".gif ; /usr/local/cpanel/3rdparty/bin/convert -delay 200 -loop 0 " . $_SERVER['DOCUMENT_ROOT'] . DIRECTORY_SEPARATOR . "presentation_" . $uniquifier . ".png " . $_SERVER['DOCUMENT_ROOT'] . DIRECTORY_SEPARATOR . "presentation" . $uniquifier . ".png" . " " . $_SERVER['DOCUMENT_ROOT'] . DIRECTORY_SEPARATOR . "presentation" . $uniquifier . ".gif");
    }
    exit;
    }

    ?>
    … and …
  • images saved as changes are detected gathered, as ever smaller thumbnails, in the top right of four table cells of the user display …

    var iijk=0, uniquif=''; snapshots=[], elem=null, elemcontext=null, oimg=null, checkforsquare=2;

    function canvinit() {
    var kkii=0, wpx=0, hpx=0;
    var tdr=document.getElementById('tdtr').getBoundingClientRect();
    wpx=eval('' + tdr.width);
    hpx=eval('' + tdr.height);
    elem=document.getElementById('agcanvas');
    elemcontext=elem.getContext('2d');
    elem.width=elem.width;
    elemcontext.drawImage(document.getElementById('talkimg'),0,0);
    if (iijk == 0 || ('' + document.getElementById('tdtr').style.backgroundImage).indexOf('rand=0') != -1) {
    //alert('89 ' + elem.toDataURL().length);
    //snapshots.push(elem.toDataURL());
    iijk=eval(-1 + eval('' + ('' + document.getElementById('tdtr').style.backgroundImage).split('),').length));
    document.getElementById('tdtr').style.backgroundImage=('' + document.getElementById('tdtr').style.backgroundImage).replace(('' + document.getElementById('tdtr').style.backgroundImage).split('),')[iijk], '' + 'url(' + elem.toDataURL() + '),' + ('' + document.getElementById('tdtr').style.backgroundImage).split('),')[iijk]).replace('rand=0', 'rand=x');
    iijk=eval(0 + eval('' + ('' + document.getElementById('tdtr').style.backgroundImage).split('),').length));
    setInterval(canvinit, 9000);
    } else {
    elem.width=elem.width;
    elemcontext.drawImage(document.getElementById('talkimg'),0,0);
    if (document.body.innerHTML.indexOf(elem.toDataURL()) == -1) {
    //snapshots.push(elem.toDataURL());
    iijk=eval(-1 + eval('' + ('' + document.getElementById('tdtr').style.backgroundImage).split('),').length));
    document.getElementById('tdtr').style.backgroundImage=('' + document.getElementById('tdtr').style.backgroundImage).replace(('' + document.getElementById('tdtr').style.backgroundImage).split('),')[iijk], '' + 'url(' + elem.toDataURL() + '),' + ('' + document.getElementById('tdtr').style.backgroundImage).split('),')[iijk]).replace('rand=x','rand=x' + Math.floor(Math.random() * 9));
    iijk=eval(0 + eval('' + ('' + document.getElementById('tdtr').style.backgroundImage).split('),').length));
    }
    }
    var bpx='background-position:;';
    var bbpx='background-position:;';
    var bsx='background-size:;';
    var brx='background-repeat:;';
    var xstart=0;
    var ystart=0;
    var xxstart=eval('' + tdr.left);
    var yystart=eval('' + tdr.top);
    if (iijk > eval(checkforsquare * checkforsquare)) { checkforsquare++; }
    for (kkii=1; kkii<=iijk; kkii++) {
    if (bsx.indexOf(':;') != -1) {
    bsx=bsx.replace(':;', ':' + Math.round(eval(wpx / checkforsquare)) + 'px ' + Math.round(eval(hpx /checkforsquare)) + 'px;');
    brx=brx.replace(':;', ':no-repeat;');
    bpx=bpx.replace(':;', ':' + Math.round(xstart) + 'px ' + Math.round(ystart) + 'px;');
    bbpx=bbpx.replace(':;', ':' + Math.round(xxstart) + 'px ' + Math.round(yystart) + 'px;');
    } else {
    bsx=bsx.replace(';', ',' + Math.round(eval(wpx / checkforsquare)) + 'px ' + Math.round(eval(hpx /checkforsquare)) + 'px;');
    brx=brx.replace(';', ',no-repeat;');
    bpx=bpx.replace(';', ',' + Math.round(xstart) + 'px ' + Math.round(ystart) + 'px;');
    bbpx=bbpx.replace(';', ',' + Math.round(xxstart) + 'px ' + Math.round(yystart) + 'px;');
    }
    if (eval(kkii % checkforsquare) == 0) {
    xstart=0;
    xxstart=eval('' + tdr.left);
    ystart+=eval(hpx / checkforsquare);
    yystart+=eval(hpx / checkforsquare);
    } else {
    xstart+=eval(wpx / checkforsquare);
    xxstart+=eval(wpx / checkforsquare);
    }
    }
    //alert('iijk=' + iijk + ' ' + bbpx + ' ' + bpx + ' ' + bsx + ' ' + brx);
    document.getElementById('tdtr').style.backgroundRepeat=brx.split(':')[1];
    document.getElementById('tdtr').style.backgroundSize=bsx.split(':')[1];
    document.getElementById('tdtr').style.backgroundPosition=bpx.split(':')[1];
    //document.body.style.backgroundImage=('' + document.getElementById('tdtr').style.backgroundImage);
    //document.body.style.backgroundRepeat=brx.split(':')[1];
    //document.body.style.backgroundSize=bsx.split(':')[1];

    document.body.style.backgroundPosition=bbpx.split(':')[1];
    var kdss=bsx.split(':')[1].replace(/\;/g,'').split(',');
    var idss=bbpx.split(':')[1].replace(/\;/g,'').split(',');
    var jdss=(('' + document.getElementById('tdtr').style.backgroundImage) + ',').replace(';,',',').replace(/url\(/g,'').replace(/URL\(/g,'').replace(/\"\;/g,'').replace(/\"/g,'').split('),');
    document.getElementById('idiv').innerHTML='';
    var istuff='', laststuff='';
    for (var iop=0; iop<idss.length; iop++) {
    //while (istuff == laststuff) {
    if (('' + jdss[iop]) != 'undefined' && ('' + jdss[iop]).trim() != '') {
    if (jdss[iop].trim().indexOf('iVBOR') != -1) {
    istuff+='<img style="position:absolute;width:' + kdss[iop].split(' ')[0] + ';height:' + kdss[iop].split(' ')[1] + ';left:' + idss[iop].split(' ')[0] + ';top:' + idss[iop].split(' ')[1] + ';" src="data:image/png;base64,iVBOR' + jdss[iop].trim().split('iVBOR')[1] + '"></img>';
    } else if (jdss[iop].trim() .indexOf('//') != -1) {
    istuff+='<img style="position:absolute;width:' + kdss[iop].split(' ')[0] + ';height:' + kdss[iop].split(' ')[1] + ';left:' + idss[iop].split(' ')[0] + ';top:' + idss[iop].split(' ')[1] + ';" src="' + jdss[iop].trim() + '"></img>';
    }
    //}
    laststuff=istuff;
    }
    }
    document.getElementById('idiv').innerHTML=istuff;
    }

We hope you try new functionality in our changed eighth draft image_venn.html Google Chart Image Chart Venn Chart or Scatter Chart or GraphViz Chart or Pie Chart or Line Chart or Bar Chart or Candlestick Chart or Map Chart interfacing web application you can also try below.


Previous relevant Google Chart Image Chart Broadcast Talk Tutorial is shown below.

Google Chart Image Chart Broadcast Talk Tutorial

Google Chart Image Chart Broadcast Talk Tutorial

Onto yesterday’s Google Chart Image Chart Statistical Charts Tutorial progress we want to offer …

  • once a user has that “More Annotation” annotating happening … offer the chance to …
  • Broadcast … their work as it happens, dynamically …
  • to an emailee list audience

… and we’re calling this …

Broadcast Talk

… even though it is only visual by nature, presented as an update image still presented and updated periodically. Go figure?! We’re blaming that supper time two back. We’re not sure?!

Anyway, we hope you try out the new arrangements in our changed seventh draft image_venn.html Google Chart Image Chart Venn Chart or Scatter Chart or GraphViz Chart or Pie Chart or Line Chart or Bar Chart or Candlestick Chart or Map Chart interfacing web application you can also try below, and helped out by a WordPress blog good ol’ TwentyTen theme 404.php which now includes …

<?php

if (isset($_POST['canvcont']) && isset($_POST['uniquifier']) && strpos(('?' . $_SERVER['QUERY_STRING']), 'cht=') === false) {
if (isset($_POST['uniquifier'])) {
$uniquifier=str_replace('+',' ',urldecode($_POST['uniquifier']));
}
if ($uniquifier == '') {
$uniquifier='_' . rand(0,78654356);
file_put_contents($_SERVER['DOCUMENT_ROOT'] . DIRECTORY_SEPARATOR . "presentation" . $uniquifier . ".png", base64_decode( explode('base64,', str_replace(' ','+',urldecode($_POST['canvcont'])))[1]));
echo "<html><body onload=\"if (parent.document.getElementById('uniquifier')) { if (parent.document.getElementById('uniquifier').value == '') { parent.document.getElementById('uniquifier').value='" . $uniquifier . "'; } }\"></body></html>";
} else {
file_put_contents($_SERVER['DOCUMENT_ROOT'] . DIRECTORY_SEPARATOR . "presentation" . $uniquifier . ".png", base64_decode( explode('base64,', str_replace(' ','+',urldecode($_POST['canvcont'])))[1]));
}
exit;
}

?>

… featuring our first use of this 404.php in response to a method=POST form call. Verrrrrryyyy interesting!


Previous relevant Google Chart Image Chart Statistical Charts Tutorial is shown below.

Google Chart Image Chart Statistical Charts Tutorial

Google Chart Image Chart Statistical Charts Tutorial

Further to yesterday’s Google Chart Image Chart Pie Chart Tutorial, today, we embark on our first ventures into composite charts, along what we like to think of as “statistical lines”, regarding interfacing to Google Charts Image Chart

… the latter being like a “parasite” display idea off the more conventional Statistical Graph favourites, the Line Chart and Bar Chart, where you have a relationship between a numerical concept (eg. sales) and another type of concept (eg. month of the year), and you want to present the data in a graphical form.

Again, we haven’t stopped our “retweaking”. We might “retweak” in the morning or we might “retweak” over a coffee break or we might “retweak” at supper time, but the end result is, well, you’re reading it now!


var pretherest='';
var newtherest='';
var tmod='';
var cht=location.search.split('cht=')[1] ? decodeURIComponent(location.search.split('cht=')[1].split('&')[0]) : "v";
if ((cht + ' ').substring(0,1) == 'p' && cht != 'p') { pretherest=cht.substring(1); }
if ((cht + ' ').substring(0,2) == 'bv' && cht != 'bv') { pretherest=cht.substring(2); if (1 == 1) { cht='bv'; } }
if ((cht + ' ').substring(0,1) == 'l' && cht != 'l') { pretherest=cht.substring(1); if (1 == 1) { cht='l'; } }
var ctype=location.search.split('type=')[1] ? decodeURIComponent(location.search.split('type=')[1].split('&')[0]) : cht;
var cname=(ctype == 'v' ? 'Venn Chart' : (ctype == 's' ? 'Scatter Chart' : (ctype == 'gv' ? 'GraphViz Chart' :
(ctype.substring(0,1) == 'p' ? 'Pie Chart' :
((ctype + ' ').substring(0,2) == 'bv' ? 'Bar Chart' : (ctype.substring(0,1) == 'l' ? 'Line Chart' : ''))))));
var cencodename=(ctype == 'v' ? 'Venn%20Diagram' : (ctype == 's' ? 'Scatter%20Chart' : (ctype == 'gv' ? 'GraphViz%20Chart' :
(ctype.substring(0,1) == 'p' ? 'Pie%20Chart' :
((ctype + ' ').substring(0,2) == 'bv' ? 'Bar%20Chart' : (ctype.substring(0,1) == 'l' ? 'Line%20Chart' : ''))))));
var chdt=(ctype == 'v' ? '&chd=t:' : (ctype == 's' ? '&chd=t:' : (ctype == 'gv' ? '&chl=' :
(ctype.substring(0,1) == 'p' ? pretherest + '&chd=t:' :
((ctype + ' ').substring(0,2) == 'bv' ? '&chd=t:' : (ctype.substring(0,1) == 'l' ? '&chd=t:' : ''))))));
var chdeq=(ctype == 'v' ? '&chd=' : (ctype == 's' ? '&chd=' : (ctype == 'gv' ? '&chl=' :
(ctype.substring(0,1) == 'p' ? '&chd=' :
((ctype + ' ').substring(0,2) == 'bv' ? '&chd=' : (ctype.substring(0,1) == 'l' ? '&chd=' : ''))))));
var tc=(ctype == 'v' ? 't:' : (ctype == 's' ? 't:' : (ctype == 'gv' ? '' :
(ctype.substring(0,1) == 'p' ? 't:' :
((ctype + ' ').substring(0,2) == 'bv' ? 't:' : (ctype.substring(0,1) == 'l' ? 't:' : ''))))));
var chdl=(ctype == 'v' ? '&chdl=' : (ctype == 's' ? '&chdl=' : (ctype == 'gv' ? '' :
(ctype.substring(0,1) == 'p' ? '&chdl=' :
((ctype + ' ').substring(0,2) == 'bv' ? '&chbh=' : (ctype.substring(0,1) == 'l' ? '&chbh=' : ''))))));

var prenchtt=(ctype == 'v' ? '100,80,60,30,30,30,10' : (ctype == 's' ? '12,87,75,41,23,96,68,71,34,9|98,60,27,34,56,79,58,74,18,76|84,23,69,81,47,94,60,93,64,54' : (ctype == 'gv' ? 'graph{C_0--H_0[type=s];C_0--H_1[type=s];C_0--H_2[type=s];C_0--C_1[type=s];C_1--H_3[type=s];C_1--H_4[type=s];C_1--H_5[type=s]}' :
(ctype.substring(0,1) == 'p' ? '1,2,3,4' :
((ctype + ' ').substring(0,2) == 'bv' ? '5,5,5|10,10,10|15,15,15' : (ctype.substring(0,1) == 'l' ? '5,45,5|10,60,10|15,85,15' : ''))))));
var preachtt=(ctype == 'v' ? 'A|B|C' : (ctype == 's' ? 'Cats|Dogs' : (ctype == 'gv' ? '' :
(ctype.substring(0,1) == 'p' ? 'January|February|March|April' :
((ctype + ' ').substring(0,2) == 'bv' ? '15,4,15' : (ctype.substring(0,1) == 'l' ? '15,4,15' : ''))))));
var defchco=(ctype == 'v' ? 'ff0000,00ff00,0000ff' : (ctype == 's' ? 'FF0000|0000FF&chxt=x,y' : (ctype == 'gv' ? '' :
(ctype.substring(0,1) == 'p' ? 'ff0000,00ff00,0000ff,ff00ff' :
((ctype + ' ').substring(0,2) == 'bv' ? '4D89F9,C6D9FD,C6FDD9&chxt=x,y' : (ctype.substring(0,1) == 'l' ? '3D89F9.B6D9FD,B6FDD9&chxt=x,y' : ''))))));

var prechtt=(ctype == 'v' ? chdt + prenchtt + chdl + preachtt : (ctype == 's' ? chdt + prenchtt + chdl + preachtt + '&chxt=x,y' : (ctype == 'gv' ? chdt + prenchtt :
(ctype.substring(0,1) == 'p' ? chdt + prenchtt + chdl + preachtt :
((ctype + ' ').substring(0,2) == 'bv' ? chdt + prenchtt + chdl + preachtt : (ctype.substring(0,1) == 'l' ? chdt + prenchtt + chdl + preachtt : ''))))));
var promptone=(ctype == 'v' ? "Enter delimited values string for Venn Diagram such that ... " + String.fromCharCode(10) + "The first three values specify the sizes of three circles: A, B, & C. For chart with only two circles, specify zero for the third value." + String.fromCharCode(10) + "The fourth value specifies the size of the intersection of A and B." + String.fromCharCode(10) + "The fifth value specifies the size of the intersection of A and C. For a chart with only two circles, do not specify a value here." + String.fromCharCode(10) + "The sixth value specifies the size of the intersection of B and C. For a chart with only two circles, do not specify a value here." + String.fromCharCode(10) + "The seventh value specifies the size of the common intersection of A, B, and C. For a chart with only two circles, do not specify a value here." + String.fromCharCode(10) + String.fromCharCode(10) + "" : (ctype == 's' ? "Enter delimited values string for Scatter Chart" : (ctype == 'gv' ? "Enter delimited values string for GraphViz Chart" :
(ctype.substring(0,1) == 'p' ? "Enter delimited values string for Pie Chart" :
((ctype + ' ').substring(0,2) == 'bv' ? "Enter g for Group or s for Stacked or o for Overlapped Bar Chart look then a space and then enter delimited values string for Bar Chart. Here is a Candlestick and Bar Chart idea eg. g 1:20,10,15,25,17,30|0,5,10,7,12,6|35,25,45,47,24,46|15,40,30,27,39,54|70,55,63,59,80,6 Prefix just the delimited string you enter by 1: to additionally display Candlestick Charts or by 0: to only display Candlestick Chart" :
(ctype.substring(0,1) == 'l' ? "Enter c for Even or s for Sparklines or xy for Just XY Line Chart look then a space and then enter delimited values string for Line Chart. Here is a Candlestick and Line Chart idea eg. c 1:20,10,15,25,17,30|0,5,10,7,12,6|35,25,45,47,24,46|15,40,30,27,39,54|70,55,63,59,80,6 Prefix just the delimited string you enter by 1: to additionally display Candlestick Charts or by 0: to only display Candlestick Chart" : ""))))));
var oneprompt=(ctype == 'v' ? "Enter delimited values string for your Venn Diagram collaborations, optionally, such that ... " + String.fromCharCode(10) + "The first three values specify the sizes of three circles: A, B, & C. For chart with only two circles, specify zero for the third value." + String.fromCharCode(10) + "The fourth value specifies the size of the intersection of A and B." + String.fromCharCode(10) + "The fifth value specifies the size of the intersection of A and C. For a chart with only two circles, do not specify a value here." + String.fromCharCode(10) + "The sixth value specifies the size of the intersection of B and C. For a chart with only two circles, do not specify a value here." + String.fromCharCode(10) + "The seventh value specifies the size of the common intersection of A, B, and C. For a chart with only two circles, do not specify a value here." + String.fromCharCode(10) + String.fromCharCode(10) + "" : (ctype == 's' ? "Enter delimited values string for Scatter Chart" : (ctype == 'gv' ? "Enter delimited values string for GraphViz Chart" :
(ctype.substring(0,1) == 'p' ? "Enter delimited values string for Pie Chart" :
((ctype + ' ').substring(0,2) == 'bv' ? "Enter g for Grouped or s for Stacked or o for Overlapped Bar Chart look then a space and then enter delimited values string for Bar Chart. Here is a Candlestick and Bar Chart idea eg. g 1:20,10,15,25,17,30|0,5,10,7,12,6|35,25,45,47,24,46|15,40,30,27,39,54|70,55,63,59,80,6 Prefix just the delimited string you enter by 1: to additionally display Candlestick Charts or by 0: to only display Candlestick Chart" :
(ctype.substring(0,1) == 'l' ? "Enter c for Even or s for Sparklines or xy for Just XY Line Chart look then a space and then enter delimited values string for Line Chart. Here is a Candlestick and Line Chart idea eg. c 1:20,10,15,25,17,30|0,5,10,7,12,6|35,25,45,47,24,46|15,40,30,27,39,54|70,55,63,59,80,6 Prefix just the delimited string you enter by 1: to additionally display Candlestick Charts or by 0: to only display Candlestick Chart" : ""))))));
var asktwo=(ctype == 'v' ? true : (ctype == 's' ? true : (ctype == 'gv' ? false :
(ctype.substring(0,1) == 'p' ? true :
((ctype + ' ').substring(0,2) == 'bv' ? true : (ctype.substring(0,1) == 'l' ? true : false))))));
var twopb=(ce.substring(0,1) == 'p' ? 'Any optional legend or title argument snippets? Optionally prefix by 3 for 3d Pie Chart or by c for Concentric Pie Chart. Eg. 3' + chdl + preachtt + '&chtt=My%20' + cencodename + '&chco=' + defchco : 'Any optional legend or title argument snippets? Eg. ' + chdl + preachtt + '&chtt=My%20' + cencodename + '&chco=' + defchco);
var beforeanswer=(ctype.substring(0,1) == 'l' ? 'c ' : ((ctype + ' ').substring(0,2) == 'bv' ? 'g ' : ''));

if ((document.URL.toLowerCase().indexOf('chd=t%3a') == -1 && document.URL.toLowerCase().indexOf('chd=t:') == -1) && document.URL.toLowerCase().indexOf('chd=t') != -1 && document.URL.toLowerCase().indexOf('%3a') != -1) {
tmod=document.URL.toLowerCase().split('chd=t')[1].split('%3')[0];
//tc='t' + tmod + ':';
//chdt=chdt.replace('t:', 't' + tmod + ':');
//answer=answer.trim().replace(tmod + ':','');
//therest+='&chm=F,,1,1:4,20';
} else if ((document.URL.toLowerCase().indexOf('chd=t%3a') == -1 && document.URL.toLowerCase().indexOf('chd=t:') == -1) && document.URL.toLowerCase().indexOf('chd=t') != -1 && document.URL.toLowerCase().substring(8).indexOf(':') != -1) {
tmod=document.URL.toLowerCase().split('chd=t')[1].split(':')[0];
//tc='t' + tmod + ':';
//chdt=chdt.replace('t:', 't' + tmod + ':');
//answer=answer.trim().replace(tmod + ':','');
//therest+='&chm=F,,1,1:4,20';
}

var atend="<canvas id=sharecanvas style=display:none;></canvas><div style=display:none;><label for='shareurl'><input type=button onclick='downloadmaybe(); shareurl();' id='sbut' value='Share URL Link'></input>: </label><input onblur=changeu(this.value); title='Suffix by hashtag 1 is text and hashtag 2 is title' style='width:45%;' type=url value='' placeholder='https://www.rjmprogramming.com.au/ITblog/#RJM Programming Blog#IT Blog' id=shareurl ondblclick='this.value=trythis(this.placeholder);'></input><br><br><span> ... and/or ... </span><br><br><label for='files'><input type=button onclick=document.getElementById('share').click(); value='Share media or document files'></input>: </label><input id='files' type='file' accept='image/*,video/*,audio/*,application/*,text/*' multiple></div><br><br><button id='share' type='button'>Share your media or documents or link!</button><output id='output'></output><scr" + "ipt type='text/javascript' src='/web_share_api_test.js?canv" + "asshare=as_necessary9867654' defer></scr" + "ipt>";
atend='';

var vals=[], annowin=null;


var lastbit="<br><br><br><br>  <button title='Other complex canvas annotation functionalities (forgoes the simpler ones above) ...' id=annobut onclick=\"document.getElementById('tdleft').style.verticalAlign='top'; setTimeout(prerepaint, 12000); if (arest.length != 0) { alert('arest=' + arest); if (document.getElementById('myvenn').src.indexOf(arest) == -1) { pdivhide(); document.getElementById('myvenn').src=document.getElementById('myvenn').src.split(arest.substring(0,5))[0] + arest; document.getElementById('tdleft').style.verticalAlign='top'; } } annowin=window.open('/HTMLCSS/user_of_signature_signature.htm?elemode=img','_blank','top=420,left=620,width=900,height=420'); \" style=\"background-color:yellow;\">More Annotations</button>  <button id=bshare onclick=repaint(); style=display:none;>Repaint <font size=1>(but lose sharing emojis above)</font></button><br><div id=divcanvas style=display:none;><canvas id=bottomcanvas></canvas></div>";
var fszbit='  <span id=spanfsz><select id=fsz onchange="fsz=this.value;"><option value=".10">10px</option><option value=".6">6px</option><option value=".8">8px</option><option value=".9">9px</option><option value=".11">11px</option><option value=".12">12px</option><option value=".14">14px</option><option value=".16">16px</option><option value=".18">18px</option><option value=".20">20px</option><option value=".24">24px</option><option value=".30">30px</option><option value=".36">36px</option><option value=".40">40px</option><option value=".48">48px</option><option value=".50">50px</option><option value=".64">64px</option></select></span>';
var origemailurl='mailto:?subject=My%20' + cencodename + '%20...%20best%20viewed%20in%20landscape%20...&body=';
var origsmsurl='sms:&body=My%20' + cencodename + '%20...%20best%20viewed%20in%20landscape%20...';
var smsee='';
var chd=location.search.split(chdeq)[1] ? (tc + dectypodeURIComponent(location.search.split(chdeq)[1].split('&')[0])).replace('t:t:', 't:').replace(/^t\:$/g, '') : "";
var therest=location.search.split(chdeq)[1] ? (pretherest + document.URL.split(document.URL.split('#')[0].split(chdeq)[1].split('&')[0])[1].split('#')[0]) : "";
newtherest=((ctype + ' ').substring(0,2) == 'bv' ? therest : '');

And yes, you can, and we did, put line feeds into those ternery statements to help with their readability as we add complexity to the parameterization, as we go along, in our changed sixth draft image_venn.html Google Chart Image Chart Venn Chart or Scatter Chart or GraphViz Chart or Pie Chart or Line Chart or Bar Chart or Candlestick Chart interfacing web application you can also try below.


Previous relevant Google Chart Image Chart Pie Chart Tutorial is shown below.

Google Chart Image Chart Pie Chart Tutorial

Google Chart Image Chart Pie Chart Tutorial

As we intimated in yesterday’s Google Chart Image Chart GraphViz Chart Tutorial

start with an at least two part “inhouse phase” of additional “extra to text” annotation functionality possibilities …

… we would return! And so, here thou lingers. It’s “part two” day, even bigger than “Ben Hur” in certain outback towns we’re a little bit shy to divulge until we get to know our readers that little bit better.

Yes, we are dovetailing with work we’ve done in the past using the excellent …

  • canvas … element introduced with HTML5 … whereby …
  • annotations like …
    1. scribble … as the default, and various other …
    2. discrete click shapes … and …
    3. text … including emojis … and …
    4. image

    … annotating modus operandi

… can be part of the arrangements. It works that the Annotation Helper is opened …

  • in a new “known about” popup window … looking out for …
  • parent based “img” element (in the modus operandi we use, calling it, regarding the parent top left image) … so as to be able to …
  • populate its canvas element with a clone of that calling “img” graphical content … but add into the mix …
  • menu driven annotation functionality which can change that canvas look and underlying data … and …
  • the caller can keep track of this and arrange, or not, for these changes to be reflected back at its top left “img” element … the catch being …
  • the “within range of GET argument” limits are ruined by this introduction of graphical data, and so in agreeing to this, a user forgoes those simpler sharing and annotating functionalities of yesterday’s (and before) work … though your normal image sharing capabilities via the web browser remain in the caller and the called

As well, today, we are introducing new Google Charts Image Chart Pie Chart interfacing, and because this chart type can have the three …

  • Normal
  • 3D
  • Concentric

… guises, there was some work to keep us off this street (okay … so we divulgedagain)


var pretherest='';
var cht=location.search.split('cht=')[1] ? decodeURIComponent(location.search.split('cht=')[1].split('&')[0]) : "v";
if ((cht + ' ').substring(0,1) == 'p' && cht != 'p') { pretherest=cht.substring(1); }
var ctype=location.search.split('type=')[1] ? decodeURIComponent(location.search.split('type=')[1].split('&')[0]) : cht;
var cname=(ctype == 'v' ? 'Venn Chart' : (ctype == 's' ? 'Scatter Chart' : (ctype == 'gv' ? 'GraphViz Chart' : (ctype.substring(0,1) == 'p' ? 'Pie Chart' : ''))));
var cencodename=(ctype == 'v' ? 'Venn%20Diagram' : (ctype == 's' ? 'Scatter%20Chart' : (ctype == 'gv' ? 'GraphViz%20Chart' : (ctype.substring(0,1) == 'p' ? 'Pie%20Chart' : ''))));
var chdt=(ctype == 'v' ? '&chd=t:' : (ctype == 's' ? '&chd=t:' : (ctype == 'gv' ? '&chl=' : (ctype.substring(0,1) == 'p' ? pretherest + '&chd=t:' : ''))));
var chdeq=(ctype == 'v' ? '&chd=' : (ctype == 's' ? '&chd=' : (ctype == 'gv' ? '&chl=' : (ctype.substring(0,1) == 'p' ? '&chd=' : ''))));
var tc=(ctype == 'v' ? 't:' : (ctype == 's' ? 't:' : (ctype == 'gv' ? '' : (ctype.substring(0,1) == 'p' ? 't:' : ''))));
var chdl=(ctype == 'v' ? '&chdl=' : (ctype == 's' ? '&chdl=' : (ctype == 'gv' ? '' : (ctype.substring(0,1) == 'p' ? '&chdl=' : ''))));
var prenchtt=(ctype == 'v' ? '100,80,60,30,30,30,10' : (ctype == 's' ? '12,87,75,41,23,96,68,71,34,9|98,60,27,34,56,79,58,74,18,76|84,23,69,81,47,94,60,93,64,54' : (ctype == 'gv' ? 'graph{C_0--H_0[type=s];C_0--H_1[type=s];C_0--H_2[type=s];C_0--C_1[type=s];C_1--H_3[type=s];C_1--H_4[type=s];C_1--H_5[type=s]}' : (ctype.substring(0,1) == 'p' ? '1,2,3,4' : ''))));
var preachtt=(ctype == 'v' ? 'A|B|C' : (ctype == 's' ? 'Cats|Dogs' : (ctype == 'gv' ? '' : (ctype.substring(0,1) == 'p' ? 'January|February|March|April' : ''))));
var prechtt=(ctype == 'v' ? chdt + prenchtt + chdl + preachtt : (ctype == 's' ? chdt + prenchtt + chdl + preachtt + '&chxt=x,y' : (ctype == 'gv' ? chdt + prenchtt : (ctype.substring(0,1) == 'p' ? chdt + prenchtt + chdl + preachtt : ''))));
var defchco=(ctype == 'v' ? 'ff0000,00ff00,0000ff' : (ctype == 's' ? 'FF0000|0000FF&chxt=x,y' : (ctype == 'gv' ? '' : (ctype.substring(0,1) == 'p' ? 'ff0000,00ff00,0000ff,ff00ff' : ''))));
var promptone=(ctype == 'v' ? "Enter delimited values string for Venn Diagram such that ... " + String.fromCharCode(10) + "The first three values specify the sizes of three circles: A, B, & C. For chart with only two circles, specify zero for the third value." + String.fromCharCode(10) + "The fourth value specifies the size of the intersection of A and B." + String.fromCharCode(10) + "The fifth value specifies the size of the intersection of A and C. For a chart with only two circles, do not specify a value here." + String.fromCharCode(10) + "The sixth value specifies the size of the intersection of B and C. For a chart with only two circles, do not specify a value here." + String.fromCharCode(10) + "The seventh value specifies the size of the common intersection of A, B, and C. For a chart with only two circles, do not specify a value here." + String.fromCharCode(10) + String.fromCharCode(10) + "" : (ctype == 's' ? "Enter delimited values string for Scatter Chart" : (ctype == 'gv' ? "Enter delimited values string for GraphViz Chart" : (ctype.substring(0,1) == 'p' ? "Enter delimited values string for Pie Chart" : ""))));
var oneprompt=(ctype == 'v' ? "Enter delimited values string for your Venn Diagram collaborations, optionally, such that ... " + String.fromCharCode(10) + "The first three values specify the sizes of three circles: A, B, & C. For chart with only two circles, specify zero for the third value." + String.fromCharCode(10) + "The fourth value specifies the size of the intersection of A and B." + String.fromCharCode(10) + "The fifth value specifies the size of the intersection of A and C. For a chart with only two circles, do not specify a value here." + String.fromCharCode(10) + "The sixth value specifies the size of the intersection of B and C. For a chart with only two circles, do not specify a value here." + String.fromCharCode(10) + "The seventh value specifies the size of the common intersection of A, B, and C. For a chart with only two circles, do not specify a value here." + String.fromCharCode(10) + String.fromCharCode(10) + "" : (ctype == 's' ? "Enter delimited values string for Scatter Chart" : (ctype == 'gv' ? "Enter delimited values string for GraphViz Chart" : (ctype.substring(0,1) == 'p' ? "Enter delimited values string for Pie Chart" : ""))));
var asktwo=(ctype == 'v' ? true : (ctype == 's' ? true : (ctype == 'gv' ? false : (ctype.substring(0,1) == 'p' ? true : false))));
var twopb=(ctype.substring(0,1) == 'p' ? 'Any optional legend or title argument snippets? Optionally prefix by 3 for 3d Pie Chart or by c for Concentric Pie Chart. Eg. 3' + chdl + preachtt + '&chtt=My%20' + cencodename + '&chco=' + defchco : 'Any optional legend or title argument snippets? Eg. ' + chdl + preachtt + '&chtt=My%20' + cencodename + '&chco=' + defchco);

var atend="<canvas id=sharecanvas style=display:none;></canvas><div style=display:none;><label for='shareurl'><input type=button onclick='downloadmaybe(); shareurl();' id='sbut' value='Share URL Link'></input>: </label><input onblur=changeu(this.value); title='Suffix by hashtag 1 is text and hashtag 2 is title' style='width:45%;' type=url value='' placeholder='https://www.rjmprogramming.com.au/ITblog/#RJM Programming Blog#IT Blog' id=shareurl ondblclick='this.value=trythis(this.placeholder);'></input><br><br><span> ... and/or ... </span><br><br><label for='files'><input type=button onclick=document.getElementById('share').click(); value='Share media or document files'></input>: </label><input id='files' type='file' accept='image/*,video/*,audio/*,application/*,text/*' multiple></div><br><br><button id='share' type='button'>Share your media or documents or link!</button><output id='output'></output><scr" + "ipt type='text/javascript' src='/web_share_api_test.js?canv" + "asshare=as_necessary9867654' defer></scr" + "ipt>";
atend='';

var vals=[], annowin=null;
var lastbit="<br><br><br><br>  <button title='Other complex canvas annotation functionalities (forgoes the simpler ones above) ...' id=annobut onclick=\"document.getElementById('tdleft').style.verticalAlign='top'; setTimeout(prerepaint, 12000); if (arest.length != 0) { if (document.getElementById('myvenn').src.indexOf(arest) == -1) { pdivhide(); document.getElementById('myvenn').src=document.getElementById('myvenn').src.split(arest.substring(0,5))[0] + arest; document.getElementById('tdleft').style.verticalAlign='top'; } } annowin=window.open('/HTMLCSS/user_of_signature_signature.htm?elemode=img','_blank','top=420,left=620,width=900,height=420'); \" style=\"background-color:yellow;\">More Annotations</button>  <button id=bshare onclick=repaint(); style=display:none;>Repaint <font size=1>(but lose sharing emojis above)</font></button><br><div id=divcanvas style=display:none;><canvas id=bottomcanvas></canvas></div>";
var fszbit='  <span id=spanfsz><select id=fsz onchange="fsz=this.value;"><option value=".10">10px</option><option value=".6">6px</option><option value=".8">8px</option><option value=".9">9px</option><option value=".11">11px</option><option value=".12">12px</option><option value=".14">14px</option><option value=".16">16px</option><option value=".18">18px</option><option value=".20">20px</option><option value=".24">24px</option><option value=".30">30px</option><option value=".36">36px</option><option value=".40">40px</option><option value=".48">48px</option><option value=".50">50px</option><option value=".64">64px</option></select></span>';
var origemailurl='mailto:?subject=My%20' + cencodename + '%20...%20best%20viewed%20in%20landscape%20...&body=';
var origsmsurl='sms:&body=My%20' + cencodename + '%20...%20best%20viewed%20in%20landscape%20...';
var smsee='';
var chd=location.search.split(chdeq)[1] ? (tc + decodeURIComponent(location.search.split(chdeq)[1].split('&')[0])).replace('t:t:', 't:').replace(/^t\:$/g, '') : "";
var therest=location.search.split(chdeq)[1] ? (pretherest + document.URL.split(document.URL.split('#')[0].split(chdeq)[1].split('&')[0])[1].split('#')[0]) : "";

Please acquaint yourself with these new annotating features in our changed fifth draft image_venn.html Google Chart Image Chart Venn Chart or Scatter Chart or GraphViz Chart or Pie Chart interfacing web application you can also try below.


Previous relevant Google Chart Image Chart GraphViz Chart Tutorial is shown below.

Google Chart Image Chart GraphViz Chart Tutorial

Google Chart Image Chart GraphViz Chart Tutorial

Today we have two strands of forward progress, onto the progress up to yesterday’s Google Chart Image Chart Scatter Chart Tutorial, they being …

  • establish a new interfacing to GraphViz Chart

    GraphViz is a package of open source tools for visualizing connectivity graphs. You can create GraphViz graphs using the DOT language and your choice of layout engines.

    … a chart looking a bit like Organization Charts

    Org charts are diagrams of a hierarchy of nodes, commonly used to portray superior/subordinate relationships in an organization. A family tree is a type of org chart.


  • start with an at least two part “inhouse phase” of additional “extra to text” annotation functionality possibilities … just starting with …
    1. line
    2. open rectangle
    3. filled rectangle

… additional functionality, that we may well add to, but being as we feel a change we’ll leave that for another time.

The WordPress blog “404.php” code snippet becomes …

<?php

if (strpos(('?' . $_SERVER['QUERY_STRING']), '?cht=') !== false || strpos(('?' . $_SERVER['QUERY_STRING']), '&cht=') !== false) {

$theqs=str_replace('??','?',('?' . $_SERVER['QUERY_STRING']));
if (strpos($theqs, '?chs=') === false && strpos($theqs, '&chs=') === false) {
$theqs='?chs=' . $newWidth . 'x' . $newHeight . '&' . explode('?', $theqs)[1];
}


if (strpos(('?' . $_SERVER['QUERY_STRING']), 'text1=') !== false) {
$theone=2;
$im = imagecreatefromstring(file_get_contents('http://chart.googleapis.com/chart' . explode('&text1=', $theqs)[0]));

if (7 == 7) {

$plotstring=str_replace('+',' ',urldecode($_GET['text1']));
$csv=explode(',', $plotstring);
$black = imagecolorallocatealpha($im, 1, 1, 1, 0);
$blackish = imagecolorallocatealpha($im, 127, 127, 127, 64);
if (sizeof($csv) >= 3) {
if (trim($csv[2]) == '') { // non text annotations

$zeroesbit='';
$izeroes=0;
$xmantissae=explode('.', ('' . $csv[0]));
if (sizeof($xmantissae) > 1) {
$csv[0]=$xmantissae[0];
while (substr($xmantissae[1],0,1) == '0') {
$zeroesbit.='0';
$xmantissae[1]=substr($xmantissae[1],1);
}
$csv[2]=$xmantissae[1];
}
$ymantissae=explode('.', ('' . $csv[1]));
if (sizeof($ymantissae) > 1) {
$csv[1]=$ymantissae[0];
if (sizeof($csv) > 3) {
$csv[3]=$ymantissae[1];
} else {
array_push($csv, $ymantissae[1]);
}
}


if (strlen($zeroesbit) == 4) { // filled in rectangle
imagefilledrectangle($im, $csv[0], $csv[1], $csv[2], $csv[3], $blackish);
} else if (strlen($zeroesbit) == 2) { // rectangle
imagerectangle($im, $csv[0], $csv[1], $csv[2], $csv[3], $black);
} else if (strlen($zeroesbit) == 1) { // line
imageline($im, $csv[0], $csv[1], $csv[2], $csv[3], $black);
}

} else { // text placement
$xis=$csv[0];
$mantissae=explode('.', ('' . $csv[0]));
if (sizeof($mantissae) > 1) {
$tenpx=$mantissae[1];
$xis=$mantissae[0];
}
try {
if (function_exists('imagettftext')) {
if (explode('' . $csv[0] . ',' . $csv[1] . ',', $plotstring)[1] !== '') {
//echo explode('' . $csv[0] . ',' . $csv[1] . ',', $plotstring)[1];
//exit;
imagettftext($im, $tenpx, 0, $xis, $csv[1], $black, realpath('arial.ttf'), explode('' . $csv[0] . ',' . $csv[1] . ',', $plotstring)[1]);
}
}
} catch (Exception $e) { }
}
while (isset($_GET['text' . $theone])) {
$plotstring=str_replace('+',' ',urldecode($_GET['text' . $theone]));
$csv=explode(',', $plotstring);
if (sizeof($csv) >= 3) {
if (trim($csv[2]) == '') { // non text annotations

$zeroesbit='';
$izeroes=0;
$xmantissae=explode('.', ('' . $csv[0]));
if (sizeof($xmantissae) > 1) {
$csv[0]=$xmantissae[0];
while (substr($xmantissae[1],0,1) == '0') {
$zeroesbit.='0';
$xmantissae[1]=substr($xmantissae[1],1);
}
$csv[2]=$xmantissae[1];
}
$ymantissae=explode('.', ('' . $csv[1]));
if (sizeof($ymantissae) > 1) {
$csv[1]=$ymantissae[0];
if (sizeof($csv) > 3) {
$csv[3]=$ymantissae[1];
} else {
array_push($csv, $ymantissae[1]);
}
}


if (strlen($zeroesbit) == 4) { // filled in rectangle
imagefilledrectangle($im, $csv[0], $csv[1], $csv[2], $csv[3], $blackish);
} else if (strlen($zeroesbit) == 2) { // rectangle
imagerectangle($im, $csv[0], $csv[1], $csv[2], $csv[3], $black);
} else if (strlen($zeroesbit) == 1) { // line
imageline($im, $csv[0], $csv[1], $csv[2], $csv[3], $black);
}

} else { // text placement
try {
$xis=$csv[0];
$mantissae=explode('.', ('' . $csv[0]));
if (sizeof($mantissae) > 1) {
$tenpx=$mantissae[1];
$xis=$mantissae[0];
}
if (function_exists('imagettftext')) {
if (explode('' . $csv[0] . ',' . $csv[1] . ',', $plotstring)[1] !== '') {
imagettftext($im, $tenpx, 0, $xis, $csv[1], $black, realpath('arial.ttf'), explode('' . $csv[0] . ',' . $csv[1] . ',', $plotstring)[1]);
}
}
} catch (Exception $e) { }
}
$theone++;
}
}
//}
}


}

header('Content-Type: image/png');

imagepng($im);
imagedestroy($im);
} else {
header('Content-Type: image/png');
echo file_get_contents('http://chart.googleapis.com/chart' . $theqs);
}
exit;

}

?>

… utilizing that good ol’ PHP GD image library.

We hope you enjoy the …

Mantissa Madness Monday

… coding feel utilized to retain yesterday’s …


&textn=x,y,Text

… argument snippet basis, adding “x” and “y” mantissa arrangement smarts with a “nothing” Text in our changed fourth draft image_venn.html Google Chart Image Chart Venn Chart or Scatter Chart or GraphViz Chart interfacing web application you can also try below.

Did you know?

Would you believe, at least to us, it is far less obvious how to display a straight line (that is perhaps not horizontal nor vertical) within a webpage, than it is to display a rectangle, filled or not?! Talk about irony! Over time, we have developed …

  • HTML hr elements (with a rotation) … and the less kludgy …
  • HTML div (defining a box with defined dimensions) for a nested SVG element containing the line definition using percentage dimensions

… in the past, for when we needed to do this. But, today, we’d like to thank this great webpage for its suggestion to involve linear gradients …


<style>

.crossedtotl {
background:
linear-gradient(to top left,
rgba(0,0,0,0) 0%,
rgba(0,0,0,0) calc(50% - 0.8px),
rgba(0,0,0,1) 50%,
rgba(0,0,0,0) calc(50% + 0.8px),
rgba(0,0,0,0) 100%);
}
.crossedtotr {
background:
linear-gradient(to top right,
rgba(0,0,0,0) 0%,
rgba(0,0,0,0) calc(50% - 0.8px),
rgba(0,0,0,1) 50%,
rgba(0,0,0,0) calc(50% + 0.8px),
rgba(0,0,0,0) 100%);
}
</style>

… in a, basically, CSS solution. Great stuff, thanks!


Previous relevant Google Chart Image Chart Scatter Chart Tutorial is shown below.

Google Chart Image Chart Scatter Chart Tutorial

Google Chart Image Chart Scatter Chart Tutorial

Today, we bring the Google Charts Image Chart

… making distributing “Venn Chart” hardcodings into a dropdown selectable arrangement, because there are more commonalities than differences, really, and we do like to parameterize … even in the shower, with a fairly loud rendition of this, perhaps.

Here is our framework for parameterization, here, and into the future


<title>Interfacing to Google Charts Image Chart Venn Chart or Scatter Chart - RJM Programming - November, 2023</title>
<script type=text/javascript>
var cht=location.search.split('cht=')[1] ? decodeURIComponent(location.search.split('cht=')[1].split('&')[0]) : "v";
var ctype=location.search.split('type=')[1] ? decodeURIComponent(location.search.split('type=')[1].split('&')[0]) : cht;
var cname=(ctype == 'v' ? 'Venn Chart' : (ctype == 's' ? 'Scatter Chart' : ''));
var cencodename=(ctype == 'v' ? 'Venn%20Diagram' : (ctype == 's' ? 'Scatter%20Chart' : ''));
var prenchtt=(ctype == 'v' ? '100,80,60,30,30,30,10' : (ctype == 's' ? '12,87,75,41,23,96,68,71,34,9|98,60,27,34,56,79,58,74,18,76|84,23,69,81,47,94,60,93,64,54' : ''));
var preachtt=(ctype == 'v' ? 'A|B|C' : (ctype == 's' ? 'Cats|Dogs' : ''));
var prechtt=(ctype == 'v' ? '&chd=t:' + prenchtt + '&chdl=' + preachtt : (ctype == 's' ? '&chd=t:' + prenchtt + '&chdl=' + preachtt + '&chxt=x,y' : ''));
var defchco=(ctype == 'v' ? 'ff0000,00ff00,0000ff' : (ctype == 's' ? 'FF0000|0000FF&chxt=x,y' : ''));
var promptone=(ctype == 'v' ? "Enter delimited values string for Venn Diagram such that ... " + String.fromCharCode(10) + "The first three values specify the sizes of three circles: A, B, & C. For chart with only two circles, specify zero for the third value." + String.fromCharCode(10) + "The fourth value specifies the size of the intersection of A and B." + String.fromCharCode(10) + "The fifth value specifies the size of the intersection of A and C. For a chart with only two circles, do not specify a value here." + String.fromCharCode(10) + "The sixth value specifies the size of the intersection of B and C. For a chart with only two circles, do not specify a value here." + String.fromCharCode(10) + "The seventh value specifies the size of the common intersection of A, B, and C. For a chart with only two circles, do not specify a value here." + String.fromCharCode(10) + String.fromCharCode(10) + "" : (ctype == 's' ? "Enter delimited values string for Scatter Chart" : ""));
var oneprompt=(ctype == 'v' ? "Enter delimited values string for your Venn Diagram collaborations, optionally, such that ... " + String.fromCharCode(10) + "The first three values specify the sizes of three circles: A, B, & C. For chart with only two circles, specify zero for the third value." + String.fromCharCode(10) + "The fourth value specifies the size of the intersection of A and B." + String.fromCharCode(10) + "The fifth value specifies the size of the intersection of A and C. For a chart with only two circles, do not specify a value here." + String.fromCharCode(10) + "The sixth value specifies the size of the intersection of B and C. For a chart with only two circles, do not specify a value here." + String.fromCharCode(10) + "The seventh value specifies the size of the common intersection of A, B, and C. For a chart with only two circles, do not specify a value here." + String.fromCharCode(10) + String.fromCharCode(10) + "" : (ctype == 's' ? "Enter delimited values string for Scatter Chart" : ""));

// etcetera etcetera etcetera

… but, as you can imagine, there will probably be small retweaks of this arrangement, which is holding out okay so far for Scatter Charts in our changed third draft image_venn.html Google Chart Image Chart Venn Chart or Scatter Chart interfacing web application you can also try below.

Did you know?

In this online world with so many platforms and devices and software choices, there is no need to ever be embarrassed by what might seem an obvious feature you’ve missed.

Take the way on macOS, but not iOS, using a web browser to get to YouTube, you can flag that a video should loop. Especially good for …

  • song obsessions …
  • earworms you need to salve

… and what about if your shower is taking an awfully long time?! Please be careful with moisture and devices, though, in the bathroom!

How does it happen? Right click the play button, and looping is there as the top option. Now back to that shower song obsession.


Previous relevant Google Chart Image Chart Venn Chart User Text Tutorial is shown below.

Google Chart Image Chart Venn Chart User Text Tutorial

Google Chart Image Chart Venn Chart User Text Tutorial

We think a way to improve on our interfacing web application start regarding yesterday’s Google Chart Image Chart Venn Chart Interfacing Primer Tutorial would be to offer the user the chance to enter their own text onto the Venn Diagrams …

But we would say that.

… given what we learnt in Primary school … or should we say …

“Gryffindor Slytherin Ravenclaw Hufflepuff Junior Business College”

… and, yes, is that you, Aoife? What did you want to point out? After you swallow those Rice Bubbles, that is?! Class is waiting …

.
.
.
.
.
.
.
.
.
.
.
.
.
.
.
.
.
.
.
.
.
.
.
.
.

Yes … miss something … and …

.
.
.
.
.
.
.
.
.
.
.
.
.
.
.
.
.
.
.
.
.
.
.
.
.

Use your words … okay … missing … don’t worry, the bus will wait … no … there’s no need to point … oh! …

… do you mean …

missing ewe … no … missing you … oh! … missing u … oh! … “Gryffindor Slytherin Ravenclaw Hufflepuff Juniour Business College” … quite so, Aiofe … 3 points for Hufflepuff!

Anyway we needed a fleshed out “function ask” to cater for potential onclick event logic catering for co-ordinates


function ask(evt) {
var answer='', answertherest='';
if (lasttext != '' && evt && normalcall) {
document.getElementById('ilp').placeholder='Enter text and later click place for it on Venn Diagram to left (line feed is ~~)';

elemLeft = document.getElementById('myvenn').offsetLeft;
elemTop = document.getElementById('myvenn').offsetTop;

if (evt.touches) {
if (evt.touches[0].pageX) {
x = evt.touches[0].pageX + document.body.scrollLeft - elemLeft;
y = evt.touches[0].pageY + document.body.scrollTop - elemTop;
} else {
x = evt.touches[0].clientX + document.body.scrollLeft - elemLeft;
y = evt.touches[0].clientY + document.body.scrollTop - elemTop;
}
} else if (evt.clientX || ev.clientY) {
x = evt.clientX + document.body.scrollLeft - elemLeft;
y = evt.clientY + document.body.scrollTop - elemTop;
} else {
x = evt.pageX + document.body.scrollLeft - elemLeft;
y = evt.pageY + document.body.scrollTop - elemTop;
}


document.getElementById('dtext').innerHTML+='<p style="position:absolute;font-size:10px;font-family:Arial;left:' + x + 'px;top:' + y + 'px;z-index:98;">' + lasttext + '</p>';

document.getElementById('aemail').href+='&text' + textnum + '=' + encodeURIComponent('' + x + ',' + y + ',') + encodeURIComponent(lasttext.replace(/\<br\>/g, String.fromCharCode(10)));
document.getElementById('asms').href+='&text' + textnum + '=' + encodeURIComponent('' + x + ',' + y + ',') + encodeURIComponent(lasttext.replace(/\<br\>/g, String.fromCharCode(10)));
arest+='&text' + textnum + '=' + encodeURIComponent('' + x + ',' + y + ',') + encodeURIComponent(lasttext.replace(/\<br\>/g, String.fromCharCode(10)));
therest+='&text' + textnum + '=' + encodeURIComponent('' + x + ',' + y + ',') + encodeURIComponent(lasttext.replace(/\<br\>/g, String.fromCharCode(10)));
asmsurl+='&text' + textnum + '=' + encodeURIComponent('' + x + ',' + y + ',') + encodeURIComponent(lasttext.replace(/\<br\>/g, String.fromCharCode(10)));
aemailurl+='&text' + textnum + '=' + encodeURIComponent('' + x + ',' + y + ',') + encodeURIComponent(lasttext.replace(/\<br\>/g, String.fromCharCode(10)));
document.getElementById('tdright').innerHTML="  <span id=spemail><a target=_blank href='mailto:?subject=My%20Venn%20Diagram%20...%20best%20viewed%20in%20landscape%20...&body=" + encodeURIComponent((document.getElementById('myvenn').src + arest).replace((document.getElementById('myvenn').src + arest).split('?')[0].split('#')[0], document.URL.split('?')[0].split('#')[0])) + "' id=aemail title=Email>&#128231;</a></span>      <span id=spsms><a target=_blank onmouseover=\"if (smsee.length == 0 && origsmsurl.indexOf('sms:&') != -1) { smsee=prompt('Please enter SMS number to send to.', ''); if (smsee == null) { smsee=''; } else { origsmsurl=origsmsurl.replace('sms:&','sms:' + smsee + '&'); asmsurl=asmsurl.replace('sms:&','sms:' + smsee + '&'); this.href=asmsurl; } }\" ontouchstart=\"if (smsee.length == 0 && origsmsurl.indexOf('sms:&') != -1) { smsee=prompt('Please enter SMS number to send to.', ''); if (smsee == null) { smsee=''; } else { origsmsurl=origsmsurl.replace('sms:&','sms:' + smsee + '&'); asmsurl=asmsurl.replace('sms:&','sms:' + smsee + '&'); this.href=asmsurl; } }\" href='sms:&body=" + encodeURIComponent((document.getElementById('myvenn').src + arest).replace(document.getElementById('myvenn').src.split('?')[0].split('#')[0], document.URL.split('?')[0].split('#')[0])) + "' id=asms title=SMS>&#128223;</a></span><br><br>  <input id=ilp onblur=\"lasttext=this.value.replace(/\~\~/g, '<br>'); this.value=''; this.placeholder='Click where you want ... ' + lasttext.replace(/\<br\>/g, String.fromCharCode(10)); mvp.setAttribute('content','initial-scale=1'); document.getElementById('myvenn').scrollIntoView();\" placeholder='Enter text and later click place for it on Venn Diagram to left (line feed is ~~)' type=text style=width:500px; value=''></input>";
//alert( document.getElementById('aemail').outerHTML );
//alert( document.getElementById('asms').outerHTML );
textnum++;
lasttext='';
} else if (!evt || !normalcall) {
if (chd == '') {
answer=prompt("Enter delimited values string for Venn Diagram such that ... " + String.fromCharCode(10) + "The first three values specify the sizes of three circles: A, B, & C. For chart with only two circles, specify zero for the third value." + String.fromCharCode(10) + "The fourth value specifies the size of the intersection of A and B." + String.fromCharCode(10) + "The fifth value specifies the size of the intersection of A and C. For a chart with only two circles, do not specify a value here." + String.fromCharCode(10) + "The sixth value specifies the size of the intersection of B and C. For a chart with only two circles, do not specify a value here." + String.fromCharCode(10) + "The seventh value specifies the size of the common intersection of A, B, and C. For a chart with only two circles, do not specify a value here." + String.fromCharCode(10) + String.fromCharCode(10) + "", (chd == '' ? "100,80,60,30,30,30,10" : (chd.replace('t:',''))));
} else {
answer=prompt("Enter delimited values string for your Venn Diagram collaborations, optionally, such that ... " + String.fromCharCode(10) + "The first three values specify the sizes of three circles: A, B, & C. For chart with only two circles, specify zero for the third value." + String.fromCharCode(10) + "The fourth value specifies the size of the intersection of A and B." + String.fromCharCode(10) + "The fifth value specifies the size of the intersection of A and C. For a chart with only two circles, do not specify a value here." + String.fromCharCode(10) + "The sixth value specifies the size of the intersection of B and C. For a chart with only two circles, do not specify a value here." + String.fromCharCode(10) + "The seventh value specifies the size of the common intersection of A, B, and C. For a chart with only two circles, do not specify a value here." + String.fromCharCode(10) + String.fromCharCode(10) + "", (chd == '' ? "100,80,60,30,30,30,10" : (chd.replace('t:',''))));
}
vals=[];
if (answer != null) {
answer=answer.trim();
if (answer.trim() != '') {
var delimis='';
for (var ii=0; ii<answer.length; ii++) {
if (delimis == '' && (answer.substring(ii).substring(0,1) < '0' || answer.substring(ii).substring(0,1) > '9')) {
delimis=answer.substring(ii).substring(0,1);
}
}
}
if (delimis != '') {
vals=answer.split(delimis);
}
if (vals.length == 6 || vals.length == 7) {
answertherest=prompt('Any optional legend or title argument snippets? Eg. &chdl=A|B|C&chtt=My%20Venn%20Diagram&chco=ff0000,00ff00,0000ff', therest);
if (answertherest == null) { answertherest=''; }
therest=answertherest.trim();
var aone=1;
var plotstring='';
var flds=[];
if (therest.indexOf('&text' + aone + '=') != -1) {
while (therest.indexOf('&text' + aone + '=') != -1) {
if (chd == '') {
plotstring=decodeURIComponent(therest.split('&text' + aone + '=')[1].split('&')[0]);
while (plotstring.indexOf(String.fromCharCode(10)) != -1) {
plotstring=plotstring.replace(String.fromCharCode(10), '<br>');
}
flds=plotstring.split(',');
if (eval('' + flds.length) >= 3) {
document.getElementById('dtext').innerHTML+='<p style="position:absolute;font-size:10px;font-family:Arial;left:' + flds[0] + 'px;top:' + flds[1] + 'px;z-index:98;">' + plotstring.split('' + flds[0] + ',' + flds[1] + ',')[1] + '</p>';
}
}
aone++;
textnum=aone;
}
}
//document.getElementById('myvenn').style.backgroundImage='URL(//www.rjmprogramming.com.au/ITblog/' + Math.min(550,window.innerWidth) + '/' + Math.min(350,window.innerHeight) + '/?cht=v&chd=t:' + encodeURIComponent(answer + therest) + ')';
document.getElementById('myvenn').src='//www.rjmprogramming.com.au/ITblog/' + Math.min(550,window.innerWidth) + '/' + Math.min(350,window.innerHeight) + '/?cht=v&chd=t:' + encodeURIComponent(answer) + therest + '';
if (document.getElementById('tdright').innerHTML == '') {
document.getElementById('tdright').innerHTML="  <span id=spemail><a target=_blank href='mailto:?subject=My%20Venn%20Diagram%20...%20best%20viewed%20in%20landscape%20...&body=" + encodeURIComponent((document.getElementById('myvenn').src + arest).replace(document.getElementById('myvenn').src.split('?')[0].split('#')[0], document.URL.split('?')[0].split('#')[0])) + "' id=aemail title=Email>&#128231;</a></span>      <span id=spsms><a target=_blank onmouseover=\"if (smsee.length == 0 && origsmsurl.indexOf('sms:&') != -1) { smsee=prompt('Please enter SMS number to send to.', ''); if (smsee == null) { smsee=''; } else { origsmsurl=origsmsurl.replace('sms:&','sms:' + smsee + '&'); asmsurl=asmsurl.replace('sms:&','sms:' + smsee + '&'); this.href=asmsurl; } }\" ontouchstart=\"if (smsee.length == 0 && origsmsurl.indexOf('sms:&') != -1) { smsee=prompt('Please enter SMS number to send to.', ''); if (smsee == null) { smsee=''; } else { origsmsurl=origsmsurl.replace('sms:&','sms:' + smsee + '&'); asmsurl=asmsurl.replace('sms:&','sms:' + smsee + '&'); this.href=asmsurl; } }\" href='sms:&body=" + encodeURIComponent((document.getElementById('myvenn').src + arest).replace(document.getElementById('myvenn').src.split('?')[0].split('#')[0], document.URL.split('?')[0].split('#')[0])) + "' id=asms title=SMS>&#128223;</a></span><br><br>  <input id=ilp onblur=\"lasttext=this.value.replace(/\~\~/g, '<br>'); this.value=''; this.placeholder='Click where you want ... ' + lasttext.replace(/\<br\>/g, String.fromCharCode(10));\" placeholder='Enter text and later click place for it on Venn Diagram to left (line feed is ~~)' type=text style=width:500px; value=''></input>";
}
} else {
alert('Try again.');
ask(null);
}
}
}
atstart=false;
normalcall=true;
}

… in our changed second draft image_venn.html Google Chart Image Chart Venn Chart interfacing web application you can also try below.

Did you know?

As far as this WordPress blog’s 404.php role goes in all this, we were keen to maintain Venn Diagrams that were purely image based data, because the web browser sharing mechanisms are so much better this way, else we were tempted to just construct a webpage HTML dataset positioning text in an absolute way with a Venn Chart background image. In order to do these purely image based Venn Diagrams we used PHP’s GD image library as per

<?php

if (strpos(('?' . $_SERVER['QUERY_STRING']), '?cht=') !== false || strpos(('?' . $_SERVER['QUERY_STRING']), '&cht=') !== false) {

$theqs=str_replace('??','?',('?' . $_SERVER['QUERY_STRING']));
if (strpos($theqs, '?chs=') === false && strpos($theqs, '&chs=') === false) {
$theqs='?chs=' . $newWidth . 'x' . $newHeight . '&' . explode('?', $theqs)[1];
}

if (strpos(('?' . $_SERVER['QUERY_STRING']), 'text1=') !== false) {
$theone=2;
$im = imagecreatefromstring(file_get_contents('ht
tp://chart.googleapis.com/chart' . explode('&text1=', $theqs)[0]));

if (7 == 7) {

$plotstring=str_replace('+',' ',urldecode($_GET['text1']));
$csv=explode(',', $plotstring);
$black = imagecolorallocatealpha($im, 1, 1, 1, 0);
if (sizeof($csv) >= 3) {
try {
if (function_exists('imagettftext')) {
if (explode('' . $csv[0] . ',' . $csv[1] . ',', $plotstring)[1] !== '') {
//echo explode('' . $csv[0] . ',' . $csv[1] . ',', $plotstring)[1];
//exit;
imagettftext($im, 10, 0, $csv[0], $csv[1], $black, realpath('arial.ttf'), explode('' . $csv[0] . ',' . $csv[1] . ',', $plotstring)[1]);
}
}
} catch (Exception $e) { }
while (isset($_GET['text' . $theone])) {
$plotstring=str_replace('+',' ',urldecode($_GET['text' . $theone]));
$csv=explode(',', $plotstring);
if (sizeof($csv) >= 3) {
try {
if (function_exists('imagettftext')) {
if (explode('' . $csv[0] . ',' . $csv[1] . ',', $plotstring)[1] !== '') {
imagettftext($im, 10, 0, $csv[0], $csv[1], $black, realpath('arial.ttf'), explode('' . $csv[0] . ',' . $csv[1] . ',', $plotstring)[1]);
}
}
} catch (Exception $e) { }
}
$theone++;
}
}

}


header('Content-Type: image/png');

imagepng($im);
imagedestroy($im);
} else {

header('Content-Type: image/png');
echo file_get_contents('http://chart.googleapis.com/chart' . $theqs);
}
exit;

}

?>


Previous relevant Google Chart Image Chart Venn Chart Interfacing Primer Tutorial is shown below.

Google Chart Image Chart Venn Chart Interfacing Primer Tutorial

Google Chart Image Chart Venn Chart Interfacing Primer Tutorial

So, moving on from Google Charts Image Chart Map Charts, today, let’s turn our attention to Google Charts Image Chart Venn Charts which we were dead set curious about given work we’d done in the past regarding Venn Diagrams, which we referenced when we presented Flowchart and Venn Diagram and Mind Map Token Subject Emoji Tutorial some time back. Gobsmackingly good is the Google approach, again, as you’d expect, but the approach covers different ground, so one feels one should go back to Primary School! You thought we were going to give away the answer to one of those security questions, didn’t you?! Didn’t you!?! Well, the answer is “Gryffindor Slytherin Ravenclaw Hufflepuff Junior Business College” … if you must know.

The sharing capabilities are good with the Google Charts approach too, given we are creating an HTML image, as our WordPress blog good ol’ 404.php has been woken up to address via …

<?php

if (strpos(('?' . $_SERVER['QUERY_STRING']), '?cht=') !== false || strpos(('?' . $_SERVER['QUERY_STRING']), '&cht=') !== false) {

$theqs=str_replace('??','?',('?' . $_SERVER['QUERY_STRING']));
if (strpos($theqs, '?chs=') === false && strpos($theqs, '&chs=') === false) {
$theqs='?chs=' . $newWidth . 'x' . $newHeight . '&' . explode('?', $theqs)[1];
}


header('Content-Type: image/png');
echo file_get_contents('http://chart.googleapis.com/chart' . $theqs);
exit;

}

?>

Yes, all these Image Chart smarts come, essentially, from a “one line” calling URL! Who’d have believed it! Shiver me timbers!

Well, it’s early days with this Venn Chart interfacing where we allow for …

  • circle (think up to three) definition … and the rest, in this first draft (hoping you’ve done some reading)
  • legend and title and colour selection user definitions dumped into a fairly unfriendly “the rest” Javascript prompt entry we ask of the user should they go ahead with the previous definition … and …
  • sharing and collaboration email and SMS functionality

… we hope you try via our “proof of concept” first draft image_venn.html Google Chart Image Chart Venn Chart interfacing web application you can also try below …


If this was interesting you may be interested in this too.


If this was interesting you may be interested in this too.


If this was interesting you may be interested in this too.


If this was interesting you may be interested in this too.


If this was interesting you may be interested in this too.


If this was interesting you may be interested in this too.


If this was interesting you may be interested in this too.


If this was interesting you may be interested in this too.


If this was interesting you may be interested in this too.


If this was interesting you may be interested in this too.


If this was interesting you may be interested in this too.


If this was interesting you may be interested in this too.


If this was interesting you may be interested in this too.


If this was interesting you may be interested in this too.


If this was interesting you may be interested in this too.


If this was interesting you may be interested in this too.


If this was interesting you may be interested in this too.


If this was interesting you may be interested in this too.


If this was interesting you may be interested in this too.


If this was interesting you may be interested in this too.


If this was interesting you may be interested in this too.


If this was interesting you may be interested in this too.


If this was interesting you may be interested in this too.


If this was interesting you may be interested in this too.

Posted in eLearning, Installers, Tutorials | Tagged , , , , , , , , , , , | Leave a comment

Nimh Game on AlmaLinux Revisit Tutorial

Nimh Game on AlmaLinux Revisit Tutorial

Nimh Game on AlmaLinux Revisit Tutorial

Yes, some of the games, such as Nimh, on RJM Programming, written a long time ago, have suffered going from (a more forgiving) CentOS environment PHP (starting with a 5) going to an AlmaLinux environment PHP (starting with an 8).

So, similarly to the error tracking of AlmaLinux TimeZone Places Associative Array Tutorial earlier, there we were chasing down …

  • associative array (especially $_GET[] and $_POST[]) code …
  • non initialized PHP variables used later, along with not enough “global” usage within PHP functions used …
  • perhaps deprecated PHP functions

… by and large.

All controllable, for us, either by …

  • error_log scouring … eg. note how big these Apache error_log files can get here …

    … or, much more …
  • web browser Web Inspector debugging

… but with that second approach debugging the inhouse Nimh game, as first cab off the rank, we were thrown by scenarios that went …

  • we’ve isolated a URL (with arguments) for the Nimh game (and isolate it for issues) …
  • we type that into a web browser address bar …
  • we get a blank webpage … and so we open …
  • the web browser Web Inspector …
  • Console tab and see no errors … and then …
  • clicking for Elements tab we see empty “body” element with a non-empty “head” element

… and we were thrown at that stage, used to PHP errors manifesting themselves with that “body” element. We woke up after a few minutes, and opened up that “head” element, and down the bottom of that element (similarly to the “body” element debugging) there was the latest PHP error needing to be attended to. Yayyyyy!! Panic averted!

From there, lots to do, indeed, but the debugging has a controlled feeling about it, realizing this can happen. Eventually … Nimh (don’t be the last to take a match)!


Previous relevant AlmaLinux TimeZone Places Associative Array Tutorial is shown below.

AlmaLinux TimeZone Places Associative Array Tutorial

AlmaLinux TimeZone Places Associative Array Tutorial

Have you been waiting for more “heads up” regarding issues we’ll have moving from a PHP (of a version starting with a 5) to a PHP (of a version starting with an 8)? Join the crowd?! But so far, it hasn’t been that bad. That is, until we started into looking at the PHP TimeZone functionalities. Going back to a previous time of referencing this, at the recent Google Charts Geo Chart Region Picker Conditional Positioning Tutorial, associative array based codelines like

<?php

$ourtz=new DateTimeZone($zzbit);
$ourtzgl=$ourtz->getLocation();
$versus=str_replace('"' . '' . '"];', '"' . $zzbit . '","' . '' . '"];', $versus);
$yourgl=explode(',',('' . implode(',',$ourtzgl)));
//$versus=str_replace('"' . ' ' . '"];', '"' . $ourtzgl[latitude] . '","' . ' ' . '"];', $versus);
//$versus=str_replace('"' . ' ' . '"];', '"' . $ourtzgl[longitude] . '","' . ' ' . '"];', $versus);
$versus=str_replace('"' . ' ' . '"];', '"' . $yourgl[1] . '","' . ' ' . '"];', $versus);
$versus=str_replace('"' . ' ' . '"];', '"' . $yourgl[2] . '","' . ' ' . '"];', $versus);


?>

… worked and meant codelines avoiding associative array logic, in favour of numerically indexed array thinking, like above (thanks to implode) were not needed then, on CentOS, but are needed now, in a redesign, on AlmaLinux, in the changed TimeZone Places (the old way) (and TimeZone Places (the new way)) tz_places.php PHP code.


Previous relevant Google Charts Geo Chart Region Picker Conditional Positioning Tutorial is shown below.

Google Charts Geo Chart Region Picker Conditional Positioning Tutorial

Google Charts Geo Chart Region Picker Conditional Positioning Tutorial

Because of the work at Curl HTTP Request Methods Tool Tutorial we can now …

  • conditionally (depending on the existence of the Google Charts Image Charts API) …
  • determine the positioning of Region Picker functionality elements

… further to yesterday’s Google Charts Geo Chart Region Picker Alignment Tutorial.

We start with non-mobile improving the positioning for the “letter breadcrumbs” and “middle dropdown” elements …


var imagechartthere=true;

function checkimagechart(iois) {
var eaconto = (iois.contentWindow || iois.contentDocument);
if (eaconto != null) {
if (eaconto.document) { eaconto = eaconto.document; }

if (eaconto.body.innerHTML.replace('Not Found','Error 404').replace(/^\<br\>\<\/p\>/g, 'Error 404').indexOf('Error 404') != -1) {
imagechartthere=false;
document.getElementById('myh3').style.left='' + eval(eval('' + screen.width) * 7 / 10) + 'px';
document.getElementById('myh3').style.top='' + eval('' + document.getElementById('myh3').getBoundingClientRect().bottom) + 'px';
setTimeout(function(){
document.getElementById('tdleft').style.backgroundPosition="right center";
}, 60000);
}

}
}
//
// and then later ...
//
setTimeout(function(){
if (!imagechartthere && document.getElementById('myh3')) {
document.getElementById('more').style.left='' + eval(-170 + eval(('' + document.getElementById('myh3').style.left).replace('px',''))) + 'px';
} else {
document.getElementById('more').style.left='' + eval(eval(360 * lastiizoom / 2) + eval('' + document.getElementById('more').style.left.replace('px',''))) + 'px';
}
}, 3000);

… working via the “client pre-emptive iframe” feeling …


<iframe style="display:none;" src="/PHP/http_methods.php?url=https%3A%2F%2Fchart.googleapis.com%2Fchart" onload="checkimagechart(this);"></iframe>

… along with making the opacity toggling of the country background SVG slightly more pronounced in the changed regions_via_countries.html Region Picker.

Did you know?

Ignoring the kludginess of codelines …


ipbit=ipbit.trim();
setTimeout(function(){ ipbit=ipbit.trim(); }, 5000);

… how do you think we arrived at the need to write the second line of code for our Region Picker? Goo … anyone, anyone?guffaw

Sir, could you repeat the question?

Goo … guffaw

Sir, could you repeat the question?

Goo … guffaw

Sir, could you repeat the question?

Goo … guffaw

Sir, could you repeat the question?

… Goo … well, anyone, anyone? … Google Chrome web inspector. Rings any bells?!
.
.
.
.
.
.
.
.
.
.
.
.
.
.
.
.
.
… Okay, see you tomorrow. But catch up on the debugging and “watch” of variables dynamically before tomorrow’s lesson …


Previous relevant Google Charts Geo Chart Region Picker Alignment Tutorial is shown below.

Google Charts Geo Chart Region Picker Alignment Tutorial

Google Charts Geo Chart Region Picker Alignment Tutorial

In our inhouse Region Picker we like the way the right hand webpage side involved some useful …


position: sticky;

… positioning, useful within the realms of what is going on on the right hand side.

But now we’re wanting some horizontal integration, linking commonalities of left and right regarding the country of interest, as a user’s eyes scan across the webpage, at pivotal times.

Our new Javascript functions to help, today, further to the recent Google Charts Geo Chart Region Picker Shading Tutorial


var glincode='';

function prebrize() {
if (glincode != '') {
document.getElementById('a' + glincode).scrollIntoView();
}
}

function brizetwo(pb, lincode) {
if (eval('' + lincode.length) == 2) {
glincode=lincode;
document.getElementById('a' + lincode).scrollIntoView();
setTimeout(function(){ document.getElementById('a' + lincode).scrollIntoView(); document.getElementById('mychart').style.paddingTop='' + document.body.scrollTop + 'px'; }, 6000);
}
return brize(pb);
}

function brize(pb) {
var torectx=null, vsrectx=null, aidis='';
var torectxtop=0;
if (eval('' + andynft.length) == 8) {
aidis='a' + andynft.split('title=')[1];
if (pb == '') {
torectx=document.getElementById(aidis).getBoundingClientRect();
if (document.getElementById('pspacer')) {
document.getElementById('pspacer').height='' + torectx.top + 'px';
} else if (document.getElementById('language')) {
document.getElementById('language').style.paddingTop='' + eval(eval('' + torectx.top) + eval('' + document.body.scrollTop)) + 'px';
} else if (document.getElementById(aidis) && document.getElementById('mychart')) {
document.getElementById('mychart').style.paddingTop='' + eval(eval('' + torectx.top) + eval('' + document.body.scrollTop)) + 'px';
}
} else {
if (document.getElementById(aidis) && document.getElementById('mychart')) {
torectx=document.getElementById(aidis).getBoundingClientRect();
vsrectx=document.getElementById('mychart').getBoundingClientRect();
document.getElementById('mychart').style.paddingTop='' + eval(eval('' + torectx.top) + eval('' + document.body.scrollTop) - eval('' + vsrectx.top)) + 'px';
return pb;
} else if (document.getElementById(aidis) && document.getElementById('language')) {
torectx=document.getElementById(aidis).getBoundingClientRect();
vsrectx=document.getElementById('language').getBoundingClientRect();
document.getElementById('language').style.paddingTop='' + eval(eval('' + torectx.top) + eval('' + document.body.scrollTop) - eval('' + vsrectx.top)) + 'px';
}
}
}
return pb;
}

… all feature the great [element].scrollIntoView() way to programmatically scroll, rather than use (the sometimes ignored) window.scrollTo([left],[top]); or location.href=’#[elementID]’; approaches. It has the advantage of not altering location.hash (if you see that as a plus). We’d rather not add complexity, so, yes, we prefer the [aCountryElement].scrollIntoView(); call approach, at those pivotal times. This accounts for the left hand side of the webpage agreeing to the right hand side’s vertical scroll position. But what about the other way around? There, we started applying a CSS padding-top property to relevant right hand side elements (via DOM [element].style.paddingTop=[pixelsToExtendDown]px;), at pivotal points in the programming flow.

And on double clicking a right hand side button to start creating those background Geo Chart SVG based “images” we turn on a progress cursor, at least for non-mobile platforms, because the user needs patience here, in the changed regions_via_countries.html Region Picker.


Previous relevant Google Charts Geo Chart Region Picker Shading Tutorial is shown below.

Google Charts Geo Chart Region Picker Shading Tutorial

Google Charts Geo Chart Region Picker Shading Tutorial

We have a few major improvements onto yesterday’s Google Charts Geo Chart Region Picker Nesting Tutorial‘s work …

  • shading of country in the Google Charts Geo Chart
  • addition of event logic for the “overlay/underlay/arriba” Google Charts Geo Chart incarnation … via Javascript DOM dynamic manipulation of Geo Chart z-index via …

    function reposition() {
    document.getElementById(gaid).style.display='block';
    var nrect=document.getElementById(gaid).getBoundingClientRect();
    document.getElementById(gulid).style.top='' + eval(eval('' + nrect.top) + eval('' + document.body.scrollTop)) + 'px';
    document.getElementById(gulid).style.left='' + eval(eval('' + nrect.left) + eval('' + document.body.scrollLeft)) + 'px';
    document.getElementById(gulid).style.width='' + nrect.width + 'px';
    document.getElementById(gulid).style.height='' + nrect.height + 'px';
    if (('' + document.getElementById(gulid).style.zIndex).indexOf('-') != -1) {
    document.getElementById(gulid).style.zIndex='' + ('' + document.getElementById(gulid).style.zIndex).replace('-','');
    } else {
    document.getElementById(gulid).style.zIndex='-' + ('' + document.getElementById(gulid).style.zIndex).replace('-','');
    }

    }

    … effectively toggling between “overlay” and “underlay” … arriba
  • oncontextmenu (ie. right click) means by which any clashing region name text can be “unclashed”

Codewise, this needed ..

… with WordPress blog 404.php helper changes as per …

<?php

function yourfile_get_contents($wone) { //, $ucc, $ctname) {
global $geomapurl, $getmapdata, $iso_country_codes; // <a href="/wiki/Autonomous_Republic_of_Crimea" title="Autonomous Republic of Crimea">Avtonomna Respublika Krym</a>
// %20[51.4769|-0.0005|~From~,2]%20,%20[51.4769|-0.0005|~To~,2]%20,
// <img style="z-index:25;" onload=" return true; " id="ici" data-onmouseout="this.title=origtitle;" onmousemove=" if (isclear || 1 == 1) { document.getElementById('moimode').value='mouseover'; filloutform(event,0); }" src="//www.rjmprogramming.com.au/ITblog/455/350/?cht=map&chld=AF|AF-BDG|AF-BGL|AF-BAL|AF-BAM|AF-DAY|AF-FRA|AF-FYB|AF-GHA|AF-GHO|AF-HEL|AF-HER|AF-JOW|AF-KAB|AF-KAN|AF-KAP|AF-KHO|AF-KNR|AF-KDZ|AF-LAG|AF-LOG|AF-NAN|AF-NIM|AF-NUR|AF-PKA|AF-PIA|AF-PAN|AF-PAR|AF-SAM|AF-SAR|AF-TAK|AF-URU|AF-WAR|AF-ZAB|&chco=B3BCC0|5781AE|FF0000|FFC726|885E80|518274|A3BCC0|4781AE|EF0000|EFC726|785E80|418274|7ccdef|e65814|477b73|87f592|ed75f2|09526e|27a51c|58c662|4b4840|7d01b5|f6a557|b69f63|cac10b|f3e9ab|26192c|ad7629|3b21b4|7238ab|aa1e07|23f0d7|d8dfb3|8c07c2|7a5bbf|b0ee12&screenheight=900" title="Optionally click in relevant region for menu">
if (file_exists('../HTMLCSS/rvc_' . my_s_s_server_remote_addr() . '.html')) {
sleep(5);
unlink('../HTMLCSS/rvc_' . my_s_s_server_remote_addr() . '.html');
}
$iso_underscore=false;
$ucc='';
$ctname='';
$okwone='';
$ones=[];
if (strpos($wone, 'chld=') === false) {
return @file_get_contents($wone);
} else if (1 == 1 || strpos($wone, 'screenheight=') !== false) {
$ucc=strtoupper(trim(explode('_', explode('|', explode('chld=', $wone)[1])[0])[0]));
for ($ire=0; $ire<sizeof($iso_country_codes); $ire+=2) {
if ($ucc == strtoupper($iso_country_codes[$ire])) {
$ctname=$iso_country_codes[1 + $ire];
}
}
$okwone=file_get_contents($wone);
$wone='http://en.wikipedia.org/wiki/ISO_3166-2:' . $ucc;
}
if (strlen($ucc) != 2) {
return @file_get_contents($wone);
}
$tbit=$ucc . ';' . $ctname;
$geomapurl='';
$wpg='';
$ones=[];
$preurl='';
$saveducc=@file_get_contents('saveducc.txt');
$linfnd=explode($ucc . '=', $saveducc);
if (sizeof($linfnd) > 1) {
$geomapurl=explode("\n", $linfnd[1])[0];
}
file_put_contents('xcc.xcc', $tbit . ' ' . $wone);
if (strpos($wone, '/wiki/') !== false && strpos($wone, 'http') !== false) {
$preurl='http' . explode('/wiki/', explode('http', $wone)[-1 + sizeof(explode('http', $wone))])[0];
}
$one=file_get_contents($wone);
if ($geomapurl != '') {
sleep(9);
} else {
file_put_contents('xccone.xcc', $preurl . ' ... ' . $one);
if (strpos($one, ' sortable"') !== false && $preurl != '') {
$ones=explode('<a href="/wiki/', explode(' sortable"', explode("See also ", $one)[0])[1]);
} else if ($preurl != '') {
$ones=explode('<a href="/wiki/', explode("See also ", $one)[0]);
}

for ($ii=1; $ii<sizeof($ones); $ii++) {
if (!$iso_underscore) {
$rname=explode('<', explode('>', $ones[$ii])[1])[0];
if (substr(($rname . ' '),0,3) == 'ISO') { $iso_underscore=true; }
if ($ii == 1) {
file_put_contents('xccuccit.xcc', $ucc . ' - ' . $rname . "\n");
}
if (trim($rname) != '') {
file_put_contents('xccu.xcc', $preurl . '/wiki/' . explode('"', $ones[$ii])[0]);
$wpg=file_get_contents($preurl . '/wiki/' . explode('"', $ones[$ii])[0]);
$rname=str_replace('_',' ',explode('"', $ones[$ii])[0]);
file_put_contents('xccuc.xcc', $wpg);
$wpgs=explode(' class="geo">', $wpg);
if (sizeof($wpgs) > 1) {
file_put_contents('xccuu.xcc', $preurl . '/wiki/' . explode('"', $ones[$ii])[0]);
$ltlg=str_replace(' ','',str_replace(';',',',explode('<', $wpgs[1])[0]));
file_put_contents('xccuuu.xcc', $ltlg);
if ($geomapurl != '') { $geomapurl.=','; }
$geomapurl.=str_replace("%27","+","%20[" . str_replace(',','|',$ltlg) . '|~' . str_replace("%27","+",str_replace('%27~','~',urlencode($rname) . '~')) . ',2]%20');
file_put_contents('xcz.xc', $geomapurl);
file_put_contents('xccuccit.xcc', file_get_contents('xccuccit.xcc') . $ii . ' : ' . str_replace("%27","+","%20[" . str_replace(',','|',$ltlg) . '|~' . str_replace("%27","+",str_replace('%27~','~',urlencode($rname) . '~')) . ',2]%20') . "\n");
} else {
file_put_contents('xccuccit.xcc', file_get_contents('xccuccit.xcc') . $ii . ' ; ' . explode('"', $ones[$ii])[0] . "\n");
}
}
}
}
}

if ($geomapurl != '') {
if (sizeof($linfnd) <= 1) {
file_put_contents('saveducc.txt', $saveducc . $ucc . '=' . $geomapurl . "\n");
}
file_put_contents('xc.xc', $geomapurl);
if (strlen('/PHP/GeoChart/geo_chart.php#onclick=y&retsvg=y&overlay=a' . $ucc . '&text=text&wouldlikeyoutoseekpermission=y&width=834&height=520&country=Places&popularity=&aregeographicals=y&title=' . urlencode($tbit) . '&data=' . $geomapurl) < 850) {
file_put_contents('../HTMLCSS/rvc_' . my_s_s_server_remote_addr() . '.html', '<html><head><scri' . 'pt type=text/javascript> var aconto=null; function flowthrough(iois) { aconto = (iois.contentWindow || iois.contentDocument); if (aconto != null) { if (aconto.document) { aconto = aconto.document; } } if (window.opener) { if (window.opener.setifrmoreacontochild) { window.opener.setifrmoreacontochild(aconto); } } } </scr' . 'ipt></head><body><iframe onload=flowthrough(this); style=width:98%;height:98%; src="/PHP/GeoChart/geo_chart.php#onclick=y&retsvg=y&overlay=a' . $ucc . '&shade=' . $ucc . '&iso=' . $ucc . '&text=text&wouldlikeyoutoseekpermission=y&width=834&height=520&country=Places&popularity=&aregeographicals=y&title=' . urlencode($tbit) . '&data=' . unduplicate($geomapurl) . '"></iframe></body></html>');
} else {
file_put_contents('../HTMLCSS/rvc_' . my_s_s_server_remote_addr() . '.html', '<html><head><scri' . 'pt type=text/javascript> var aconto=null; function flowthrough(iois) { aconto = (iois.contentWindow || iois.contentDocument); if (aconto != null) { if (aconto.document) { aconto = aconto.document; } } if (window.opener) { if (window.opener.setifrmoreacontochild) { window.opener.setifrmoreacontochild(aconto); } } } </scr' . 'ipt></head><body><iframe onload=flowthrough(this); style=width:98%;height:98%; src="/PHP/GeoChart/geo_chart.php#onclick=y&retsvg=y&overlay=a' . $ucc . '&shade=' . $ucc . '&iso=' . $ucc . '&text=text&wouldlikeyoutoseekpermission=y&width=834&height=520&country=Places&popularity=&aregeographicals=y&title=' . urlencode($tbit) . '&data=' . unduplicate($geomapurl) . '"></iframe></body></html>');
}

// '<html><body><iframe style=width:98%;height:98%; src="/PHP/GeoChart/geo_chart.php#onclick=y&text=text&wouldlikeyoutoseekpermission=y&width=834&height=520&country=Places&popularity=&aregeographicals=y&title=' . urlencode($tbit) . '&data=' . $geomapurl . '"></iframe></body></html>');
//if (file_exists('../rvc_' . my_s_s_server_remote_addr() . '.html')) {
// sleep(35);
// unlink('../rvc_' . my_s_s_server_remote_addr() . '.html');
//}
}

return $okwone;
}

function unduplicate($inbn) {
$outbn=$inbn;
$thiso='';
$sofarfound=';';
$outbs=explode('|~', $inbn);
for ($iout=1; $iout<sizeof($outbs); $iout++) {
$thiso=explode('~', $outbs[$iout])[0];
if (strpos($sofarfound, ';' . $thiso . ';') !== false) {
$youtbs=explode('|~' . $thiso . '~', $outbn);
for ($jout=2; $iout<sizeof($youtbs); $jout++) {
$outbn=str_replace('~' . $thiso . '~' . $youtbs[$jout], '~' . '~' . $youtbs[$jout], $outbn);
}
} else {
$sofarfound.=$thiso . ';';
}
}
return $outbn;
}

?>


Previous relevant Google Charts Geo Chart Region Picker Nesting Tutorial is shown below.

Google Charts Geo Chart Region Picker Nesting Tutorial

Google Charts Geo Chart Region Picker Nesting Tutorial

It was really our inhouse Region Picker web application we had in mind behind the “create a map background” motivations of yesterday’s Google Charts Geo Chart Nesting Tutorial.

We found trying the …

  • background-image:url(‘data:image/svg+xml;utf8, blahde blah ‘); nor background-image:url(‘data:image/svg+xml;base64, blahde blah ‘); ideas were not working for us … but today, we started to try …
  • overlay HTML div position:absolute; opacity:0.5; z-index:-4; …
    the changed geo_chart.php Geo Chart creating the new “as if background image” Google Charts Geo Chart …
    <?php echo ”

    function ovmap(winobj, goodid, goodrect, thesvg) {
    // contain svg opacity z-index ul next to aXX display property of that ul determines pre-click
    var jgeo='doverlay';
    //alert(987);
    if (winobj.document.getElementById(jgeo)) {
    winobj.document.getElementById(jgeo).style.position='absolute';
    winobj.document.getElementById(jgeo).style.top='' + goodrect.top + 'px';
    winobj.document.getElementById(jgeo).style.left='' + goodrect.left + 'px';
    winobj.document.getElementById(jgeo).style.width='' + goodrect.width + 'px';
    winobj.document.getElementById(jgeo).style.height='' + goodrect.height + 'px';
    winobj.document.getElementById(jgeo).style.opacity='0.5';
    winobj.document.getElementById(jgeo).style.zIndex='-4';
    winobj.document.getElementById(jgeo).style.display='block';
    //winobj.document.getElementById(jgeo).innerHTML=thesvg.replace(/\#ffffff/g,'transparent').replace(/white/g,'transparent');
    winobj.document.getElementById(jgeo).innerHTML=winobj.bsvg(jgeo, goodid, window.self, thesvg.replace(/\#ffffff/g,'transparent').replace(/white/g,'transparent'));
    }
    }

    “; ?>
    … used by the changed regions_via_countries.html Region Picker

    var gulid='', gchildwin=null, gulbsvg='', gaid='';

    var gulid='', gchildwin=null, gulbsvg='', gaid='';

    function setifrmoreacontochild(what) {
    ifrmoreacontochild=what;
    }

    function getifrmoreacontochild() {
    return ifrmoreacontochild;
    }

    function reposition() {
    document.getElementById(gaid).style.display='block';
    var nrect=document.getElementById(gaid).getBoundingClientRect();
    document.getElementById(gulid).style.top='' + nrect.top + 'px';
    document.getElementById(gulid).style.left='' + nrect.left + 'px';
    document.getElementById(gulid).style.width='' + nrect.width + 'px';
    document.getElementById(gulid).style.height='' + nrect.height + 'px';
    }

    function bsvg(ulid, aid, childwin, ulbsvg) {
    gulid=ulid;
    gchildwin=childwin;
    gulbsvg=ulbsvg;
    if (gaid == '') {
    setInterval(reposition, 3000);
    }
    gaid=aid;
    //alert('svg is ' + ulbsvg);
    //alert(ifrmoreaconto.body.innerHTML);
    if (ifrmoreacontochild) {
    //alert('child there');
    if (ifrmoreacontochild.getElementById('chart_div')) {
    //alert('child svg there');
    //alert('will apply ' + '')[0].split('')[0].split('');
    setTimeout(function(){ document.getElementById(gulid).innerHTML='')[0].split('')[0].split(''; }, 9000);
    }
    }
    return ulbsvg;
    }
    … helped out by an improved this WordPress blog 404.php”not found” processor
    <?php

    if (strlen('/PHP/GeoChart/geo_chart.php#onclick=y&retsvg=y&overlay=a' . $ucc . '&text=text&wouldlikeyoutoseekpermission=y&width=834&height=520&country=Places&popularity=&aregeographicals=y&title=' . urlencode($tbit) . '&data=' . $geomapurl) < 850) {
    file_put_contents('../HTMLCSS/rvc_' . my_s_s_server_remote_addr() . '.html', '<html><head><scri' . 'pt type=text/javascript> var aconto=null; function flowthrough(iois) { aconto = (iois.contentWindow || iois.contentDocument); if (aconto != null) { if (aconto.document) { aconto = aconto.document; } } if (window.opener) { if (window.opener.setifrmoreacontochild) { window.opener.setifrmoreacontochild(aconto); } } } </scr' . 'ipt></head><body><iframe onload=flowthrough(this); style=width:98%;height:98%; src="/PHP/GeoChart/geo_chart.php#onclick=y&retsvg=y&overlay=a' . $ucc . '&text=text&wouldlikeyoutoseekpermission=y&width=834&height=520&country=Places&popularity=&aregeographicals=y&title=' . urlencode($tbit) . '&data=' . $geomapurl . '"></iframe></body></html>');
    } else {
    file_put_contents('../HTMLCSS/rvc_' . my_s_s_server_remote_addr() . '.html', '<html><head><scri' . 'pt type=text/javascript> var aconto=null; function flowthrough(iois) { aconto = (iois.contentWindow || iois.contentDocument); if (aconto != null) { if (aconto.document) { aconto = aconto.document; } } if (window.opener) { if (window.opener.setifrmoreacontochild) { window.opener.setifrmoreacontochild(aconto); } } } </scr' . 'ipt></head><body><iframe onload=flowthrough(this); style=width:98%;height:98%; src="/PHP/GeoChart/geo_chart.php#onclick=y&retsvg=y&overlay=a' . $ucc . '&text=text&wouldlikeyoutoseekpermission=y&width=834&height=520&country=Places&popularity=&aregeographicals=y&title=' . urlencode($tbit) . '&data=' . $geomapurl . '"></iframe></body></html>');
    }

    ?>

… with more success.

We can’t remember a “foreground overlay” scenario so resembling a “background image feeling” end result, the transparent colour introduced into the Google Charts Geo Chart SVG being crucial to help make this all work.


Previous relevant Google Charts Geo Chart Nesting Tutorial is shown below.

Google Charts Geo Chart Nesting Tutorial

Google Charts Geo Chart Nesting Tutorial

Today we’re working on more Google Charts Geo Chart inhouse web application interfacer functionality other web applications might be able to make use of … “tool” functionality, if you will.

We want to be able to control the way a Google Charts Geo Chart can be nested within an HTML div element, for instance. We started the day wanting to be able to make …

  • a Google Charts Geo Chart be a background image to a div element … alas, on this first draft we couldn’t get there (but will continue with the research here) … whereas we succeeded …
  • adding the Google Charts Geo Chart interfacer’s resultant SVG data as the innerHTML (ie. content) …
    <?php echo ”

    function newbackin() {
    if (dmyxhr.readyState == 4) {
    if (dmyxhr.status == 200) {
    if (dmyxhr.responseText) {
    var m_t='image/jpeg';
    var h_t='179';
    var w_t='320';
    var dbits = dmyxhr.responseText.split('\"height\": ');
    if (dbits.length > 1) {
    h_t=dbits[1].split(',')[0].split(String.fromCharCode(10))[0].split('}')[0].trim();
    }
    dbits = dmyxhr.responseText.split('\"mime_type\": \"');
    if (dbits.length > 1) {
    m_t=dbits[1].split('\"')[0];
    }
    dbits = dmyxhr.responseText.split('\"width\": ');
    if (dbits.length > 1) {
    w_t=dbits[1].split(',')[0].split(String.fromCharCode(10))[0].split('}')[0].trim();
    }
    dbits = dmyxhr.responseText.split('\"data\":');
    dbits = dmyxhr.responseText.split('\"data\":');
    if (dbits.length > 1) {
    // replace all '_' with '/' and all '-' with '+' thanks to https://stackoverflow.com/questions/757675/website-screenshots
    dgsbi='<img alt=\"Blog Posting Image\" style=\"width:' + w_t + 'px;height:' + h_t + 'px;\" width=' + w_t + ' height=' + h_t + ' src=\"data:' + m_t + ';base64,' + dbits[1].split('\"')[1].split('\"')[0].replace(/\_/g,'/').replace(/\-/g,'+') + '\"></img>';
    //alert('dgsbi=' + dgsbi);
    }
    }
    }
    }
    }

    function ajaxit(urlin) {
    if (urlin.length > 0) {
    aurl=urlin;
    if (window.XMLHttpRequest) {
    dmyxhr = new window.XMLHttpRequest;
    }
    else {
    try {
    dmyxhr = new ActiveXObject('Msxml2.XMLHTTP');
    } catch (othermicrosoft) {
    try {
    dmyxhr = new ActiveXObject('Microsoft.XMLHTTP');
    } catch (failed) {
    dmyxhr = false;
    }
    }
    }
    var xurl = 'https://www.googleapis.com/pagespeedonline/v1/runPagespeed?url=' + encodeURIComponent(urlin) + '&screenshot=true';
    if (dmyxhr) {
    dmyxhr.onreadystatechange = newbackin;
    dmyxhr.open('GET', xurl, true);
    dmyxhr.send(null);
    }
    }
    }

    function wbtoa(instris) {
    var outstris=instris;
    while (outstris.indexOf(String.fromCharCode(10)) != -1) {
    outstris=outstris.replace(String.fromCharCode(10),'');
    }
    var xzs=prompt(outstris, outstris);
    return outstris.replace(/\\\"/g, \"'\");
    }


    function svgret(swhat) {
    var igeo='georeceiver', aspfactor=1.0, swis=-1, shis=-1, whrect=null;
    var newswis=-1, newshis=-1, cswis=' ', cshis=' ', newcswis=' ', newcshis=' ', whdelim='';
    var newercswis=' width=' + whdelim + '100%' + whdelim;
    var newercshis=' height=' + whdelim + '100%' + whdelim;
    var cswistwo=' ', cshistwo=' ', newcswistwo=' ', newcshistwo=' ';
    var retsvg=(location.search + ('' + location.hash).replace(/^null/g,'').replace(/^undefined/g,'').replace(/^\#/g,'&')).split('retsvg=')[1] ? (decodeURIComponent((location.search + ('' + location.hash).replace(/^null/g,'').replace(/^undefined/g,'').replace(/^\#/g,'&')).split('retsvg=')[1].split('&')[0])) : ' ';
    if (retsvg != ' ') {
    if (swhat.indexOf('<svg') != -1 && swhat.indexOf('</s' + 'vg>') != -1) {
    var candidate=false;
    if (swhat.indexOf(' width=') != -1 && swhat.indexOf(' height=') != -1) {
    if (swhat.split(' width=')[1].substring(0,1) < '0') {
    whdelim=swhat.split(' width=')[1].substring(0,1);
    cswis=' width=' + swhat.split(' width=')[1].split(' ')[0].split('>')[0];
    cshis=' height=' + swhat.split(' height=')[1].split(' ')[0].split('>')[0];
    newcswis=cswis;
    newcshis=cshis;
    swis=eval('' + swhat.split(' width=')[1].substring(1).split(swhat.split(' width=')[1].substring(0,1))[0]);
    shis=eval('' + swhat.split(' height=')[1].substring(1).split(swhat.split(' height=')[1].substring(0,1))[0]);
    } else {
    cswis=' width=' + swhat.split(' width=')[1].split(' ')[0].split('>')[0];
    cshis=' height=' + swhat.split(' width=')[1].split(' ')[0].split('>')[0];
    newcswis=cswis;
    newcshis=cshis;
    swis=eval('' + swhat.split(' width=')[1].split(' ')[0].split('>')[0]);
    shis=eval('' + swhat.split(' height=')[1].split(' ')[0].split('>')[0]);
    }
    }
    if (window.opener && !candidate) {
    if (window.opener.document.getElementById(igeo)) {
    candidate=true;
    if (('' + window.opener.document.getElementById(igeo).value).replace('undefined','').replace('null','') != '') {
    igeo=window.opener.document.getElementById(igeo).value;
    }
    if (cswis.trim() != '') {
    whrect=window.opener.document.getElementById(igeo).getBoundingClientRect();
    // 2000 x 2500 to fit into 800 x 654
    if (eval(swis / eval('' + whrect.width)) < eval(shis / eval('' + whrect.height))) {
    aspfactor=eval(eval('' + whrect.width) / swis);
    cswistwo='&width=' + ('' + swis).split('.')[0];
    cshistwo='&height=' + ('' + shis).split('.')[0];
    newcswistwo='&width=' + Math.floor(eval(swis * aspfactor));
    newcshistwo='&height=' + Math.floor(eval(shis * aspfactor));
    newcswis=' width=' + whdelim + eval(swis * aspfactor) + whdelim;
    newcshis=' height=' + whdelim + eval(shis * aspfactor) + whdelim;
    } else {
    aspfactor=eval(eval('' + whrect.height) / shis);
    cswistwo='&width=' + ('' + swis).split('.')[0];
    cshistwo='&height=' + ('' + shis).split('.')[0];
    newcswistwo='&width=' + Math.floor(eval(swis * aspfactor));
    newcshistwo='&height=' + Math.floor(eval(shis * aspfactor));
    newcswis=' width=' + whdelim + eval(swis * aspfactor) + whdelim;
    newcshis=' height=' + whdelim + eval(shis * aspfactor) + whdelim;
    }
    }
    if (('' + window.opener.document.getElementById(igeo).outerHTML).indexOf('background') != -1) {
    window.opener.document.getElementById(igeo).style.backgroundSize='cover';
    window.opener.document.getElementById(igeo).style.backgroundRepeat='no-repeat';

    window.opener.document.getElementById(igeo).style.backgroundImage='URL(`data:image/svg+xml;utf8,' + wbtoa('<svg viewBox=\"0 0 ' + Math.floor(eval(swis * aspfactor)) + ' ' + Math.floor(eval(shis * aspfactor)) + '\" ' + swhat.split('</s' + 'vg>')[0].split('<svg')[eval(-1 + swhat.split('</s' + 'vg>')[0].split('<svg').length)].replace(/\#ffffff/g,'white').replace(/\#000000/g,'black').replace(/\#cccccc/g,'gray').replace(/\#dddddd/g,'silver').replace(/\#_ABSTRACT_RENDERER_ID_2/g,'').replace(/\#_ABSTRACT_RENDERER_ID_1/g,'').replace(/\#109618/g,'green').replace(/\#f5f5f5/g,'lightgray').replace('hidden;','visible;').replace(cswistwo,newcswistwo).replace(cshistwo,newcshistwo) + '</s' + 'vg>') + '`)';
    if (('' + window.opener.document.getElementById(igeo).outerHTML).indexOf('none;') != -1) {
    window.opener.document.getElementById(igeo).style.display='block';
    }
    } else if (('' + window.opener.document.getElementById(igeo).innerHTML) == '' || ('' + window.opener.document.getElementById(igeo).innerHTML).indexOf('<svg') == 0) {
    //window.opener.document.getElementById(igeo).innerHTML='<svg viewBox=\"0 0 ' + Math.floor(eval(swis * aspfactor)) + ' ' + Math.floor(eval(shis * aspfactor)) + '\" ' + swhat.split('</s' + 'vg>')[0].split('<svg')[eval(-1 + swhat.split('</s' + 'vg>')[0].split('<svg').length)].replace(/\#ffffff/g,'white').replace(/\#000000/g,'black').replace(/\#cccccc/g,'gray').replace(/\#dddddd/g,'silver').replace(/\#_ABSTRACT_RENDERER_ID_2/g,'').replace(/\#_ABSTRACT_RENDERER_ID_1/g,'').replace(/\#109618/g,'green').replace(/\#f5f5f5/g,'lightgray').replace('hidden;','visible;').replace(cswistwo,newcswistwo).replace(cshistwo,newcshistwo).replace(cswis,newercswis).replace(cshis,newercshis).replace(cswis,newcswis).replace(cshis,newcshis).replace(cswis,newcswis).replace(cshis,newcshis).replace(cswis,newcswis).replace(cshis,newcshis).replace(cswis,newcswis).replace(cshis,newcshis) + '</s' + 'vg>';
    window.opener.document.getElementById(igeo).innerHTML='<svg viewBox=\"0 0 ' + Math.floor(eval(swis * aspfactor)) + ' ' + Math.floor(eval(shis * aspfactor)) + '\" ' + swhat.split('</s' + 'vg>')[0].split('<svg')[eval(-1 + swhat.split('</s' + 'vg>')[0].split('<svg').length)].replace(/\#ffffff/g,'#ffffff').replace(/\#000000/g,'#000000').replace(/\#cccccc/g,'#cccccc').replace(/\#dddddd/g,'#cccccc').replace(/\#_ABSTRACT_RENDERER_ID_2/g,'#_ABSTRACT_RENDERER_ID_2').replace(/\#_ABSTRACT_RENDERER_ID_1/g,'#_ABSTRACT_RENDERER_ID_1').replace(/\#109618/g,'#109618').replace(/\<text/g,'<!--text').replace(/\<\/text\>/g,'</text-->').replace(/\#f5f5f5/g,'#e5e5e5').replace('hidden;','visible;').replace(cswistwo,newcswistwo).replace(cshistwo,newcshistwo).replace(cswis,newercswis).replace(cshis,newercshis).replace(cswis,newcswis).replace(cshis,newcshis).replace(cswis,newcswis).replace(cshis,newcshis).replace(cswis,newcswis).replace(cshis,newcshis).replace(cswis,newcswis).replace(cshis,newcshis) + '</s' + 'vg>';
    if (('' + window.opener.document.getElementById(igeo).outerHTML).indexOf('none;') != -1) {
    window.opener.document.getElementById(igeo).style.display='block';
    }
    }
    }
    }

    if (window.parent && !candidate) {
    if (window.parent.document.getElementById(igeo)) {
    candidate=true;
    if (('' + window.parent.document.getElementById(igeo).value).replace('undefined','').replace('null','') != '') {
    igeo=window.parent.document.getElementById(igeo).value;
    }
    if (cswis.trim() != '') {
    whrect=window.parent.document.getElementById(igeo).getBoundingClientRect();
    // 2000 x 2500 to fit into 800 x 654
    if (eval(swis / eval('' + whrect.width)) < eval(shis / eval('' + whrect.height))) {
    aspfactor=eval(eval('' + whrect.width) / swis);
    cswistwo='width=' + ('' + swis).split('.')[0];
    cshistwo='height=' + ('' + shis).split('.')[0];
    newcswistwo='width=' + Math.floor(eval(swis * aspfactor));
    newcshistwo='height=' + Math.floor(eval(shis * aspfactor));
    //alert('cswistwo=' + cswistwo + ' and newcswistwo=' + newcswistwo);
    //if (swhat.indexOf(' clip-path=') != -1) {
    // alert(swhat.split(' clip-path=')[1].substring(0,400));
    //}
    newcswis=' width=' + whdelim + eval(swis * aspfactor) + whdelim;
    newcshis=' height=' + whdelim + eval(shis * aspfactor) + whdelim;
    } else {
    aspfactor=eval(eval('' + whrect.height) / shis);
    cswistwo='width=' + ('' + swis).split('.')[0];
    cshistwo='height=' + ('' + shis).split('.')[0];
    newcswistwo='width=' + Math.floor(eval(swis * aspfactor));
    newcshistwo='height=' + Math.floor(eval(shis * aspfactor));
    //alert('Cswistwo=' + cswistwo + ' and newcswistwo=' + newcswistwo);
    //if (swhat.indexOf(' clip-path=') != -1) {
    // alert(swhat.split(' clip-path=')[1].substring(0,400));
    //}
    newcswis=' width=' + whdelim + eval(swis * aspfactor) + whdelim;
    newcshis=' height=' + whdelim + eval(shis * aspfactor) + whdelim;
    }
    }
    if (('' + window.parent.document.getElementById(igeo).outerHTML).indexOf('background') != -1) {
    //ajaxit(document.URL);
    window.parent.document.getElementById(igeo).style.backgroundSize='cover';
    window.parent.document.getElementById(igeo).style.backgroundRepeat='no-repeat';


    //window.parent.document.getElementById(igeo).style.backgroundImage='URL(`data:image/svg+xml;utf8,' + wbtoa('<svg viewBox=\"0 0 ' + Math.floor(eval(swis * aspfactor)) + ' ' + Math.floor(eval(shis * aspfactor)) + '\" ' + swhat.split('</s' + 'vg>')[0].split('<svg')[eval(-1 + swhat.split('</s' + 'vg>')[0].split('<svg').length)].replace(/\#ffffff/g,'white').replace(/\#000000/g,'black').replace(/\#cccccc/g,'gray').replace(/\#dddddd/g,'silver').replace(/\#_ABSTRACT_RENDERER_ID_2/g,'').replace(/\#_ABSTRACT_RENDERER_ID_1/g,'').replace(/\#109618/g,'green').replace(/\#f5f5f5/g,'lightgray').replace('hidden;','visible;').replace(cswistwo,newcswistwo).replace(cshistwo,newcshistwo) + '</s' + 'vg>') + '`)';
    //alert('URL(\"data:image/svg+xml;utf8,' + (wbtoa('<svg viewBox=\"0 0 ' + Math.floor(eval(swis * aspfactor)) + ' ' + Math.floor(eval(shis * aspfactor)) + '\" ' + swhat.split('</s' + 'vg>')[0].split('<svg')[eval(-1 + swhat.split('</s' + 'vg>')[0].split('<svg').length)].replace(/\#ffffff/g,'white').replace(/\#000000/g,'black').replace(/\#cccccc/g,'gray').replace(/\#dddddd/g,'silver').replace(/\#_ABSTRACT_RENDERER_ID_2/g,'').replace(/\#_ABSTRACT_RENDERER_ID_1/g,'').replace(/\#109618/g,'green').replace(/\#f5f5f5/g,'lightgray').replace('hidden;','visible;').replace(cswistwo,newcswistwo).replace(cshistwo,newcshistwo) + '</s' + 'vg>')) + '\")');
    window.parent.document.getElementById(igeo).style.backgroundImage='URL(\"data:image/svg+xml;utf8,' + (wbtoa('<svg viewBox=\"0 0 ' + Math.floor(eval(swis * aspfactor)) + ' ' + Math.floor(eval(shis * aspfactor)) + '\" ' + swhat.split('</s' + 'vg>')[0].split('<svg')[eval(-1 + swhat.split('</s' + 'vg>')[0].split('<svg').length)].replace(/\#ffffff/g,'white').replace(/\#000000/g,'black').replace(/\#cccccc/g,'gray').replace(/\#dddddd/g,'silver').replace(/\#_ABSTRACT_RENDERER_ID_2/g,'').replace(/\#_ABSTRACT_RENDERER_ID_1/g,'').replace(/\#109618/g,'green').replace(/\#f5f5f5/g,'lightgray').replace('hidden;','visible;').replace(cswistwo,newcswistwo).replace(cshistwo,newcshistwo) + '</s' + 'vg>')) + '\")';
    if (('' + window.parent.document.getElementById(igeo).outerHTML).indexOf('none;') != -1) {
    window.parent.document.getElementById(igeo).style.display='block';
    }
    //window.parent.document.getElementById('rest').innerHTML='<img src=\"' + 'data:image/svg+xml;base64,' + window.btoa(wbtoa('<svg viewBox=\"0 0 ' + Math.floor(eval(swis * aspfactor)) + ' ' + Math.floor(eval(shis * aspfactor)) + '\" ' + swhat.split('</s' + 'vg>')[0].split('<svg')[eval(-1 + swhat.split('</s' + 'vg>')[0].split('<svg').length)].replace(/\#ffffff/g,'white').replace(/\#000000/g,'black').replace(/\#cccccc/g,'gray').replace(/\#dddddd/g,'silver').replace(/\#_ABSTRACT_RENDERER_ID_2/g,'').replace(/\#_ABSTRACT_RENDERER_ID_1/g,'').replace(/\#109618/g,'green').replace(/\#f5f5f5/g,'lightgray').replace('hidden;','visible;').replace(cswistwo,newcswistwo).replace(cshistwo,newcshistwo) + '</s' + 'vg>')) + '\"></img>';
    } else if (('' + window.parent.document.getElementById(igeo).innerHTML) == '' || ('' + window.parent.document.getElementById(igeo).innerHTML).indexOf('<svg') == 0) {
    window.parent.document.getElementById(igeo).innerHTML='<svg viewBox=\"0 0 ' + Math.floor(eval(swis * aspfactor)) + ' ' + Math.floor(eval(shis * aspfactor)) + '\" ' + swhat.split('</s' + 'vg>')[0].split('<svg')[eval(-1 + swhat.split('</s' + 'vg>')[0].split('<svg').length)].replace(/\#ffffff/g,'#ffffff').replace(/\#000000/g,'#000000').replace(/\#cccccc/g,'#cccccc').replace(/\#dddddd/g,'#cccccc').replace(/\#_ABSTRACT_RENDERER_ID_2/g,'#_ABSTRACT_RENDERER_ID_2').replace(/\#_ABSTRACT_RENDERER_ID_1/g,'#_ABSTRACT_RENDERER_ID_1').replace(/\#109618/g,'#109618').replace(/\<text/g,'<!--text').replace(/\<\/text\>/g,'</text-->').replace(/\#f5f5f5/g,'#e5e5e5').replace('hidden;','visible;').replace(cswistwo,newcswistwo).replace(cshistwo,newcshistwo).replace(cswis,newercswis).replace(cshis,newercshis).replace(cswis,newcswis).replace(cshis,newcshis).replace(cswis,newcswis).replace(cshis,newcshis).replace(cswis,newcswis).replace(cshis,newcshis).replace(cswis,newcswis).replace(cshis,newcshis) + '</s' + 'vg>';
    if (('' + window.parent.document.getElementById(igeo).outerHTML).indexOf('none;') != -1) {
    window.parent.document.getElementById(igeo).style.display='block';
    }
    }
    }
    }

    if (window.top && !candidate) {
    if (window.top.document.getElementById(igeo)) {
    candidate=true;
    if (('' + window.top.document.getElementById(igeo).value).replace('undefined','').replace('null','') != '') {
    igeo=window.top.document.getElementById(igeo).value;
    }
    if (cswis.trim() != '') {
    whrect=window.top.document.getElementById(igeo).getBoundingClientRect();
    // 2000 x 2500 to fit into 800 x 654
    if (eval(swis / eval('' + whrect.width)) < eval(shis / eval('' + whrect.height))) {
    aspfactor=eval(eval('' + whrect.width) / swis);
    cswistwo='&width=' + ('' + swis).split('.')[0];
    cshistwo='&height=' + ('' + shis).split('.')[0];
    newcswistwo='&width=' + Math.floor(eval(swis * aspfactor));
    newcshistwo='&height=' + Math.floor(eval(shis * aspfactor));
    newcswis=' width=' + whdelim + eval(swis * aspfactor) + whdelim;
    newcshis=' height=' + whdelim + eval(shis * aspfactor) + whdelim;
    } else {
    aspfactor=eval(eval('' + whrect.height) / shis);
    cswistwo='&width=' + ('' + swis).split('.')[0];
    cshistwo='&height=' + ('' + shis).split('.')[0];
    newcswistwo='&width=' + Math.floor(eval(swis * aspfactor));
    newcshistwo='&height=' + Math.floor(eval(shis * aspfactor));
    newcswis=' width=' + whdelim + eval(swis * aspfactor) + whdelim;
    newcshis=' height=' + whdelim + eval(shis * aspfactor) + whdelim;
    }
    }
    if (('' + window.top.document.getElementById(igeo).outerHTML).indexOf('background') != -1) {
    window.top.document.getElementById(igeo).style.backgroundSize='cover';
    window.top.document.getElementById(igeo).style.backgroundRepeat='no-repeat';
    window.top.document.getElementById(igeo).style.backgroundImage='URL(`data:image/svg+xml;utf8,' + wbtoa('<svg viewBox=\"0 0 ' + Math.floor(eval(swis * aspfactor)) + ' ' + Math.floor(eval(shis * aspfactor)) + '\" ' + swhat.split('</s' + 'vg>')[0].split('<svg')[eval(-1 + swhat.split('</s' + 'vg>')[0].split('<svg').length)].replace(/\#ffffff/g,'white').replace(/\#000000/g,'black').replace(/\#cccccc/g,'gray').replace(/\#dddddd/g,'silver').replace(/\#_ABSTRACT_RENDERER_ID_2/g,'').replace(/\#_ABSTRACT_RENDERER_ID_1/g,'').replace(/\#109618/g,'green').replace(/\#f5f5f5/g,'lightgray').replace('hidden;','visible;').replace(cswistwo,newcswistwo).replace(cshistwo,newcshistwo) + '</s' + 'vg>') + '`)';
    if (('' + window.top.document.getElementById(igeo).outerHTML).indexOf('none;') != -1) {
    window.top.document.getElementById(igeo).style.display='block';
    }
    } else if (('' + window.top.document.getElementById(igeo).innerHTML) == '' || ('' + window.top.document.getElementById(igeo).innerHTML).indexOf('<svg') == 0) {
    //window.top.document.getElementById(igeo).innerHTML='<svg viewBox=\"0 0 ' + Math.floor(eval(swis * aspfactor)) + ' ' + Math.floor(eval(shis * aspfactor)) + '\" ' + swhat.split('</s' + 'vg>')[0].split('<svg')[eval(-1 + swhat.split('</s' + 'vg>')[0].split('<svg').length)].replace(/\#ffffff/g,'white').replace(/\#000000/g,'black').replace(/\#cccccc/g,'gray').replace(/\#dddddd/g,'silver').replace(/\#_ABSTRACT_RENDERER_ID_2/g,'').replace(/\#_ABSTRACT_RENDERER_ID_1/g,'').replace(/\#109618/g,'green').replace(/\#f5f5f5/g,'lightgray').replace('hidden;','visible;').replace(cswistwo,newcswistwo).replace(cshistwo,newcshistwo).replace(cswis,newercswis).replace(cshis,newercshis).replace(cswis,newcswis).replace(cshis,newcshis).replace(cswis,newcswis).replace(cshis,newcshis).replace(cswis,newcswis).replace(cshis,newcshis).replace(cswis,newcswis).replace(cshis,newcshis) + '</s' + 'vg>';
    window.top.document.getElementById(igeo).innerHTML='<svg viewBox=\"0 0 ' + Math.floor(eval(swis * aspfactor)) + ' ' + Math.floor(eval(shis * aspfactor)) + '\" ' + swhat.split('</s' + 'vg>')[0].split('<svg')[eval(-1 + swhat.split('</s' + 'vg>')[0].split('<svg').length)].replace(/\#ffffff/g,'#ffffff').replace(/\#000000/g,'#000000').replace(/\#cccccc/g,'#cccccc').replace(/\#dddddd/g,'#cccccc').replace(/\#_ABSTRACT_RENDERER_ID_2/g,'#_ABSTRACT_RENDERER_ID_2').replace(/\#_ABSTRACT_RENDERER_ID_1/g,'#_ABSTRACT_RENDERER_ID_1').replace(/\#109618/g,'#109618').replace(/\<text/g,'<!--text').replace(/\<\/text\>/g,'</text-->').replace(/\#f5f5f5/g,'#e5e5e5').replace('hidden;','visible;').replace(cswistwo,newcswistwo).replace(cshistwo,newcshistwo).replace(cswis,newercswis).replace(cshis,newercshis).replace(cswis,newcswis).replace(cshis,newcshis).replace(cswis,newcswis).replace(cshis,newcshis).replace(cswis,newcswis).replace(cshis,newcshis).replace(cswis,newcswis).replace(cshis,newcshis) + '</s' + 'vg>';
    if (('' + window.top.document.getElementById(igeo).outerHTML).indexOf('none;') != -1) {
    window.top.document.getElementById(igeo).style.display='block';
    }
    }
    }
    }

    }
    }
    return swhat;
    }


    setTimeout(function(){ svgret(document.body.innerHTML); }, 5000);

    “; ?>
    … in >the changed geo_chart.php Geo Chart
  • interfacer of the div element …

… and offering user control over the resultant Google Charts Geo Chart …

  1. width
  2. height
  3. latitude
  4. longitude
  5. place(s)

… further to the previous progress regarding Google Charts Geo Charts when we presented TimeZone Places Nearest Places Tweak Tutorial.

Our first draft geotest.html “proof of concept” tests of this are available here.


Previous relevant TimeZone Places Nearest Places Tweak Tutorial is shown below.

TimeZone Places Nearest Places Tweak Tutorial

TimeZone Places Nearest Places Tweak Tutorial

When we presented GeoJson World Countries Drag and Drop Makeover Nuance Tutorial we tweaked our inhouse TimeZone Places PHP web application. But it needs a “re-tweak”.

In that Nearest Places form part of the TimeZone places webpage, we noticed that even when shaping to enter a TimeZone Placename in the first textbox we made no attempt to fill in …

  • latitude
  • longitude

… when we have the information to do so, and even if we’re misunderstanding a placename designation, that should not stop us from trying, because those two numerical fields above can be corrected, and the form resubmitted, in these scenarios.

Apart from making a PHP derived Javascript variable be made available to the code, we “wrap”

<?php

$otherform="<br><br><iframe id=nearestif name=nearestif style=display:none; src=about:none></iframe><div id=nearest></div><form target=nearestif action=./tz_places.php method=GET style=background-color:#f0f0f0;>Place: <input onblur=\" if (this.value.length > 0) { document.getElementById('nearestif').src=perhapsfillin('./tz_places.php?latitude=&longitude=&place=' + encodeURIComponent(this.value)); } \" type=text id=nplace name=place value=></input> Latitude: <input type=number id=latitude name=latitude value=0.0000 max=90.0000 min=-90.0000 step=0.0001></input> Longitude: <input type=number id=longitude name=longitude value=0.0000 max=180.0000 min=-180.0000 step=0.0001></input><br><input style=background-color:orange; type=submit id=inearest value='Nearest TimeZone Places'></input></form>";

?>

… the “a” link content call via …

<?php echo ”

function perhapsfillin(inidea) {
// './tz_places.php?latitude=&longitude=&place=' + encodeURIComponent(this.value))
var outidea=inidea;
if (inidea.indexOf('place=') != -1) {
var inplaceis=decodeURIComponent(inidea.split('place=')[1].split('&')[0].split('#')[0]);
// +07'>Asia/Tomsk</option><option value='Europe/London' data-geo='51.5074,-0.1278,BST,GB,+0'>Europe/London</
if (yourtzlist.toLowerCase().indexOf('/' + inplaceis.toLowerCase().replace(/\ /g,'_') + '<') != -1) {
document.getElementById('latitude').value='' + eval('' + yourtzlist.toLowerCase().split('/' + inplaceis.toLowerCase().replace(/\ /g,'_') + '<')[0].split(' data-geo=')[eval(-1 + yourtzlist.toLowerCase().split('/' + inplaceis.toLowerCase().replace(/\ /g,'_') + '<')[0].split(' data-geo=').length)].substring(1).split(',')[0]).toPrecision(6);
document.getElementById('longitude').value='' + eval('' + yourtzlist.toLowerCase().split('/' + inplaceis.toLowerCase().replace(/\ /g,'_') + '<')[0].split(' data-geo=')[eval(-1 + yourtzlist.toLowerCase().split('/' + inplaceis.toLowerCase().replace(/\ /g,'_') + '<')[0].split(' data-geo=').length)].substring(1).split(',')[1]).toPrecision(6);
outidea=outidea.replace('latitude=' + inidea.split('latitude=')[1].split('&')[0].split('#')[0], 'latitude=' + document.getElementById('latitude').value);
outidea=outidea.replace('longitude=' + inidea.split('longitude=')[1].split('&')[0].split('#')[0], 'longitude=' + document.getElementById('longitude').value);
}
}
return outidea;
}

“; ?>

… in the changed TimeZone Places tz_places.php


Previous relevant GeoJson World Countries Drag and Drop Makeover Nuance Tutorial is shown below.

GeoJson World Countries Drag and Drop Makeover Nuance Tutorial

GeoJson World Countries Drag and Drop Makeover Nuance Tutorial

Nuance alert! We’re not sure if you noticed, but if you tried out the Drag and Drop functionality in the World Countries web application of yesterday’s GeoJson World Countries Drag and Drop Makeover Tutorial you may have noticed …

  • for a country with lots of TimeZone places, like Brazil, you could get a decent Google Chart Geo Chart map up … but if you were to click the “Map?” link down the bottom of that iframe …
  • it would fail to show a Google Chart Map Chart for that country’s TimeZone places

This fix, believe it or not, is interesting, perhaps only in an “internal use only” sense, we grant you. But our solution got us delving even more into hashtagging data, so that the solution we came up with was a hybrid whereby …

  • stayed with PHP $_GET[] (ie. address bar ? and & argumented) data (versus using PHP $_POST[] methodologies) … but …
  • where it came to the &data=[most of the data] part, other than its first character, we hashtagged the rest

… so that the logic flows as per usual, but we intervene at places and flesh it out via location.hash (client side only) means. We won’t bore you too much with all the places of intervention except the receiving map.php’s “easiest to get” intervention

<?php

$gtw="";

if (isset($_POST['title'])) {
foreach ($_POST as $name => $val) {
if (strpos($val, 'data:') !== false) {
$fval=urlencode($val); //str_replace(" ", "%20", str_replace("'", urlencode("'"), str_replace('"', urlencode('"'), str_replace('=', urlencode('='), str_replace('>', urlencode('>'), str_replace('<', urlencode('<'), str_replace('?', urlencode('?'), str_replace('&', urlencode('&'), $val))))))));
} else {
$fval=str_replace('+','%20',urlencode(str_replace(' ',' + ',str_replace('+',' ',$val)))); //str_replace(" ", "%20", str_replace("'", urlencode("'"), str_replace('"', urlencode('"'), str_replace('=', urlencode('='), str_replace('>', urlencode('>'), str_replace('<', urlencode('<'), str_replace('?', urlencode('?'), str_replace('&', urlencode('&'), $val))))))));
}
if ($shto == "") {
$shto="#" . $name . "=" . $fval; //str_replace(" ", "%20", str_replace("'", urlencode("'"), str_replace('"', urlencode('"'), str_replace('=', urlencode('='), str_replace('>', urlencode('>'), str_replace('<', urlencode('<'), str_replace('?', urlencode('?'), str_replace('&', urlencode('&'), $val))))))));
} else {
$shto.="&" . $name . "=" . $fval; //str_replace(" ", "%20", str_replace("'", urlencode("'"), str_replace('"', urlencode('"'), str_replace('=', urlencode('='), str_replace('>', urlencode('>'), str_replace('<', urlencode('<'), str_replace('?', urlencode('?'), str_replace('&', urlencode('&'), $val))))))));
}
}
}

if (isset($_GET['data'])) {
foreach ($_GET as $name => $val) {
if (strpos($val, 'data:') !== false) {
$fval=urlencode($val); //str_replace(" ", "%20", str_replace("'", urlencode("'"), str_replace('"', urlencode('"'), str_replace('=', urlencode('='), str_replace('>', urlencode('>'), str_replace('<', urlencode('<'), str_replace('?', urlencode('?'), str_replace('&', urlencode('&'), $val))))))));
} else {
//$fval=str_replace('+','%20',urlencode($val)); //str_replace(" ", "%20", str_replace("'", urlencode("'"), str_replace('"', urlencode('"'), str_replace('=', urlencode('='), str_replace('>', urlencode('>'), str_replace('<', urlencode('<'), str_replace('?', urlencode('?'), str_replace('&', urlencode('&'), $val))))))));
$fval=str_replace('+','%20',urlencode(str_replace(' ',' + ',str_replace('+',' ',$val)))); //str_replace(" ", "%20", str_replace("'", urlencode("'"), str_replace('"', urlencode('"'), str_replace('=', urlencode('='), str_replace('>', urlencode('>'), str_replace('<', urlencode('<'), str_replace('?', urlencode('?'), str_replace('&', urlencode('&'), $val))))))));
}
if ($shto == "") {
$gshto="#" . $name . "=" . $fval; //str_replace(" ", "%20", str_replace("'", urlencode("'"), str_replace('"', urlencode('"'), str_replace('=', urlencode('='), str_replace('>', urlencode('>'), str_replace('<', urlencode('<'), str_replace('?', urlencode('?'), str_replace('&', urlencode('&'), $val))))))));
} else {
$gshto.="&" . $name . "=" . $fval; //str_replace(" ", "%20", str_replace("'", urlencode("'"), str_replace('"', urlencode('"'), str_replace('=', urlencode('='), str_replace('>', urlencode('>'), str_replace('<', urlencode('<'), str_replace('?', urlencode('?'), str_replace('&', urlencode('&'), $val))))))));
}
}

if ($gshto != '' && strlen($_GET['data']) < 10) {
$gtw="\n
if (document.URL.split('#')[0].indexOf('?') != -1 && decodeURIComponent(decodeURIComponent(('' + location.hash + 'x'))).indexOf('[') == 1) {
var jformoh='<iframe name=lastfig id=lastfig style=\"position:absolute;width:100%;height:100%;z-index:897;top:0px;left:0px;\" src=></iframe><br><form style=display:none; target=_self method=POST action=\"' + document.URL.split('#')[0].split('?')[0] + '\"><input id=gjformsubis type=submit value=Submit style=display:none;></input></form>';
var iiareflds=0, areflds=(document.URL.split('#')[0] + decodeURIComponent(decodeURIComponent((',' + location.hash.substring(1))))).replace('#','&').replace('?','&').split('=');
for (var iiareflds=1; iiareflds<areflds.length; iiareflds++) {
jformoh=jformoh.replace('</form>','<input type=hidden name=\"' + areflds[eval(-1 + iiareflds)].split('&')[eval(-1 + areflds[eval(-1 + iiareflds)].split('&').length)] + '\" value=\"' + decodeURIComponent(areflds[iiareflds].split('&')[0]).replace(/^%2C/g,'').replace(/\,1\]/g,']').replace(/\|/g,',').replace(/\,\,/g,',') + '\"></input></form>');
}
setTimeout(function() {
document.body.innerHTML+=jformoh;
document.getElementById('gjformsubis').click(); }, 7000);
}
";
}

}

?>

… just a matter of concern for …

… using the World Countries GeoJson web application.


Previous relevant GeoJson World Countries Drag and Drop Makeover Tutorial is shown below.

GeoJson World Countries Drag and Drop Makeover Tutorial

GeoJson World Countries Drag and Drop Makeover Tutorial

In a similar vein to the recent GeoJson World Coastlines Drag and Drop Makeover Tutorial, today, we have got a mild makeover happening with the Drag and Drop functionality related to GeoJson World Countries web application usage.

In addition to the Wikipedia information, at the very least, presented following a successful drag and drop operation, from today, we also start presenting a new HTML iframe element containing …

Nearest TimeZone places along with Google Charts for each unique country involved

… used by that changed TimeZone Places tz_places.php helped out by the changed external Javascript countries.js external Javascript all called by our unchanged GeoJson World Countries web application.

The work from that last makeover helped, and today the changes involve …

In tz_places.php start doing what you did for regions.php now for countries.php
<?php

echo "<!doctype html><html><body onload=\"if (('' + top.document.URL).replace('/countries.','/regions.').indexOf('/regions.') != -1) { if (document.getElementById('snearest')) { document.getElementById('snearest').style.left='0px'; } }\" style='background-color:yellow;" . $backstyle . "'><h1>Nearest Timezones ... RJM Programming ... April, 2018 ... <a target=_blank title='Thanks to ...' href='//php.net/manual/en/datetimezone.getlocation.php'>//php.net/manual/en/datetimezone.getlocation.php</a></h1><br><br><br>" . $pd . $ret . "</body></html>";

?>
And in countries.js intervene in the dragover event

target.addEventListener("dragover", (ev) => {
console.log("dragOver");
if (window.parent) {
if (parent.document.URL.indexOf('/countries.') != -1) {
var ftables=parent.document.getElementsByTagName('table');
if (eval('' + ftables.length) > 0) {
if (ftables[0].innerHTML.indexOf('lastrow') == -1) {
ftables[0].innerHTML+='<tr id=lastrow><td><iframe id=lastif style=display:none;width:100%;height:900px; src="/PHP/tz_places.php"></iframe></td></tr>';
}
}
}
}

ev.preventDefault();
});
Intervene again, where applicable

if (parent.document.URL.indexOf('/regions.') != -1) {
window.open('/PHP/tz_places.php?place=&latitude=' + encodeURIComponent('' + parent.derivethislat(pos4)) + '&longitude=' + encodeURIComponent('' + parent.derivethislong(pos3)) + '&ntztontz=y','_blank','top=180,left=' + eval(-350 + screen.width) + ',width=350,height=600');
} else {
if (parent.document.getElementById('lastif')) {
parent.document.getElementById('lastif').style.display='block';
parent.document.getElementById('lastif').src='/PHP/tz_places.php?place=&latitude=' + encodeURIComponent('' + parent.derivethislat(pos4)) + '&longitude=' + encodeURIComponent('' + parent.derivethislong(pos3)) + '&ntztontz=y';
}

window.open('//wikipedia.org/wiki/' + encodeURIComponent(tdid.replace(/\ /g,'_')),'_blank','top=180,left=' + eval(-350 + screen.width) + ',width=350,height=600');
}


Previous relevant GeoJson World Coastlines Drag and Drop Makeover Tutorial is shown below.

GeoJson World Coastlines Drag and Drop Makeover Tutorial

GeoJson World Coastlines Drag and Drop Makeover Tutorial

We’ve got a mild makeover happening with the Drag and Drop functionality related to GeoJson World Coastlines Drag and Drop Tutorial today.

At first …

  • we wanted the first popup window content be aligned to the top and left … and then …
  • we thought it would be good to also, in “Drag and Drop land”, relevant countries nearby to the user’s drop point TimeZone Places be showing below that (and it panned out the best way to show this, for us, was via an iframe pointing at another incarnation of the tz_places.php webpage, because it could have GET arguments iso, iso2, iso3 etcetera to point at ISO 2 letter country codes, which we made more readily available (via a new data-cc global data attribute applied to the select option subelements presented) for the changed external Javascript countries.js we decided should get into the mix via a new Javascript function …

    function tzagain(inhtml) {
    var outhtml=inhtml, dccs=[], getarg='?', theone=1;
    if (inhtml.indexOf('left:0px;') != -1 && inhtml.indexOf(' data-cc=') != -1) {
    dccs=inhtml.split(' data-cc=');
    for (var ii=1; ii<dccs.length; ii++) {
    if (getarg == '?') {
    getarg+='iso=' + dccs[ii].substring(0,4).replace(/\'/g,'').replace(/\"/g,'').substring(0,2);
    theone++;
    } else if (getarg.indexOf('=' + dccs[ii].substring(0,4).replace(/\'/g,'').replace(/\"/g,'').substring(0,2)) == -1) {
    getarg+='&iso' + theone + '=' + dccs[ii].substring(0,4).replace(/\'/g,'').replace(/\"/g,'').substring(0,2);
    theone++;
    }
    }
    if (getarg != '?') {
    if (inhtml.indexOf('</bo' + 'ody>') != -1) {
    outhtml=inhtml.split('</bo' + 'dy>')[0] + '<iframe src="./tz_places.php' + getarg + '" style="position:absolute;left:0px;top:120px;width:100%;height:900px;"></iframe></body></html>';
    } else {
    outhtml=inhtml + '<iframe src="./tz_places.php' + getarg + '" style="position:absolute;left:0px;top:120px;width:100%;height:900px;"></iframe>';
    }
    }
    }
    return outhtml;
    }

    )

… used by that changed TimeZone Places tz_places.php as exemplified below

<?php

echo "<!doctype html><html><head><scr" . "ipt type='text/javascript' src='/HTMLCSS/countries.js?rand=" . rand(0,16756453) . "'></scr" . "ipt><scr" . "ipt type='text/javascript'> function lookoutfortop() { if (parent.document.getElementById('getmell')) { parent.document.getElementById('nearest').innerHTML=\"" . $pd . $retmore . "\"; } else if (top.document.getElementById('nearest')) { if (top.document.getElementById('getmell')) { top.document.getElementById('nearest').innerHTML=\"" . $pd . $retmore . "\"; } else { top.document.getElementById('nearest').innerHTML=\"" . $pd . $ret . "\"; } top.window.scrollTo(0,0); } else { if (top.document.getElementById('getmell')) { document.body.innerHTML=tzagain(\"" . $pd . $retmore . "\"); } else { document.body.innerHTML=tzagain(\"" . $pd . str_replace(':70px;',':0px;',str_replace(':350px;',':0px;',$ret)) . "\"); } } if (('' + top.document.URL).indexOf('/regions.') != -1) { if (document.getElementById('snearest')) { document.getElementById('snearest').style.left='0px'; } } } </scr" . "ipt></head><body onload=' lookoutfortop();'" . $backfullstyle . ">" . $pd . $ret . "</body></html>"; //$ret;

?>

… that superfluous looking ?rand=blah measure being pretty useful really regarding getting around the cache keeping old external Javascript in its mind after changes.

Curiously, the grandparent regions.php starting off all this needed no changing! We hope you like these tweaks!


Previous relevant GeoJson World Coastlines Drag and Drop Tutorial is shown below.

GeoJson World Coastlines Drag and Drop Tutorial

GeoJson World Coastlines Drag and Drop Tutorial

The primary aim of today’s work, onto yesterday’s GeoJson World Drag and Drop on iPad Tutorial iPad integration is to …

  • add similar drag and drop logic into our World Coastlines GeoJson web application … and along the way, also for the World Countries web application …
  • hold off involving the (pretty kludgy looking) vertical scrollbar of our drag and drop pin’s underlying HTML iframe …

    <iframe scrolling=no frameborder=0 name=iftr id=iftr style=display:none; srcdoc="<body style=background-color:transparent;><p id=mg title='Wikipedia country page below via drag and drop to world map' draggable='true'>📍</p><br><br><div id=myh1></div><script type='text/javascript' src='./countries.js?rand=321156747657' defer></script></body>" data-src=></iframe>

    … until the first drag operation starting, calls on …

    parent.document.getElementById('iftr').scrolling='yes';

    … proving a Javascript DOM control of the “scrolling” attribute works (as we weren’t sure, having never done this before)

It’s worth beavering away at a guinea pig web application until (just about complete) satisfaction (for now) before having a parallel set of code changes happening simultaneously, we’ve always found.

So, what happened in “external Javascript land”? No need for a “regions.js” here, as parent.document.URL can be scrutinised in that “external Javascript land” to discover which web application is the parent, and act accordingly. So changed were our changed external Javascript countries.js in …


Previous relevant GeoJson World Drag and Drop on iPad Tutorial is shown below.

GeoJson World Drag and Drop on iPad Tutorial

GeoJson World Drag and Drop on iPad Tutorial

Yesterday’s GeoJson World Drag and Drop Google Tutorial had us at a very interesting position, one that we cannot recall ever happening before, that being …

  • our GeoJson World Countries web application Drag and Drop logic worked on an iPhone … but …
  • our GeoJson World Countries web application Drag and Drop logic did not work on an iPad

They’re both iOS! And usually the smaller iPhone has the problem and the larger iPad is okay when there is an odd scenario happening. So, what gives? Well, the odd thing is, it was just rearrangements of code and iframe srcdoc usage


<iframe frameborder=0 name=iftr id=iftr style=display:none; srcdoc="<body style=background-color:transparent;><p id=mg title='Wikipedia country page below via drag and drop to world map' draggable='true'>📍</p><br><br><div id=myh1></div><script type='text/javascript' src='./countries.js?rand=321156747657' defer></script></body>" data-src=></iframe>

… that ended up helping us fix the issues. Figure this, on iPad our emoji pin could not be made visible down the bottom left of iPad screen but could be made to work in the title elements section?! Of course, we might have been having a bad day, but in our defence, even debugging in Safari via …

  • iPad Safari web browser invocation …
  • Apple white lead from iPad to MacBook Air …
  • MacBook Air Safari web browser Develop menu dropdown got us to debugging functionality

showed nothing untoward, and neither did, on the iPad’s Chrome browser …


chrome://inspect

… debugging techniques.

Changed were our changed external Javascript countries.js in our changed countries.php GeoJson World Countries PHP web application in a new window. If you have any clues yourself, the comments are there?!


Previous relevant GeoJson World Drag and Drop Google Tutorial is shown below.

GeoJson World Drag and Drop Google Tutorial

GeoJson World Drag and Drop Google Tutorial

We often turn to what we like to call …

  • “long hover” (ie. on non-mobile, wait for a long while after the onmouseover event initiation to see whether the user is still hovering) … and today, a bit like that, is the new, for us …
  • “long drag” (the user waits a long time between the drag initialization and the drop event)

… and because we found “dawdling” on a drag and drop fairly unnatural, we think this “long drag” idea “has legs”, in that it works well as a deliberate act made by a user, knowing at the end they benefit from their actions. For us, with our GeoJSON Map web application, yesterday, with GeoJson World Drag and Drop Pin Tutorial, the drag and drop led to …

  • Wikipedia country information webpage … and today, we allow a “long drag” get you to …
  • Google Maps drop position information webpage … if the “long drag” is for 10 or more seconds …
  • Google Earth drop position information webpage … if the “very long drag” is for 20 or more seconds

… arranged for via our changed external Javascript countries.js in our changed countries.php GeoJson World Countries PHP web application in a new window.


Previous relevant GeoJson World Drag and Drop Pin Tutorial is shown below.

GeoJson World Drag and Drop Pin Tutorial

GeoJson World Drag and Drop Pin Tutorial

Before today, with the GeoJson Countries web application from GeoJson World Colour Wheel Wikipedia Integration Tutorial we’ve mainly used …

  • onclick event logic … and today, we start to also include …
  • drag and drop event logic (like, but nuanced as explained below, the experimental drag and drop ideas included in the recent Planet Moon Game Tutorial) … the nuanced differences involving …
    1. the drag part of the events occurs in an iframe (populated via small amount of srcdoc HTML and Javascript) able to reference its originator via window.parent …
    2. drop part of the events occurs in that originator parent and so several Javascript function called by the child reside in the parent … and …
    3. the child “drag” event controller uses the new external Javascript countries.js

      // countries.js
      // July, 2023
      // RJM Programming
      // Help out countries.html and countries.php
      var pos3=0, pos4=0, tdid='', poligono, punto, coone='', prectis;

      // var poligono = [[2,9],[8,6],[12,10],[15,2],[10,4],[5,1]];
      // var punto = [6, 5];

      function pointInPolygon(polygon, point) { // thanks to https://community.appinventor.mit.edu/t/geofence-check-if-a-point-is-inside-a-polygon-javascript-map/57091
      var odd = false;
      for (var i = 0, j = polygon.length - 1; i < polygon.length; i++) {
      if (((polygon[i][1] > point[1]) !== (polygon[j][1] > point[1]))
      && (point[0] < ((polygon[j][0] - polygon[i][0]) * (point[1] - polygon[i][1]) / (polygon[j][1] - polygon[i][1]) + polygon[i][0]))) {
      odd = !odd;
      }
      j = i;
      }
      return odd;
      }

      function andlaterstill() {
      if (9 == 6) { // temporary
      if (tdid != '') {
      document.getElementById(tdid).innerHTML=document.getElementById(tdid).innerHTML.substring(0,1);
      } else if (document.getElementById('mytable').innerHTML.indexOf(clonedatatwo) != '') {
      document.getElementById('myh1').innerHTML=document.getElementById('myh1').innerHTML.split('</table>')[0] + '</table>';
      }
      if (document.getElementsByTagName('div')[0].innerHTML.indexOf(clonedatatwo) != -1) {
      document.getElementsByTagName('div')[0].innerHTML=document.getElementsByTagName('div')[0].innerHTML.replace(clonedatatwo,'');
      } else if (document.getElementsByTagName('div')[0].innerHTML.indexOf(clonedatatwo.replace('dragging','')) != -1) {
      document.getElementsByTagName('div')[0].innerHTML=document.getElementsByTagName('div')[0].innerHTML.replace(clonedatatwo.replace('dragging',''),'');
      } else if (document.body.innerHTML.split('<table')[0].indexOf(clonedatatwo.replace('dragging','')) != -1) {
      document.body.innerHTML=document.body.innerHTML.replace(document.body.innerHTML.split('<table')[0], document.body.innerHTML.split('<table')[0].replace(clonedatatwo.replace('dragging',''),''));
      } else if (document.body.innerHTML.split('<table')[0].indexOf(clonedatatwo) != -1) {
      document.body.innerHTML=document.body.innerHTML.replace(document.body.innerHTML.split('<table')[0], document.body.innerHTML.split('<table')[0].replace(clonedatatwo,''));
      }
      }
      tdid='';
      }

      function getprectis() {
      if (window.opener) {
      if (window.opener.document.getElementsByTagName('body')[0]) {
      return window.opener.document.body.getBoundingClientRect();
      } else if (window.parent) {
      if (parent.document.getElementsByTagName('body')[0]) {
      return parent.document.body.getBoundingClientRect();
      }
      }
      } else if (window.parent) {
      if (parent.document.getElementsByTagName('body')[0]) {
      return parent.document.body.getBoundingClientRect();
      }
      }
      return null;
      }

      function wod(ididea) {
      if (window.opener) {
      if (window.opener.document.getElementsByTagName(ididea)[0]) {
      return window.opener.document.getElementsByTagName(ididea)[0];
      } else if (window.parent) {
      if (parent.document.getElementsByTagName(ididea)[0]) {
      return parent.document.getElementsByTagName(ididea)[0];
      }
      }
      } else if (window.parent) {
      if (parent.document.getElementsByTagName(ididea)[0]) {
      return parent.document.getElementsByTagName(ididea)[0];
      }
      }
      return null;
      }

      function ccit() {
      var divs, esot=[], bodyois=null;
      if (window.opener) {
      if (window.opener.document.getElementsByTagName('body')[0]) {
      bodyois=window.opener.document.getElementsByTagName('body')[0];
      divs=window.opener.document.getElementsByTagName('div');
      } else if (window.parent) {
      if (parent.document.getElementsByTagName('body')[0]) {
      bodyois=parent.document.getElementsByTagName('body')[0];
      divs=parent.document.getElementsByTagName('div');
      }
      }
      } else if (window.parent) {
      if (parent.document.getElementsByTagName('body')[0]) {
      bodyois=parent.document.getElementsByTagName('body')[0];
      divs=parent.document.getElementsByTagName('div');
      }
      }

      for (var ii=0; ii<divs.length; ii++) {
      if (divs[ii].outerHTML.split('>')[0].indexOf(' title=' + String.fromCharCode(34) + coone) != -1) {
      divs[ii].innerHTML=divs[ii].innerHTML.replace('z-index:24;', 'z-index:123;').replace('lime;', 'rgba(200,200,200,0.3);');
      divs[ii].name='d' + tdid.replace(/\ /g, '_');
      }
      }
      }

      function andqlater() {
      //alert('HeRe');
      tdid='';
      var ppig='[]', coo='', coos=[], ip=0;
      var squares; //=window.opener.document.getElementsByTagName('area');

      if (window.opener) {
      if (window.opener.document.getElementsByTagName('body')[0]) {
      squares=window.opener.document.getElementsByTagName('area');
      } else if (window.parent) {
      if (parent.document.getElementsByTagName('body')[0]) {
      squares=parent.document.getElementsByTagName('area');
      }
      }
      } else if (window.parent) {
      if (parent.document.getElementsByTagName('body')[0]) {
      squares=parent.document.getElementsByTagName('area');
      }
      }

      for (var ii=1; ii<=squares.length; ii++) {
      ppig='[]';
      coos=squares[eval(-1 + ii)].coords.replace(/\ /g,',').split(',');
      ppig='[[' + coos[0] + ',' + coos[1] + ']]';
      for (ip=2; ip<coos.length; ip+=2) {
      ppig=ppig.replace(']]', '],[' + coos[ip] + ',' + coos[eval(1 + ip)] + ']]');
      poligono=eval(ppig);
      //alert('' + punto);
      if (pointInPolygon(poligono, punto)) {
      tdid='' + squares[eval(-1 + ii)].getAttribute('data-cname');
      coone=('' + squares[eval(-1 + ii)].coords).split(' ')[0];
      setTimeout(ccit, 2000);
      console.log('tdid=' + tdid + ' and coone=' + coone);
      if (window.opener) {
      if (window.opener.document.getElementsByTagName('body')[0]) {
      window.focus();
      document.getElementById('myh1').innerHTML='<iframe style="width:100%;height:800px;" src="//wikipedia.org/wiki/' + encodeURIComponent(tdid.replace(/\ /g,'_')) + '"></iframe>';
      } else if (window.parent) {
      if (parent.document.getElementsByTagName('body')[0]) {
      document.getElementById('myh1').innerHTML='<iframe style="width:100%;height:800px;" src="//wikipedia.org/wiki/' + encodeURIComponent(tdid.replace(/\ /g,'_')) + '"></iframe>';
      window.open('//wikipedia.org/wiki/' + encodeURIComponent(tdid.replace(/\ /g,'_')),'_blank','top=180,left=' + eval(-350 + screen.width) + ',width=350,height=600');
      }
      }
      return tdid;
      }
      }
      }
      console.log('tdid=' + tdid);
      //setTimeout(andlaterstill, 100);
      return '';
      }

      window.addEventListener("DOMContentLoaded", () => {
      const source = document.querySelector("#mg");
      console.log('source.id=' + source.id);
      source.addEventListener("dragstart", (ev) => {
      console.log("dragStart");
      // Change the source element's background color
      // to show that drag has started
      ev.currentTarget.classList.add("dragging");
      // Clear the drag data cache (for all formats/types)
      ev.dataTransfer.clearData();
      // Set the drag's format and data.
      // Use the event target's id for the data
      ev.dataTransfer.setData("text/plain", ev.target.id);
      //ev.dataTransfer.setData("text/html", ev.target.outerHTML);
      });
      source.addEventListener("dragend", (ev) =>
      ev.target.classList.remove("dragging")
      );

      const target = wod('body'); //window.opener.document.getElementsByTagName('body')[0];
      target.id='usemap';
      console.log('target.id=' + target.id);
      target.addEventListener("dragover", (ev) => {
      console.log("dragOver");
      ev.preventDefault();
      });
      target.addEventListener("drop", (ev) => {
      console.log("Drop");
      ev.preventDefault();
      // Get the data, which is the id of the source element
      const data = ev.dataTransfer.getData("text");
      const source = document.getElementById(data);

      var prectis=getprectis();

      console.log('' + ev.target.id);
      if (!document.getElementById('callback')) {
      if (('' + ev.target.id).substring(0,2) == 'im') {
      score+=eval(ev.target.innerHTML.substring(0,1));
      }
      } else if (1 == 1) { //document.getElementById('callback')) {
      secs++;
      if (('' + ev.target.getAttribute('data-answer')) == ('' + document.getElementById('mg').getAttribute('data-answer'))) {
      score++;
      document.getElementById('score').innerHTML='Score: ' + score + '/' + secs + '';
      } else {
      document.getElementById('score').innerHTML='Score: ' + score + '/' + secs + '';
      alert('Correct answer was ' + document.getElementById('mg').getAttribute('data-answer'));
      }
      location.href=document.getElementById('callback').value + '?score=' + score + '&secs=' + secs;
      }
      if (1 == 2) {
      //clonedatatwo=document.getElementById('source').outerHTML;
      //document.getElementById('mytable').innerHTML=document.getElementById('mytable').innerHTML.replace(clonedatatwo, '');
      //ev.target.innerHTML=ev.target.innerHTML.substring(0,1) + clonedatatwo;
      } else if ((9 == 9 || ('' + ev.target.id).substring(0,2) == 'im')) {
      //clonedatatwo=document.getElementById('source').outerHTML;
      // // andqlater();
      //document.getElementById('mytable').innerHTML=document.getElementById('mytable').innerHTML.replace(clonedatatwo, '');
      //ev.target.innerHTML=ev.target.innerHTML.substring(0,1) + clonedatatwo;
      //document.getElementById('myh1').appendChild(source);
      //if (('' + ev.target.id).substring(0,2) != 'im') {
      //document.getElementById('myh1').insertAdjacentHTML('beforeend', clonedatatwo);
      //} else {
      //ev.target.insertAdjacentHTML('beforeend', clonedatatwo);
      //}
      } else {
      ev.target.appendChild(source);
      }

      prectis=getprectis();

      if (ev.touches) {
      if (ev.touches[0].pageX) {
      pos3 = ev.touches[0].pageX;
      pos4 = ev.touches[0].pageY;
      } else {
      pos3 = ev.touches[0].clientX;
      pos4 = ev.touches[0].clientY;
      }
      console.log('pos3 = ' + pos3 + ',pos4 = ' + pos4);
      } else if (ev.clientX || ev.clientY) {
      pos3 = ev.clientX;
      pos4 = ev.clientY;
      console.log('pos3 = ' + pos3 + ' ,pos4 = ' + pos4);
      } else {
      pos3 = ev.pageX;
      pos4 = ev.pageY;
      console.log('pos3 = ' + pos3 + ', pos4 = ' + pos4);
      }
      //alert('[' + pos3 + ',' + pos4 + ']');
      var wop=0;
      if (window.opener) {
      if (window.opener.document.getElementsByTagName('body')[0]) {
      window.opener.derivethislong(pos3);
      window.opener.derivethislat(pos4);
      wop=window.opener.getzoom();
      } else if (window.parent) {
      if (parent.document.getElementsByTagName('body')[0]) {
      parent.derivethislong(pos3);
      parent.derivethislat(pos4);
      wop=parent.getzoom();
      }
      }
      } else if (window.parent) {
      if (parent.document.getElementsByTagName('body')[0]) {
      parent.derivethislong(pos3);
      parent.derivethislat(pos4);
      wop=parent.getzoom();
      }
      }

      //pos3+=eval(wop * prectis.left);
      //pos4+=eval(wop * prectis.top);
      var xwop='1';


      console.log('prectis.left/top=' + prectis.left + '/' + prectis.top);


      //punto=eval('[' + eval(eval('' + pos3) / eval('' + wop)) + ',' + eval(eval('' + pos4) / eval('' + wop)) + ']');

      punto=eval('[' + eval(eval(-prectis.left * eval('' + wop) + eval('' + pos3)) / eval('' + wop)) + ',' + eval(eval(-prectis.top * eval('' + wop) + eval('' + pos4)) / eval('' + wop)) + ']');

      console.log(punto);
      andqlater();

      });

      //const reset = document.querySelector("#reset");
      //reset.addEventListener("click", () => document.location.reload());

      });

      function dragorig() {
      if (document.getElementById('mg')) {
      document.getElementById('mg').draggable='true';
      } else {
      setTimeout(dragorig, 5000);
      }
      }

      // setTimeout(dragorig, 5000);

… to open Wikipedia Country information webpages of dropped into user drags (on a world map), in our changed countries.php GeoJson World Countries PHP web application in a new window.


Previous relevant GeoJson World Colour Wheel Wikipedia Integration Tutorial is shown below.

GeoJson World Colour Wheel Wikipedia Integration Tutorial

GeoJson World Colour Wheel Wikipedia Integration Tutorial

Further to yesterday’s GeoJson World Coastline Quiz Deployments Tutorial, with our two …

… web applications, today we want to deepen the integration with Wikipedia on two fronts …

  • GeoJson World Coastline optional quiz Wikipedia webpage navigation offerings, achieved via a Javascript override initiative …

    const confirm = (cblurb) => {
    if (cblurb.indexOf('Answer was ') != -1 && cblurb.indexOf('. ') != -1) {
    var resp=prompt(cblurb.replace(cblurb.split('Answer was ')[1].split('. ')[0] + '. ', cblurb.split('Answer was ')[1].split('. ')[0] + ' (answer W to see more information on Wikipedia). '), '');
    if (resp != null) {
    if (resp.toLowerCase() == 'w') {
    window.open('//en.wikipedia.org/wiki/' + cblurb.split('Answer was ')[1].split('. ')[0].replace(/\ /g,'_'), '_blank', 'top=70,left=70,width=650,height=650');
    return true;
    }
    return true;
    } else {
    return false;
    }
    }
    return window.confirm(cblurb);
    };
  • GeoJson World Countries and Coastline changed map.php Map Chart new onclick menu links to our Colour Wheel web application, and its Wikipedia images and TimeZone information

… in our changed regions.php GeoJson World Coastlines PHP web application in a new window, or you can also try below.


Previous relevant GeoJson World Coastline Quiz Deployments Tutorial is shown below.

GeoJson World Coastline Quiz Deployments Tutorial

GeoJson World Coastline Quiz Deployments Tutorial

The deployment follow up to yesterday’s GeoJson World Coastline Function Noun Naming Tutorial seems to concern mobile platform use of the new …

… where heap memory concerns related to the global variables memory used in our GeoJson World Coastlines webpage could cause mobile platform usage reloads of the web application, reminiscent of the external Javascript concerns we had back at GeoJson World Countries SVG Overlay Safari Error Tutorial.

There, as for here, mobile usage got better by swapping global variable usage for HTML content static PHP …

<?php echo ”

<select id=spops style=display:none;>" . $sih . "</select>
<select id=srivs style=display:none;>" . $rih . "</select>

“; ?>

… via …

<?php

$sih='';
$rih='';

function oururlencode($instuff) {
$outstuff='';
$dotbits=explode('.', $instuff);
if (sizeof($dotbits) > 1) {
$outstuff=$instuff;
for ($ii=1; $ii<sizeof($dotbits); $ii++) {
if (strlen( explode(',', explode(' ', $dotbits[$ii])[0])[0] ) > 3) {
$outstuff=str_replace('.' . explode(',', explode(' ', $dotbits[$ii])[0])[0], '.' . substr(explode(',', explode(' ', $dotbits[$ii])[0])[0],0,3), $outstuff);
}
}
return urlencode($outstuff);
}
return urlencode($instuff);
}

if (file_exists('population.geojson')) {
$rbits=explode(']}}', file_get_contents('./population.geojson'));
for ($irr=1; $irr<(-1 + sizeof($rbits)); $irr++) {
$hdrbit=explode('{"type":"Feature', $rbits[-1 + $irr])[-1 + sizeof(explode('{"type":"Feature', $rbits[-1 + $irr]))];
$hbits=explode(',"NAME":"', $hdrbit);
if (sizeof($hbits) > 1) {
if (strpos($sih, ' id=' . str_replace('+','%20',urlencode(explode('"', $hbits[1])[0])) . ' ') === false) {
$sih.='<option id=' . str_replace('+','%20',urlencode(explode('"', $hbits[1])[0])) . ' value=' . str_replace('+','%20', str_replace('[','', str_replace(']','', str_replace('],[',',' ,explode(']}', explode(':[',$hdrbit)[1])[0])))) . '></option>';
}
}
}
}

if (file_exists('rivers.geojson')) {
$rbits=explode(']]}}', file_get_contents('./rivers.geojson'));
for ($irr=1; $irr<(-1 + sizeof($rbits)); $irr++) {
$hdrbit=explode('{"type":"Feature', $rbits[-1 + $irr])[-1 + sizeof(explode('{"type":"Feature', $rbits[-1 + $irr]))];
$hbits=explode(',"name":"', $hdrbit);
if (sizeof($hbits) > 1) {
if (strpos($sih, 'id=river' . str_replace('+','%20',urlencode(explode('"', $hbits[1])[0])) . '>') === false) {
$rih.='<option value=' . str_replace('+','%20', oururlencode(str_replace('[','', str_replace(']','', str_replace('],[', ',', str_replace(']],[[', ' ', explode(']]}', explode(':[[',$hdrbit)[1])[0])))))) . ' id=river' . str_replace('+','%20',urlencode(explode('"', $hbits[1])[0])) . '></option>';
} else {
$rih=str_replace(' id=river' . str_replace('+','%20', oururlencode(explode('"', $hbits[1])[0])) . '>', str_replace('+','%20', urlencode(str_replace('[','', str_replace(']','', str_replace('],[', ',', str_replace(']],[[', ' ', explode(']]}', explode(':[[',$hdrbit)[1])[0])))))) . ' id=river' . str_replace('+','%20',urlencode(explode('"', $hbits[1])[0])) . '>', $rih);
}
}
}
}

?>

… code usage (ie. the HTML file ends up bigger, to help) in our changed regions.php GeoJson World Coastlines PHP web application in a new window, or you can also try below.


Previous relevant GeoJson World Coastline Function Noun Naming Tutorial is shown below.

GeoJson World Coastline Function Noun Naming Tutorial

GeoJson World Coastline Function Noun Naming Tutorial

We’re working on an extension to yesterday’s GeoJson World Coastline Rivers Quiz Tutorial‘s Rivers Quiz functionality within our GeoJson World Coastlines web application, and have …

  • settled on an approach … but …
  • not yet finished on deployment issues

… but it is this approach we wanted to talk about today.

Our approach borrows from Object Oriented Programming (OOP) the idea that …

  • just as with OOP thinking class names are like nouns and the methods within that class are like verbs … we, with our approach
  • help readability of our non-OOP functional code by including those nouns and verbs, as well as ideas like use of plurals to indicate array involvement, with our Javascript function naming

… we can best illustrate to you via showing you new functions and variables and modified code to show you this approach in code …


var rivers='', arivers=[], iguess=-1, isofar=' ', jscore=0, jgoes=0, elema=null, contexta=null, rectisleft=0, rectistop=0, isokto=true;
var populations='', apopulations=[], jguess=-1, jsofar=' ', both=false, jlastn='';
var idone=false;


function populaterivers() {
var found=-1, ifnd=0;
var rbits=rivers.split(']]}}');
var murraytotal=0.0;
rivers='';
var lastn='', hdrbit='', hbits=[];
for (var irr=1; irr<(-1 + rbits.length); irr++) {
hdrbit=rbits[-1 + irr].split('{' + String.fromCharCode(34) + 'type' + String.fromCharCode(34) + ':' + String.fromCharCode(34) + 'Feature')[eval(-1 + rbits[-1 + irr].split('{' + String.fromCharCode(34) + 'type' + String.fromCharCode(34) + ':' + String.fromCharCode(34) + 'Feature').length)] + '';
//alert(hdrbit);
hbits=hdrbit.split(',' + String.fromCharCode(34) + 'name' + String.fromCharCode(34) + ':' + String.fromCharCode(34));
if (hbits.length > 1) {
if ((!navigator.userAgent.match(/Android|BlackBerry|iPhone|iPad|iPod|Opera Mini|IEMobile/i) || eval('' + arivers.length) <= 200)) {
if (lastn != hbits[1].split(String.fromCharCode(34))[0]) {
lastn=hbits[1].split(String.fromCharCode(34))[0];
found=-1;
if (arivers.length > 0) {
for (ifnd=0; ifnd<arivers.length; ifnd++) {
if (('' + arivers[ifnd]).indexOf(':') != -1 && found == -1) {
if (('' + arivers[ifnd]).split(':')[0] == lastn) { found=ifnd; }
}
}
}
if (found >= 0) {
if (lastn == 'Murray') {
console.log(hdrbit.split(':[[')[1].replace(/\]\]\,\[\[/g,' ').replace(/\]\,\[/g,',').replace(/\[/g,'').replace(/\]/g,''));
}
if (!navigator.userAgent.match(/Android|BlackBerry|iPhone|iPad|iPod|Opera Mini|IEMobile/i)) {
arivers[found]+=' ' + lessit(hdrbit.split(':[[')[1].replace(/\]\]\,\[\[/g,' ').replace(/\]\,\[/g,',').replace(/\[/g,'').replace(/\]/g,''));
}
} else {
if (lastn == 'Murray') {
console.log(lastn + ':' + hdrbit.split(':[[')[1].replace(/\]\]\,\[\[/g,' ').replace(/\]\,\[/g,',').replace(/\[/g,'').replace(/\]/g,''));
}
arivers.push(lastn + ':' + lessit(hdrbit.split(':[[')[1].replace(/\]\]\,\[\[/g,' ').replace(/\]\,\[/g,',').replace(/\[/g,'').replace(/\]/g,'')));
}
} else if (1 == 1 || !navigator.userAgent.match(/Android|BlackBerry|iPhone|iPad|iPod|Opera Mini|IEMobile/i)) {
if (lastn == 'Murray') {
console.log(hdrbit.split(':[[')[1].replace(/\]\]\,\[\[/g,' ').replace(/\]\,\[/g,',').replace(/\[/g,'').replace(/\]/g,''));
}
arivers[-1 + arivers.length]+=' ' + lessit(hdrbit.split(':[[')[1].replace(/\]\]\,\[\[/g,' ').replace(/\]\,\[/g,',').replace(/\[/g,'').replace(/\]/g,''));
}
}
}
}
rbits=[];
lastn='';
//if (navigator.userAgent.match(/Android|BlackBerry|iPhone|iPad|iPod|Opera Mini|IEMobile/i)) {
// alert(arivers.length);
//}
//return;
//plotariver(getariver());
if (!idone) { idone=true; getariver(); }
}


function lessit(maybe) {
var altmaybe='', altmaybed='';
if (navigator.userAgent.match(/Android|BlackBerry|iPhone|iPad|iPod|Opera Mini|IEMobile/i)) {
var acsvs=maybe.split(',');
for (var ic=0; ic<acsvs.length; ic++) {
altmaybe+=altmaybed + (acsvs[ic] + '.xyz').substring(0,eval(3 + (acsvs[ic] + '.xyz').indexOf('.'))).split('.xyz')[0];
altmaybed=',';
}
acsvs=[];
return altmaybe;
}
return maybe;
}


function populatepopulations() {
var found=-1, ifnd=0;
var rbits=populations.split(']}}');
populations='';
var jlastn='', hdrbit='', hbits=[];
for (var irr=1; irr<(-1 + rbits.length); irr++) {
hdrbit=rbits[-1 + irr].split('{' + String.fromCharCode(34) + 'type' + String.fromCharCode(34) + ':' + String.fromCharCode(34) + 'Feature')[eval(-1 + rbits[-1 + irr].split('{' + String.fromCharCode(34) + 'type' + String.fromCharCode(34) + ':' + String.fromCharCode(34) + 'Feature').length)] + '';
//alert(hdrbit);
hbits=hdrbit.split(',' + String.fromCharCode(34) + 'NAME' + String.fromCharCode(34) + ':' + String.fromCharCode(34));
if (hbits.length > 1) {
if (jlastn != hbits[1].split(String.fromCharCode(34))[0]) {
jlastn=hbits[1].split(String.fromCharCode(34))[0];
found=-1;
if (apopulations.length > 0) {
for (ifnd=0; ifnd<apopulations.length; ifnd++) {
if (('' + apopulations[ifnd]).indexOf(':') != -1 && found == -1) {
if (('' + apopulations[ifnd]).split(':')[0] == jlastn) { found=ifnd; }
}
}
}
if (found >= 0) {
if (jlastn == 'Sydney') { console.log(hdrbit.split(':[')[1].replace(/\]\,\[/g,',').replace(/\[/g,'').replace(/\]/g,'')); }
apopulations[found]+=' ' + lessit(hdrbit.split(':[')[1].replace(/\]\,\[/g,',').replace(/\[/g,'').replace(/\]/g,''));
} else {
if (jlastn == 'Sydney') { console.log(jlastn + ':' + hdrbit.split(':[')[1].replace(/\]\,\[/g,',').replace(/\[/g,'').replace(/\]/g,'')); }
apopulations.push(jlastn + ':' + lessit(hdrbit.split(':[')[1].replace(/\]\,\[/g,',').replace(/\[/g,'').replace(/\]/g,'')));
}
} else {
if (jlastn == 'Sydney') { console.log(hdrbit.split(':[')[1].replace(/\]\,\[/g,',').replace(/\[/g,'').replace(/\]/g,'')); }
apopulations[-1 + apopulations.length]+=' ' + lessit(hdrbit.split(':[')[1].replace(/\]\,\[/g,',').replace(/\[/g,'').replace(/\]/g,''));
}
}
}
rbits=[];
jlastn='';
//return;
//plotariver(getariver());
}


function getariver() {
//for (var ih=0; ih<arivers.length; ih++) {
// if (arivers[ih].split(':')[0] == 'Murray') { return ih; }
//}
if (!idone) { document.getElementById('ifrivers').src='./rivers.geojson'; } else if (arivers.length > 0) {
iguess=Math.floor(Math.random() * arivers.length);
if (isofar.indexOf(',' + iguess + ',') != -1) {
while (isofar.indexOf(',' + iguess + ',') != -1) {
iguess=Math.floor(Math.random() * arivers.length);
}
}
isofar+=',' + iguess + ',';
lastn=arivers[iguess].split(':')[0];
plotariver(iguess);
setTimeout(askariver, 8000);
return iguess;
}
}


function askariver() {
var another=false;
var midbit='';
var origboth=both;
var thing='river';
if (!both) { midbit='Append spaces to also answer a question regarding the Populations Quiz, or P to just do Populations Quiz.'; } else { thing='population'; }
var retthis=prompt('What is the name of this new blue river plotted on the world map? ' + midbit + ' Enter ? to get given more time looking at (longitude,latitude) = (' + arivers[iguess].split(':')[1].split(',')[0] + ',' + arivers[iguess].split(':')[1].split(',')[1] + ')', '');
if (retthis == null) {
both=false;
jgoes++;
another=confirm('Bad luck. Answer was ' + lastn + '. Score ' + jscore + '/' + jgoes + '. Another go with a new ' + thing + '?');
} else if (retthis.toLowerCase().trim() == 'p') {
both=false;
isokto=true;
getapopulation();
return '';
} else if (retthis.trim() == '?') {
if (retthis.trim() != retthis && !origboth) { both=true; }
setTimeout(askariver, 8000);
return '';
} else if (retthis.trim() == '') {
if (retthis != '' && !origboth) { thing='population'; }
jgoes++;
another=confirm('Bad luck. Answer was ' + lastn + '. Score ' + jscore + '/' + jgoes + '. Another go with a new ' + thing + '?');
if (retthis != '' && !origboth) { isokto=true; both=true; getapopulation(); }
} else if (lastn.toLowerCase().indexOf(retthis.toLowerCase()) != -1 && lastn.toLowerCase() == retthis.toLowerCase() && retthis.trim().length >= 1) {
if (retthis.trim() != retthis && !origboth) { both=true; thing='population'; }
jgoes++;
jscore++;
another=confirm('Will pay that. Answer was ' + lastn + '. Score ' + jscore + '/' + jgoes + '. Another go with a new ' + thing + '?');
} else if (lastn.toLowerCase().indexOf(retthis.toLowerCase()) == -1) {
if (retthis.trim() != retthis && !origboth) { both=true; thing='population'; }
jgoes++;
another=confirm('Bad luck. Answer was ' + lastn + '. Score ' + jscore + '/' + jgoes + '. Another go with a new ' + thing + '?');
} else if (lastn.toLowerCase() == retthis.toLowerCase()) {
if (retthis.trim() != retthis && !origboth) { both=true; thing='population'; }
jgoes++;
jscore++;
another=confirm('Well done! Answer was ' + lastn + '. Score ' + jscore + '/' + jgoes + '. Another go with a new ' + thing + '?');
} else if (retthis.trim().length >= 1) {
if (retthis.trim() != retthis && !origboth) { both=true; thing='population'; }
jgoes++;
another=confirm('Bad luck. Answer was ' + lastn + '. Score ' + jscore + '/' + jgoes + '. Another go with a new ' + thing + '?');
} else {
if (retthis.trim() != retthis && !origboth) { both=true; thing='population'; }
jgoes++;
jscore++;
another=confirm('Will pay that. Answer was ' + lastn + '. Score ' + jscore + '/' + jgoes + '. Another go with a new ' + thing + '?');
}
if (both && !origboth) { isitok=true; getapopulation(); return ''; } else if (both) { return ''; }
if (another) { if (both) { getariver(); getapopulation(); } else { getariver(); } } else { contexta.clearRect(0,0,360,180); }
return '';
}


function plotariver(which) {
if (both) { isokto=true; }
if (isokto) { contexta.clearRect(0,0,360,180); }
if (both) { isokto=false; }
lastn=arivers[which].split(':')[0];
var rest=arivers[which].split(':')[1];
var consolelog='';
console.log(rest);
var restlonglat=[]; //rest.split(',');
var therest=rest.split(' ');
//alert(eval(180.0 + eval('' + restlonglat[0])) + ',' + eval(90.0 - eval('' + restlonglat[1])));
for (var jrrr=0; jrrr<therest.length; jrrr++) {
restlonglat=therest[jrrr].split(',');
for (var irrr=2; irrr<restlonglat.length; irrr+=2) {
if (eval(1 + irrr) < eval('' + restlonglat.length)) {
if (irrr == 2) {
contexta.strokeStyle = '#0000ff';
contexta.lineWidth = 1;
contexta.beginPath();
//console.log('context.moveTo(' + eval(180.0 + eval('' + restlonglat[0])) + ',' + eval(90.0 - eval('' + restlonglat[1])) + ');');
contexta.moveTo(eval(180.0 + eval('' + restlonglat[0])), eval(90.0 - eval('' + restlonglat[1])));
}
//alert(eval(180.0 + eval('' + restlonglat[irrr])) + ',' + eval(90.0 - eval('' + restlonglat[1 + irrr])));
consolelog=('context.lineTo(' + eval(180.0 + eval('' + restlonglat[eval(0 + eval('' + irrr))])) + ',' + eval(90.0 - eval('' + restlonglat[eval(1 + eval('' + irrr))])) + ');');
if (consolelog.indexOf('NaN') == -1) {
contexta.lineTo(eval(180.0 + eval('' + restlonglat[eval(0 + eval('' + irrr))])), eval(90.0 - eval('' + restlonglat[eval(1 + eval('' + irrr))])));
}
//if (eval(irrr + 1) >= eval('' + restlonglat.length)) { context.stroke(); }
}
}
contexta.stroke();
}
}


function getthejson(iois) {
if (iois.src.indexOf('.geojson') != -1) {
var aconto = (iois.contentWindow || iois.contentDocument);
if (aconto != null) {
if (aconto.document) { aconto = aconto.document; }
if (aconto.body != null) {
if (iois.src.indexOf('rivers.geojson') != -1) {
rivers='' + aconto.body.innerHTML;
setTimeout(populaterivers, 500);
iois.src='./population.geojson';
} else if (iois.src.indexOf('population.geojson') != -1) { // && !navigator.userAgent.match(/Android|BlackBerry|iPhone|iPad|iPod|Opera Mini|IEMobile/i)) {
populations='' + aconto.body.innerHTML;
setTimeout(populatepopulations, 500);
}

}
}
}
}

function getapopulation() {
//for (var ih=0; ih<apopulations.length; ih++) {
// if (apopulations[ih].split(':')[0] == 'Murray') { return ih; }
//}
jguess=Math.floor(Math.random() * apopulations.length);
if (jsofar.indexOf(',' + jguess + ',') != -1) {
while (jsofar.indexOf(',' + jguess + ',') != -1) {
jguess=Math.floor(Math.random() * apopulations.length);
}
}
jsofar+=',' + jguess + ',';
jlastn=apopulations[jguess].split(':')[0];
plotapopulation(jguess);
setTimeout(askapopulation, 9000);
return jguess;
}


function askapopulation() {
var another=false;
var origboth=both;
var midbit='';
var thing='population';
if (!both) { midbit='Append spaces to also answer a question regarding the Rivers Quiz, or R to just do Rivers Quiz.'; } else { thing='river'; }
var retthis=prompt('What is the name of this new red population area plotted on the world map? ' + midbit + ' Enter ? to get given more time looking at (longitude,latitude) = (' + apopulations[jguess].split(':')[1].split(',')[0] + ',' + apopulations[jguess].split(':')[1].split(',')[1] + ')', '');
if (retthis == null) {
both=false;
jgoes++;
another=confirm('Bad luck. Answer was ' + jlastn + '. Score ' + jscore + '/' + jgoes + '. Another go with a new ' + thing + '?');
} else if (retthis.toLowerCase().trim() == 'r') {
both=false;
isokto=true;
getariver();
return '';
} else if (retthis.trim() == '?') {
if (retthis.trim() != retthis && !origboth) { both=true; }
setTimeout(askapopulation, 9000);
return '';
} else if (retthis.trim() == '') {
if (retthis != '' && !origboth) { thing='river'; }
jgoes++;
another=confirm('Bad luck. Answer was ' + jlastn + '. Score ' + jscore + '/' + jgoes + '. Another go with a new ' + thing + '?');
if (retthis != '' && !origboth) { isokto=true; both=true; getariver(); }
} else if (jlastn.toLowerCase().indexOf(retthis.toLowerCase()) != -1 && jlastn.toLowerCase() == retthis.toLowerCase() && retthis.trim().length >= 1) {
if (retthis.trim() != retthis && !origboth) { both=true; thing='river'; }
jgoes++;
jscore++;
another=confirm('Will pay that. Answer was ' + jlastn + '. Score ' + jscore + '/' + jgoes + '. Another go with a new ' + thing + '?');
} else if (jlastn.toLowerCase().indexOf(retthis.toLowerCase()) == -1) {
if (retthis.trim() != retthis && !origboth) { both=true; thing='river'; }
jgoes++;
another=confirm('Bad luck. Answer was ' + jlastn + '. Score ' + jscore + '/' + jgoes + '. Another go with a new ' + thing + '?');
} else if (jlastn.toLowerCase() == retthis.toLowerCase()) {
if (retthis.trim() != retthis && !origboth) { both=true; thing='river'; }
jgoes++;
jscore++;
another=confirm('Well done! Answer was ' + jlastn + '. Score ' + jscore + '/' + jgoes + '. Another go with a new ' + thing + '?');
} else if (retthis.trim().length >= 1) {
if (retthis.trim() != retthis && !origboth) { both=true; thing='river'; }
jgoes++;
another=confirm('Bad luck. Answer was ' + jlastn + '. Score ' + jscore + '/' + jgoes + '. Another go with a new ' + thing + '?');
} else {
if (retthis.trim() != retthis && !origboth) { both=true; thing='river'; }
jgoes++;
jscore++;
another=confirm('Will pay that. Answer was ' + jlastn + '. Score ' + jscore + '/' + jgoes + '. Another go with a new ' + thing + '?');
}
if (both) { contexta.clearRect(0,0,360,180); }
if (both && !origboth) { isitok=true; getariver(); return ''; }
if (another) { if (both) { getariver(); getapopulation(); } else { getapopulation(); } } else { contexta.clearRect(0,0,360,180); }
return '';
}


function plotapopulation(which) {
if (isokto) { contexta.clearRect(0,0,360,180); }
//if (both) { isokto=true; }
jlastn=apopulations[which].split(':')[0];
var rest=apopulations[which].split(':')[1];
var restlonglat=[]; //rest.split(',');
restlonglat=rest.split(',');
if (eval('' + restlonglat.length) >= 2) {
contexta.fillStyle = 'red';
contexta.fillRect(eval(180.0 + eval('' + restlonglat[0])), eval(90.0 - eval('' + restlonglat[1])),1,1);
contexta.fill();
}
}

… in our changed regions.php GeoJson World Coastlines PHP web application in a new window, or you can also try below.


Previous relevant GeoJson World Coastline Rivers Quiz Tutorial is shown below.

GeoJson World Coastline Rivers Quiz Tutorial

GeoJson World Coastline Rivers Quiz Tutorial

It’s time to turn our attention away from GeoJson World Countries, as talked about with yesterday’s GeoJson World Countries Plotted Ports Tutorial, and back to GeoJson World Coastline ideas. Why? We want to add a …


Rivers Quiz

… via the (generously provided) HTTP://geojson.xyz rivers lake centerlines GeoJSON data we download and then uploaded to become rivers.geojson data file. Now we were wondering out of …

  • use the URL to this GeoJSON file as the “src” attribute of an HTML iframe …

    <iframe id=ifrivers onload=getthejson(this); style=display:none; src=./rivers.geojson></iframe>

    … element (and then access the content via the onload event …

    var rivers='', arivers=[], iguess=-1, isofar=' ', jscore=0, jgoes=0, elema=null, contexta=null, rectisleft=0, rectistop=0;

    function getthejson(iois) {
    var aconto = (iois.contentWindow || iois.contentDocument);
    if (aconto != null) {
    if (aconto.document) { aconto = aconto.document; }
    if (aconto.body != null) {
    rivers='' + aconto.body.innerHTML;
    setTimeout(populaterivers, 500);
    }
    }
    }

    … function) would suffice, or if we would end up using …
  • Ajax call

… to access this data, and were a bit surprised the former method was all fine. Of course there are snazzy inbuilt Javascript hierarchical calls you can make to process the data, but we find, with GeoJSON data, in the client realm (where we’re keen to stay with today’s work (though PHP serverside can, of course, be purloined to do all this work, should you have that available)), of Javascript, we just need very basic string functions …

  • split (versus PHP explode)
  • index (versus PHP strpos)
  • substring (versus PHP substr)
  • replace (versus PHP str_replace)
  • push (versus PHP array_push)

… to get by processing …


var rivers='', arivers=[], iguess=-1, isofar=' ', jscore=0, jgoes=0, elema=null, contexta=null, rectisleft=0, rectistop=0;

function populaterivers() {
var found=-1, ifnd=0;
var rbits=rivers.split(']]}}');
var lastn='', hdrbit='', hbits=[];
for (var irr=1; irr<(-1 + rbits.length); irr++) {
hdrbit=rbits[-1 + irr].split('{' + String.fromCharCode(34) + 'type' + String.fromCharCode(34) + ':' + String.fromCharCode(34) + 'Feature')[eval(-1 + rbits[-1 + irr].split('{' + String.fromCharCode(34) + 'type' + String.fromCharCode(34) + ':' + String.fromCharCode(34) + 'Feature').length)] + '';
hbits=hdrbit.split(',' + String.fromCharCode(34) + 'name' + String.fromCharCode(34) + ':' + String.fromCharCode(34));
if (hbits.length > 1) {
if (lastn != hbits[1].split(String.fromCharCode(34))[0]) {
lastn=hbits[1].split(String.fromCharCode(34))[0];
found=-1;
if (arivers.length > 0) {
for (ifnd=0; ifnd<arivers.length; ifnd++) {
if (('' + arivers[ifnd]).indexOf(':') != -1 && found == -1) {
if (('' + arivers[ifnd]).split(':')[0] == lastn) { found=ifnd; }
}
}
}
if (found >= 0) {
//if (lastn == 'Murray') { console.log(hdrbit.split(':[[')[1].replace(/\]\]\,\[\[/g,' ').replace(/\]\,\[/g,',').replace(/\[/g,'').replace(/\]/g,'')); }
arivers[found]+=' ' + hdrbit.split(':[[')[1].replace(/\]\]\,\[\[/g,' ').replace(/\]\,\[/g,',').replace(/\[/g,'').replace(/\]/g,'');
} else {
//if (lastn == 'Murray') { console.log(lastn + ':' + hdrbit.split(':[[')[1].replace(/\]\]\,\[\[/g,' ').replace(/\]\,\[/g,',').replace(/\[/g,'').replace(/\]/g,'')); }
arivers.push(lastn + ':' + hdrbit.split(':[[')[1].replace(/\]\]\,\[\[/g,' ').replace(/\]\,\[/g,',').replace(/\[/g,'').replace(/\]/g,''));
}
} else {
//if (lastn == 'Murray') { console.log(hdrbit.split(':[[')[1].replace(/\]\]\,\[\[/g,' ').replace(/\]\,\[/g,',').replace(/\[/g,'').replace(/\]/g,'')); }
arivers[-1 + arivers.length]+=' ' + hdrbit.split(':[[')[1].replace(/\]\]\,\[\[/g,' ').replace(/\]\,\[/g,',').replace(/\[/g,'').replace(/\]/g,'');
}
}
}
lastn='';
}

… the (ever so) consistent GeoJSON data!

The progress with GeoJson World Countries helped too. We knew to add another HTML canvas layer as per

  • document.body (now with the new onmousemove=airportplot(event); event logic) lowest level …
  • overlayed by HTML canvas element plotted with world country linework … now including …
  • overlayed by HTML canvas element dedicated to nearest airport plotting …

    <canvas id=myacanvas height='180' width='360' style='background-color:transparent;z-index:55;display:inline-block;position:absolute;top:0px;left:0px;'></canvas>
  • overlayed by HTML img (transparent image) element and its associated image map area elements … and today we add into the mix …
  • HTML div hosting SVG elements overlaying initialized with “land” parts green infilled SVG at a mid range z-index (only as well as when called upon) individual GeoJson entities overlay

… and to, at document.body onload logic …


// ... and extended document.body onload event logic has added, up near its top ...
elema = document.getElementById('myacanvas');
contexta = elema.getContext('2d');

… and supplement with another HTML sub “emoji button” ❓ ( &#10067; ) type element …


<sub style=cursor:pointer; onclick=getariver(); title='River Quiz'>&#10067;</sub>

… allowing for …


function getariver() {
//for (var ih=0; ih<arivers.length; ih++) {
// if (arivers[ih].split(':')[0] == 'Murray') { return ih; }
//}
iguess=Math.floor(Math.random() * arivers.length);
if (isofar.indexOf(',' + iguess + ',') != -1) {
while (isofar.indexOf(',' + iguess + ',') != -1) {
iguess=Math.floor(Math.random() * arivers.length);
}
}
isofar+=',' + iguess + ',';
lastn=arivers[iguess].split(':')[0];
plotariver(iguess);
setTimeout(askariver, 8000);
return iguess;
}

function askariver() {
var another=false;
var retthis=prompt('What is the name of this new blue river plotted on the world map? Enter ? to get given more time looking at (longitude,latitude) = (' + arivers[iguess].split(':')[1].split(',')[0] + ',' + arivers[iguess].split(':')[1].split(',')[1] + ')', '');
if (retthis == null) {
jgoes++;
another=confirm('Bad luck. Answer was ' + lastn + '. Score ' + jscore + '/' + jgoes + '. Another go with a new river?');
} else if (retthis.trim() == '?') {
setTimeout(askariver, 8000);
return '';
} else if (retthis.trim() == '') {
jgoes++;
another=confirm('Bad luck. Answer was ' + lastn + '. Score ' + jscore + '/' + jgoes + '. Another go with a new river?');
} else if (lastn.toLowerCase().indexOf(retthis.toLowerCase()) == -1) {
jgoes++;
another=confirm('Bad luck. Answer was ' + lastn + '. Score ' + jscore + '/' + jgoes + '. Another go with a new river?');
} else if (lastn.toLowerCase() == retthis.toLowerCase()) {
jgoes++;
jscore++;
another=confirm('Well done! Answer was ' + lastn + '. Score ' + jscore + '/' + jgoes + '. Another go with a new river?');
} else if (retthis.trim().length >= 1) {
jgoes++;
another=confirm('Bad luck. Answer was ' + lastn + '. Score ' + jscore + '/' + jgoes + '. Another go with a new river?');
} else {
jgoes++;
jscore++;
another=confirm('Will pay that. Answer was ' + lastn + '. Score ' + jscore + '/' + jgoes + '. Another go with a new river?');
}
if (another) { getariver(); } else { contexta.clearRect(0,0,360,180); }
return '';
}

function plotariver(which) {
contexta.clearRect(0,0,360,180);
lastn=arivers[which].split(':')[0];
var rest=arivers[which].split(':')[1];
console.log(rest);
var restlonglat=[]; //rest.split(',');
var therest=rest.split(' ');
//alert(eval(180.0 + eval('' + restlonglat[0])) + ',' + eval(90.0 - eval('' + restlonglat[1])));
for (var jrrr=0; jrrr<therest.length; jrrr++) {
restlonglat=therest[jrrr].split(',');
for (var irrr=2; irrr<restlonglat.length; irrr+=2) {
if (irrr == 2) {
contexta.strokeStyle = '#0000ff';
contexta.lineWidth = 1;
contexta.beginPath();
console.log('context.moveTo(' + eval(180.0 + eval('' + restlonglat[0])) + ',' + eval(90.0 - eval('' + restlonglat[1])) + ');');
contexta.moveTo(eval(180.0 + eval('' + restlonglat[0])), eval(90.0 - eval('' + restlonglat[1])));
}
//alert(eval(180.0 + eval('' + restlonglat[irrr])) + ',' + eval(90.0 - eval('' + restlonglat[1 + irrr])));
console.log('context.lineTo(' + eval(180.0 + eval('' + restlonglat[eval(0 + eval('' + irrr))])) + ',' + eval(90.0 - eval('' + restlonglat[eval(1 + eval('' + irrr))])) + ');');
contexta.lineTo(eval(180.0 + eval('' + restlonglat[eval(0 + eval('' + irrr))])), eval(90.0 - eval('' + restlonglat[eval(1 + eval('' + irrr))])));
//if (eval(irrr + 1) >= eval('' + restlonglat.length)) { context.stroke(); }
}
contexta.stroke();
}
}

… to work the Rivers Quiz. Finally, though, for all good practicalities we also need those zoom logics out of GeoJson World Countries logic, via “emoji button” 🔎 ( &#128270; ) …


<a style=cursor:pointer; title='Zoom In' onclick='event.stopPropagation(); event.preventDefault(); zoomin();'>&#128270;</a>

… calling on meta name=viewport tag for mobile …


<meta id='myviewport' name='viewport' content='width=device-width, initial-scale=1, minimum-scale=0.1, maximum-scale=8, user-scalable=yes' >

… as well as the zooming Javascript …


var jzoom=1.0, izoom=location.search.split('zoom=')[1] ? eval(decodeURIComponent(location.search.split('zoom=')[1].split('&')[0])) : 1.0;

function zoomin() {
if (navigator.userAgent.match(/Android|BlackBerry|iPhone|iPad|iPod|Opera Mini|IEMobile/i)) {
jzoom*=2;
document.getElementById('myviewport').setAttribute('content', 'width=device-width, initial-scale=' + eval(jzoom * izoom) + ', minimum-scale=0.1, maximum-scale=8, user-scalable=yes');
window.scrollTo(0,0); //izoom*=2;
} else {
//if (1 == 1) {
// alert('Please use your web browser View Menu options Zoom In or Zoom Out');
//} else {
document.body.style.zoom=('' + eval(izoom * 200.0) + '%');
izoom*=2;
//location.href=document.URL.split('?')[0].split('#')[0] + '?zoom=' + encodeURIComponent('' + eval(2 * izoom));
//}
}
}

So feel free to try the new Rivers Quiz in our changed regions.php GeoJson World Coastlines PHP web application in a new window, or you can also try below.


Previous relevant GeoJson World Countries Plotted Ports Tutorial is shown below.

GeoJson World Countries Plotted Ports Tutorial

GeoJson World Countries Plotted Ports Tutorial

There are a few interesting aspects to today’s extension of functionality onto yesterday’s GeoJson World Countries Plotted Airports Tutorial‘s GeoJson World Countries web application …

  • where to modularise … we think “data collection” commonality is a good reason, and so we make these changes to intair.php
  • making an (“animated emoji”) button dual purpose on top of originally being a single purpose button …

    <sub title='Show Nearby Airports' onclick='doair=how(true,this); twothousand*=2; this.title=this.title.substring(0,4) + String.fromCharCode(105) + String.fromCharCode(110) + String.fromCharCode(103) + this.title.replace(this.title.split(String.fromCharCode(32))[0] + String.fromCharCode(32), String.fromCharCode(32));' data-type=9992 style=cursor:pointer; id=portsub>&#9992;</sub>

    … working with the intairsuffix global variable that could add a new GET argument where both the “port” label in &port=[value] and that [value] can affect behaviour from the intair.php PHP helper tool above …

    var intairsuffix='', zhra=null, zhrb=null, kklat=0, kklong=0, doair=false, vsll=[-999.0], answered=true;

    function how(atr, isub) {
    var curgd=isub.getAttribute('data-type');
    if (('' + curgd) == '9992') { // airport
    if (intairsuffix != '') {
    intairsuffix='&port=air';
    isub.title='Showing Nearby Airports and Ports';
    document.getElementById('title').value='Nearby Timezone Places and Airports and Ports';
    }
    } else if (('' + curgd) == '128674') { // port
    if (intairsuffix == '') {
    if (doair) {
    intairsuffix='&port=air';
    isub.title='Showing Nearby Airports and Ports';
    document.getElementById('title').value='Nearby Timezone Places and Airports and Ports';
    } else {
    intairsuffix='&port=y';
    isub.title='Showing Nearby Ports';
    document.getElementById('title').value='Nearby Timezone Places and Ports';
    }
    }
    }
    return true;
    }

    function feedhow() {
    var isub=document.getElementById('portsub');
    var curgd=isub.getAttribute('data-type');
    if (('' + curgd) == '9992') { // airport
    isub.innerHTML='&#128674;';
    isub.setAttribute('data-type', '128674');
    } else if (('' + curgd) == '128674') { // port
    isub.innerHTML='&#9992;';
    isub.setAttribute('data-type', '9992');
    }
    }

  • Ajax asynchronous usage for second half of a synchronous previous usage

    var intairsuffix='', zhra=null, zhrb=null, kklat=0, kklong=0, doair=false, vsll=[-999.0], answered=true;

    function stateChangedb() {
    if (zhrb.readyState == 4) {
    if (zhrb.status == 200) {
    var rectis=document.body.getBoundingClientRect();
    var topllong=-180.0;
    var topllat=90.0;
    var onepixelequals=izoom;
    var bts=zhrb.response.split('.src + ' + String.fromCharCode(39));
    if (eval('' + bts.length) > 1) {
    for (var ijh=1; ijh<bts.length; ijh++) {
    var vs=eval(eval(eval(eval(-topllong + eval(bts[ijh].split(String.fromCharCode(39))[0].split('[')[1].split(',')[1])) * onepixelequals) + eval(0 * eval(rectis.left))) +
    eval(eval(eval(topllat - eval(bts[ijh].split(String.fromCharCode(39))[0].split('[')[1].split(',')[0])) * onepixelequals) + eval(0 * eval(rectis.top))));
    if (!inarray(vs,vsll)) {
    vsll.push(vs);
    drawaac(
    eval(eval(eval(-topllong + eval(bts[ijh].split(String.fromCharCode(39))[0].split('[')[1].split(',')[1])) * onepixelequals) + eval(0 * eval(rectis.left))),
    eval(eval(eval(topllat - eval(bts[ijh].split(String.fromCharCode(39))[0].split('[')[1].split(',')[0])) * onepixelequals) + eval(0 * eval(rectis.top)))
    );
    }
    }
    }
    }
    }
    }


    function stateChangeda() {
    if (zhra.readyState == 4) {
    if (zhra.status == 200) {
    var rectis=document.body.getBoundingClientRect();
    var topllong=-180.0;
    var topllat=90.0;
    var onepixelequals=izoom;
    var bts=zhra.response.split('.src + ' + String.fromCharCode(39));
    if (eval('' + bts.length) > 1) {
    for (var ijh=1; ijh<bts.length; ijh++) {
    var vs=eval(eval(eval(eval(-topllong + eval(bts[ijh].split(String.fromCharCode(39))[0].split('[')[1].split(',')[1])) * onepixelequals) + eval(0 * eval(rectis.left))) +
    eval(eval(eval(topllat - eval(bts[ijh].split(String.fromCharCode(39))[0].split('[')[1].split(',')[0])) * onepixelequals) + eval(0 * eval(rectis.top))));
    if (!inarray(vs,vsll)) {
    vsll.push(vs);
    drawaac(
    eval(eval(eval(-topllong + eval(bts[ijh].split(String.fromCharCode(39))[0].split('[')[1].split(',')[1])) * onepixelequals) + eval(0 * eval(rectis.left))),
    eval(eval(eval(topllat - eval(bts[ijh].split(String.fromCharCode(39))[0].split('[')[1].split(',')[0])) * onepixelequals) + eval(0 * eval(rectis.top)))
    );
    }
    }
    }
    if (intairsuffix.indexOf('&port=air') != -1) {
    zhrb = new XMLHttpRequest();
    zhrb.onreadystatechange=stateChangedb;
    zhrb.open('get', '/HTMLCSS/intair.php?num=6&lat=' + kklat + '&long=' + kklong + '&port=y', true);
    zhrb.send(null);
    }

    answered=true;
    }
    }
    }

    function naira(klat, klong) {
    if (answered && doair) {
    answered=false;
    zhra = new XMLHttpRequest();
    zhra.onreadystatechange=stateChangeda;
    console.log('/HTMLCSS/intair.php?num=6&lat=' + klat + '&long=' + klong + intairsuffix);
    if (intairsuffix.indexOf('&port=air') != -1) {
    kklat=klat;
    kklong=klong;
    zhra.open('get', '/HTMLCSS/intair.php?num=6&lat=' + klat + '&long=' + klong, true);
    } else {

    zhra.open('get', '/HTMLCSS/intair.php?num=6&lat=' + klat + '&long=' + klong + intairsuffix, true);
    }
    zhra.send(null);
    }
    }

    … keeps a fastish synchronous call (that we enforce via that answered global variable) but truely invokes an asynchronous arrangement extracting Nearby Ports data to plot, as applicable

in adding

So far, with yesterday’s GeoJson World Countries Google Directions Trip Tutorial‘s GeoJson World Countries points of interest include …

… in our changed countries.php web application you can also try below.


Previous relevant GeoJson World Countries Plotted Airports Tutorial is shown below.

GeoJson World Countries Plotted Airports Tutorial

GeoJson World Countries Plotted Airports Tutorial

Introducing the Map Chart recognition of nearby Airports with yesterday’s GeoJson World Countries Nearest Airports Tutorial‘s progress on our latest GeoJson World Countries PHP web application, it set us to seeing …

  • the combination of Google Directions‘s talents allowing you to reposition on the fly … and …
  • the onmousemove event, at least for our non-mobile users

… could mean that if we pre-plot airports on the world map, given that the user has clicked the ✈ ( &#9992; ) “Show an Interest in Airports” emoji button, as a non-mobile user hovers over the world map, this pre-plotting might help trip planners with their travel options, should air travel be part of their interest, in the same way it is an option up at Google Directions in our changed countries.php web application you can also try below. The overlay scenario now reads

  • document.body (now with the new onmousemove=airportplot(event); event logic) lowest level …
  • overlayed by HTML canvas element plotted with world country linework … now including …
  • overlayed by HTML canvas element dedicated to nearest airport plotting …

    <canvas id=myacanvas height='180' width='360' style='background-color:transparent;z-index:55;display:inline-block;position:absolute;top:0px;left:0px;'></canvas>
  • overlayed by HTML img (transparent image) element and its associated image map area elements … and today we add into the mix …
  • HTML div hosting SVG elements overlaying initialized with “land” parts green infilled SVG at a mid range z-index (only as well as when called upon) individual GeoJson entities overlay

… worked by new (sometimes Ajax) Javascript code …


var zhra=null, elema=null, contexta=null, answered=true, vsll=[-999.0], doair=false; // clicking ✈ sets doair=true;

function drawaac(centerX, centerY) {
contexta.beginPath();
contexta.globalAlpha = 0.9;
if (1 == 1) {
contexta.fillStyle = 'black';
contexta.fillRect(centerX / izoom, centerY / izoom,1,1);
contexta.fill();
} else {
contexta.arc(centerX / izoom, centerY / izoom, 1, 0, 2 * Math.PI, false);
contexta.fillStyle = 'black';
contexta.fill();
contexta.lineWidth = 5;
contexta.lineWidth = 0.00001;
contexta.strokeStyle = '#003300';
contexta.stroke();
}
return true;
}

function inarray(needle, haystack) { // thanks to https://stackoverflow.com/questions/784012/javascript-equivalent-of-phps-in-array
var length = haystack.length;
for (var i = 0; i < length; i++) {
if (haystack[i] == needle) return true;
}
return false;
}

function stateChangeda() {
if (zhra.readyState == 4) {
if (zhra.status == 200) {
var rectis=document.body.getBoundingClientRect();
var topllong=-180.0;
var topllat=90.0;
var onepixelequals=izoom;
var bts=zhra.response.split('.src + ' + String.fromCharCode(39));
if (eval('' + bts.length) > 1) {
for (var ijh=1; ijh<bts.length; ijh++) {
var vs=eval(eval(eval(eval(-topllong + eval(bts[ijh].split(String.fromCharCode(39))[0].split('[')[1].split(',')[1])) * onepixelequals) + eval(0 * eval(rectis.left))) +
eval(eval(eval(topllat - eval(bts[ijh].split(String.fromCharCode(39))[0].split('[')[1].split(',')[0])) * onepixelequals) + eval(0 * eval(rectis.top))));
if (!inarray(vs,vsll)) {
vsll.push(vs);
drawaac(
eval(eval(eval(-topllong + eval(bts[ijh].split(String.fromCharCode(39))[0].split('[')[1].split(',')[1])) * onepixelequals) + eval(0 * eval(rectis.left))),
eval(eval(eval(topllat - eval(bts[ijh].split(String.fromCharCode(39))[0].split('[')[1].split(',')[0])) * onepixelequals) + eval(0 * eval(rectis.top)))
);
}
}
}
answered=true;
}
}
}

function naira(klat, klong) {
if (answered && doair) {
answered=false;
zhra = new XMLHttpRequest();
zhra.onreadystatechange=stateChangeda;
zhra.open('get', '/HTMLCSS/intair.php?num=6&lat=' + klat + '&long=' + klong, true);
zhra.send(null);
}
}

function airportplot(e) {
if (answered) {
var rectis=null; //document.body.getBoundingClientRect();
var blat=0, blong=0;
var topllong=-180.0;
var topllat=90.0;
onepixelequals=eval(0.0 + eval(1.0 * izoom));
e = e || window.event;
e.preventDefault();
if (e.touches) {
if (e.touches[0].pageX) {
naira(eval(-rectisleft + e.touches[0].pageX), eval(-rectistop + e.touches[0].pageY)); //if (drawac(eval(-rectisleft + e.touches[0].pageX), eval(-rectistop + e.touches[0].pageY))) e = e; }
} else {
rectis=document.body.getBoundingClientRect();
naira(eval(-rectis.left + e.touches[0].clientX), eval(-rectis.top + e.touches[0].clientY)); //if (drawac(eval(-rectis.left + e.touches[0].clientX), eval(-rectis.top + e.touches[0].clientY))) { e = e; }
}
} else if (e.pageX || e.pageY) {
blat=eval(eval(eval(topllat * onepixelequals - eval(-rectistop + e.pageY) * 1)) / onepixelequals);
blong=eval(eval(eval(topllong * onepixelequals + eval(-rectisleft + e.pageX) * 1)) / onepixelequals);
if ((blat >= -90.0 && blat <= 90.0) && (blong >= -180.0 && blong <= 180.0)) {
naira(blat, blong); //if (drawac(eval(-rectisleft + e.pageX), eval(-rectistop + e.pageY))) { e = e; }
}
} else {
rectis=document.body.getBoundingClientRect();
naira(eval(-rectis.left + e.clientX), eval(-rectis.top + e.clientY)); //if (drawac(eval(-rectis.left + e.clientX), eval(-rectis.top + e.clientY))) { e = e; }
}
}
}

// ... and extended document.body onload event logic has added, up near its top ...
elema = document.getElementById('myacanvas');
contexta = elema.getContext('2d');


Previous relevant GeoJson World Countries Nearest Airports Tutorial is shown below.

GeoJson World Countries Nearest Airports Tutorial

GeoJson World Countries Nearest Airports Tutorial

So far, with yesterday’s GeoJson World Countries Google Directions Trip Tutorial‘s GeoJson World Countries points of interest include …

… being as we’re into trip planning now!


var airportstuff='', doair=false, zhr=null;

function stateChanged() {
if (zhr.readyState == 4) {
if (zhr.status == 200) {
var bts=zhr.response.split('.src + ' + String.fromCharCode(39));
if (eval('' + bts.length) > 1) {
for (var ijh=1; ijh function windowopen(p1, p2, p3) {
if (p1.length > 800) {
document.getElementById('iddata').value=(p1.split('&data=')[1].split('&')[0].split('#')[0]).replace(/\&20\;/g,' ');
document.getElementById('smapif').click();
return null;
}
return window.open(p1, p2, p3);
}

function apm(mu) {
if (airportstuff != '' && doair) {
return (mu + airportstuff).replace('&', encodeURIComponent(' and Airports') + '&');
}
return mu;
}

function nair(klat, klong) {
airportstuff='';
zhr = new XMLHttpRequest();
zhr.onreadystatechange=stateChanged;
zhr.open('get', '/HTMLCSS/intair.php?num=4&lat=' + klat + '&long=' + klong, true);
zhr.send(null);
}


function alats(inlat) {
if (inlat == 0 && lastlats.length == 0) { inlat=inlat; } else { lastlats.push(inlat); }
return inlat;
}

function alongs(inlong) {
if (inlong == 0 && lastlongs.length == 0) { inlong=inlong; } else { lastlongs.push(inlong); }
setTimeout(prenair, 200); //nair(thislat, inlong);
return inlong;
}

function prenair() {
nair(thislat, thislong);
}

… featuring Ajax Javascript code.

Try this out with our changed countries.php web application you can also try below.


Previous relevant GeoJson World Countries Google Directions Trip Tutorial is shown below.

GeoJson World Countries Google Directions Trip Tutorial

GeoJson World Countries Google Directions Trip Tutorial

Adding to the “zoom” progress of yesterday’s GeoJson World Countries Zoom Tutorial, today, we wanted to …

  • add interfacing functionality to the excellent Google Directions part of Google Maps, perhaps to help with Trip planning, or even just to associate a Placename with a latitude and longitude as clicked by the user, via the very simple URL arrangement …
    https://www.google.com/maps/dir/[decimalLatitudeDegrees]/[decimalLongitudeDegrees]
    … helped out by new Javascript functions …

    var lastlats=[], lastlongs=[], lastlat=-99.0, lastlong=-99.0, thislat=0.0, thislong=0.0;

    function preface(inblurb) {
    var extras='';
    var outblurb=inblurb;
    if (Math.abs(eval('' + lastlat)) > 0.0 || Math.abs(eval('' + lastlong)) > 0.0) {
    if (Math.abs(eval('' + lastlat)) <= 90.0 && Math.abs(eval('' + lastlong)) <= 180.0) { extras=' Add G for Google Directions between (' + lastlat + ',' + lastlong + ') to (' + thislat + ',' + thislong + ') and spaces (also more trip legs) to hashtag navigate to Google Charts later. '; } } return extras + outblurb; }
    function alats(inlat) {
    if (inlat == 0 && lastlats.length == 0) { inlat=inlat; } else { lastlats.push(inlat); }
    return inlat;
    }

    function alongs(inlong) {
    if (inlong == 0 && lastlongs.length == 0) { inlong=inlong; } else { lastlongs.push(inlong); }
    return inlong;
    }

    … and …
  • add some hashtag navigation (fairly self explanatory emoji button ) ideas now that our GeoJson world map can be zoomed in on

… in our changed countries.php web application you can also try below.


Previous relevant GeoJson World Countries Zoom Tutorial is shown below.

GeoJson World Countries Zoom Tutorial

GeoJson World Countries Zoom Tutorial

Onto yesterday’s GeoJson World Countries TimeZone Times Tutorial GeoJson World Countries web application’s capabilities we want to add zooming, that doesn’t rely on web browser functionality (which continues to work). With that in mind we create a new emoji ( &#128270; ) 🔎 link, with this onclick event code …


var jzoom=1.0, izoom=location.search.split('zoom=')[1] ? eval(decodeURIComponent(location.search.split('zoom=')[1].split('&')[0])) : 1.0;

function zoomin() {
if (navigator.userAgent.match(/Android|BlackBerry|iPhone|iPad|iPod|Opera Mini|IEMobile/i)) {
jzoom*=2;
document.getElementById('myviewport').setAttribute('content', 'width=device-width, initial-scale=' + eval(jzoom * izoom) + ', minimum-scale=0.1, maximum-scale=8, user-scalable=yes');
window.scrollTo(0,0);
} else {
document.body.style.zoom=('' + eval(izoom * 200.0) + '%');
izoom*=2;
}
}

… to multiply the webpage zoom factor in a programmatical way. To acheive this, we have a two way approach (as you might have surmised from above) …

  • for mobile, the logic is easier by introducing a new meta name=viewport …

    <meta id="myviewport" name="viewport" content="width=device-width, initial-scale=1, minimum-scale=0.1, maximum-scale=8, user-scalable=yes" >

    … tag … while …
  • for non-mobile we needed to realize that event.pageX and event.pageY co-ordinates grow in proportion to the zoom factor, and that better latitude and longitude determining lines of code would go

    function canvasclick(e) {
    var rectis=document.body.getBoundingClientRect();
    var topllong=-180.0;
    var topllat=90.0;
    onepixelequals=eval(0.0 + eval(1.0 * izoom));
    //document.title='canvasclick';
    e = e || window.event;
    e.preventDefault();
    if (e.touches) {
    if (e.touches[0].pageX) {
    //lastl='Longitude,Latitude coordinates are ' + eval(topllong + eval(-rectis.left + e.touches[0].pageX) * onepixelequals) + ',' + eval(topllat - eval(-rectis.top + e.touches[0].pageY) * onepixelequals);
    if (drawc(eval(-rectisleft + e.touches[0].pageX), eval(-rectistop + e.touches[0].pageY))) {
    thislat=eval(topllat - eval(-rectistop + e.touches[0].pageY) * onepixelequals);
    thislong=eval(topllong + eval(-rectisleft + e.touches[0].pageX) * onepixelequals);
    //console.log('rectistop=' + rectistop + ' and rectisleft=' + rectisleft + ' and rectisy=' + rectisy + ' and thislat=' + thislat);
    document.getElementById('nearestif').src='/PHP/tz_places.php?place=&latitude=' + encodeURIComponent('' + eval(topllat - eval(-rectistop + e.touches[0].pageY) * onepixelequals)) + '&longitude=' + encodeURIComponent('' + eval(topllong + eval(-rectisleft + e.touches[0].pageX) * onepixelequals)) + '&ntztontz=y';
    }
    } else {

    //lastl='Longitude,Latitude coordinates are ' + eval(topllong + eval(-rectis.left + e.touches[0].clientX) * onepixelequals) + ',' + eval(topllat - eval(-rectis.top + e.touches[0].clientY) * onepixelequals);
    if (drawc(eval(-rectis.left + e.touches[0].clientX), eval(-rectis.top + e.touches[0].clientY))) {
    thislat=eval(topllat - eval(-rectis.top + e.touches[0].clientY) * onepixelequals);
    thislong=eval(topllong + eval(-rectis.left + e.touches[0].clientX) * onepixelequals);
    //console.log('rectis.top=' + rectis.top + ' and rectis.left=' + rectis.left + ' and rectis.y=' + rectis.y + ' anD thislat=' + thislat);
    document.getElementById('nearestif').src='/PHP/tz_places.php?place=&latitude=' + encodeURIComponent('' + eval(topllat - eval(-rectis.top + e.touches[0].clientY) * onepixelequals)) + '&longitude=' + encodeURIComponent('' + eval(topllong + eval(-rectis.left + e.touches[0].clientX) * onepixelequals)) + '&ntztontz=y';
    }
    }
    } else if (e.pageX || e.pageY) {
    //lastl='Longitude,Latitude coordinates are ' + eval(topllong + e.clientX * onepixelequals) + ',' + eval(topllat - e.clientY * onepixelequals);
    //alert('02: ' + e.screenX + ' ' + e.pageX + ' ' + e.screenY + ' ' + e.pageY + ' ' + thislong + ' ' + thislat);
    if (drawc(eval(-rectisleft + e.pageX), eval(-rectistop + e.pageY))) {
    //thislat=eval(topllat - eval(-rectistop + e.pageY) * onepixelequals);
    //thislong=eval(topllong + eval(-rectisleft + e.pageX) * onepixelequals);
    thislat=eval(eval(eval(topllat * onepixelequals - eval(-rectistop + e.pageY) * 1)) / onepixelequals);
    thislong=eval(eval(eval(topllong * onepixelequals + eval(-rectisleft + e.pageX) * 1)) / onepixelequals);

    //alert('22: ' + e.screenX + ' ' + e.pageX + ' ' + e.screenY + ' ' + e.pageY + ' ' + thislong + ' ' + thislat);
    //console.log('rectistop=' + rectistop + ' and rectisleft=' + rectisleft + ' and rectisy=' + rectisy + ' aNd thislat=' + thislat + ' and e.pageY=' + e.pageY + ' and new plus idea=' + eval(topllat - eval(rectistop + e.pageY) * onepixelequals));
    //document.getElementById('nearestif').src='/PHP/tz_places.php?place=&latitude=' + encodeURIComponent('' + eval(topllat - eval(-rectistop + e.pageY) * onepixelequals)) + '&longitude=' + encodeURIComponent('' + eval(topllong + eval(-rectisleft + e.pageX) * onepixelequals)) + '&ntztontz=y';
    document.getElementById('nearestif').src='/PHP/tz_places.php?place=&latitude=' + encodeURIComponent('' + thislat) + '&longitude=' + encodeURIComponent('' + thislong) + '&ntztontz=y';
    }
    } else {
    //lastl='Longitude,Latitude coordinates are ' + eval(topllong + eval(-rectis.left + e.pageX) * onepixelequals) + ',' + eval(topllat - eval(-rectis.top + e.pageY) * onepixelequals);
    if (drawc(eval(-rectis.left + e.clientX), eval(-rectis.top + e.clientY))) {
    thislat=eval(topllat - eval(-rectis.top + e.clientY) * onepixelequals);
    thislong=eval(topllong + eval(-rectis.left + e.clientX) * onepixelequals);
    //console.log('rectis.top=' + rectis.top + ' and rectis.left=' + rectis.left + ' and rectis.y=' + rectis.y + ' And thislat=' + thislat);
    document.getElementById('nearestif').src='/PHP/tz_places.php?place=&latitude=' + encodeURIComponent('' + eval(topllat - eval(-rectis.top + e.clientY) * onepixelequals)) + '&longitude=' + encodeURIComponent('' + eval(topllong + eval(-rectis.left + e.clientX) * onepixelequals)) + '&ntztontz=y';
    }
    }
    }

… in our changed countries.php web application you can also try below.


Previous relevant GeoJson World Countries TimeZone Times Tutorial is shown below.

GeoJson World Countries TimeZone Times Tutorial

GeoJson World Countries TimeZone Times Tutorial

Some readers might be aware of our “theory regarding adverbs” and “web applications” on the net …

  • the most catered for adverb relates to the “where of life” … and the second banana is …
  • the “when of life”

… and, further to yesterday’s GeoJson World Countries SVG Overlay Safari Error Tutorial‘s emphasis on the “where of life”, today we add in a bit of the “when of life”, something right down the line of the remit of TimeZone talents.

Seriously though, a lot of us dream of the rest of the world on a world map, and wonder what time it is in other parts of the world. Phone call to relatives? A reminder SMS call? Email a game collaboration? It could all be part of life’s rich tapestry!

The expresion of this, for us, today, improving the communications with our current GeoJsom World Countries web application, take the form of emoji clocks from the 12 hour clock example forms such as …

  • 1 o’clock is &#128336; 🕐
  • 2 o’clock is &#128337; 🕑
  • 12 o’clock is &#128347; 🕛
  • 2:30 is &#128349; 🕝
  • 11:30 is &#128358; 🕦
  • 12:30 is &#128359; 🕧

… to show in “prompt” and “confirm” popup windows, as well as Map Chart maps … via new Javascript functions …


function clockit(hoursoffgmt) {
// 1 o'clock is 🕐
// 2 o'clock is 🕑
// 12 o'clock is 🕛
// 2:30 is 🕝
// 11:30 is 🕦
// 12:30 is 🕧
var along='Saturday,Sunday,Monday,Tuesday,Wednesday,Thursday,Friday,Saturday,Sunday';
var gmtdatetimeis='' + new Date().toUTCString();
var daybit='';
var ampm=' am';
if (gmtdatetimeis.indexOf('day') != -1) {
ampm+=', ' + gmtdatetimeis.split('day')[0].split(' ')[eval(-1 + gmtdatetimeis.split('day')[0].split(' ').length)] + 'day';
} else if (gmtdatetimeis.indexOf(',') != -1) {
ampm+=', ' + (gmtdatetimeis.split(',')[0].split(' ')[eval(-1 + gmtdatetimeis.split(',')[0].split(' ').length)] + '').replace(/^Sat$/g,'Saturday').replace(/^Sun$/g,'Sunday').replace(/^Mon$/g,'Monday').replace(/^Tue$/g,'Tuesday').replace(/^Wed$/g,'Wednesday').replace(/^Thu$/g,'Thursday').replace(/^Fri$/g,'Friday');
}
if (ampm.length > 3) { daybit=ampm.substring(5); }
var minis=eval('' + gmtdatetimeis.split(':')[1]);
var hris=eval(('' + gmtdatetimeis.split(':')[0]).split(' ')[eval(-1 + ('' + gmtdatetimeis.split(':')[0]).split(' ').length)]);
if (('' + hoursoffgmt).indexOf('-') != -1 && eval(eval('' + hoursoffgmt.replace('+','')) + hris) < 0.0) {
ampm=ampm.replace('am', 'pm');
if (daybit != '') { ampm=ampm.replace(daybit, along.split(',' + daybit)[0].split(',')[eval(-1 + along.split(',' + daybit)[0].split(',').length)]); }
} else if (('' + hoursoffgmt).indexOf('-') == -1 && eval(eval('' + hoursoffgmt.replace('+','')) + hris) >= 24) {
if (daybit != '') { ampm=ampm.replace(daybit, along.split(daybit + ',')[1].split(',')[0]); }
} else if (('' + hoursoffgmt).indexOf('-') == -1 && eval(eval('' + hoursoffgmt.replace('+','')) + hris) >= 12) {
ampm=ampm.replace('am', 'pm');
}
hris+=eval(eval(24 + eval('' + hoursoffgmt.replace('+','').split('.')[0])) % 24);
if (('' + hoursoffgmt.replace('+','')).indexOf('.5') != -1) {
if (('' + hoursoffgmt.replace('+','')).indexOf('-') != -1 && minis >= 30) {
minis-=30;
} else if (('' + hoursoffgmt.replace('+','')).indexOf('-') != -1) {
hris--;
if (hris < 24) { hris=23; ampm=ampm.replace('am', 'pm'); if (daybit != '') { ampm=ampm.replace(daybit, along.split(',' + daybit)[0].split(',')[eval(-1 + along.split(',' + daybit)[0].split(',').length)]); } }
minis+=30;
} else if (('' + hoursoffgmt.replace('+','')).indexOf('-') == -1 && minis < 30) {
minis+=30;
} else if (('' + hoursoffgmt.replace('+','')).indexOf('-') != -1) {
hris++;
if (hris > 24) { hris=24; ampm=ampm.replace('pm', 'am'); if (daybit != '') { ampm=ampm.replace(daybit, along.split(daybit + ',')[1].split(',')[0]); } }
minis-=30;
}
} else if (('' + hoursoffgmt.replace('+','')).indexOf('.25') != -1) {
if (('' + hoursoffgmt.replace('+','')).indexOf('-') != -1 && minis >= 15) {
minis-=15;
} else if (('' + hoursoffgmt.replace('+','')).indexOf('-') != -1) {
hris--;
if (hris < 24) { hris=23; ampm=ampm.replace('am', 'pm'); if (daybit != '') { ampm=ampm.replace(daybit, along.split(',' + daybit)[0].split(',')[eval(-1 + along.split(',' + daybit)[0].split(',').length)]); } }
minis+=15;
} else if (('' + hoursoffgmt.replace('+','')).indexOf('-') == -1 && minis < 45) {
minis+=15;
} else if (('' + hoursoffgmt.replace('+','')).indexOf('-') != -1) {
hris++;
if (hris > 24) { hris=24; ampm=ampm.replace('pm', 'am'); if (daybit != '') { ampm=ampm.replace(daybit, along.split(daybit + ',')[1].split(',')[0]); } }
minis-=15;
}
} else if (('' + hoursoffgmt.replace('+','')).indexOf('.75') != -1) {
if (('' + hoursoffgmt.replace('+','')).indexOf('-') != -1 && minis >= 45) {
minis-=45;
} else if (('' + hoursoffgmt.replace('+','')).indexOf('-') != -1) {
hris--;
if (hris < 24) { hris=23; ampm=ampm.replace('am', 'pm'); if (daybit != '') { ampm=ampm.replace(daybit, along.split(',' + daybit)[0].split(',')[eval(-1 + along.split(',' + daybit)[0].split(',').length)]); } }
minis+=45;
} else if (('' + hoursoffgmt.replace('+','')).indexOf('-') == -1 && minis < 15) {
minis+=45;
} else if (('' + hoursoffgmt.replace('+','')).indexOf('-') != -1) {
hris++;
if (hris > 24) { hris=24; ampm=ampm.replace('pm', 'am'); if (daybit != '') { ampm=ampm.replace(daybit, along.split(daybit + ',')[1].split(',')[0]); } }
minis-=45;
}
}
//alert('' + hoursoffgmt + ' ' + hris + ' ' + minis + ' ' + gmtdatetimeis);


if (minis > 45 && eval(hris % 12) == 0) {
return ' ' + String.fromCodePoint(128336) + ampm;
} else if (eval(hris % 12) == 0 && minis <= 15) {
return ' ' + String.fromCodePoint(128347) + ampm;
} else if (eval(hris % 12) == 0) {
return ' ' + String.fromCodePoint(128359) + ampm;
} else if (minis >= 45) {
return ' ' + String.fromCodePoint(eval(eval(hris % 12) + 128336)) + ampm;
} else if (minis <= 15) {
return ' ' + String.fromCodePoint(eval(eval(hris % 12) + 128335)) + ampm;
} else {
return ' ' + String.fromCodePoint(eval(eval(hris % 12) + 128347)) + ampm;
}
return '';
}

function emfilter(inih) {
var bcxs=inih.split(' &#');
var bitis='', ib=0;
var outih=inih;
for (ib=1; ib<bcxs.length; ib++) {
bitis=' &#' + bcxs[ib].split(' ')[0];
outih=outih.replace(bitis, ' ' + eval('String.fromCodePoint(' + bitis.substring(3).replace(/\;\&\#/g,',').replace(/\;/g,'') + ')'));
}
bcxs=outih.split('(');
for (ib=1; ib<bcxs.length; ib++) {
if (bcxs[ib].split(')')[0].indexOf(',') == -1 && bcxs[ib].split(')')[0].indexOf(' ') == -1 && (bcxs[ib].substring(0,1) == '-' || bcxs[ib].substring(0,1) == '+' || (bcxs[ib].substring(0,1) >= '0' && bcxs[ib].substring(0,1) <= '9'))) {
outih=outih.replace('(' + bcxs[ib].split(')')[0] + ')', '(' + bcxs[ib].split(')')[0] + clockit(bcxs[ib].split(')')[0]) + ')');
}
}
return outih;
}

Also, in these same places we add in Time Place country ISO-2 character code based emoji flags, adding to information and colour pizazz in the informational parts to the workings of our changed countries.php web application you can also try below.


Previous relevant GeoJson World Countries SVG Overlay Safari Error Tutorial is shown below.

GeoJson World Countries SVG Overlay Safari Error Tutorial

GeoJson World Countries SVG Overlay Safari Error Tutorial

Mostly on smaller devices (such as an iPhone), but elsewhere as well, but less drastically, this morning, using our current Display GeoJson Countries web application we would get the Safari web browser error …

A problem repeatedly occurred with https://www.rjmprogramming.com.au/HTMLCSS/countries.php

… with web application work up to yesterday’s GeoJson World Countries SVG Overlay Colour Infill Tutorial.

On discovering our first solution theory of turning yesterday’s mapsvg.js external Javascript work into an async piece of work made no difference to this situation, we surmised that the huge amount of content held in the Javascript (ie. client side) global variable appendtoinnerHTML was causing memory issues. We couldn’t shift much to do with the overall amount of “data” needing to be handled, in order to implement country SVG colour infilling, but we could shift the data from being …

  • client side (external) Javascript held … to, instead, (have that data) be (determined on the) …
  • server side PHP filling in the contents of our (relevant) HTML div id=svgd ahead of the document.body onload event timing …
    <?php

    $icnt=0;

    function apptohtmstuff($coordsare, $origc) {
    global $icnt;
    $minl=-1;
    $mint=-1;
    $maxl=-1;
    $maxt=-1;
    $zysare=explode(',', $coordsare);
    $svgcis='';
    for ($ij=0; $ij<sizeof($zysare); $ij+=2) {
    if ($minl < 0) {
    $minl=$zysare[$ij];
    $maxl=$zysare[$ij];
    $mint=$zysare[1 + $ij];
    $maxt=$zysare[1 + $ij];
    } else {
    if ($zysare[$ij] < $minl) { $minl=$zysare[$ij]; }
    if ($zysare[$ij] > $maxl) { $maxl=$zysare[$ij]; }
    if ($zysare[1 + $ij] < $mint) { $mint=$zysare[1 + $ij]; }
    if ($zysare[1 + $ij] > $maxt) { $maxt=$zysare[1 + $ij]; }
    }
    }

    for ($ij=0; $ij<sizeof($zysare); $ij+=2) {
    if ($svgcis == '') {
    $svgcis='' . ($zysare[$ij] - $minl) . ',' . ($zysare[1 + $ij] - $mint);
    } else {
    $svgcis.=' ' . ($zysare[$ij] - $minl) . ',' . ($zysare[1 + $ij] - $mint);
    }
    }

    $icnt++;
    return '<div title="' . $coordsare . '" id="dsa' . (-1 + $icnt) . '" style="position:absolute;left:' . $minl . 'px;top:' . $mint . 'px;width:' . ($maxl - $minl) . 'px;height:' . ($maxt - $mint) . ';display:BLOCK;z-index:24;"><svg height="100%" width="100%"><polygon points="' . $svgcis . '" style="fill:lime;stroke:purple;stroke-width:1"></polygon></svg></div>';
    }

    ?>
    … meaning the web application’s underlying HTML size increased at the expense of no need for external Javascript involvement any more

… in our changed countries.php web application you can also try below.

We’re not exactly sure why, but …

  • this improved web application stability …

    …everywhere … and an idea we’d ditched yesterday of …
  • idea to pre-colour “land” parts of the world GeoJson map green (ahead of the document.body onload event) also came good (after causing problems yesterday)

… meaning now, “overlay” wise, we could say

  • document.body lowest level …
  • overlayed by HTML canvas element plotted with world country linework …
  • overlayed by HTML img (transparent image) element and its associated image map area elements … and today we add into the mix …
  • HTML div hosting SVG elements overlaying initialized with “land” parts green infilled SVG at a mid range z-index (only as well as when called upon) individual GeoJson entities overlay

… and we (reckon we’ve) improved the colour coding user experience at the same time.

We noticed that tweaks in the changed …


var lastflagged='', appendtoinnerHTML='', waitplease=false; // used to make sure "area" element onclick code precedes any document.body onmousedown or ontouchdown code

function checkdsa(ath) {
waitplease=true;
var wasih='';
var athcoords=('' + ath.coords); //.substring(0, Math.floor(eval(0.1 * ('' + ath.coords).length)));
if (document.getElementById('svgd').innerHTML.indexOf(('' + athcoords)) != -1) {
wasih='<div title=' + String.fromCharCode(34) + '' + ath.coords + document.getElementById('svgd').innerHTML.split(ath.coords)[1].split('<div ')[0];
if (lastflagged == '') {
if (wasih.indexOf(' id=' + String.fromCharCode(34)) != -1) { lastflagged=wasih.split(' id=' + String.fromCharCode(34))[1].split(String.fromCharCode(34))[0]; } else { lastflagged=''; }
} else {
document.getElementById(lastflagged).innerHTML=document.getElementById(lastflagged).innerHTML.replace(/rgba\(255\,87\,51\,0.5\)/g, 'rgba(200,200,200,0.3)');
if (wasih.indexOf(' id=' + String.fromCharCode(34)) != -1) { lastflagged=wasih.split(' id=' + String.fromCharCode(34))[1].split(String.fromCharCode(34))[0]; } else { lastflagged=''; }
}
if (lastflagged != '') {
document.getElementById(lastflagged).innerHTML=document.getElementById(lastflagged).innerHTML.replace('z-index:24;', 'z-index:123;').replace('lime;', 'rgba(255,87,51,0.5);');
document.getElementById(lastflagged).title=ath.title;
} else {
document.getElementById('svgd').innerHTML=document.getElementById('svgd').innerHTML.replace(wasih, '<div title=' + String.fromCharCode(34) + '' + ath.title + wasih.split(ath.coords)[1].split('<div ')[0].replace('none;', 'block;z-index:123;').replace('lime;', 'rgba(255,87,51,0.5);'));
}
} else if (('' + appendtoinnerHTML).indexOf(('' + athcoords)) != -1) {
if (document.getElementById('svgd').innerHTML.indexOf(' title=' + String.fromCharCode(34) + '' + ath.title + '' + String.fromCharCode(34) + '') != -1) {
document.getElementById('svgd').innerHTML=document.getElementById('svgd').innerHTML.replace(/rgba\(255\,87\,51\,0.5\)/g, 'rgba(200,200,200,0.3)');
document.getElementById('svgd').innerHTML+='<div title=' + String.fromCharCode(34) + '' + ath.title + appendtoinnerHTML.split(ath.coords)[1].split('<div ')[0].replace('none;', 'block;z-index:123;').replace(/\ id\=/g, ' data-id=').replace('lime;', 'rgba(255,87,51,0.5);');
} else {
document.getElementById('svgd').innerHTML=document.getElementById('svgd').innerHTML.replace(/rgba\(255\,87\,51\,0.5\)/g, 'rgba(200,200,200,0.3)');
document.getElementById('svgd').innerHTML+='<div title=' + String.fromCharCode(34) + '' + ath.title + appendtoinnerHTML.split(ath.coords)[1].split('<div ')[0].replace('none;', 'block;z-index:123;').replace('lime;', 'rgba(255,87,51,0.5);');
}
}
waitplease=false;
return '';
}

… also lessened the burden on the client side by only asking any Javascript DOM command operations act on single HTML element at a time, not a whole swathe of hosted ones, in any operation.


Previous relevant GeoJson World Countries Geo Chart Tutorial is shown below.

GeoJson World Countries Geo Chart Tutorial

GeoJson World Countries Geo Chart Tutorial

There are many advantages regarding today’s task to …

Integrate Google Chart Geo Chart

… as an additional “drill down” map option, functionality adding onto the work of yesterday’s GeoJson World Countries Tutorial.

What deducible data item needs to be determined for these Geo Charts to work? We need a way to deduce ISO-2 character country codes from the ISO-3 character codes existing in the GeoJson “countries.geojson” data from yesterday’s work. We happened upon the extremely generous mapping data webpage to help with these ISO-2 character deductions

<?php

$geojsonis=file_get_contents('countries.geojson');
$parts=explode("]]", $geojsonis);
$globalattr="";
$mappings=file_get_contents('http://gist.github.com/tadast/8827699'); // thanks
if (strpos($mappings, '>IN</td>') !== false) {
$mappings.='<td>IN</td><td>KAS</td><td>EH</td><td>SAH</td><td>SO</td><td>SOL</td><td>SS</td><td>SDS</td><td>XK</td><td>KOS</td><td>CY</td><td>CYN</td></body>';
}


for ($i=0; $i<(-1 + sizeof($parts)); $i++) {
if (strpos($parts[$i], '"sr_sov_a3":"') !== false) {
$globalattr=' data-iso3="' . explode('"', explode('"sr_sov_a3":"', $parts[$i])[1])[0] . '"';
if (strpos($mappings, '>' . explode('"', explode('"sr_sov_a3":"', $parts[$i])[1])[0] . '</td>') !== false) {
$iparts=explode('>' . explode('"', explode('"sr_sov_a3":"', $parts[$i])[1])[0] . '</td>', $mappings);
$globalattr.=' data-iso2="' . explode('>', explode('</td>', $iparts[0])[-2 + sizeof(explode('</td>', $iparts[0]))])[-1 + sizeof(explode('>', explode('</td>', $iparts[0])[-2 + sizeof(explode('</td>', $iparts[0]))]))] . '"';
} else if (substr(explode('"', explode('"sr_sov_a3":"', $parts[$i])[1])[0],-1,1) >= '0' && substr(explode('"', explode('"sr_sov_a3":"', $parts[$i])[1])[0],-1,1) <= '9') {
$globalattr.=' data-iso2="' . substr(explode('"', explode('"sr_sov_a3":"', $parts[$i])[1])[0],0,2) . '"';
}
}
if (strpos($parts[$i], '"sr_subunit":"') !== false) {
$globalattr.=' data-cname="' . explode('"', explode('"sr_subunit":"', $parts[$i])[1])[0] . '"';
}
$coords=str_replace('[','',str_replace(']','',explode('[[' , $parts[$i])[-1 + sizeof(explode('[[' , $parts[$i]))]));
$newcoords=$coords;
if (!$dolatlong || 1 == 1) {
$lls=explode(",", $coords);
$newcoords="";
for ($j=0; $j<sizeof($lls); $j+=2) {
$lls[$j]=($lls[$j] + $longoff) * $factor;
$lls[$j + 1]=($lls[$j + 1] + $latoff) * $factor;
if ($newcoords != "") { $newcoords.=","; $htmlis=str_replace("}", " context.lineTo(" . $lls[$j] . ',' . ((180.0 * $factor) - $lls[$j + 1]) . "); \n}", $htmlis); } else { $htmlis=str_replace("}", " context.stroke(); \n context.beginPath(); \n context.moveTo(" . $lls[$j] . ',' . ((180.0 * $factor) - $lls[$j + 1]) . "); \n}", $htmlis); }
$newcoords.='' . $lls[$j] . ',' . ((180.0 * $factor) - $lls[$j + 1]);
}
}
$abit.="<area" . $globalattr . " onclick=\"ouralert(this.getAttribute('data-cname'),this.getAttribute('data-iso3'),this.getAttribute('data-iso2'),'Longitude,Latitude coordinates are " . $coords . "');\" shape='poly' coords='" . $newcoords . "'></area>\n";
//echo "<area type='poly' coords='" . $newcoords . "'></area>\n";
}

?>

… in our image map area elements PHP creation code above. As you can see, extra “intelligence”, moving forward, is contained in area element global data attributes.

Which leaves us with why any of this helps functionality within our changed countries.php web application you can also try below?

  • Geo Chart can zoom into a country view …
  • Geo Chart can involve emoji (🏠 &127968;) or image (SVG) circle based symbology for the “User Clicked Place” and nearby TimeZone places respectively …
  • all these symbols can be clicked to open popup windows containing TimeZone Place Wikipedia webpages of relevance …
  • an emoji national flag (eg. Zambia “ZA” could be used to derive &#127487;&#127462; 🇿🇦 flag emoji) derived from those ISO-2 character codes can supplement the GeoJson (more ISO-3 character based) names presented in the underlying data, in the Geo Chart title …
  • contextualizing the accompanying Map Chart … and …
  • vice versa regarding hovering over symbology (which works on Map Chart, but not Geo Chart) …
  • within the Map Chart iframe a “Geo” link can glean a “zoomed out” world Geo Chart view of your TimeZone places

And feel free to (re-)try our tweaked “to make thinner the coastline linework” regions.php GeoJson PHP web application in a new window, or you can also try below.


Previous relevant GeoJson World Countries Tutorial is shown below.

GeoJson World Countries Tutorial

GeoJson World Countries Tutorial

Know your GeoJson! Yes, pretty obviously, any two GeoJson datasets might display the same in that “map plotting” sense, but one might have different and/or more “intelligence” than the other. Often, an XML has more “intelligence” than equivalent HTML (barring the use of global data attributes, that is), as today’s Corollacorollary.

And so, moving on from yesterday’s GeoJson World Coastline TimeZone Tutorial, today, we present a new GeoJson admin 0 countries we download, and upload as “countries.geojson” data set, again via the excellent HTTP://geojson.xyz/ repository, thanks.

From it, we do get a different JSON additional “intelligence”


{"type":"FeatureCollection","features":[{"type":"Feature","properties":{"scalerank":1,"labelrank":1,"sr_sov_a3":"ZWE","sr_adm0_a3":"ZWE","sr_gu_a3":"ZWE","sr_su_a3":"ZWE","sr_subunit":"Zimbabwe","featureclass":"Admin-0 scale ranks"},"geometry":{"type":"Polygon","coordinates":[[[31.287890625000017,-22.40205078125001],[31.197265625,-22.34492187500001],[31.07343750000001,-22.30781250000001],[30.916113281250006,-22.29072265625001],[30.71162109375001,-22.2978515625],[30.46015625000001,-22.32900390625001],[30.1904296875,-22.291113281250006],[29.90234375,-22.184179687500006],[29.6630859375,-22.146289062500003],[29.37744140625,-22.19277343750001],[29.36484375,-22.193945312500006],[29.315234375000017,-22.15771484375],[29.237207031250023,-22.07949218750001],[29.106835937500023,-22.065722656250003],[29.07148437500001,-22.047460937500006],[29.042382812500023,-22.018359375],[29.023339843750023,-21.98125],[29.01582031250001,-21.93994140625],[29.03730468750001,-21.811328125],[29.02558593750001,-21.796875],[28.99072265625,-21.78144531250001],[28.919335937500023,-21.766015625],[28.74775390625001,-21.707617187500006],[28.532031250000017,-21.65126953125001],[28.181640625,-21.58935546875],[28.04560546875001,-21.573046875],[28.014062500000023,-21.55419921875],[27.974609375,-21.50673828125001],[27.90742187500001,-21.35908203125001],[27.844140625000023,-21.261523437500003],[27.693457031250006,-21.11103515625001],[27.66943359375,-21.064257812500003],[27.67695312500001,-20.94482421875],[27.688085937500006,-20.84833984375001],[27.70429687500001,-20.76640625],[27.69697265625001,-20.689746093750003],[27.69482421875,-20.59453125],[27.699609375000023,-20.53066406250001],[27.679296875,-20.503027343750006],[27.624609375,-20.48359375000001],[27.46894531250001,-20.47480468750001],[27.28076171875,-20.47871093750001],[27.27460937500001,-20.3818359375],[27.256738281250023,-20.23203125],[27.221484375000017,-20.145800781250003],[27.17822265625,-20.10097656250001],[27.091796875,-20.05419921875],[26.91669921875001,-19.99013671875001],[26.67822265625,-19.89277343750001],[26.474609375,-19.748632812500006],[26.241015625000017,-19.5693359375],[26.168066406250006,-19.53828125000001],[26.081933593750023,-19.369921875],[25.95068359375,-19.08173828125001],[25.95917968750001,-18.985644531250003],[25.939355468750023,-18.93867187500001],[25.811914062500023,-18.79707031250001],[25.78369140625,-18.72353515625001],[25.76123046875,-18.64921875],[25.55830078125001,-18.441796875],[25.4892578125,-18.35126953125001],[25.43671875000001,-18.234960937500006],[25.384375,-18.14199218750001],[25.340234375000023,-18.1044921875],[25.28242187500001,-18.04121093750001],[25.242285156250006,-17.969042968750003],[25.224023437500023,-17.91523437500001],[25.239062500000017,-17.843066406250003],[25.2587890625,-17.793554687500006],[25.451757812500006,-17.84511718750001],[25.55712890625,-17.84951171875001],[25.6396484375,-17.82412109375001],[25.741601562500023,-17.858203125],[25.86328125,-17.951953125],[25.995898437500017,-17.969824218750006],[26.139550781250023,-17.91171875],[26.333398437500023,-17.929296875],[26.577539062500023,-18.022558593750006],[26.779882812500006,-18.04150390625],[27.020800781250017,-17.95839843750001],[27.235742187500023,-17.728320312500003],[27.437890625000023,-17.51191406250001],[27.63671875,-17.262109375],[27.75654296875001,-17.060351562500003],[27.932226562500006,-16.89619140625001],[28.16376953125001,-16.76972656250001],[28.399804687500023,-16.66279296875001],[28.760644531250023,-16.53193359375001],[28.760546875000017,-16.53212890625001],[28.83271484375001,-16.424121093750003],[28.856738281250017,-16.30615234375],[28.856738281250017,-16.14228515625001],[28.875585937500006,-16.0361328125],[28.9130859375,-15.98779296875],[28.973046875000023,-15.950097656250009],[29.050585937500017,-15.901171875],[29.287890625000017,-15.776464843750006],[29.4873046875,-15.69677734375],[29.729589843750006,-15.644628906250006],[29.994921875000017,-15.64404296875],[30.25068359375001,-15.643457031250009],[30.39609375,-15.64306640625],[30.39814453125001,-15.80078125],[30.409375,-15.978222656250011],[30.437792968750017,-15.995312500000011],[30.630175781250017,-15.999218750000011],[30.938769531250017,-16.01171875],[31.236230468750023,-16.02363281250001],[31.426171875000023,-16.15234375],[31.48984375,-16.1796875],[31.687597656250006,-16.214160156250003],[31.939843750000023,-16.428808593750006],[32.243261718750006,-16.44873046875],[32.45195312500002,-16.515722656250006],[32.635839843750006,-16.589453125],[32.741796875,-16.67763671875001],[32.81025390625001,-16.69765625],[32.902929687500006,-16.704199218750006],[32.94804687500002,-16.71230468750001],[32.93789062500002,-16.775976562500006],[32.87626953125002,-16.88359375],[32.884375,-17.03779296875001],[32.969335937500006,-17.2515625],[32.98076171875002,-17.4375],[32.9546875,-17.765429687500003],[32.95556640625,-18.08291015625001],[32.96464843750002,-18.1962890625],[32.978515625,-18.271484375],[32.99638671875002,-18.312597656250006],[32.99306640625002,-18.35957031250001],[32.942480468750006,-18.49267578125],[32.90166015625002,-18.632910156250006],[32.90029296875002,-18.6890625],[32.88457031250002,-18.728515625],[32.8544921875,-18.763671875],[32.72197265625002,-18.828417968750003],[32.69921875,-18.868457031250003],[32.69970703125,-18.94091796875],[32.71650390625001,-19.00185546875001],[32.766210937500006,-19.02431640625001],[32.826171875,-19.05878906250001],[32.84980468750001,-19.10439453125001],[32.85,-19.152441406250006],[32.83095703125002,-19.24140625000001],[32.77763671875002,-19.388769531250006],[32.83076171875001,-19.558203125],[32.89042968750002,-19.668066406250006],[32.97265625,-19.79541015625],[33.00673828125002,-19.873828125],[33.0048828125,-19.93017578125],[32.992773437500006,-19.98486328125],[32.86962890625,-20.2171875],[32.780859375,-20.36152343750001],[32.67255859375001,-20.51611328125],[32.529296875,-20.613085937500003],[32.49238281250001,-20.659765625],[32.477636718750006,-20.712988281250006],[32.48281250000002,-20.82890625],[32.476171875,-20.95009765625001],[32.353613281250006,-21.136523437500003],[32.429785156250006,-21.29707031250001],[32.41240234375002,-21.311816406250003],[32.37109375,-21.33486328125001],[32.19472656250002,-21.515429687500003],[32.01630859375001,-21.698046875],[31.88593750000001,-21.83154296875],[31.737695312500023,-21.9833984375],[31.57148437500001,-22.15351562500001],[31.429492187500017,-22.298828125],[31.287890625000017,-22.40205078125001]]]}}

… and “mapping look” because country borders are added in, and some JSON attributes we can call on to allow for …

  • the similar Google Chart Map Chart maps introduced yesterday into the user interaction mix … as well as …
  • Wikipedia, thanks, webpage lookup possibilities calling on those new GeoJson property attributes presented within the dataset above

We enable this, as we just add in some Javascript popup window type equals “prompt” to the existant “confirm” and “alert” logic of yesterday.

Feel free to try the how we got there regions.php GeoJson PHP World Countries web application in a new window, or below …


Previous relevant GeoJson World Coastline TimeZone Tutorial is shown below.

GeoJson World Coastline TimeZone Tutorial

GeoJson World Coastline TimeZone Tutorial

Luckily for programmers all over, the organization of TimeZones has had an International flavour in its development and maintenance. As such, given the “purely coastline” GeoJson data involved in our fledgling PHP web application of yesterday’s GeoJson World Coastline Primer Tutorial a useful arrangement for improvement involves …

  • document.body onclick event co-ordinates … able to be converted to …
  • longitude, latitude (easily, only because of our simplistic map projection, of course) … onfed to …
  • our inhouse “TimeZone Places” web application PHP helper

… can have us helping out your curious web “clicking” user with the 3 nearest TimeZone places, as a reference as to where they are “clicking” in the world.

Feel free to try our improved regions.php GeoJson PHP web application in a new window, or below …

Stop Press

Our efforts in making our new tweaked regions.php GeoJson PHP web application more mobile platform user friendly reminds us about a salutary issue regarding touch gestures …

  • in a discrete click methodology of interest, you could adopt a non-mobile “onmousedown” logic set that does not get interfered with by a mobile “ontouchdown” logic set (perhaps leaving “onclick” event, which both non-mobile and mobile both recognise, for another event logic role) … and …
  • neither will interrupt the mobile gestures associated with swiping and pinching, which refer to the events “ontouchstart” and “ontouchend” at either end of their lifespan


Previous relevant GeoJson World Coastline Primer Tutorial is shown below.

GeoJson World Coastline Primer Tutorial

GeoJson World Coastline Primer Tutorial

We’re keen to further explore the possibilities of GeoJson public data sets, further to yesterday’s Swift Playgrounds on macOS Map Emoji Tutorial.

And then we remembered some of the methodologies we used with Responsive Web Design Landing Page Image Map Tutorial, talking about image maps

And so, we arrive at a long planned for tilt at Image Map functionality that we often turn to Mobilefish.Com and its excellent Image Map Creation to help us out … but not today?! Why not? We have a funny set of needs, they being …

  • our Image Map’s image will have a variable set of width x height dimensions …
  • our Image Map’s image will be transparent
  • our Image Map needs to have a hole left aside inside it where the functionality that originally existed (and pointed to WordPress Blog content like you are reading), is still working

… the first two ideas of which, along with …

… in our “early days” “proof of concept” regions.php GeoJson PHP web application.

If this was interesting you may be interested in this too.


If this was interesting you may be interested in this too.


If this was interesting you may be interested in this too.


If this was interesting you may be interested in this too.


If this was interesting you may be interested in this too.


If this was interesting you may be interested in this too.


If this was interesting you may be interested in this too.


If this was interesting you may be interested in this too.


If this was interesting you may be interested in this too.


If this was interesting you may be interested in this too.


If this was interesting you may be interested in this too.


If this was interesting you may be interested in this too.


If this was interesting you may be interested in this too.

Posted in eLearning, Event-Driven Programming, Games, Tutorials | Tagged , , , , , , , , , , , , , , , , , , , , , , , | Leave a comment

PHP Image GraphViz via Pear on AlmaLinux Focus Tutorial

PHP Image GraphViz via Pear on AlmaLinux Focus Tutorial

PHP Image GraphViz via Pear on AlmaLinux Focus Tutorial

It reared it’s ugly head with the Animated GIF Creator here at RJM Programming (helped out by the great Jeroen van Wissen open source work, thanks). And with yesterday’s PHP Image GraphViz via Pear on AlmaLinux Recallable Tutorial it reared up again.

On non-mobile focus goes to the address bar on many web browsers unless there is a (nominally) visible input type=text or textarea next in line.

It’s hard to keep in mind except as it “rears up” in an annoying way, but if we’d thought back, yes, we allow in the linked list feel of revealing textboxes (or textareas) only as they are needed scenarios we allow for two blank ones to be (nominally) visible at any given time … not one … but two, presumably because there is a tiny Javascript DOM “refresh period” not short enough to stop the web browser “desperation measure” (of placing focus in the address bar) happening?!

Why the non-mobile mention? Well, on mobile, a user programming [HTMLelement].focus(); call has no affect, as the touch operating systems need control of focus arrangements, presumably?!

How can we forget? My liege, please accept my humble apologies?!

Why the (nominally) mentions? Well, we have, successfully, in the past, just arranged a (statically HTML placed) textbox (ie. input type=text) that sits outside the viewing screen but not (nominally) invisible (eg. style=’position:absolute;top:-200px;left:-200px;’) can help you avoid the focus going up to the web browser address bar.

So that’s that, and other progress today is to allow the emailing or SMS of a recalled URL Step arrangement via more options on that “Recall Dropdown” we started allowing for yesterday.

Please see this happening in our changed PHP coded My Recipe Steps web application you can also try below.


Previous relevant PHP Image GraphViz via Pear on AlmaLinux Recallable Tutorial is shown below.

PHP Image GraphViz via Pear on AlmaLinux Recallable Tutorial

PHP Image GraphViz via Pear on AlmaLinux Recallable Tutorial

After yesterday’s PHP Image GraphViz via Pear on AlmaLinux Sharing Tutorial some readers may be curious to understand the distinction between …

  • email and SMS sharing … and …
  • inhouse intersessional sharing via window.localStorage (ie. like HTTP Cookies)

… over yesterday’s and today’s blog posting timings. Simply put, for us, we …

  • take a deep breath before starting intersessional window.localStorage work, as it is not to be sneezed at, as any sort of doddle (at least for us) … as well as …
  • since last intersessional window.localStorage work we’ve started using email and SMS sharing hashtagging arrangements that fit in, like a glove, with this intersessional window.localStorage work … so that …
  • even though, we write the code here in PHP, all this functionality is client based … which we like because …
  • get the idea correct, with careful forward planning and implementation, we’ll be able to apply similar such thinking into the future, whether that be for clientside only web applications and/or ones that call on serverside code (like PHP) … and …
  • if we can keep things just clientside more readers can be involved, we figure

If you’re wondering about the worry of any of this, it is to do with large title and/or URL link and/or ingredient type data whose data length could be huge, where most of our concern lies, and …

  • hashtagging (where data limits are so much longer) can help it remain as a clientside only solution environment (rather than relying on some form method=POST to a serverside (eg. PHP) receiver solution) …
  • window.localStorage is a step up from the HTTP Cookie style of intersessional (personal) storage as far as amounts that can be stored is concerned

What are we aiming for here, then, with our improvements?

  • extend the existant email and SMS functionality …
    <?php echo ”

    function emailit(insg) {
    var em='', ccok='';
    if (estitle == '') {
    if (cookb.split(' Or hash delimited appended string can ')[0] != '') {
    cookb=cookb.replace(cookb.split(' Or hash delimited appended string can ')[0], '');
    }
    }
    if (('' + insg).replace(/^null/g,'').replace(/^undefined/g,'').trim() != '') {
    em='' + insg;
    } else {

    em=prompt('Please enter Email address to share with. ' + cookb, '');
    }
    if (em != null) {
    if (em.trim() == '' && estitle != '') {
    em='#' + estitle;
    } else if (em == estitle && estitle != '') {
    em='#' + estitle;
    }
    }
    if (em.indexOf('#') != -1) {
    cook=em.substring(eval(1 + eval('' + em.indexOf('#'))));
    em=em.split('#')[0].trim();
    if (cook.trim() != '') {
    deleteAVal('steps_' + cook.replace(/\ /g,'-'),'');
    setAVal('steps_' + cook.replace(/\ /g,'-'), \"" . $hashurl . $hashurld . "\" + anyhashes);
    }
    }

    if (em == null) { em=''; }
    if (em.trim() != '') {
    if (em.trim().indexOf('@') != -1) {
    em+='?subject=Steps&body=' + encodeURIComponent(\"" . $hashurl . $hashurld . "\" + anyhashes);
    document.getElementById('dimap').innerHTML=\"<a style=display:none; id=theaemail target=_blank href='mailto:\" + em + \"'>Email</a>\";
    document.getElementById('theaemail').click();
    } else if (em.trim().replace(/0/g,'').replace(/1/g,'').replace(/2/g,'').replace(/3/g,'').replace(/4/g,'').replace(/5/g,'').replace(/6/g,'').replace(/7/g,'').replace(/8/g,'').replace(/9/g,'') == '') {
    em+='&body=' + encodeURIComponent(\"" . $hashurl . $hashurld . "\" + anyhashes);
    document.getElementById('dimap').innerHTML=\"<a style=display:none; id=theasms target=_blank href='sms:\" + em + \"'>SMS</a>\";
    document.getElementById('theasms').click();
    }
    }
    return false;

    }

    function smsit(insg) {
    var em='', cook='';
    if (estitle == '') {
    if (cookb.split(' Or hash delimited appended string can ')[0] != '') {
    cookb=cookb.replace(cookb.split(' Or hash delimited appended string can ')[0], '');
    }
    }
    if (('' + insg).replace(/^null/g,'').replace(/^undefined/g,'').trim() != '') {
    em='' + insg;
    } else {

    em=prompt('Please enter SMS number to share with. ' + cookb, '');
    }
    if (em != null) {
    if (em.trim() == '' && estitle != '') {
    em='#' + estitle;
    } else if (em == estitle && estitle != '') {
    em='#' + estitle;
    }
    }
    if (em.indexOf('#') != -1) {
    cook=em.substring(eval(1 + eval('' + em.indexOf('#'))));
    em=em.split('#')[0].trim();
    if (cook.trim() != '') {
    deleteAVal('steps_' + cook.replace(/\ /g,'-'),'');
    setAVal('steps_' + cook.replace(/\ /g,'-'), \"" . $hashurl . $hashurld . "\" + anyhashes);
    }
    }

    if (em == null) { em=''; }
    if (em.trim() != '') {
    if (em.trim().replace(/0/g,'').replace(/1/g,'').replace(/2/g,'').replace(/3/g,'').replace(/4/g,'').replace(/5/g,'').replace(/6/g,'').replace(/7/g,'').replace(/8/g,'').replace(/9/g,'') == '') {
    em+='&body=' + encodeURIComponent(\"" . $hashurl . $hashurld . "\" + anyhashes);
    document.getElementById('dimap').innerHTML=\"<a style=display:none; id=theasms target=_blank href='sms:\" + em + \"'>SMS</a>\";
    document.getElementById('theasms').click();
    } else if (em.trim().indexOf('@') != -1) {
    em+='?subject=Steps&body=' + encodeURIComponent(\"" . $hashurl . $hashurld . "\" + anyhashes);
    document.getElementById('dimap').innerHTML=\"<a style=display:none; id=theaemail target=_blank href='mailto:\" + em + \"'>Email</a>\";
    document.getElementById('theaemail').click();
    }
    }
    return false;
    }

    “; ?>
    … to cater for additional personalized Title (of steps) and Content of steps (using the hashtagging email and SMS URL methods set up yesterday)
    <?php echo ”

    var estitle=\"" . $estitle . "\";
    var cookb=\"" . $cookblurb . "\";
    var lssel='';
    var woo=null;

    function deleteAVal(goodname, aparticularvalue) {
    if (window.localStorage && goodname.indexOf('steps_') == 0) {
    if (('' + localStorage.getItem(goodname)).replace(/^undefined/g,'').replace(/^null/g,'') != '') {
    if (aparticularvalue == '') {
    localStorage.removeItem(goodname);
    } else {
    if (aparticularvalue.replace('HTTP','http').toLowerCase() == ('' + localStorage.getItem(goodname)).toLowerCase()) {
    localStorage.removeItem(goodname);
    }
    }
    }
    }
    }

    function setAVal(cName, cVal) {
    if (cName.indexOf('steps_') == 0) {
    if (window.localStorage) {
    localStorage.setItem(cName, encodeURIComponent(cVal));
    cookieAVal('steps_', true);
    return ' ';
    }
    return '';
    }
    return '';
    }

    function gotothis(inu) {
    if (inu.trim() != '') {
    if (inu.indexOf('HTTP') == 0) {
    //alert('2:' + inu);
    if (inu.indexOf('#steps_') != -1) {
    //alert('22:' + inu.split('#')[eval(-1 + inu.split('#').length)]);
    deleteAVal(inu.split('#')[eval(-1 + inu.split('#').length)], encodeURIComponent(inu.replace('#' + inu.split('#')[eval(-1 + inu.split('#').length)], '').replace('HTTP','http')));
    //alert('222:' + inu.split('#')[eval(-1 + inu.split('#').length)]);
    cookieAVal('steps_', true);
    //alert('2222:' + inu.split('#')[eval(-1 + inu.split('#').length)]);
    }
    } else {
    woo=window.open(inu, '_blank', 'top=50,left=50,width=800,height=800');
    }
    }
    }

    function cookieAVal(cName, selize) {
    var key=null;
    if (selize && window.localStorage) {
    lssel=' ';
    for (var i=0; i<localStorage.length; i++) { // thanks to https://stackoverflow.com/questions/41271092/how-to-loop-through-localstorage-values
    key = localStorage.key(i);
    if (('' + key).indexOf(cName) == 0) {
    if (lssel.trim() == '') {
    lssel='<select id=sells onchange=gotothis(this.value);><option value=\"\">Recallable Steps below ...</option></select>';
    }
    lssel=lssel.replace('</select>', '<option value=\"' + decodeURIComponent(localStorage.getItem('' + key)) + '\">' + ('' + key).substring(eval('' + cName.length)).replace(/\_/g,' ').replace(/\-/g,' ') + '</option>' + '<option value=\"' + decodeURIComponent(localStorage.getItem('' + key).replace('http','HTTP')) + '#steps_' + ('' + key).substring(eval('' + cName.length)) + '\">Remove ' + ('' + key).substring(eval('' + cName.length)).replace(/\_/g,' ').replace(/\-/g,' ') + '</option>' + '</select>');
    }
    }
    if (lssel != '') {
    document.getElementById('ssel').innerHTML=lssel.trim();
    }
    }
    if (cName.indexOf('steps_') == 0) {
    if (window.localStorage) {
    if (decodeURIComponent(('' + localStorage.getItem(cName)).replace(/^undefined/g,'').replace(/^null/g,'')) != '') {
    return decodeURIComponent(localStorage.getItem(cName));
    }
    if (decodeURIComponent(('' + sessionStorage.getItem(cName)).replace(/^undefined/g,'').replace(/^null/g,'')) != '') {
    return decodeURIComponent(sessionStorage.getItem(cName));
    }
    }
    return '';
    }
    return '';
    }

    “; ?>
  • add a new …

    <a id=pcookie title='Recall this' class=share onclick="return emailit(estitle);" style='display:none;text-decoration:none;cursor:pointer;'>🍪</a>

    … emoji link for intersessional window.localStorage work that calls the email functionality modified Javascript function …
  • allowing a window.localStorage.setItem([Title (of steps)], encodeURIComponent([Content of steps])) to add a personalized and recallable record be kept on the web browser of use … recallable via …
  • new dropdown populated with existant such records, as well as a dropdown option allowing the user to remove said records, too … which …
  • can navigate the user to this recallable Steps idea in a new webpage incarnation …
  • a dropdown arrangement which is intersessional as well as intrasessional by nature, and personalized to that user’s use of the web browser on that device in question

… in our changed PHP coded My Recipe Steps web application you can also try below.


Previous relevant PHP Image GraphViz via Pear on AlmaLinux Sharing Tutorial is shown below.

PHP Image GraphViz via Pear on AlmaLinux Sharing Tutorial

PHP Image GraphViz via Pear on AlmaLinux Sharing Tutorial

Adding to yesterday’s PHP Image GraphViz via Pear on AlmaLinux Primer Tutorial

  • on many mobile devices the horizontally spreading right cell arrangements has been improved by laying out these textarea elements vertically now …
  • hashtagged URL mailto: and/or sms: “a” links to email and/or SMS communication conduits, respectively …
    <?php echo ”

    var anyhashes='';
    var aone=1;
    var tdc=0;

    function checkforlh() {
    aone=1;
    if (('' + location.hash.indexOf('dtitle')) != -1) {
    if (('' + location.hash.indexOf('dtitle=')) != -1) {
    document.getElementById('therest').value=decodeURIComponent(('' + location.hash).split('dtitle=')[1].split('#')[0].split(encodeURIComponent('#'))[0]);
    document.getElementById('therest').name='dtitle';
    } else if (('' + location.hash.indexOf('dtitle' + encodeURIComponent('='))) != -1) {
    document.getElementById('therest').value=decodeURIComponent(('' + location.hash).split('dtitle' + encodeURIComponent('='))[1].split('#')[0].split(encodeURIComponent('#'))[0]);
    document.getElementById('therest').name='dtitle';
    }
    }
    var retv='';
    while (('' + location.hash.indexOf('step' + aone)) != -1) {
    if (('' + location.hash.indexOf('step' + aone + '=')) != -1) {
    if (aone <= 1) {
    document.getElementById('tdi' + aone).value=decodeURIComponent(('' + location.hash).split('step' + aone + '=')[1].split('#')[0].split(encodeURIComponent('#'))[0]);
    } else {
    document.getElementById('tdi' + aone).value=decodeURIComponent(('' + location.hash).split('step' + aone + '=')[1].split('#')[0].split(encodeURIComponent('#'))[0]);
    obl(document.getElementById('tdi' + aone), true); //document.getElementById('tdi' + aone).blur();
    if ( document.getElementById('tdi' + eval(1 + aone))) {
    document.getElementById('tdi' + eval(1 + aone)).focus();
    }
    }
    } else if (('' + location.hash.indexOf('step' + aone + encodeURIComponent('='))) != -1) {
    if (aone <= 1) {
    document.getElementById('tdi' + aone).value=decodeURIComponent(('' + location.hash).split('step' + aone + encodeURIComponent('='))[1].split('#')[0].split(encodeURIComponent('#'))[0]);
    } else {
    document.getElementById('tdi' + aone).value=decodeURIComponent(('' + location.hash).split('step' + aone + encodeURIComponent('='))[1].split('#')[0].split(encodeURIComponent('#'))[0]);
    obl(document.getElementById('tdi' + aone), true); //document.getElementById('tdi' + aone).blur();
    if ( document.getElementById('tdi' + eval(1 + aone))) {
    document.getElementById('tdi' + eval(1 + aone)).focus();
    }
    }
    }
    aone++;
    }
    if (aone > 1 || document.getElementById('therest').value != '') { anyhashes=('' + location.hash).replace(/\%23/g,'#'); setTimeout(function(){ if (confirm('Draw now (versus add more yourself)?') == true) { document.getElementById('mysub').click(); } }, 8000); }
    }

    “; ?>
    … help out with some new sharing functionalities

… so that “a procedure made up of steps” can now be shared and/or created collaboratively in our changed PHP coded My Recipe Steps web application.


Previous relevant PHP Image GraphViz via Pear on AlmaLinux Primer Tutorial is shown below.

PHP Image GraphViz via Pear on AlmaLinux Primer Tutorial

https://en.wikipedia.org/wiki/Graphviz

The term “GraphViz”

Graphviz (short for Graph Visualization Software) is a package of open-source tools initiated by AT&T Labs Research for drawing graphs (as in nodes and edges, not as in bar charts) specified in DOT language scripts having the file name extension “gv”. It also provides libraries for software applications to use the tools. Graphviz is free software licensed under the Eclipse Public License.

… we’ve learnt recently, means a lot of things, differently (nuanced) for a range of users, three that we’ve so far become aware of being …

  • the recent, alas now deprecated, Google Charts Image Charts GraphViz option means of drawing SVG graphics within an HTML image … we’ve known about before about yesterday
  • today’s interest, that being PHP Image GraphViz via Pear on AlmaLinux install, via the AlmaLinux cPanel “Module Installers” Pear installer page, means by which we can use GraphViz calls in PHP code … and, for the future …
  • GraphViz installs for Python via pip

… in amongst many others we’ve seen programmers using … totally cute, totally useful!

It seems with our PHP Image GraphViz via Pear on AlmaLinux as what looks like a very much “pared down” version of the last mode of use above, that we add constructed graph node or edge or cluster objects, and form them into SVG based HTML image elements. It’s look got me thinking “Steps”, then “Recipe Steps”, and back, quietly, to “Any Old Steps” as the day got more generic.

At first we got, as far as Recipes go (and here we thank Italian Wedding Soup for today’s inspiration), to …

  • cooking steps showing as Image GraphViz edge graphic components (having arrows connect ellipses containing text, a bit like Speech Bubbles) … and then trying to face the “real world” a user interested in recipes might want to see happen …
  • an Image GraphViz node graphic component whose wording could be a user supplied recipe Title along with a “URL” attribute link, optionally user supplied (via our HTML div SVG hosting ondblclick event allowing its contenteditable=true attribute and onblur event means by which these optional additional data items can enter the “mix”, if you’ll pardon the pun), probably pointing back to the original recipe information saucesource … and …
  • this title and/or “URL” and/or ingredient list (for example) can all be expressed as the “on hover” title attribute of the tailored user PHP webpage (yes, here we have PHP writing PHP) … and …
  • at least on Safari, given a recipe Title defined, we can arrange any browser context menu (ie. right click) over the HTML iframe hosted recipe content “Save Iframe As” option being able to download to a reasonably self explanatory download filename … and/or …
  • any web browser’s Add Bookmark functionality can be harnessed to help the user out in such a way that our PHP coded My Recipe Steps web application could end up being your one stop shop “Recipe Organizer” online?!

See what we mean below …


Previous relevant Google Chart Image Chart Angled Text Annotation Tutorial is shown below.

Google Chart Image Chart Angled Text Annotation Tutorial

Google Chart Image Chart Angled Text Annotation Tutorial

It’s Tuesday, in places around the world, looking back at yesterday’s Google Chart Image Chart Image Map Event Editing Tutorial. Can’t help but think we’ve forgotten something. Ah yes …

You talkin’ to me? You talkin’ to me? Meanwhile, back at the questions! Welcome back, Mr De Niro, sir. We hope your Tuesday is treating you well. (Rhetorical. Let it please be Rhetorical … oh dear God … it must be Rhetorical … it must be Rhetorical) We have news regarding “the dosh” (wink, wink) we were discussing the other day. You see …

Better to be king for a night than schmuck for a lifetime. Well, at least it’s not a question. … the thing is, silly us, it turns out that angled text issue was not a problem with [element].getBoundingClientRect() but how the PHP GD imagettftext text placement emanated from the bottom left of the text always, Mr De Niro sir.

Never rat on your friends and always keep your mouth shut. Really wish we could! Yes, Mr De Niro, sir, but, you see this means the rats are completely out of the picture, just leaving us with our money spinner. Right, Mr De Niro … sir.

There are three ways of doing things around here: the right way, the wrong way and the way that I do it. [Exeunt: Stage right] Well, that’s odd? Mr De Niro wasn’t interested in the quadrant nature to our problem solution …


var rectex=extents[eval(-1 + extents.length)].getBoundingClientRect();
if (document.URL.indexOf('debug=') != -1) {
document.body.innerHTML+='<div style="position:absolute;border:1px solid rgba(255,0,0,0.5);top:' + rectex.top + 'px;left:' + rectex.left + 'px;width:' + rectex.width + 'px;height:' + rectex.height + 'px;z-index:200;" title="position:absolute;border:1px solid rgba(255,0,0,0.5);top:' + rectex.top + 'px;left:' + rectex.left + 'px;width:' + rectex.width + 'px;height:' + rectex.height + 'px;z-index:200;"></div>';
}

var invs=inv.split('.'); // angled text origin depends on angle quadrant
var wasi=inv;
var theang=eval('' + fsx);
//alert('' + inv + ' ' + theang);

if (eval('' + invs.length) > 2 && inv.indexOf(',') != -1) {
//alert('' + rectex.width + 'x' + rectex.height + ' ' + ';' + rectex.top + 'vs' + rectex.bottom + ' ' + ';' + rectex.left + 'vs' + rectex.right + ' ' + inv + ' ' + extents[-1 + extents.length].outerHTML + ' ' + rectex.x + '+' + rectex.y);
if (7 == 8) {
inv=inv.replace(invs[0], '' + Math.floor(eval(rectex.left + rectex.width / 2)));
} else {
if (theang > (315 + 45) || theang < (45 + 45)) {
inv=inv.replace(invs[0], '' + Math.floor(eval(rectex.left * 1 + rectex.right * 0 + 0 * rectex.width / 2)));
} else if (theang >= (45 + 45) && theang <= (135 + 45)) {
inv=inv.replace(invs[0], '' + Math.floor(eval(rectex.left * 0 + rectex.right * 1 + 0 * rectex.width / 2)));
} else if (theang >= (225 + 45) && theang <= (315 + 45)) {
inv=inv.replace(invs[0], '' + Math.floor(eval(rectex.left * 1 + rectex.right * 0 + 0 * rectex.width / 2)));
} else {
inv=inv.replace(invs[0], '' + Math.floor(eval(rectex.left * 0 + rectex.right * 1 + 0 * rectex.width / 2)));
}
}


if (7 == 8) {
inv=inv.replace(',' + invs[1].split(',')[1], ',' + Math.floor(eval(rectex.top + rectex.height / 2)));
} else {
if (theang > (315 + 45) || theang < (45 + 45)) {
inv=inv.replace(',' + invs[1].split(',')[1], ',' + Math.floor(eval(rectex.top * 0 + rectex.bottom * 1 + 0 * rectex.height / 2)));
//alert('' + wasi + ' vs ' + inv + ' ' + invs.length);
} else if (theang >= (225 + 45) && theang <= (315 + 45)) {
inv=inv.replace(',' + invs[1].split(',')[1], ',' + Math.floor(eval(rectex.top * 1 + rectex.bottom * 0 + 0 * rectex.height / 2)));
} else if (theang >= (45 + 45) && theang < (135 + 45)) {
inv=inv.replace(',' + invs[1].split(',')[1], ',' + Math.floor(eval(rectex.top * 0 + rectex.bottom * 1 + 0 * rectex.height / 2)));
} else {
inv=inv.replace(',' + invs[1].split(',')[1], ',' + Math.floor(eval(rectex.top * 1 + rectex.bottom * 0 + 0 * rectex.height / 2)));
}
}


//alert('was=' + wasi + ' and now=' + inv);
} else if (eval('' + invs.length) == 2 && inv.indexOf(',') != -1) {
//alert('' + rectex.width + 'x' + rectex.height + ' ' + ';' + rectex.top + 'vs' + rectex.bottom + ' ' + ';' + rectex.left + 'vs' + rectex.right + ' ' + inv + ' ' + extents[-1 + extents.length].outerHTML + ' ' + rectex.x + '+' + rectex.y);
if (theang > (315 + 45) || theang < (45 + 45)) {
inv=inv.replace(invs[0], '' + Math.floor(eval(rectex.left * 1 + rectex.right * 0 + 0 * rectex.width / 2)));
} else if (theang >= (45 + 45) && theang <= (135 + 45)) {
inv=inv.replace(invs[0], '' + Math.floor(eval(rectex.left * 0 + rectex.right * 1 + 0 * rectex.width / 2)));
} else if (theang >= (225 + 45) && theang <= (315 + 45)) {
inv=inv.replace(invs[0], '' + Math.floor(eval(rectex.left * 1 + rectex.right * 0 + 0 * rectex.width / 2)));
} else {
inv=inv.replace(invs[0], '' + Math.floor(eval(rectex.left * 0 + rectex.right * 1 + 0 * rectex.width / 2)));
}
invs=inv.split(',');
if (theang > (315 + 45) || theang <= (45 + 45)) {
inv=inv.replace(',' + invs[1].split(',')[0].split('.')[0], ',' + Math.floor(eval(rectex.top * 0 + rectex.bottom * 1 + 0 * rectex.height / 2)));
//alert('' + wasi + ' vs ' + inv + ' ' + invs.length);
} else if (theang >= (225 + 45) && theang <= (315 + 45)) {
inv=inv.replace(',' + invs[1].split(',')[0].split('.')[0], ',' + Math.floor(eval(rectex.top * 1 + rectex.bottom * 0 + 0 * rectex.height / 2)));
} else if (theang >= (45 + 45) && theang < (135 + 45)) {
inv=inv.replace(',' + invs[1].split(',')[0].split('.')[0], ',' + Math.floor(eval(rectex.top * 0 + rectex.bottom * 1 + 0 * rectex.height / 2)));
} else {
inv=inv.replace(',' + invs[1].split(',')[0].split('.')[0], ',' + Math.floor(eval(rectex.top * 1 + rectex.bottom * 0 + 0 * rectex.height / 2)));
}
//alert('was=' + wasi + ' and now=' + inv);
}

… that temporary div element text border drawing, being the crucial way to find out what was happening, and showing us, at least on Google Chrome web browser, not to worry so much about [element].getBoundingClientRect() results for transformed HTML elements. And that is a huge relief in itself.

Also taking up a lot of today, we shored up Image Map Event Editing results bubbling through to an email or SMS recipient. The size of this data, and an analysis of …

  • client pre-emptive iframe … versus …
  • Ajax methodologies

… when it comes to complex and sizeable data such as “Javascript scripting” is, we should start swinging towards Ajax thinking, even pinching it off a client pre-emptive iframe onload event logic thought/start sometimes …


var myxhr=null, rawhtml='';
var zhr=null, zform=null;

function stateChanged() {
if (myxhr.readyState == 4) {
if (myxhr.status == 200) {
console.log('myxhr=' + myxhr);
rawhtml = myxhr.responseText.replace(/\\"/g, '"').replace(/\\'/g, "'");
if (document.getElementById('jdiv')) {
//alert('1:' + rawhtml);
//alert('21111 ' + rawhtml.split('<scr')[1]);
document.getElementById('jdiv').innerHTML=rawhtml.split('<scr')[0]; //xaconto.body.innerHTML;
//alert(31111);
if (document.getElementById('talkimg')) {
document.getElementById('talkimg').useMap='#mymap';
} else {
document.getElementById('myvenn').useMap='#mymap';
}
//alert(41111);
} else {
document.body.innerHTML+=rawhtml.split('<scr')[0]; //xaconto.body.innerHTML;
if (document.getElementById('talkimg')) {
document.getElementById('talkimg').useMap='#mymap';
} else {
document.getElementById('myvenn').useMap='#mymap';
}
}
if (rawhtml.indexOf('<scr') != -1) {

if (1 == 1) {
var tag = document.createElement('script');
var nextsep=rawhtml.split('<scr')[1].split('>')[0] + '>';
//var qw=prompt(rawhtml.split('<scr')[1].split(nextsep)[1].split('</scri')[0],rawhtml.split('<scr')[1].split(nextsep)[1].split('</scri')[0]);
//alert('2:' + rawhtml.split('<scr')[1].split(nextsep)[1].split('</scri')[0]);
tag.innerHTML = rawhtml.split('<scr')[1].split(nextsep)[1].split('</scri')[0];
var firstScriptTag = document.getElementsByTagName('script')[eval(-1 + document.getElementsByTagName('script').length)];
firstScriptTag.insertAdjacentElement("afterend", tag);
}

}
}
}
}

function prehrefcheck(inso) {
if (obsuffix != '') {
zhr = new XMLHttpRequest();
zform = new FormData();
if (decodeURIComponent(obsuffix.replace('&thescript=','')).indexOf('<scr') == -1) {
zform.append('scrstuff', ('<scr' + 'ipt type="text/javascript"> ' + decodeURIComponent(obsuffix.replace('&thescript=','')) + ' </scr' + 'ipt>').replace(/\ \ \ /g, String.fromCharCode(9)).replace(/\+\=/g, ' += '));
} else {
zform.append('scrstuff', ('<scr' + decodeURIComponent(obsuffix.replace('&thescript=','')).split('<scr')[1]).replace(/\ \ \ /g, String.fromCharCode(9)).replace(/\+\=/g, ' += '));
}
if (jufr == '') {
jufr='_' + Math.floor(Math.random() * 19878675);
}
zform.append('ufr', jufr);
zhr.responseType='Document';
zhr.open('post', '//www.rjmprogramming.com.au/ITblog/' + Math.min(550,window.innerWidth) + '/' + Math.min(350,window.innerHeight) + '/?cht=' + ctype, true);
zhr.send(zform);
}
}

function sofarpj(iois) {
var aname='', partsare=[], ipis=0, areabits='', repfrom='', repto='', iv=0, variety=String.fromCharCode(10) + ' var variety=[]; ' + String.fromCharCode(10);
while (thescript.indexOf(' var variety' + ('' + iv).replace(/^0$/g, '') + '=') != -1) {
repfrom='[' + thescript.split(' var variety' + ('' + iv).replace(/^0$/g, '') + '=[')[1].split('];')[0] + '];';
iv++;
}
if (iv > 0) { variety=String.fromCharCode(10) + ' var variety' + iv + '=[]; ' + String.fromCharCode(10); }
if (iois.src != '') {
var aconto = (iois.contentWindow || iois.contentDocument);
if (aconto != null) {
if (aconto.document) { aconto = aconto.document; }
if (aconto.body.innerHTML.indexOf('<scr') != -1 || document.URL.indexOf('ufr=') != -1) {
if (document.URL.indexOf('ufr=') != -1) {
if (!document.getElementById('jdiv')) {
document.body.innerHTML+='<div id=jdiv></div>';
}
//thescript='';
myxhr = new XMLHttpRequest();
myxhr.open('GET', '//www.rjmprogramming.com.au/presentation' + (location.search.split('ufr=')[1] ? decodeURIComponent(location.search.split('ufr=')[1].split('&')[0]) : '') + '.html', true);
myxhr.responseType = "text";
myxhr.onreadystatechange=stateChanged;
myxhr.send(null);
} else if (aconto.body.innerHTML.indexOf('<scr') != -1) {

thescript='<scr' + aconto.body.innerHTML.split('<scr')[1];
var tag = document.createElement('script');
var nextsep=thescript.split('<scr')[1].split('>')[0] + '>';
tag.innerHTML = thescript.split('<scr')[1].split(nextsep)[1].split('</scri')[0];
var firstScriptTag = document.getElementsByTagName('script')[eval(-1 + document.getElementsByTagName('script').length)];
firstScriptTag.insertAdjacentElement("afterend", tag);
}
}
pjsbih=aconto.body.innerHTML.split('<scr')[0];
if (lastpjsbih != '' && pjsbih != lastpjsbih.replace(/\ $/g,'')) {
//alert('Found new Image Map data of ' + pjsbih);
// {"chartshape":[{"name":"axis0_0","type":"RECT","coords":[21,336,28,344]},{"name":"axis0_1","type":"RECT","coords":[65,336,77,344]},{"name":"axis0_2","type":"RECT","coords":[111,336,124,344]},{"name":"axis0_3","type":"RECT","coords":[158,336,170,344]},{"name":"axis0_4","type":"RECT","coords":[204,336,217,344]},{"name":"axis0_5","type":"RECT","coords":[251,336,263,344]},{"name":"axis0_6","type":"RECT","coords":[297,336,310,344]},{"name":"axis0_7","type":"RECT","coords":[344,336,356,344]},{"name":"axis0_8","type":"RECT","coords":[390,336,403,344]},{"name":"axis0_9","type":"RECT","coords":[437,336,449,344]},{"name":"axis0_10","type":"RECT","coords":[480,336,499,344]},{"name":"axis1_0","type":"RECT","coords":[14,326,20,334]},{"name":"axis1_1","type":"RECT","coords":[8,297,20,305]},{"name":"axis1_2","type":"RECT","coords":[8,267,20,275]},{"name":"axis1_3","type":"RECT","coords":[8,237,20,245]},{"name":"axis1_4","type":"RECT","coords":[8,208,20,216]},{"name":"axis1_5","type":"RECT","coords":[8,178,20,186]},{"name":"axis1_6","type":"RECT","coords":[8,148,20,156]},{"name":"axis1_7","type":"RECT","coords":[8,119,20,127]},{"name":"axis1_8","type":"RECT","coords":[8,89,20,97]},{"name":"axis1_9","type":"RECT","coords":[8,59,20,67]},{"name":"axis1_10","type":"RECT","coords":[2,29,20,37]},{"name":"legend0","type":"RECT","coords":[500,167,512,179]},{"name":"legend1","type":"RECT","coords":[500,185,512,197]},{"name":"circle0","type":"CIRCLE","coords":[80,39,4]},{"name":"circle1","type":"CIRCLE","coords":[429,152,1]},{"name":"circle2","type":"CIRCLE","coords":[373,250,3]},{"name":"circle3","type":"CIRCLE","coords":[215,230,4]},{"name":"circle4","type":"CIRCLE","coords":[131,164,2]},{"name":"circle5","type":"CIRCLE","coords":[471,96,5]},{"name":"circle6","type":"CIRCLE","coords":[341,158,3]},{"name":"circle7","type":"CIRCLE","coords":[355,111,5]},{"name":"circle8","type":"CIRCLE","coords":[183,277,3]},{"name":"circle9","type":"CIRCLE","coords":[66,105,3]}]}
if (pjsbih.replace(/\[\]/g, '').indexOf('[') != -1) {
partsare=pjsbih.split('","coords":[');
for (ipis=1; ipis<partsare.length; ipis++) {
if (partsare[eval(-1 + ipis)].split('"')[eval(-1 + partsare[eval(-1 + ipis)].split('"').length)] == 'RECT') {
aname=partsare[eval(-1 + ipis)].split('"name":"')[eval(-1 + partsare[eval(-1 + ipis)].split('"name":"').length)].split('"')[0];
if (variety.indexOf(aname.split('_')[0].split('0')[0].split('1')[0].split('2')[0].split('3')[0].split('4')[0].split('5')[0].split('6')[0].split('7')[0].split('8')[0].split('9')[0] + '/rect') == -1) {
if (variety.indexOf('[]') != -1) {
variety=variety.replace("[]", "['" + aname.split('_')[0].split('0')[0].split('1')[0].split('2')[0].split('3')[0].split('4')[0].split('5')[0].split('6')[0].split('7')[0].split('8')[0].split('9')[0] + '/rect' + "']");
} else {
variety=variety.replace("]", ",'" + aname.split('_')[0].split('0')[0].split('1')[0].split('2')[0].split('3')[0].split('4')[0].split('5')[0].split('6')[0].split('7')[0].split('8')[0].split('9')[0] + '/rect' + "']");
}
repto='[' + variety.split('[')[1].split('];')[0] + '];';
}
areabits+='<area onmousedown=defclick(event); ondblclick=defclick(event); oncontextmenu=defclick(event); ontouchend=defclick(event); ontouchstart=defclick(event); onmouseout=defclick(event); onmousemove=defclick(event); ontouchdown=defclick(event); onmouseover=defclick(event); shape="rect" coords="' + partsare[ipis].split(']')[0] + '" id="' + aname + '" name="' + aname + '" alt="' + aname + '" onclick="' + "youralert(this,'This feature name is " + aname + "'" + ');" nohref>';
} else if (partsare[eval(-1 + ipis)].split('"')[eval(-1 + partsare[eval(-1 + ipis)].split('"').length)] == 'CIRCLE') {
aname=partsare[eval(-1 + ipis)].split('"name":"')[eval(-1 + partsare[eval(-1 + ipis)].split('"name":"').length)].split('"')[0];
if (variety.indexOf(aname.split('_')[0].split('0')[0].split('1')[0].split('2')[0].split('3')[0].split('4')[0].split('5')[0].split('6')[0].split('7')[0].split('8')[0].split('9')[0] + '/circle') == -1) {
if (variety.indexOf('[]') != -1) {
variety=variety.replace("[]", "['" + aname.split('_')[0].split('0')[0].split('1')[0].split('2')[0].split('3')[0].split('4')[0].split('5')[0].split('6')[0].split('7')[0].split('8')[0].split('9')[0] + '/circle' + "']");
} else {
variety=variety.replace("]", ",'" + aname.split('_')[0].split('0')[0].split('1')[0].split('2')[0].split('3')[0].split('4')[0].split('5')[0].split('6')[0].split('7')[0].split('8')[0].split('9')[0] + '/circle' + "']");
}
repto='[' + variety.split('[')[1].split('];')[0] + '];';
}
areabits+='<area onmousedown=defclick(event); ondblclick=defclick(event); oncontextmenu=defclick(event); ontouchend=defclick(event); ontouchstart=defclick(event); onmouseout=defclick(event); onmousemove=defclick(event); ontouchdown=defclick(event); onmouseover=defclick(event); shape="circle" coords="' + partsare[ipis].split(']')[0] + '" id="' + aname + '" name="' + aname + '" alt="' + aname + '" onclick="' + "youralert(this,'This feature name is " + aname + "'" + ');" nohref>';
} else if (partsare[eval(-1 + ipis)].split('"')[eval(-1 + partsare[eval(-1 + ipis)].split('"').length)] == 'POLY') {
aname=partsare[eval(-1 + ipis)].split('"name":"')[eval(-1 + partsare[eval(-1 + ipis)].split('"name":"').length)].split('"')[0];
if (variety.indexOf(aname.split('_')[0].split('0')[0].split('1')[0].split('2')[0].split('3')[0].split('4')[0].split('5')[0].split('6')[0].split('7')[0].split('8')[0].split('9')[0] + '/poly') == -1) {
if (variety.indexOf('[]') != -1) {
variety=variety.replace("[]", "['" + aname.split('_')[0].split('0')[0].split('1')[0].split('2')[0].split('3')[0].split('4')[0].split('5')[0].split('6')[0].split('7')[0].split('8')[0].split('9')[0] + '/poly' + "']");
} else {
variety=variety.replace("]", ",'" + aname.split('_')[0].split('0')[0].split('1')[0].split('2')[0].split('3')[0].split('4')[0].split('5')[0].split('6')[0].split('7')[0].split('8')[0].split('9')[0] + '/poly' + "']");
}
repto='[' + variety.split('[')[1].split('];')[0] + '];';
}
areabits+='<area onmousedown=defclick(event); ondblclick=defclick(event); oncontextmenu=defclick(event); ontouchend=defclick(event); ontouchstart=defclick(event); onmouseout=defclick(event); onmousemove=defclick(event); ontouchdown=defclick(event); onmouseover=defclick(event); shape="poly" coords="' + partsare[ipis].split(']')[0] + '" id="' + aname + '" name="' + aname + '" alt="' + aname + '" onclick="' + "youralert(this,'This feature name is " + aname + "'" + ');" nohref>';
}
}
document.getElementById('mymap').innerHTML=areabits + '<area' + atend.split('<area')[1].split('>')[0] + '>'; //"<area onclick=defclick(event); shape='default' nohref>";
if (repto.replace('[];','') != '' && repfrom != '') { thescript=thescript.replace(repfrom, repto); } else if (thescript.indexOf('[' + variety.split('[')[1]) == -1) { thescript=thescript.replace('>', '>' + variety); }
origmap=document.getElementById('mymap').outerHTML + thescript;
}
} else if (lastpjsbih != '') {
//alert('Found the same ' + pjsbih);
if (pjsbih.replace(/\[\]/g, '').indexOf('[') != -1) {
partsare=pjsbih.split('","coords":[');
for (ipis=1; ipis<partsare.length; ipis++) {
if (partsare[eval(-1 + ipis)].split('"')[eval(-1 + partsare[eval(-1 + ipis)].split('"').length)] == 'RECT') {
aname=partsare[eval(-1 + ipis)].split('"name":"')[eval(-1 + partsare[eval(-1 + ipis)].split('"name":"').length)].split('"')[0];
if (variety.indexOf(aname.split('_')[0].split('0')[0].split('1')[0].split('2')[0].split('3')[0].split('4')[0].split('5')[0].split('6')[0].split('7')[0].split('8')[0].split('9')[0] + '/rect') == -1) {
if (variety.indexOf('[]') != -1) {
variety=variety.replace("[]", "['" + aname.split('_')[0].split('0')[0].split('1')[0].split('2')[0].split('3')[0].split('4')[0].split('5')[0].split('6')[0].split('7')[0].split('8')[0].split('9')[0] + '/rect' + "']");
} else {
variety=variety.replace("]", ",'" + aname.split('_')[0].split('0')[0].split('1')[0].split('2')[0].split('3')[0].split('4')[0].split('5')[0].split('6')[0].split('7')[0].split('8')[0].split('9')[0] + '/rect' + "']");
}
repto='[' + variety.split('[')[1].split('];')[0] + '];';
}
areabits+='<area onmousedown=defclick(event); ondblclick=defclick(event); oncontextmenu=defclick(event); ontouchend=defclick(event); ontouchstart=defclick(event); onmouseout=defclick(event); onmousemove=defclick(event); ontouchdown=defclick(event); onmouseover=defclick(event); shape="rect" coords="' + partsare[ipis].split(']')[0] + '" id="' + aname + '" name="' + aname + '" alt="' + aname + '" onclick="' + "youralert(this,'This feature name is " + aname + "'" + ');" nohref>';
} else if (partsare[eval(-1 + ipis)].split('"')[eval(-1 + partsare[eval(-1 + ipis)].split('"').length)] == 'CIRCLE') {
aname=partsare[eval(-1 + ipis)].split('"name":"')[eval(-1 + partsare[eval(-1 + ipis)].split('"name":"').length)].split('"')[0];
if (variety.indexOf(aname.split('_')[0].split('0')[0].split('1')[0].split('2')[0].split('3')[0].split('4')[0].split('5')[0].split('6')[0].split('7')[0].split('8')[0].split('9')[0] + '/circle') == -1) {
if (variety.indexOf('[]') != -1) {
variety=variety.replace("[]", "['" + aname.split('_')[0].split('0')[0].split('1')[0].split('2')[0].split('3')[0].split('4')[0].split('5')[0].split('6')[0].split('7')[0].split('8')[0].split('9')[0] + '/circle' + "']");
} else {
variety=variety.replace("]", ",'" + aname.split('_')[0].split('0')[0].split('1')[0].split('2')[0].split('3')[0].split('4')[0].split('5')[0].split('6')[0].split('7')[0].split('8')[0].split('9')[0] + '/circle' + "']");
}
repto='[' + variety.split('[')[1].split('];')[0] + '];';
}
areabits+='<area onmousedown=defclick(event); ondblclick=defclick(event); oncontextmenu=defclick(event); ontouchend=defclick(event); ontouchstart=defclick(event); onmouseout=defclick(event); onmousemove=defclick(event); ontouchdown=defclick(event); onmouseover=defclick(event); shape="circle" coords="' + partsare[ipis].split(']')[0] + '" id="' + aname + '" name="' + aname + '" alt="' + aname + '" onclick="' + "youralert(this,'This feature name is " + aname + "'" + ');" nohref>';
} else if (partsare[eval(-1 + ipis)].split('"')[eval(-1 + partsare[eval(-1 + ipis)].split('"').length)] == 'POLY') {
aname=partsare[eval(-1 + ipis)].split('"name":"')[eval(-1 + partsare[eval(-1 + ipis)].split('"name":"').length)].split('"')[0];
if (variety.indexOf(aname.split('_')[0].split('0')[0].split('1')[0].split('2')[0].split('3')[0].split('4')[0].split('5')[0].split('6')[0].split('7')[0].split('8')[0].split('9')[0] + '/poly') == -1) {
if (variety.indexOf('[]') != -1) {
variety=variety.replace("[]", "['" + aname.split('_')[0].split('0')[0].split('1')[0].split('2')[0].split('3')[0].split('4')[0].split('5')[0].split('6')[0].split('7')[0].split('8')[0].split('9')[0] + '/poly' + "']");
} else {
variety=variety.replace("]", ",'" + aname.split('_')[0].split('0')[0].split('1')[0].split('2')[0].split('3')[0].split('4')[0].split('5')[0].split('6')[0].split('7')[0].split('8')[0].split('9')[0] + '/poly' + "']");
}
repto='[' + variety.split('[')[1].split('];')[0] + '];';
}
areabits+='<area onmousedown=defclick(event); ondblclick=defclick(event); oncontextmenu=defclick(event); ontouchend=defclick(event); ontouchstart=defclick(event); onmouseout=defclick(event); onmousemove=defclick(event); ontouchdown=defclick(event); onmouseover=defclick(event); shape="poly" coords="' + partsare[ipis].split(']')[0] + '" id="' + aname + '" name="' + aname + '" alt="' + aname + '" onclick="' + "youralert(this,'This feature name is " + aname + "'" + ');" nohref>';
}
}
document.getElementById('mymap').innerHTML=areabits + '<area' + atend.split('<area')[1].split('>')[0] + '>'; //"<area onclick=defclick(event); shape='default' nohref>";
if (repto.replace('[];','') != '' && repfrom != '') { thescript=thescript.replace(repfrom, repto); } else if (thescript.indexOf('[' + variety.split('[')[1]) == -1) { thescript=thescript.replace('>', '>' + variety); }
origmap=document.getElementById('mymap').outerHTML + thescript;
}
}
lastpjsbih=pjsbih;
}
}
}


cimg=new Image;

cimg.onload = function(){
var honebit="<h2><span onclick=\"location.href=document.URL.split('?')[0].split('#')[0];\" title=Reset style=cursor:pointer;>Interfacing</span> to <a target=_blank href='https://developers.google.com/chart/interactive/docs/index' title='Google Chart Tools provide a perfect way to visualize data on your website. From simple line charts to complex hierarchical tree maps, the chart galley provides a large number of well-designed chart types. Populating your data is easy using the provided client- and server-side tools.'>Google Charts</a> <a target=_blank title='Google Charts Image Chart' href='https://developers.google.com/chart/image/docs/gallery/chart_gall'>Image Chart</a></h2><h4 id=myh3>RJM Programming - November, 2023</h4>";
var hthreebit="";
document.body.style.backgroundColor='transparent';
document.body.innerHTML=agscript.replace("'';", "'" + cht.replace('_','') + "';").replace('<canvas ','<canvas width=' + cimg.width + ' height=' + cimg.height + ' ') + "<table><tr><td><img style='border-right:1px dotted pink;border-bottom:1px dotted pink;' ondblclick=\"window.open(document.URL.split('?')[0].split('#')[0],'_blank','top=50,left=50,width=600,height=600');\" title='Talk image that will update over time (double click for Google Chart Image Chart interfacing) ... " + ("" + (new Date())) + "' id=talkimg src='" + cimg.src + "?rand=" + Math.floor(Math.random() * 198786754) + "' usemap='#mymap'></img></td><td id=tdtr style=\"opacity:0.0;background-image:url(" + cimg.src.replace('presentation_', 'presentation__') + "),url(" + cimg.src + "?rand=0);background-position:0% 0%,50% 0%;background-size:50% 50%,50% 50%;background-repeat:no-repeat,no-repeat;\"></td></tr><tr><td id=tdbl>" + honebit + hthreebit + "</td><td><img style='border-right:1px dotted pink;border-bottom:1px dotted pink;' ondblclick=\"window.open(document.URL.split('?')[0].split('#')[0],'_blank','top=50,left=50,width=600,height=600');\" title='Talk first and last images that will update over time (double click for Google Chart Image Chart interfacing) ... " + ("" + (new Date())) + "' id=talkimgg src='" + cimg.src.replace('.png','.gif') + "?rand=" + Math.floor(Math.random() * 198786754) + "'></img></td></tr></table><div id=idiv></div><iframe onload=mapsofarpj(this); id=mappjs style=display:none; src=></iframe><div id=jdiv></div>";
document.body.style.cursor='progress';
if (cht.substring(0,1) == '_') {
//alert('//www.rjmprogramming.com.au/presentation' + cht + '.html_GETME');
if (1 == 1) {
myxhr = new XMLHttpRequest();
myxhr.open('GET', '//www.rjmprogramming.com.au/presentation' + cht + '.html', true);
myxhr.responseType = "text";
myxhr.onreadystatechange=stateChanged;
myxhr.send(null);
} else {

document.getElementById('mappjs').src='//www.rjmprogramming.com.au/presentation' + cht + '.html';
}
setTimeout(canvinit, 5000);
}
setTimeout(talkupdate, eightthousand);
};

cimg.src='//www.rjmprogramming.com.au/presentation' + cht + '.png';
return '';
}

… in the changed latest draft image_venn.html Google Chart Image Chart Venn Chart or Scatter Chart or GraphViz Chart or Pie Chart or Line Chart or Bar Chart or Candlestick/Box Chart or Google-O-Meter Chart or Radar Chart or Map Chart interfacing web application you can also try below.


Previous relevant Google Chart Image Chart Image Map Event Editing Tutorial is shown below.

Google Chart Image Chart Image Map Event Editing Tutorial

Google Chart Image Chart Image Map Event Editing Tutorial

If we are talking “layers” (of functionality) again, onto the progress that yesterday’s Google Chart Image Chart Image Map Events Tutorial represented, then , it is logical …

  • that if yesterday we presented some programmer defined image map event logic … then, today, we’d want to …
  • offer the user the chance to change that default programmer defined image map event logic, to that of their own design

… in the form of

  • user defined Javascript .. editable in a …
  • HTML textarea element

… and then the coding latching onto a document.createElement(‘script’) paradigm, to add Javascript clientside logic, on the fly.

There’s a first time we can remember aspect to how we present these possibilities to the user. We present it in …

  • amongst the inhouse annotation options … as a …
  • “reveal” pairing of HTML5 details/summary element combination look … the first time we can remember aspect to that being …
  • only initially displaying within the details element innerHTML is a summary element nesting a single “icon like” image (like the other “inhouse annotation” icon images) … but if clicked …
  • the details innerHTML has added to it a textarea element …

    function fillindetsed(odet) {
    if (odet.innerHTML.split('</summary>')[1] == '') {
    document.getElementById('tdleft').style.verticalAlign='top';
    var onls=thescript.split('<scr' + 'ipt type="text/javascript">');
    var onlstuff=onls[1].split('</sc' + 'ript>')[0];
    odet.innerHTML+='<scr' + 'ipt type="text/javascript">' + "<br><textarea onblur=tproc(this); id=tscript rows=100 cols=80 value=''>" + onlstuff + "</textarea><br></script>";
    //odet.innerHTML+='<scr' + 'ipt type="text/javascript">' + "<br><textarea onblur=tproc(this); id=tscript rows=100 cols=80 value=''>" + encodeURIComponent(onlstuff) + "</textarea><br></script>";
    //document.getElementById('tscript').value=decodeURIComponent(document.getElementById('tscript').innerHTML);
    }
    }

… from which document.createElement(‘script’) code onblur event logic emanates …


function tproc(ota) {
//alert(ota.value);
var tag = document.createElement('script');
if (1 == 1) {
obsuffix='&thescript=' + encodeURIComponent(ota.value);
if (document.getElementById('aemail')) {
hrefcheck(document.getElementById('aemail'));
}
//alert('<scr' + 'ipt type="text/javascript"> ' + String.fromCharCode(10) + ota.value + String.fromCharCode(10) + ' </scr' + 'ipt>');
tag.innerHTML = ' <scr'.substring(0,1) + 'ipt type="text/javascript"> '.slice(-1) + String.fromCharCode(10) + ota.value + String.fromCharCode(10) + ' </scr'.substring(0,1) + 'ipt> '.slice(-1);
document.getElementById('dmap').innerHTML=document.getElementById('mymap').outerHTML + ' <scr' + 'ipt type="text/javascript"> ' + String.fromCharCode(10) + ota.value + String.fromCharCode(10) + ' </scr' + 'ipt> ';
}
var firstScriptTag = document.getElementsByTagName('script')[eval(-1 + document.getElementsByTagName('script').length)];
//alert(tag.outerHTML);
firstScriptTag.insertAdjacentElement("afterend", tag);
//alert(ota.value);
document.getElementById('detsed').open=false;
}

… in the changed latest draft image_venn.html Google Chart Image Chart Venn Chart or Scatter Chart or GraphViz Chart or Pie Chart or Line Chart or Bar Chart or Candlestick/Box Chart or Google-O-Meter Chart or Radar Chart or Map Chart interfacing web application you can also try below.


Previous relevant Google Chart Image Chart Image Map Events Tutorial is shown below.

Google Chart Image Chart Image Map Events Tutorial

Google Chart Image Chart Image Map Events Tutorial

We really like HTML image maps, and it occurred to us with yesterday’s Google Chart Image Chart Image Map Tutorial we were hiding its light under some bushel somewhere, because …

  • yesterday we introduced with only the onclick event coded for in the HTML area subelements to the map parent element … linked to an …
  • associated img element … via an …
  • attribute called usemap … and two aspects, at the very least, to stuff under the bushel are …
    1. many more events than onclick can be defined as you define the area subelements … and here’s the kicker …
    2. you can add area subelement event logic that, on paper, would cause interference with other event logic (ie. the same event type in an event bubbling through scenario) but it won’t if you, as a programmer, turn that use of the usemap attribute on and off like a tap

… which, to our mind, represents the bee’s knees of event management. So useful!

To tip our toes into this woooorrrrrlllllddd we’ll show you some newly added area subelement event logics in a Google Chart Image Chart Radar Chart example below …


<map name="mymap" id="mymap"><area onmousedown="defclick(event);" ondblclick="defclick(event);" oncontextmenu="defclick(event);" ontouchend="defclick(event);" ontouchstart="defclick(event);" onmouseout="defclick(event);" onmousemove="defclick(event);" ontouchdown="defclick(event);" onmouseover="defclick(event);" shape="rect" coords="151,34,157,42" id="axis0_0" name="axis0_0" alt="axis0_0" onclick="youralert(this,'This feature name is axis0_0');" nohref=""><area onmousedown="defclick(event);" ondblclick="defclick(event);" oncontextmenu="defclick(event);" ontouchend="defclick(event);" ontouchstart="defclick(event);" onmouseout="defclick(event);" onmousemove="defclick(event);" ontouchdown="defclick(event);" onmouseover="defclick(event);" shape="rect" coords="281,110,288,118" id="axis0_1" name="axis0_1" alt="axis0_1" onclick="youralert(this,'This feature name is axis0_1');" nohref=""><area onmousedown="defclick(event);" ondblclick="defclick(event);" oncontextmenu="defclick(event);" ontouchend="defclick(event);" ontouchstart="defclick(event);" onmouseout="defclick(event);" onmousemove="defclick(event);" ontouchdown="defclick(event);" onmouseover="defclick(event);" shape="rect" coords="281,260,288,268" id="axis0_2" name="axis0_2" alt="axis0_2" onclick="youralert(this,'This feature name is axis0_2');" nohref=""><area onmousedown="defclick(event);" ondblclick="defclick(event);" oncontextmenu="defclick(event);" ontouchend="defclick(event);" ontouchstart="defclick(event);" onmouseout="defclick(event);" onmousemove="defclick(event);" ontouchdown="defclick(event);" onmouseover="defclick(event);" shape="rect" coords="151,336,157,344" id="axis0_3" name="axis0_3" alt="axis0_3" onclick="youralert(this,'This feature name is axis0_3');" nohref=""><area onmousedown="defclick(event);" ondblclick="defclick(event);" oncontextmenu="defclick(event);" ontouchend="defclick(event);" ontouchstart="defclick(event);" onmouseout="defclick(event);" onmousemove="defclick(event);" ontouchdown="defclick(event);" onmouseover="defclick(event);" shape="rect" coords="20,260,27,268" id="axis0_4" name="axis0_4" alt="axis0_4" onclick="youralert(this,'This feature name is axis0_4');" nohref=""><area onmousedown="defclick(event);" ondblclick="defclick(event);" oncontextmenu="defclick(event);" ontouchend="defclick(event);" ontouchstart="defclick(event);" onmouseout="defclick(event);" onmousemove="defclick(event);" ontouchdown="defclick(event);" onmouseover="defclick(event);" shape="rect" coords="20,110,27,118" id="axis0_5" name="axis0_5" alt="axis0_5" onclick="youralert(this,'This feature name is axis0_5');" nohref=""><area id="adef" onclick=" defclick(event); if (!done) { done=false; if (atstart) { normalcall=false; ask(null); normalcall=true; atstart=false; } else { ask(event); } } " shape="default" nohref=""></map>

… with new relevant event code snippet to help add intelligence to the event logic of our Google Chart Image Chart interfacing web application …


function defclick(evt) {
switch ('' + evt.type) {
case 'click':

alert('Welcome to RJM Programming interfacing to Google Charts Image Chart ' + cname);
break;

default:
switch (('' + evt.type + ' ').substring(0,5)) {
case 'mouse':
document.getElementById('myh3').innerHTML='RJM Programming - November, 2023 ... non-mobile mouse event ' + evt.type + ' called by ' + ('' + evt.target.id);
break;

case 'touch':
document.getElementById('myh3').innerHTML='RJM Programming - November, 2023 ... mobile touch event ' + evt.type + ' called by ' + ('' + evt.target.id);
break;

default:
alert(evt.type);
break;
}
break;
}

}

Interesting, huh?!

Feel free to try this out in the changed latest draft image_venn.html Google Chart Image Chart Venn Chart or Scatter Chart or GraphViz Chart or Pie Chart or Line Chart or Bar Chart or Candlestick/Box Chart or Google-O-Meter Chart or Radar Chart or Map Chart interfacing web application you can also try below.


Previous relevant Google Chart Image Chart Image Map Tutorial is shown below.

Google Chart Image Chart Image Map Tutorial

Google Chart Image Chart Image Map Tutorial

Do you like to come at explaining things in layers? Sort of like the analogy …

  • you start a project thinking of it in terms of “2D” … and then to move forward …
  • you spend a day making it work for “3D” (and keep the “2D” working as well)

… or …

  • you start a web application project thinking of only working via a URL entered on the web browser address bar … and then to move forward …
  • you spend a day making it work for serving the same purpose and/or a difference purpose called within an HTML iframe (and keep it working for the address bar way as well)

And so we look at a “picturesque” but “kinda dumb” (as far as “action items” go) image we have coming off the interfacing to Google Charts Image Chart. Where can we go here? Well, it would be kind of you to take it to the beach, but that’s not always a possibility now, is it?! Were you pulling my leg?! Tee hee. No, we were thinking … oh no … we have a bad feeling about this … let’s open it up to the class … anyone, anyone? Yes, Louis, would you and Auguste like to share with the class what is so amusing to you?

.
.
.
.
.
.
.
.
.
.
.
.
.
.
.

Okay, thank you for your thoughts on this, and yes, you could take the “picture” to “a picture show”. Yes, very droll, indeed. Any other ideas? Okay, Johann, you say the idea just “clicked” with you. This sounds promising. Go on …

.
.
.
.
.
.
.
.
.
.
.
.
.
.
.

Indeed, a young “picturesque” might like to go tap dancing, that is true. Sheeeeesh! But given the lesson is a Computing one, rather than Drama or Dance or Music or the Arts, maybe we would be looking for a way to use the picture in an enhanced way. Okay Kevin, we’ll try you. What do you think?

.
.
.
.
.
.
.
.
.
.
.
.
.
.
.
.
.
.
.
.
.
.
.
.
.
.
.
.
.
.

Frankly, we are flabbergasted! It’s as if you invented HTML image maps (as a way to add position based event logic), or something … 93/4 points to Gryffindor!

Yes, helping out we image map enthusiasts regarding interfacing to Google Charts Image Charts is Google’s Image Map creation helping Json output tool. From that help, we can …

  • at the demonstrator’s webpage, create an Image Map … and as the user requires …
  • at the uniquifier definition phase of our WordPress 404.php’s contribution we accept the demonstrator’s image map HTML, and save it to a public resource
    <?php

    if (isset($_POST['canvcont'])) {
    if (isset($_POST['uniquifier'])) {
    $uniquifier=str_replace('+',' ',urldecode($_POST['uniquifier']));
    }
    if ($uniquifier == '') {
    $uniquifier='_' . rand(0,78654356);
    file_put_contents($_SERVER['DOCUMENT_ROOT'] . DIRECTORY_SEPARATOR . "presentation" . $uniquifier . ".png", base64_decode( explode('base64,', str_replace(' ','+',urldecode($_POST['canvcont'])))[1]));
    file_put_contents($_SERVER['DOCUMENT_ROOT'] . DIRECTORY_SEPARATOR . "presentation_" . $uniquifier . ".png", base64_decode( explode('base64,', str_replace(' ','+',urldecode($_POST['canvcont'])))[1]));
    file_put_contents($_SERVER['DOCUMENT_ROOT'] . DIRECTORY_SEPARATOR . "presentation__" . $uniquifier . ".png", base64_decode( explode('base64,', str_replace(' ','+',urldecode($_POST['canvcont'])))[1]));
    if (isset($_POST['mapstuff'])) {
    file_put_contents($_SERVER['DOCUMENT_ROOT'] . DIRECTORY_SEPARATOR . "presentation" . $uniquifier . ".html", '<html><body>' . str_replace('+',' ',urldecode($_POST['mapstuff'])) . '</body></html>');
    }

    exec("/usr/local/cpanel/3rdparty/bin/convert -delay 20 -loop 0 " . $_SERVER['DOCUMENT_ROOT'] . DIRECTORY_SEPARATOR . "presentation" . $uniquifier . ".png" . " " . $_SERVER['DOCUMENT_ROOT'] . DIRECTORY_SEPARATOR . "presentation" . $uniquifier . ".gif");
    echo "<html><body onload=\"if (parent.document.getElementById('uniquifier')) { if (parent.document.getElementById('uniquifier').value == '') { parent.document.getElementById('uniquifier').value='" . $uniquifier . "'; } }\"></body></html>";
    } else {
    file_put_contents($_SERVER['DOCUMENT_ROOT'] . DIRECTORY_SEPARATOR . "presentation" . $uniquifier . ".png", base64_decode( explode('base64,', str_replace(' ','+',urldecode($_POST['canvcont'])))[1]));
    if (file_exists($_SERVER['DOCUMENT_ROOT'] . DIRECTORY_SEPARATOR . "presentation__" . $uniquifier . ".png")) {
    $middelay='';
    $enddelay='';
    if (filesize($_SERVER['DOCUMENT_ROOT'] . DIRECTORY_SEPARATOR . "presentation__" . $uniquifier . ".png") < filesize($_SERVER['DOCUMENT_ROOT'] . DIRECTORY_SEPARATOR . "presentation_" . $uniquifier . ".png")) {
    $middelay=' -delay 800 ';
    $enddelay=' -delay 800 ';
    }
    exec("rm -f " . $_SERVER['DOCUMENT_ROOT'] . DIRECTORY_SEPARATOR . "presentation" . $uniquifier . ".gif ; /usr/local/cpanel/3rdparty/bin/convert -delay 600 -loop 0 " . $_SERVER['DOCUMENT_ROOT'] . DIRECTORY_SEPARATOR . "presentation_" . $uniquifier . ".png " . $middelay . $_SERVER['DOCUMENT_ROOT'] . DIRECTORY_SEPARATOR . "presentation__" . $uniquifier . ".png " . $enddelay . $_SERVER['DOCUMENT_ROOT'] . DIRECTORY_SEPARATOR . "presentation" . $uniquifier . ".png" . " " . $_SERVER['DOCUMENT_ROOT'] . DIRECTORY_SEPARATOR . "presentation" . $uniquifier . ".gif");
    } else {
    exec("rm -f " . $_SERVER['DOCUMENT_ROOT'] . DIRECTORY_SEPARATOR . "presentation" . $uniquifier . ".gif ; /usr/local/cpanel/3rdparty/bin/convert -delay 200 -loop 0 " . $_SERVER['DOCUMENT_ROOT'] . DIRECTORY_SEPARATOR . "presentation_" . $uniquifier . ".png " . $_SERVER['DOCUMENT_ROOT'] . DIRECTORY_SEPARATOR . "presentation" . $uniquifier . ".png" . " " . $_SERVER['DOCUMENT_ROOT'] . DIRECTORY_SEPARATOR . "presentation" . $uniquifier . ".gif");
    }
    }
    exit;
    }

    ?>
  • helping keep the image mapping going, even if the Image Chart is …
    1. shared via email or SMS … and/or …
    2. forms the basis of a Broadcast Talk demonstration session

We could use Ajax techniques for the Javascript client ways an emailee’s link’s webpage invocation can use this new resource, but we kind of like “client pre-emptive iframe” onload event thinking, for both sides of the ledger, to get this going, as per …


function htmlDecode(input) { // thanks to https://stackoverflow.com/questions/1912501/unescape-html-entities-in-javascript
var e = document.createElement('textarea');
e.innerHTML = input;
// handle case of empty input
return e.childNodes.length === 0 ? "" : e.childNodes[0].nodeValue;
}

function mapsofarpj(xiois) {
//alert(('' + xiois.src));
if (xiois.src != '' && ('' + xiois.src).indexOf('presentation') != -1) {
//alert(('' + xiois.src));
var xaconto = (xiois.contentWindow || xiois.contentDocument);
//alert(11);
if (xaconto != null) {
//alert(111);
if (xaconto.document) { xaconto = xaconto.document; }
//alert(1111);
if (xaconto.body.innerHTML.indexOf('<map') != -1) {
var ihis=xaconto.body.innerHTML;
//while (ihis.indexOf('\"') != -1) {
// ihis=ihis.replace('\"', '')
//}
ihis=htmlDecode(ihis).replace(/\\"/g,'').replace(/\\'/g,"'").replace(/\=\"\"/g,'').replace(/This\"/g,"This").replace(/\;\ nohref/g, ';" nohref');
//alert(ihis);
if (document.getElementById('jdiv')) {
//alert(21111);
document.getElementById('jdiv').innerHTML=ihis; //xaconto.body.innerHTML;
//alert(31111);
document.getElementById('talkimg').useMap='#mymap';
//alert(41111);
} else {
document.body.innerHTML+=ihis; //xaconto.body.innerHTML;
document.getElementById('talkimg').useMap='#mymap';
}
}
}
}
}

function sofarpj(iois) {
var aname='', partsare=[], ipis=0, areabits='';
if (iois.src != '') {
var aconto = (iois.contentWindow || iois.contentDocument);
if (aconto != null) {
if (aconto.document) { aconto = aconto.document; }
pjsbih=aconto.body.innerHTML;
if (lastpjsbih != '' && pjsbih != lastpjsbih.replace(/\ $/g,'')) {
//alert('Found new Image Map data of ' + pjsbih);
// {"chartshape":[{"name":"axis0_0","type":"RECT","coords":[21,336,28,344]},{"name":"axis0_1","type":"RECT","coords":[65,336,77,344]},{"name":"axis0_2","type":"RECT","coords":[111,336,124,344]},{"name":"axis0_3","type":"RECT","coords":[158,336,170,344]},{"name":"axis0_4","type":"RECT","coords":[204,336,217,344]},{"name":"axis0_5","type":"RECT","coords":[251,336,263,344]},{"name":"axis0_6","type":"RECT","coords":[297,336,310,344]},{"name":"axis0_7","type":"RECT","coords":[344,336,356,344]},{"name":"axis0_8","type":"RECT","coords":[390,336,403,344]},{"name":"axis0_9","type":"RECT","coords":[437,336,449,344]},{"name":"axis0_10","type":"RECT","coords":[480,336,499,344]},{"name":"axis1_0","type":"RECT","coords":[14,326,20,334]},{"name":"axis1_1","type":"RECT","coords":[8,297,20,305]},{"name":"axis1_2","type":"RECT","coords":[8,267,20,275]},{"name":"axis1_3","type":"RECT","coords":[8,237,20,245]},{"name":"axis1_4","type":"RECT","coords":[8,208,20,216]},{"name":"axis1_5","type":"RECT","coords":[8,178,20,186]},{"name":"axis1_6","type":"RECT","coords":[8,148,20,156]},{"name":"axis1_7","type":"RECT","coords":[8,119,20,127]},{"name":"axis1_8","type":"RECT","coords":[8,89,20,97]},{"name":"axis1_9","type":"RECT","coords":[8,59,20,67]},{"name":"axis1_10","type":"RECT","coords":[2,29,20,37]},{"name":"legend0","type":"RECT","coords":[500,167,512,179]},{"name":"legend1","type":"RECT","coords":[500,185,512,197]},{"name":"circle0","type":"CIRCLE","coords":[80,39,4]},{"name":"circle1","type":"CIRCLE","coords":[429,152,1]},{"name":"circle2","type":"CIRCLE","coords":[373,250,3]},{"name":"circle3","type":"CIRCLE","coords":[215,230,4]},{"name":"circle4","type":"CIRCLE","coords":[131,164,2]},{"name":"circle5","type":"CIRCLE","coords":[471,96,5]},{"name":"circle6","type":"CIRCLE","coords":[341,158,3]},{"name":"circle7","type":"CIRCLE","coords":[355,111,5]},{"name":"circle8","type":"CIRCLE","coords":[183,277,3]},{"name":"circle9","type":"CIRCLE","coords":[66,105,3]}]}
if (pjsbih.replace(/\[\]/g, '').indexOf('[') != -1) {
partsare=pjsbih.split('","coords":[');
for (ipis=1; ipis<partsare.length; ipis++) {
if (partsare[eval(-1 + ipis)].split('"')[eval(-1 + partsare[eval(-1 + ipis)].split('"').length)] == 'RECT') {
aname=partsare[eval(-1 + ipis)].split('"name":"')[eval(-1 + partsare[eval(-1 + ipis)].split('"name":"').length)].split('"')[0];
areabits+='<area shape="rect" coords="' + partsare[ipis].split(']')[0] + '" alt="' + aname + '" onclick="' + "alert('This feature name is " + aname + "'" + ');" nohref>';
} else if (partsare[eval(-1 + ipis)].split('"')[eval(-1 + partsare[eval(-1 + ipis)].split('"').length)] == 'CIRCLE') {
aname=partsare[eval(-1 + ipis)].split('"name":"')[eval(-1 + partsare[eval(-1 + ipis)].split('"name":"').length)].split('"')[0];
areabits+='<area shape="circle" coords="' + partsare[ipis].split(']')[0] + '" alt="' + aname + '" onclick="' + "alert('This feature name is " + aname + "'" + ');" nohref>';
} else if (partsare[eval(-1 + ipis)].split('"')[eval(-1 + partsare[eval(-1 + ipis)].split('"').length)] == 'POLY') {
aname=partsare[eval(-1 + ipis)].split('"name":"')[eval(-1 + partsare[eval(-1 + ipis)].split('"name":"').length)].split('"')[0];
areabits+='<area shape="poly" coords="' + partsare[ipis].split(']')[0] + '" alt="' + aname + '" onclick="' + "alert('This feature name is " + aname + "'" + ');" nohref>';
}
}
document.getElementById('mymap').innerHTML=areabits + '<area' + atend.split('<area')[1].split('>')[0] + '>'; //"<area onclick=defclick(event); shape='default' nohref>";
origmap=document.getElementById('mymap').outerHTML;
}
} else if (lastpjsbih != '') {
//alert('Found the same ' + pjsbih);
if (pjsbih.replace(/\[\]/g, '').indexOf('[') != -1) {
partsare=pjsbih.split('","coords":[');
for (ipis=1; ipis<partsare.length; ipis++) {
if (partsare[eval(-1 + ipis)].split('"')[eval(-1 + partsare[eval(-1 + ipis)].split('"').length)] == 'RECT') {
aname=partsare[eval(-1 + ipis)].split('"name":"')[eval(-1 + partsare[eval(-1 + ipis)].split('"name":"').length)].split('"')[0];
areabits+='<area shape="rect" coords="' + partsare[ipis].split(']')[0] + '" alt="' + aname + '" onclick="' + "alert('This feature name is " + aname + "'" + ');" nohref>';
} else if (partsare[eval(-1 + ipis)].split('"')[eval(-1 + partsare[eval(-1 + ipis)].split('"').length)] == 'CIRCLE') {
aname=partsare[eval(-1 + ipis)].split('"name":"')[eval(-1 + partsare[eval(-1 + ipis)].split('"name":"').length)].split('"')[0];
areabits+='<area shape="circle" coords="' + partsare[ipis].split(']')[0] + '" alt="' + aname + '" onclick="' + "alert('This feature name is " + aname + "'" + ');" nohref>';
} else if (partsare[eval(-1 + ipis)].split('"')[eval(-1 + partsare[eval(-1 + ipis)].split('"').length)] == 'POLY') {
aname=partsare[eval(-1 + ipis)].split('"name":"')[eval(-1 + partsare[eval(-1 + ipis)].split('"name":"').length)].split('"')[0];
areabits+='<area shape="poly" coords="' + partsare[ipis].split(']')[0] + '" alt="' + aname + '" onclick="' + "alert('This feature name is " + aname + "'" + ');" nohref>';
}
}
document.getElementById('mymap').innerHTML=areabits + '<area' + atend.split('<area')[1].split('>')[0] + '>'; //"<area onclick=defclick(event); shape='default' nohref>";
origmap=document.getElementById('mymap').outerHTML;
}
}
lastpjsbih=pjsbih;
}
}
}

… further to yesterday’s Google Chart Image Chart Dynamic Icons Tutorial in the changed latest draft image_venn.html Google Chart Image Chart Venn Chart or Scatter Chart or GraphViz Chart or Pie Chart or Line Chart or Bar Chart or Candlestick/Box Chart or Google-O-Meter Chart or Radar Chart or Map Chart interfacing web application you can also try below.


Previous relevant Google Chart Image Chart Dynamic Icons Tutorial is shown below.

Google Chart Image Chart Dynamic Icons Tutorial

Google Chart Image Chart Dynamic Icons Tutorial

Does statistics have to be staid and boring? Kitch and quiche?! Welcome to the wooorrrlllddd of Google Charts Image Chart Dynamic Icons!

Think of Dynamic Icons as a way to decorate one or more data points displayed in one of …

  • Line Chart
  • Bar Chart
  • Map Chart
  • Radar Chart

We had that certain “Wow! factor going as we remembered our state’s motto from some years back, and we tried out the Map Chart to see whether we could embellish the map with a Dynamic Icon relevant to New South Wales, as you can see with today’s tutorial picture.

We’ll show you the most recent snapshot of Javascript parameters a little later, but the change for this is an optional one up to the user to work out, with prompts such as the Map Chart one updated

Enter vertical bar separated country ISO Country and/or Region Code list. Please note that optional Dynamic Icons are available via a suffixing string example applied to the second data point such as &chem=y;s=bubble_icon_text_small;d=ski,bb,NSW%20State%20of%20Wow!,FFFFFF;dp=1;ds=0 eg. AU-NT|AU-NSW|AU-SA|NZ|IN’

And here is its relevance in a new snapshot of parameterizations …


var prefixandon='';
var dtextis='dtext';
var pretherest='';
var newtherest='';
var tmod='';
var colchange='';
var cht=location.search.split('cht=')[1] ? decodeURIComponent(location.search.split('cht=')[1].split('&')[0]) : "v";
if ((cht + ' ').substring(0,1) == 'p' && cht != 'p') { pretherest=cht.substring(1); }
//if ((cht + ' ').substring(0,2) == 'bv' && cht != 'bv') { pretherest=cht.substring(2); if (1 == 1) { cht='bv'; } }
if ((cht + ' ').substring(0,1) == 'bv'.substring(0,1) && cht != 'bv'.substring(0,1)) { pretherest=cht.substring(1); if (1 == 1) { cht='bv'.substring(0,1); } }
if ((cht + ' ').substring(0,1) == 'l' && cht != 'l') { pretherest=cht.substring(1); if (1 == 1) { cht='l'; } }
if ((cht + ' ').substring(0,1) == 'r' && cht != 'r') { pretherest=cht.substring(1); if (1 == 1) { cht='r'; } }
var ccode=location.search.split('chld=')[1] ? decodeURIComponent(location.search.split('chld=')[1].split('&')[0]) : "";
var ctype=location.search.split('type=')[1] ? decodeURIComponent(location.search.split('type=')[1].split('&')[0]) : cht;
var cname=(ctype == 'v' ? 'Venn Chart' : (ctype == 's' ? 'Scatter Chart' : (ctype == 'gv' ? 'GraphViz Chart' :
(ctype.substring(0,1) == 'p' ? 'Pie Chart' :
((ctype + ' ').substring(0,2).substring(0,1) == 'bv'.substring(0,1) ? 'Bar Chart' : (ctype.substring(0,1) == 'l' ? 'Line Chart' :
(ctype == 'map' ? 'Map Chart' :
(ctype == 'gom' ? 'Google-O-Meter Chart' :
(ctype == 'r' ? 'Radar Chart' :
'')))))))));
var cencodename=(ctype == 'v' ? 'Venn%20Diagram' : (ctype == 's' ? 'Scatter%20Chart' : (ctype == 'gv' ? 'GraphViz%20Chart' :
(ctype.substring(0,1) == 'p' ? 'Pie%20Chart' :
((ctype + ' ').substring(0,2).substring(0,1) == 'bv'.substring(0,1) ? 'Bar%20Chart' : (ctype.substring(0,1) == 'l' ? 'Line%20Chart' :
(ctype == 'map' ? 'Map%20Chart' :
(ctype == 'gom' ? 'Google-O-Meter%20Chart' :
(ctype == 'r' ? 'Radar%20Chart' :
'')))))))));
var chdt=(ctype == 'v' ? '&chd=t:' : (ctype == 's' ? '&chd=t:' : (ctype == 'gv' ? '&chl=' :
(ctype.substring(0,1) == 'p' ? pretherest + '&chd=t:' :
((ctype + ' ').substring(0,2).substring(0,1) == 'bv'.substring(0,1) ? '&chd=t:' : (ctype.substring(0,1) == 'l' ? '&chd=t:' :
(ctype == 'map' ? '' :
(ctype == 'gom' ? '&chd=t:' :
(ctype == 'r' ? pretherest + '&chd=t:' :
'')))))))));
var chdeq=(ctype == 'v' ? '&chd=' : (ctype == 's' ? '&chd=' : (ctype == 'gv' ? '&chl=' :
(ctype.substring(0,1) == 'p' ? '&chd=' :
((ctype + ' ').substring(0,2).substring(0,1) == 'bv'.substring(0,1) ? '&chd=' : (ctype.substring(0,1) == 'l' ? '&chd=' :
(ctype == 'map' ? '&chld=' :
(ctype == 'gom' ? '&chld=' :
(ctype == 'r' ? '&chd=' :
'')))))))));
var tc=(ctype == 'v' ? 't:' : (ctype == 's' ? 't:' : (ctype == 'gv' ? '' :
(ctype.substring(0,1) == 'p' ? 't:' :
((ctype + ' ').substring(0,2).substring(0,1) == 'bv'.substring(0,1) ? 't:' : (ctype.substring(0,1) == 'l' ? 't:' :
(ctype == 'map' ? '' :
(ctype == 'gom' ? 't:' :
(ctype == 'r' ? 't:' :
'')))))))));
var chdl=(ctype == 'v' ? '&chdl=' : (ctype == 's' ? '&chdl=' : (ctype == 'gv' ? '' :
(ctype.substring(0,1) == 'p' ? '&chdl=' :
((ctype + ' ').substring(0,2).substring(0,1) == 'bv'.substring(0,1) ? '&chbh=' : (ctype.substring(0,1) == 'l' ? '&chbh=' :
(ctype == 'map' ? '' :
(ctype == 'gom' ? '&chdl=' :
(ctype == 'r' ? '&chxt=x&chxl=' :
'')))))))));

var prenchtt=(ctype == 'v' ? '100,80,60,30,30,30,10' : (ctype == 's' ? '12,87,75,41,23,96,68,71,34,9|98,60,27,34,56,79,58,74,18,76|84,23,69,81,47,94,60,93,64,54' : (ctype == 'gv' ? 'graph{C_0--H_0[type=s];C_0--H_1[type=s];C_0--H_2[type=s];C_0--C_1[type=s];C_1--H_3[type=s];C_1--H_4[type=s];C_1--H_5[type=s]}' :
(ctype.substring(0,1) == 'p' ? '1,2,3,4' :
((ctype + ' ').substring(0,2).substring(0,1) == 'bv'.substring(0,1) ? '5,5,5|10,10,10|15,15,15' : (ctype.substring(0,1) == 'l' ? '5,45,5|10,60,10|15,85,15' :
(ctype == 'map' ? '' :
(ctype == 'gom' ? '20,40,60' :
(ctype == 'r' ? '10,20,30,40,50' :
'')))))))));
var preachtt=(ctype == 'v' ? 'A|B|C' : (ctype == 's' ? 'Cats|Dogs' : (ctype == 'gv' ? '' :
(ctype.substring(0,1) == 'p' ? 'January|February|March|April' :
((ctype + ' ').substring(0,2).substring(0,1) == 'bv'.substring(0,1) ? '15,4,15' : (ctype.substring(0,1) == 'l' ? '15,4,15' :
(ctype == 'map' ? '' :
(ctype == 'gom' ? 'A|B|C' :
(ctype == 'r' ? '0:|1|2|3|4|5|6' :
'')))))))));
var defchco=(ctype == 'v' ? 'ff0000,00ff00,0000ff' : (ctype == 's' ? 'FF0000|0000FF&chxt=x,y' : (ctype == 'gv' ? '' :
(ctype.substring(0,1) == 'p' ? 'ff0000,00ff00,0000ff,ff00ff' :
((ctype + ' ').substring(0,2).substring(0,1) == 'bv'.substring(0,1) ? '4D89F9,C6D9FD,C6FDD9&chxt=x,y' : (ctype.substring(0,1) == 'l' ? '3D89F9.B6D9FD,B6FDD9&chxt=x,y' :
(ctype == 'map' ? '' :
(ctype == 'gom' ? 'ff0000,00ff00,0000ff' :
(ctype == 'r' ? 'FF0000,FF9900,ff0a00,00ffb0,000cff' :
'')))))))));

var prechtt=(ctype == 'v' ? chdt + prenchtt + chdl + preachtt : (ctype == 's' ? chdt + prenchtt + chdl + preachtt + '&chxt=x,y' : (ctype == 'gv' ? chdt + prenchtt :
(ctype.substring(0,1) == 'p' ? chdt + prenchtt + chdl + preachtt :
((ctype + ' ').substring(0,2).substring(0,1) == 'bv'.substring(0,1) ? chdt + prenchtt + chdl + preachtt : (ctype.substring(0,1) == 'l' ? chdt + prenchtt + chdl + preachtt :
(ctype == 'map' ? '' :
(ctype == 'gom' ? chdt + prenchtt + chdl + preachtt :
(ctype == 'r' ? chdt + prenchtt + chdl + preachtt :
'')))))))));
var promptone=(ctype == 'v' ? "Enter delimited values string for Venn Diagram such that ... " + String.fromCharCode(10) + "The first three values specify the sizes of three circles: A, B, & C. For chart with only two circles, specify zero for the third value." + String.fromCharCode(10) + "The fourth value specifies the size of the intersection of A and B." + String.fromCharCode(10) + "The fifth value specifies the size of the intersection of A and C. For a chart with only two circles, do not specify a value here." + String.fromCharCode(10) + "The sixth value specifies the size of the intersection of B and C. For a chart with only two circles, do not specify a value here." + String.fromCharCode(10) + "The seventh value specifies the size of the common intersection of A, B, and C. For a chart with only two circles, do not specify a value here." + String.fromCharCode(10) + String.fromCharCode(10) + "" : (ctype == 's' ? "Enter delimited values string for Scatter Chart" : (ctype == 'gv' ? "Enter delimited values string for GraphViz Chart" :
(ctype.substring(0,1) == 'p' ? "Enter delimited values string for Pie Chart" :
((ctype + ' ').substring(0,2).substring(0,1) == 'bv'.substring(0,1) ? "Enter v for Vertical or h for Horizontal then one of g for Group or s for Stacked or o for Overlapped Bar Chart look then a space and then enter delimited values string for Bar Chart. Here is a Candlestick and horizontal Bar Chart idea eg. hg 1:20,10,15,25,17,30|0,5,10,7,12,6|35,25,45,47,24,46|15,40,30,27,39,54|70,55,63,59,80,6 Here is a vertical Bar Chart and Box Chart idea vs 1:-1,5,10,7,12,-1|-1,25,30,27,24,-1|-1,40,45,47,39,-1|-1,55,63,59,80,-1|-1,30,40,35,30,-1|-1,-1,5,70,90,-1|-1,-1,-1,80,5,-1&chm=F,FF9900,0,1:4,40|H,0CBF0B,0,1:4,1:20|H,000000,4,1:4,1:40|H,0000FF,3,1:4,1:20|o,FF0000,5,-1,7|o,FF0000,6,-1,7 Prefix just the delimited string you enter by 1: to additionally display Candlestick/Box Charts or by 0: to only display Candlestick/Box Chart" :
(ctype.substring(0,1) == 'l' ? "Enter c for Even or s for Sparklines or xy for Just XY Line Chart look then a space and then enter delimited values string for Line Chart. Here is a Candlestick and Line Chart idea eg. c 1:20,10,15,25,17,30|0,5,10,7,12,6|35,25,45,47,24,46|15,40,30,27,39,54|70,55,63,59,80,6 Here is a Line Chart and Box Chart idea s 1:-1,5,10,7,12,-1|-1,25,30,27,24,-1|-1,40,45,47,39,-1|-1,55,63,59,80,-1|-1,30,40,35,30,-1|-1,-1,5,70,90,-1|-1,-1,-1,80,5,-1&chm=F,FF9900,0,1:4,40|H,0CBF0B,0,1:4,1:20|H,000000,4,1:4,1:40|H,0000FF,3,1:4,1:20|o,FF0000,5,-1,7|o,FF0000,6,-1,7 Prefix just the delimited string you enter by 1: to additionally display Candlestick/Box Charts or by 0: to only display Candlestick/Box Chart" :
(ctype == 'map' ? "" :
(ctype == 'gom' ? "Enter delimited values string for Google-O-Meter Chart" :
(ctype == 'r' ? "Enter delimited values string for Radar Chart but prefix with an s for smooth lines" :
"")))))))));
var oneprompt=(ctype == 'v' ? "Enter delimited values string for your Venn Diagram collaborations, optionally, such that ... " + String.fromCharCode(10) + "The first three values specify the sizes of three circles: A, B, & C. For chart with only two circles, specify zero for the third value." + String.fromCharCode(10) + "The fourth value specifies the size of the intersection of A and B." + String.fromCharCode(10) + "The fifth value specifies the size of the intersection of A and C. For a chart with only two circles, do not specify a value here." + String.fromCharCode(10) + "The sixth value specifies the size of the intersection of B and C. For a chart with only two circles, do not specify a value here." + String.fromCharCode(10) + "The seventh value specifies the size of the common intersection of A, B, and C. For a chart with only two circles, do not specify a value here." + String.fromCharCode(10) + String.fromCharCode(10) + "" : (ctype == 's' ? "Enter delimited values string for Scatter Chart" : (ctype == 'gv' ? "Enter delimited values string for GraphViz Chart" :
(ctype.substring(0,1) == 'p' ? "Enter delimited values string for Pie Chart" :
((ctype + ' ').substring(0,2).substring(0,1) == 'bv'.substring(0,1) ? "Enter g for Grouped or s for Stacked or o for Overlapped Bar Chart look then a space and then enter delimited values string for Bar Chart. Here is a Candlestick and Bar Chart idea eg. g 1:20,10,15,25,17,30|0,5,10,7,12,6|35,25,45,47,24,46|15,40,30,27,39,54|70,55,63,59,80,6 Here is a vertical Bar Chart and Box Chart idea vs 1:-1,5,10,7,12,-1|-1,25,30,27,24,-1|-1,40,45,47,39,-1|-1,55,63,59,80,-1|-1,30,40,35,30,-1|-1,-1,5,70,90,-1|-1,-1,-1,80,5,-1&chm=F,FF9900,0,1:4,40|H,0CBF0B,0,1:4,1:20|H,000000,4,1:4,1:40|H,0000FF,3,1:4,1:20|o,FF0000,5,-1,7|o,FF0000,6,-1,7 Prefix just the delimited string you enter by 1: to additionally display Candlestick/Box Charts or by 0: to only display Candlestick/Box Chart" :
(ctype.substring(0,1) == 'l' ? "Enter c for Even or s for Sparklines or xy for Just XY Line Chart look then a space and then enter delimited values string for Line Chart. Here is a Candlestick and Line Chart idea eg. c 1:20,10,15,25,17,30|0,5,10,7,12,6|35,25,45,47,24,46|15,40,30,27,39,54|70,55,63,59,80,6 Here is a Line Chart and Box Chart idea s 1:-1,5,10,7,12,-1|-1,25,30,27,24,-1|-1,40,45,47,39,-1|-1,55,63,59,80,-1|-1,30,40,35,30,-1|-1,-1,5,70,90,-1|-1,-1,-1,80,5,-1&chm=F,FF9900,0,1:4,40|H,0CBF0B,0,1:4,1:20|H,000000,4,1:4,1:40|H,0000FF,3,1:4,1:20|o,FF0000,5,-1,7|o,FF0000,6,-1,7 Prefix just the delimited string you enter by 1: to additionally display Candlestick/Box Charts or by 0: to only display Candlestick/Box Chart" :
(ctype == 'map' ? "" :
(ctype == 'gom' ? "Enter delimited values string for Google-O-Meter Chart" :
(ctype == 'r' ? "Enter delimited values string for Radar Chart but prefix with an s for smooth lines" :
"")))))))));
var asktwo=(ctype == 'v' ? true : (ctype == 's' ? true : (ctype == 'gv' ? false :
(ctype.substring(0,1) == 'p' ? true :
((ctype + ' ').substring(0,2).substring(0,1) == 'bv'.substring(0,1) ? true : (ctype.substring(0,1) == 'l' ? true :
(ctype == 'map' ? false :
(ctype == 'gom' ? true :
(ctype == 'r' ? true :
false)))))))));

var answersuffix=(ctype.substring(0,1).replace('m','l').replace('b','l').replace('r','l') == 'l' ? '. Please note that optional Dynamic Icons are available via a suffixing string example applied to the second data point such as &chem=y;s=bubble_icon_text_small;d=ski,bb,Wheeee!,FFFFFF;dp=1;ds=0 ' : '');

var twopb=(ctype.substring(0,1) == 'p' ? 'Any optional legend or title argument snippets? Optionally prefix by 3 for 3d Pie Chart or by c for Concentric Pie Chart. Eg. 3' + chdl + preachtt + '&chtt=My%20' + cencodename + '&chco=' + defchco : 'Any optional legend or title argument snippets? Eg. ' + chdl + preachtt + '&chtt=My%20' + cencodename + '&chco=' + defchco);
var beforeanswer=(ctype.substring(0,1) == 'l' ? 'c ' : ((ctype + ' ').substring(0,2).substring(0,1) == 'bv'.substring(0,1) ? 'vg ' : ''));

var emsmlist='';

… further to yesterday’s Google Chart Image Chart Broadcast Talk Commentary Tutorial in the changed latest draft image_venn.html Google Chart Image Chart Venn Chart or Scatter Chart or GraphViz Chart or Pie Chart or Line Chart or Bar Chart or Candlestick/Box Chart or Google-O-Meter Chart or Radar Chart or Map Chart interfacing web application you can also try below.


Previous relevant Google Chart Image Chart Broadcast Talk Commentary Tutorial is shown below.

Google Chart Image Chart Broadcast Talk Commentary Tutorial

Google Chart Image Chart Broadcast Talk Commentary Tutorial

We’ll leave yesterday’s Google Chart Image Chart Radar Chart Tutorial angled text predilections for now, given we’ve got until Tuesday until tswhtf so to speak. Let’s today remedy the concern we had when we presented Google Chart Image Chart Broadcast Talk Context Tutorial regarding, the at the time new, “Broadcast Talk”, concept …

… even though it is only visual by nature, presented as an update image still presented and updated periodically. Go figure?!

… and offer a way to help the “Broadcast Talk” demonstrator “speak” during their demonstration, effectively. In so doing, we are going to add to …

  • the demonstrator’s visual inputs coming from that canvas annotator helper … with, today …
  • the demonstrator’s commentary, collected via an HTML textarea element (to optionally supplement the visuals) from that canvas annotator helper’s originator window (ie. the Google Charts Image Chart interfacing supervisor) … presented …

… via a new “middle of three slide” …

<?php

$uwidth=trim($uparts[$ioff - 2 + sizeof($uparts)]);
$uheight=trim(explode('#',explode('?',$uparts[$ioff - 1 + sizeof($uparts)])[0])[0]);
if (isset($_GET['canvcont']) && isset($_GET['uniquifier'])) {
$uniquifier=str_replace('+',' ',urldecode($_GET['uniquifier']));
if (file_exists($_SERVER['DOCUMENT_ROOT'] . DIRECTORY_SEPARATOR . "presentation__" . $uniquifier . ".png")) {
$im = imagecreatefromstring(file_get_contents($_SERVER['DOCUMENT_ROOT'] . DIRECTORY_SEPARATOR . "presentation__" . $uniquifier . ".png"));
$white = imagecolorallocate($im, 255, 255, 255);
$black = imagecolorallocate($im, 1, 1, 1);
imagefilledrectangle($im, 0, 0, $uwidth, $uheight, $white);
imagesavealpha($im, TRUE);
try {
if (function_exists('imagettftext')) {
imagettftext($im, 12, 0, 20, 20, $black, realpath('arial.ttf'), str_replace('+',' ',urldecode($_GET['canvcont'])));
}
} catch (Exception $e) { }

imagepng($im, $_SERVER['DOCUMENT_ROOT'] . DIRECTORY_SEPARATOR . "presentation__" . $uniquifier . ".png");
imagedestroy($im);
exit;
}
exit;
}


?>

… animated GIF (PHP 404.php helping) means of display in the viewer windows (off email invitation links they receive via the demonstrator) in the changed


function askaway() {
var waspis=prefixandon, nl='', newwaspis='';
if (document.getElementById('bcommentary')) {
if (document.getElementById('bcommentary').value.trim() != '') {
if (document.getElementById('bcommentary').value.trim().indexOf(String.fromCharCode(10)) == -1) {
nl=String.fromCharCode(10);
}
eightthousand=24000;
if ((' ' + document.getElementById('bcommentary').value.trim()).slice(-3) != '...' && (' ' + prefixandon.trim()).slice(-3) != '...' && (document.getElementById('bcommentary').value.trim() + ' ').substring(0,3) != '...') {
prefixandon='';
lastval='';
} else if ((document.getElementById('bcommentary').value.trim() + ' ').substring(0,3) == '...') {
if (waspis.indexOf(lastval.trim()) == -1) {
prefixandon=String.fromCharCode(10) + lastval.trim().replace(/\.\.\.NoWayJosE$/g, ' ' + nl + ('' + (new Date())) + ' ... ') + waspis;
newwaspis=prefixandon;
}
}
if ((' ' + document.getElementById('bcommentary').value.trim()).slice(-3) == '...') {
document.getElementById('ifco').src='//www.rjmprogramming.com.au/ITblog/' + Math.min(550,window.innerWidth) + '/' + Math.min(350,window.innerHeight) + '/?uniquifier=' + encodeURIComponent(document.getElementById('uniquifier').value) + '&canvcont=' + encodeURIComponent(document.getElementById('bcommentary').value.trim().replace(/\.\.\.$/g, ' ' + nl + ('' + (new Date())) + ' ... ' + String.fromCharCode(10) + String.fromCharCode(10) + prefixandon));
} else {
document.getElementById('ifco').src='//www.rjmprogramming.com.au/ITblog/' + Math.min(550,window.innerWidth) + '/' + Math.min(350,window.innerHeight) + '/?uniquifier=' + encodeURIComponent(document.getElementById('uniquifier').value) + '&canvcont=' + encodeURIComponent(document.getElementById('bcommentary').value + String.fromCharCode(10) + String.fromCharCode(10) + prefixandon);
}
document.getElementById('bcommentary').title=document.getElementById('bcommentary').value;
if ((document.getElementById('bcommentary').value.trim() + ' ').substring(0,3) == '...') {
if (newwaspis != '') { waspis=newwaspis; }
if (waspis.indexOf(document.getElementById('bcommentary').value.trim()) == -1) {
prefixandon=String.fromCharCode(10) + document.getElementById('bcommentary').value.trim().replace(/\.\.\.$/g, ' ' + nl + ('' + (new Date())) + ' ... ') + waspis;
}
}
lastval=document.getElementById('bcommentary').value;
document.getElementById('bcommentary').value='';
setTimeout(function(){ document.getElementById('subcc').click(); }, 2000);
}
}
}

function newfunction() {
if (document.getElementById('bshare')) {
document.getElementById('sbshare').innerHTML='<iframe id=ifco style=display:none; src=></iframe><br><br><textarea rows=2 cols=80 id=bcommentary placeholder="Commentary to Viewers can go here ... start with or end with ... for ongoing ..." onblur="askaway(this);" value=""></textarea><br><br>';
}
}

latest draft image_venn.html Google Chart Image Chart Venn Chart or Scatter Chart or GraphViz Chart or Pie Chart or Line Chart or Bar Chart or Candlestick/Box Chart or Google-O-Meter Chart or Radar Chart or Map Chart interfacing web application you can also try below.


Previous relevant Google Chart Image Chart Radar Chart Tutorial is shown below.

Google Chart Image Chart Radar Chart Tutorial

Google Chart Image Chart Radar Chart Tutorial

Onto yesterday’s Google Chart Image Chart Box Chart Tutorial, today we have a two part stepping forward via new …

Why the trepidation? Well, so far, when the text is angled we can’t understand what results we are getting back from a call to [element].getBoundingClientRect() just yet.

Why is this needed? Again, with the questions! Well, Mr De Niro, you see, well, somebody might want to go onto that more complex annotating.

And why would they do that? Sheesh. Well, Mr De Niro, sir, you see, sometimes things happen in life, and well, fingers slip on keyboards, and mice get awfullllly nervous around screens these days.

Yeh, well, show us the money, wiseguy. Who’s is that question? And what’s with the questions? Well, you see, Mr De Niro, the money is if we can get PHP text placement for text at an angle, where it rotates from the middle of the text, to get a similar positioning to good ol’ … pardon, Mr De Niro … good and well respected Javascript transform rotations … not with a triple pike, Mr De Niro, but you’re awfulllllly close, Mr De Niro, sir … rather, we throw in a couple of translations … no, not Latin, Mr De Niro … of co-ordinates, Mr De Niro.

And that will bring in how much by next Tuesday? Back to the questions? Why so many questions? We think it’s a pretty big money spinner, Mr De Niro, sir, and we think you should come back next Tuesday, and we can show you the ropes. Sweat, oozing from the brow, as Mr De Niro exits stage left.

And just while we have a few minutes, here’s the updated Javascript parameterization …


var dtextis='dtext';
var pretherest='';
var newtherest='';
var tmod='';
var colchange='';
var cht=location.search.split('cht=')[1] ? decodeURIComponent(location.search.split('cht=')[1].split('&')[0]) : "v";
if ((cht + ' ').substring(0,1) == 'p' && cht != 'p') { pretherest=cht.substring(1); }
//if ((cht + ' ').substring(0,2) == 'bv' && cht != 'bv') { pretherest=cht.substring(2); if (1 == 1) { cht='bv'; } }
if ((cht + ' ').substring(0,1) == 'bv'.substring(0,1) && cht != 'bv'.substring(0,1)) { pretherest=cht.substring(1); if (1 == 1) { cht='bv'.substring(0,1); } }
if ((cht + ' ').substring(0,1) == 'l' && cht != 'l') { pretherest=cht.substring(1); if (1 == 1) { cht='l'; } }
if ((cht + ' ').substring(0,1) == 'r' && cht != 'r') { pretherest=cht.substring(1); if (1 == 1) { cht='r'; } }
var ccode=location.search.split('chld=')[1] ? decodeURIComponent(location.search.split('chld=')[1].split('&')[0]) : "";
var ctype=location.search.split('type=')[1] ? decodeURIComponent(location.search.split('type=')[1].split('&')[0]) : cht;
var cname=(ctype == 'v' ? 'Venn Chart' : (ctype == 's' ? 'Scatter Chart' : (ctype == 'gv' ? 'GraphViz Chart' :
(ctype.substring(0,1) == 'p' ? 'Pie Chart' :
((ctype + ' ').substring(0,2).substring(0,1) == 'bv'.substring(0,1) ? 'Bar Chart' : (ctype.substring(0,1) == 'l' ? 'Line Chart' :
(ctype == 'map' ? 'Map Chart' :
(ctype == 'gom' ? 'Google-O-Meter Chart' :
(ctype == 'r' ? 'Radar Chart' :
'')))))))));
var cencodename=(ctype == 'v' ? 'Venn%20Diagram' : (ctype == 's' ? 'Scatter%20Chart' : (ctype == 'gv' ? 'GraphViz%20Chart' :
(ctype.substring(0,1) == 'p' ? 'Pie%20Chart' :
((ctype + ' ').substring(0,2).substring(0,1) == 'bv'.substring(0,1) ? 'Bar%20Chart' : (ctype.substring(0,1) == 'l' ? 'Line%20Chart' :
(ctype == 'map' ? 'Map%20Chart' :
(ctype == 'gom' ? 'Google-O-Meter%20Chart' :
(ctype == 'r' ? 'Radar%20Chart' :
'')))))))));
var chdt=(ctype == 'v' ? '&chd=t:' : (ctype == 's' ? '&chd=t:' : (ctype == 'gv' ? '&chl=' :
(ctype.substring(0,1) == 'p' ? pretherest + '&chd=t:' :
((ctype + ' ').substring(0,2).substring(0,1) == 'bv'.substring(0,1) ? '&chd=t:' : (ctype.substring(0,1) == 'l' ? '&chd=t:' :
(ctype == 'map' ? '' :
(ctype == 'gom' ? '&chd=t:' :
(ctype == 'r' ? pretherest + '&chd=t:' :
'')))))))));
var chdeq=(ctype == 'v' ? '&chd=' : (ctype == 's' ? '&chd=' : (ctype == 'gv' ? '&chl=' :
(ctype.substring(0,1) == 'p' ? '&chd=' :
((ctype + ' ').substring(0,2).substring(0,1) == 'bv'.substring(0,1) ? '&chd=' : (ctype.substring(0,1) == 'l' ? '&chd=' :
(ctype == 'map' ? '&chld=' :
(ctype == 'gom' ? '&chld=' :
(ctype == 'r' ? '&chd=' :
'')))))))));
var tc=(ctype == 'v' ? 't:' : (ctype == 's' ? 't:' : (ctype == 'gv' ? '' :
(ctype.substring(0,1) == 'p' ? 't:' :
((ctype + ' ').substring(0,2).substring(0,1) == 'bv'.substring(0,1) ? 't:' : (ctype.substring(0,1) == 'l' ? 't:' :
(ctype == 'map' ? '' :
(ctype == 'gom' ? 't:' :
(ctype == 'r' ? 't:' :
'')))))))));
var chdl=(ctype == 'v' ? '&chdl=' : (ctype == 's' ? '&chdl=' : (ctype == 'gv' ? '' :
(ctype.substring(0,1) == 'p' ? '&chdl=' :
((ctype + ' ').substring(0,2).substring(0,1) == 'bv'.substring(0,1) ? '&chbh=' : (ctype.substring(0,1) == 'l' ? '&chbh=' :
(ctype == 'map' ? '' :
(ctype == 'gom' ? '&chdl=' :
(ctype == 'r' ? '&chxt=x&chxl=' :
'')))))))));

var prenchtt=(ctype == 'v' ? '100,80,60,30,30,30,10' : (ctype == 's' ? '12,87,75,41,23,96,68,71,34,9|98,60,27,34,56,79,58,74,18,76|84,23,69,81,47,94,60,93,64,54' : (ctype == 'gv' ? 'graph{C_0--H_0[type=s];C_0--H_1[type=s];C_0--H_2[type=s];C_0--C_1[type=s];C_1--H_3[type=s];C_1--H_4[type=s];C_1--H_5[type=s]}' :
(ctype.substring(0,1) == 'p' ? '1,2,3,4' :
((ctype + ' ').substring(0,2).substring(0,1) == 'bv'.substring(0,1) ? '5,5,5|10,10,10|15,15,15' : (ctype.substring(0,1) == 'l' ? '5,45,5|10,60,10|15,85,15' :
(ctype == 'map' ? '' :
(ctype == 'gom' ? '20,40,60' :
(ctype == 'r' ? '10,20,30,40,50' :
'')))))))));
var preachtt=(ctype == 'v' ? 'A|B|C' : (ctype == 's' ? 'Cats|Dogs' : (ctype == 'gv' ? '' :
(ctype.substring(0,1) == 'p' ? 'January|February|March|April' :
((ctype + ' ').substring(0,2).substring(0,1) == 'bv'.substring(0,1) ? '15,4,15' : (ctype.substring(0,1) == 'l' ? '15,4,15' :
(ctype == 'map' ? '' :
(ctype == 'gom' ? 'A|B|C' :
(ctype == 'r' ? '0:|1|2|3|4|5|6' :
'')))))))));
var defchco=(ctype == 'v' ? 'ff0000,00ff00,0000ff' : (ctype == 's' ? 'FF0000|0000FF&chxt=x,y' : (ctype == 'gv' ? '' :
(ctype.substring(0,1) == 'p' ? 'ff0000,00ff00,0000ff,ff00ff' :
((ctype + ' ').substring(0,2).substring(0,1) == 'bv'.substring(0,1) ? '4D89F9,C6D9FD,C6FDD9&chxt=x,y' : (ctype.substring(0,1) == 'l' ? '3D89F9.B6D9FD,B6FDD9&chxt=x,y' :
(ctype == 'map' ? '' :
(ctype == 'gom' ? 'ff0000,00ff00,0000ff' :
(ctype == 'r' ? 'FF0000,FF9900,ff0a00,00ffb0,000cff' :
'')))))))));

var prechtt=(ctype == 'v' ? chdt + prenchtt + chdl + preachtt : (ctype == 's' ? chdt + prenchtt + chdl + preachtt + '&chxt=x,y' : (ctype == 'gv' ? chdt + prenchtt :
(ctype.substring(0,1) == 'p' ? chdt + prenchtt + chdl + preachtt :
((ctype + ' ').substring(0,2).substring(0,1) == 'bv'.substring(0,1) ? chdt + prenchtt + chdl + preachtt : (ctype.substring(0,1) == 'l' ? chdt + prenchtt + chdl + preachtt :
(ctype == 'map' ? '' :
(ctype == 'gom' ? chdt + prenchtt + chdl + preachtt :
(ctype == 'r' ? chdt + prenchtt + chdl + preachtt :
'')))))))));
var promptone=(ctype == 'v' ? "Enter delimited values string for Venn Diagram such that ... " + String.fromCharCode(10) + "The first three values specify the sizes of three circles: A, B, & C. For chart with only two circles, specify zero for the third value." + String.fromCharCode(10) + "The fourth value specifies the size of the intersection of A and B." + String.fromCharCode(10) + "The fifth value specifies the size of the intersection of A and C. For a chart with only two circles, do not specify a value here." + String.fromCharCode(10) + "The sixth value specifies the size of the intersection of B and C. For a chart with only two circles, do not specify a value here." + String.fromCharCode(10) + "The seventh value specifies the size of the common intersection of A, B, and C. For a chart with only two circles, do not specify a value here." + String.fromCharCode(10) + String.fromCharCode(10) + "" : (ctype == 's' ? "Enter delimited values string for Scatter Chart" : (ctype == 'gv' ? "Enter delimited values string for GraphViz Chart" :
(ctype.substring(0,1) == 'p' ? "Enter delimited values string for Pie Chart" :
((ctype + ' ').substring(0,2).substring(0,1) == 'bv'.substring(0,1) ? "Enter v for Vertical or h for Horizontal then one of g for Group or s for Stacked or o for Overlapped Bar Chart look then a space and then enter delimited values string for Bar Chart. Here is a Candlestick and horizontal Bar Chart idea eg. hg 1:20,10,15,25,17,30|0,5,10,7,12,6|35,25,45,47,24,46|15,40,30,27,39,54|70,55,63,59,80,6 Here is a vertical Bar Chart and Box Chart idea vs 1:-1,5,10,7,12,-1|-1,25,30,27,24,-1|-1,40,45,47,39,-1|-1,55,63,59,80,-1|-1,30,40,35,30,-1|-1,-1,5,70,90,-1|-1,-1,-1,80,5,-1&chm=F,FF9900,0,1:4,40|H,0CBF0B,0,1:4,1:20|H,000000,4,1:4,1:40|H,0000FF,3,1:4,1:20|o,FF0000,5,-1,7|o,FF0000,6,-1,7 Prefix just the delimited string you enter by 1: to additionally display Candlestick/Box Charts or by 0: to only display Candlestick/Box Chart" :
(ctype.substring(0,1) == 'l' ? "Enter c for Even or s for Sparklines or xy for Just XY Line Chart look then a space and then enter delimited values string for Line Chart. Here is a Candlestick and Line Chart idea eg. c 1:20,10,15,25,17,30|0,5,10,7,12,6|35,25,45,47,24,46|15,40,30,27,39,54|70,55,63,59,80,6 Here is a Line Chart and Box Chart idea s 1:-1,5,10,7,12,-1|-1,25,30,27,24,-1|-1,40,45,47,39,-1|-1,55,63,59,80,-1|-1,30,40,35,30,-1|-1,-1,5,70,90,-1|-1,-1,-1,80,5,-1&chm=F,FF9900,0,1:4,40|H,0CBF0B,0,1:4,1:20|H,000000,4,1:4,1:40|H,0000FF,3,1:4,1:20|o,FF0000,5,-1,7|o,FF0000,6,-1,7 Prefix just the delimited string you enter by 1: to additionally display Candlestick/Box Charts or by 0: to only display Candlestick/Box Chart" :
(ctype == 'map' ? "" :
(ctype == 'gom' ? "Enter delimited values string for Google-O-Meter Chart" :
(ctype == 'r' ? "Enter delimited values string for Radar Chart but prefix with an s for smooth lines" :
"")))))))));
var oneprompt=(ctype == 'v' ? "Enter delimited values string for your Venn Diagram collaborations, optionally, such that ... " + String.fromCharCode(10) + "The first three values specify the sizes of three circles: A, B, & C. For chart with only two circles, specify zero for the third value." + String.fromCharCode(10) + "The fourth value specifies the size of the intersection of A and B." + String.fromCharCode(10) + "The fifth value specifies the size of the intersection of A and C. For a chart with only two circles, do not specify a value here." + String.fromCharCode(10) + "The sixth value specifies the size of the intersection of B and C. For a chart with only two circles, do not specify a value here." + String.fromCharCode(10) + "The seventh value specifies the size of the common intersection of A, B, and C. For a chart with only two circles, do not specify a value here." + String.fromCharCode(10) + String.fromCharCode(10) + "" : (ctype == 's' ? "Enter delimited values string for Scatter Chart" : (ctype == 'gv' ? "Enter delimited values string for GraphViz Chart" :
(ctype.substring(0,1) == 'p' ? "Enter delimited values string for Pie Chart" :
((ctype + ' ').substring(0,2).substring(0,1) == 'bv'.substring(0,1) ? "Enter g for Grouped or s for Stacked or o for Overlapped Bar Chart look then a space and then enter delimited values string for Bar Chart. Here is a Candlestick and Bar Chart idea eg. g 1:20,10,15,25,17,30|0,5,10,7,12,6|35,25,45,47,24,46|15,40,30,27,39,54|70,55,63,59,80,6 Here is a vertical Bar Chart and Box Chart idea vs 1:-1,5,10,7,12,-1|-1,25,30,27,24,-1|-1,40,45,47,39,-1|-1,55,63,59,80,-1|-1,30,40,35,30,-1|-1,-1,5,70,90,-1|-1,-1,-1,80,5,-1&chm=F,FF9900,0,1:4,40|H,0CBF0B,0,1:4,1:20|H,000000,4,1:4,1:40|H,0000FF,3,1:4,1:20|o,FF0000,5,-1,7|o,FF0000,6,-1,7 Prefix just the delimited string you enter by 1: to additionally display Candlestick/Box Charts or by 0: to only display Candlestick/Box Chart" :
(ctype.substring(0,1) == 'l' ? "Enter c for Even or s for Sparklines or xy for Just XY Line Chart look then a space and then enter delimited values string for Line Chart. Here is a Candlestick and Line Chart idea eg. c 1:20,10,15,25,17,30|0,5,10,7,12,6|35,25,45,47,24,46|15,40,30,27,39,54|70,55,63,59,80,6 Here is a Line Chart and Box Chart idea s 1:-1,5,10,7,12,-1|-1,25,30,27,24,-1|-1,40,45,47,39,-1|-1,55,63,59,80,-1|-1,30,40,35,30,-1|-1,-1,5,70,90,-1|-1,-1,-1,80,5,-1&chm=F,FF9900,0,1:4,40|H,0CBF0B,0,1:4,1:20|H,000000,4,1:4,1:40|H,0000FF,3,1:4,1:20|o,FF0000,5,-1,7|o,FF0000,6,-1,7 Prefix just the delimited string you enter by 1: to additionally display Candlestick/Box Charts or by 0: to only display Candlestick/Box Chart" :
(ctype == 'map' ? "" :
(ctype == 'gom' ? "Enter delimited values string for Google-O-Meter Chart" :
(ctype == 'r' ? "Enter delimited values string for Radar Chart but prefix with an s for smooth lines" :
"")))))))));
var asktwo=(ctype == 'v' ? true : (ctype == 's' ? true : (ctype == 'gv' ? false :
(ctype.substring(0,1) == 'p' ? true :
((ctype + ' ').substring(0,2).substring(0,1) == 'bv'.substring(0,1) ? true : (ctype.substring(0,1) == 'l' ? true :
(ctype == 'map' ? false :
(ctype == 'gom' ? true :
(ctype == 'r' ? true :
false)))))))));

var twopb=(ctype.substring(0,1) == 'p' ? 'Any optional legend or title argument snippets? Optionally prefix by 3 for 3d Pie Chart or by c for Concentric Pie Chart. Eg. 3' + chdl + preachtt + '&chtt=My%20' + cencodename + '&chco=' + defchco : 'Any optional legend or title argument snippets? Eg. ' + chdl + preachtt + '&chtt=My%20' + cencodename + '&chco=' + defchco);
var beforeanswer=(ctype.substring(0,1) == 'l' ? 'c ' : ((ctype + ' ').substring(0,2).substring(0,1) == 'bv'.substring(0,1) ? 'vg ' : ''));


var emsmlist='';

… that goes into helping make the changed latest draft image_venn.html Google Chart Image Chart Venn Chart or Scatter Chart or GraphViz Chart or Pie Chart or Line Chart or Bar Chart or Candlestick/Box Chart or Google-O-Meter Chart or Radar Chart or Map Chart interfacing web application you can also try below, have regular sleepovers on cloud nine.

Did you know?

Did you notice the inclusion of CSS styling …

<style>

#fsangle { background-image: url("data:image/svg+xml;utf8,<svg xmlns='http://www.w3.org/2000/svg' width='24' height='24' viewport='0 0 100 100' style='font-family:Verdana;font-size:10px;'><text y='50%'> \00B0</text></svg>"); background-repeat: no-repeat; background-position: center right; }

</style>

? It styles an input type=number textbox where a placeholder is not really an option to explain a textbox’s purpose, and we do dislike set aside labels, these days. It’s also a way to explain the textbox for mobile users who do not get a hovering message to help. It’s also got an internationalization feel to it, using the degree sign emoji ° (ie. &#176; or that \u0080 UTF-16 Encoding style of definition suitable for CSS styling usage) to both associate the units we’d want, as well as that we are asking for an angle. Clockwise or anticlockwise, alas, comes down to user experience!


Previous relevant Google Chart Image Chart Box Chart Tutorial is shown below.

Google Chart Image Chart Box Chart Tutorial

Google Chart Image Chart Box Chart Tutorial

Today we offer new …

… interfacings, onto the progress up to yesterday’s Google Chart Image Chart Colour Tutorial.

As such, it’s probably timely to update you with the parameterization up the top of the Javascript code …


var pretherest='';
var newtherest='';
var tmod='';
var colchange='';
var cht=location.search.split('cht=')[1] ? decodeURIComponent(location.search.split('cht=')[1].split('&')[0]) : "v";
if ((cht + ' ').substring(0,1) == 'p' && cht != 'p') { pretherest=cht.substring(1); }
//if ((cht + ' ').substring(0,2) == 'bv' && cht != 'bv') { pretherest=cht.substring(2); if (1 == 1) { cht='bv'; } }
if ((cht + ' ').substring(0,1) == 'bv'.substring(0,1) && cht != 'bv'.substring(0,1)) { pretherest=cht.substring(1); if (1 == 1) { cht='bv'.substring(0,1); } }
if ((cht + ' ').substring(0,1) == 'l' && cht != 'l') { pretherest=cht.substring(1); if (1 == 1) { cht='l'; } }
var ccode=location.search.split('chld=')[1] ? decodeURIComponent(location.search.split('chld=')[1].split('&')[0]) : "";
var ctype=location.search.split('type=')[1] ? decodeURIComponent(location.search.split('type=')[1].split('&')[0]) : cht;
var cname=(ctype == 'v' ? 'Venn Chart' : (ctype == 's' ? 'Scatter Chart' : (ctype == 'gv' ? 'GraphViz Chart' :
(ctype.substring(0,1) == 'p' ? 'Pie Chart' :
((ctype + ' ').substring(0,2).substring(0,1) == 'bv'.substring(0,1) ? 'Bar Chart' : (ctype.substring(0,1) == 'l' ? 'Line Chart' :
(ctype == 'map' ? 'Map Chart' :
(ctype == 'gom' ? 'Google-O-Meter Chart' :
''))))))));
var cencodename=(ctype == 'v' ? 'Venn%20Diagram' : (ctype == 's' ? 'Scatter%20Chart' : (ctype == 'gv' ? 'GraphViz%20Chart' :
(ctype.substring(0,1) == 'p' ? 'Pie%20Chart' :
((ctype + ' ').substring(0,2).substring(0,1) == 'bv'.substring(0,1) ? 'Bar%20Chart' : (ctype.substring(0,1) == 'l' ? 'Line%20Chart' :
(ctype == 'map' ? 'Map%20Chart' :
(ctype == 'gom' ? 'Google-O-Meter%20Chart' :
''))))))));
var chdt=(ctype == 'v' ? '&chd=t:' : (ctype == 's' ? '&chd=t:' : (ctype == 'gv' ? '&chl=' :
(ctype.substring(0,1) == 'p' ? pretherest + '&chd=t:' :
((ctype + ' ').substring(0,2).substring(0,1) == 'bv'.substring(0,1) ? '&chd=t:' : (ctype.substring(0,1) == 'l' ? '&chd=t:' :
(ctype == 'map' ? '' :
(ctype == 'gom' ? '&chd=t:' :
''))))))));
var chdeq=(ctype == 'v' ? '&chd=' : (ctype == 's' ? '&chd=' : (ctype == 'gv' ? '&chl=' :
(ctype.substring(0,1) == 'p' ? '&chd=' :
((ctype + ' ').substring(0,2).substring(0,1) == 'bv'.substring(0,1) ? '&chd=' : (ctype.substring(0,1) == 'l' ? '&chd=' :
(ctype == 'map' ? '&chld=' :
(ctype == 'gom' ? '&chdl=' :
''))))))));
var tc=(ctype == 'v' ? 't:' : (ctype == 's' ? 't:' : (ctype == 'gv' ? '' :
(ctype.substring(0,1) == 'p' ? 't:' :
((ctype + ' ').substring(0,2).substring(0,1) == 'bv'.substring(0,1) ? 't:' : (ctype.substring(0,1) == 'l' ? 't:' :
(ctype == 'map' ? '' :
(ctype == 'gom' ? 't:' :
''))))))));
var chdl=(ctype == 'v' ? '&chdl=' : (ctype == 's' ? '&chdl=' : (ctype == 'gv' ? '' :
(ctype.substring(0,1) == 'p' ? '&chdl=' :
((ctype + ' ').substring(0,2).substring(0,1) == 'bv'.substring(0,1) ? '&chbh=' : (ctype.substring(0,1) == 'l' ? '&chbh=' :
(ctype == 'map' ? '' :
(ctype == 'gom' ? '&chdl=' :
''))))))));

var prenchtt=(ctype == 'v' ? '100,80,60,30,30,30,10' : (ctype == 's' ? '12,87,75,41,23,96,68,71,34,9|98,60,27,34,56,79,58,74,18,76|84,23,69,81,47,94,60,93,64,54' : (ctype == 'gv' ? 'graph{C_0--H_0[type=s];C_0--H_1[type=s];C_0--H_2[type=s];C_0--C_1[type=s];C_1--H_3[type=s];C_1--H_4[type=s];C_1--H_5[type=s]}' :
(ctype.substring(0,1) == 'p' ? '1,2,3,4' :
((ctype + ' ').substring(0,2).substring(0,1) == 'bv'.substring(0,1) ? '5,5,5|10,10,10|15,15,15' : (ctype.substring(0,1) == 'l' ? '5,45,5|10,60,10|15,85,15' :
(ctype == 'map' ? '' :
(ctype == 'gom' ? '20,40,60' :
''))))))));
var preachtt=(ctype == 'v' ? 'A|B|C' : (ctype == 's' ? 'Cats|Dogs' : (ctype == 'gv' ? '' :
(ctype.substring(0,1) == 'p' ? 'January|February|March|April' :
((ctype + ' ').substring(0,2).substring(0,1) == 'bv'.substring(0,1) ? '15,4,15' : (ctype.substring(0,1) == 'l' ? '15,4,15' :
(ctype == 'map' ? '' :
(ctype == 'gom' ? 'A|B|C' :
''))))))));
var defchco=(ctype == 'v' ? 'ff0000,00ff00,0000ff' : (ctype == 's' ? 'FF0000|0000FF&chxt=x,y' : (ctype == 'gv' ? '' :
(ctype.substring(0,1) == 'p' ? 'ff0000,00ff00,0000ff,ff00ff' :
((ctype + ' ').substring(0,2).substring(0,1) == 'bv'.substring(0,1) ? '4D89F9,C6D9FD,C6FDD9&chxt=x,y' : (ctype.substring(0,1) == 'l' ? '3D89F9.B6D9FD,B6FDD9&chxt=x,y' :
(ctype == 'map' ? '' :
(ctype == 'gom' ? 'ff0000,00ff00,0000ff' :
''))))))));

var prechtt=(ctype == 'v' ? chdt + prenchtt + chdl + preachtt : (ctype == 's' ? chdt + prenchtt + chdl + preachtt + '&chxt=x,y' : (ctype == 'gv' ? chdt + prenchtt :
(ctype.substring(0,1) == 'p' ? chdt + prenchtt + chdl + preachtt :
((ctype + ' ').substring(0,2).substring(0,1) == 'bv'.substring(0,1) ? chdt + prenchtt + chdl + preachtt : (ctype.substring(0,1) == 'l' ? chdt + prenchtt + chdl + preachtt :
(ctype == 'map' ? '' :
(ctype == 'gom' ? chdt + prenchtt + chdl + preachtt :
''))))))));
var promptone=(ctype == 'v' ? "Enter delimited values string for Venn Diagram such that ... " + String.fromCharCode(10) + "The first three values specify the sizes of three circles: A, B, & C. For chart with only two circles, specify zero for the third value." + String.fromCharCode(10) + "The fourth value specifies the size of the intersection of A and B." + String.fromCharCode(10) + "The fifth value specifies the size of the intersection of A and C. For a chart with only two circles, do not specify a value here." + String.fromCharCode(10) + "The sixth value specifies the size of the intersection of B and C. For a chart with only two circles, do not specify a value here." + String.fromCharCode(10) + "The seventh value specifies the size of the common intersection of A, B, and C. For a chart with only two circles, do not specify a value here." + String.fromCharCode(10) + String.fromCharCode(10) + "" : (ctype == 's' ? "Enter delimited values string for Scatter Chart" : (ctype == 'gv' ? "Enter delimited values string for GraphViz Chart" :
(ctype.substring(0,1) == 'p' ? "Enter delimited values string for Pie Chart" :
((ctype + ' ').substring(0,2).substring(0,1) == 'bv'.substring(0,1) ? "Enter v for Vertical or h for Horizontal then one of g for Group or s for Stacked or o for Overlapped Bar Chart look then a space and then enter delimited values string for Bar Chart. Here is a Candlestick and horizontal Bar Chart idea eg. hg 1:20,10,15,25,17,30|0,5,10,7,12,6|35,25,45,47,24,46|15,40,30,27,39,54|70,55,63,59,80,6 Here is a vertical Bar Chart and Box Chart idea vs 1:-1,5,10,7,12,-1|-1,25,30,27,24,-1|-1,40,45,47,39,-1|-1,55,63,59,80,-1|-1,30,40,35,30,-1|-1,-1,5,70,90,-1|-1,-1,-1,80,5,-1&chm=F,FF9900,0,1:4,40|H,0CBF0B,0,1:4,1:20|H,000000,4,1:4,1:40|H,0000FF,3,1:4,1:20|o,FF0000,5,-1,7|o,FF0000,6,-1,7 Prefix just the delimited string you enter by 1: to additionally display Candlestick/Box Charts or by 0: to only display Candlestick/Box Chart" :
(ctype.substring(0,1) == 'l' ? "Enter c for Even or s for Sparklines or xy for Just XY Line Chart look then a space and then enter delimited values string for Line Chart. Here is a Candlestick and Line Chart idea eg. c 1:20,10,15,25,17,30|0,5,10,7,12,6|35,25,45,47,24,46|15,40,30,27,39,54|70,55,63,59,80,6 Here is a Line Chart and Box Chart idea s 1:-1,5,10,7,12,-1|-1,25,30,27,24,-1|-1,40,45,47,39,-1|-1,55,63,59,80,-1|-1,30,40,35,30,-1|-1,-1,5,70,90,-1|-1,-1,-1,80,5,-1&chm=F,FF9900,0,1:4,40|H,0CBF0B,0,1:4,1:20|H,000000,4,1:4,1:40|H,0000FF,3,1:4,1:20|o,FF0000,5,-1,7|o,FF0000,6,-1,7 Prefix just the delimited string you enter by 1: to additionally display Candlestick/Box Charts or by 0: to only display Candlestick/Box Chart" :
(ctype == 'map' ? "" :
(ctype == 'gom' ? "Enter delimited values string for Google-O-Meter Chart" :
""))))))));
var oneprompt=(ctype == 'v' ? "Enter delimited values string for your Venn Diagram collaborations, optionally, such that ... " + String.fromCharCode(10) + "The first three values specify the sizes of three circles: A, B, & C. For chart with only two circles, specify zero for the third value." + String.fromCharCode(10) + "The fourth value specifies the size of the intersection of A and B." + String.fromCharCode(10) + "The fifth value specifies the size of the intersection of A and C. For a chart with only two circles, do not specify a value here." + String.fromCharCode(10) + "The sixth value specifies the size of the intersection of B and C. For a chart with only two circles, do not specify a value here." + String.fromCharCode(10) + "The seventh value specifies the size of the common intersection of A, B, and C. For a chart with only two circles, do not specify a value here." + String.fromCharCode(10) + String.fromCharCode(10) + "" : (ctype == 's' ? "Enter delimited values string for Scatter Chart" : (ctype == 'gv' ? "Enter delimited values string for GraphViz Chart" :
(ctype.substring(0,1) == 'p' ? "Enter delimited values string for Pie Chart" :
((ctype + ' ').substring(0,2).substring(0,1) == 'bv'.substring(0,1) ? "Enter g for Grouped or s for Stacked or o for Overlapped Bar Chart look then a space and then enter delimited values string for Bar Chart. Here is a Candlestick and Bar Chart idea eg. g 1:20,10,15,25,17,30|0,5,10,7,12,6|35,25,45,47,24,46|15,40,30,27,39,54|70,55,63,59,80,6 Here is a vertical Bar Chart and Box Chart idea vs 1:-1,5,10,7,12,-1|-1,25,30,27,24,-1|-1,40,45,47,39,-1|-1,55,63,59,80,-1|-1,30,40,35,30,-1|-1,-1,5,70,90,-1|-1,-1,-1,80,5,-1&chm=F,FF9900,0,1:4,40|H,0CBF0B,0,1:4,1:20|H,000000,4,1:4,1:40|H,0000FF,3,1:4,1:20|o,FF0000,5,-1,7|o,FF0000,6,-1,7 Prefix just the delimited string you enter by 1: to additionally display Candlestick/Box Charts or by 0: to only display Candlestick/Box Chart" :
(ctype.substring(0,1) == 'l' ? "Enter c for Even or s for Sparklines or xy for Just XY Line Chart look then a space and then enter delimited values string for Line Chart. Here is a Candlestick and Line Chart idea eg. c 1:20,10,15,25,17,30|0,5,10,7,12,6|35,25,45,47,24,46|15,40,30,27,39,54|70,55,63,59,80,6 Here is a Line Chart and Box Chart idea s 1:-1,5,10,7,12,-1|-1,25,30,27,24,-1|-1,40,45,47,39,-1|-1,55,63,59,80,-1|-1,30,40,35,30,-1|-1,-1,5,70,90,-1|-1,-1,-1,80,5,-1&chm=F,FF9900,0,1:4,40|H,0CBF0B,0,1:4,1:20|H,000000,4,1:4,1:40|H,0000FF,3,1:4,1:20|o,FF0000,5,-1,7|o,FF0000,6,-1,7 Prefix just the delimited string you enter by 1: to additionally display Candlestick/Box Charts or by 0: to only display Candlestick/Box Chart" :
(ctype == 'map' ? "" :
(ctype == 'gom' ? "Enter delimited values string for Google-O-Meter Chart" :
""))))))));
var asktwo=(ctype == 'v' ? true : (ctype == 's' ? true : (ctype == 'gv' ? false :
(ctype.substring(0,1) == 'p' ? true :
((ctype + ' ').substring(0,2).substring(0,1) == 'bv'.substring(0,1) ? true : (ctype.substring(0,1) == 'l' ? true :
(ctype == 'map' ? false :
(ctype == 'gom' ? true :
false))))))));

var twopb=(ctype.substring(0,1) == 'p' ? 'Any optional legend or title argument snippets? Optionally prefix by 3 for 3d Pie Chart or by c for Concentric Pie Chart. Eg. 3' + chdl + preachtt + '&chtt=My%20' + cencodename + '&chco=' + defchco : 'Any optional legend or title argument snippets? Eg. ' + chdl + preachtt + '&chtt=My%20' + cencodename + '&chco=' + defchco);
var beforeanswer=(ctype.substring(0,1) == 'l' ? 'c ' : ((ctype + ' ').substring(0,2).substring(0,1) == 'bv'.substring(0,1) ? 'vg ' : ''));

var emsmlist='';

… that goes into helping make the changed latest draft image_venn.html Google Chart Image Chart Venn Chart or Scatter Chart or GraphViz Chart or Pie Chart or Line Chart or Bar Chart or Candlestick/Box Chart or Google-O-Meter Chart or Map Chart interfacing web application you can also try below, one of the happiest little vegemites we know.


Previous relevant Google Chart Image Chart Colour Tutorial is shown below.

Google Chart Image Chart Colour Tutorial

Google Chart Image Chart Colour Tutorial

Restricting you creatives to “inhouse annotations” of the “gray variety” might be seen as a bit boooorrrriiiinnnngggg! And so, onto the progress up to yesterday’s Google Chart Image Chart Rubber Banding Tutorial, today we’ve added a …

  • colour picker … way user can define an “inhouse annotations” colour … and while we were at it …
  • as far as text “inhouse annotations” go we’ve added a counterclockwise from the horizon, in degrees, way to define an angle the text should be placed at … and …
  • we’ve stopped closing off the text font size dropdown too early, allowing the user to mix it up with their annotations, and so …

    We now recommend, for those users pushing the boundaries of functionality, to gather all their “inhouse annotations” together before any “graphical canvas annotations” are thought about.

Which begs the question …

Where do you get it?

Well, here, via … dare we say it?! … … via …

Mantissa Madness Monday

Both colour and degree counterclockwise angle became “Mantissa Madness Monday” tragics, a bit like moi, really?

How did we express these two measures?

  • colour can be derived at the 404.php end via mantissae that are 9 or more long where a number of the form rrrgggbbb is numerical and passed across to 404.php in the y co-ordinate mantissa … while … kind of crazily …
  • angle can be a set of zeros in the x co-ordinate mantissa represented by zero characters to the length of the angle from 1 to 359 in front of a pre-existant font size (in px) usage, from last “Mantissa Madness Monday” (us getting away with this because no font size should start with a zero)

Oh! We have such fun around here?! Below is PHP WordPress blog 404.php code …

<?php

// text placement
$black = imagecolorallocatealpha($im, 1, 1, 1, 0);
$blackish = imagecolorallocatealpha($im, 127, 127, 127, 64);
$yis=$csv[1];
$mantissae=explode('.', ('' . $csv[1]));
if (sizeof($mantissae) > 1) {
if (strlen($mantissae[1]) >= 9) {
$black = imagecolorallocatealpha($im, intval(substr($mantissae[1],0,3)), intval(substr(substr($mantissae[1],3),0,3)), intval(substr(substr($mantissae[1],6),0,3)), 0);
$blackish = imagecolorallocatealpha($im, intval(substr($mantissae[1],0,3)), intval(substr(substr($mantissae[1],3),0,3)), intval(substr(substr($mantissae[1],6),0,3)), 64);
}
$yis=$mantissae[0];
}

$za=0;
$xis=$csv[0];

$mantissae=explode('.', ('' . $csv[0]));
if (sizeof($mantissae) > 1) {
if (substr($mantissae[1],0,1) == '0') {
if (str_replace('0','',$mantissae[1]) != '') {
while (substr($mantissae[1],0,1) == '0') {
$za++;
$mantiss=substr($mantissae[1],1);
$mantissae[1]=$mantiss;
}
}
}

$tenpx=$mantissae[1];
$xis=$mantissae[0];
}
try {
if (function_exists('imagettftext')) {
if (explode('' . $csv[0] . ',' . $csv[1] . ',', $plotstring)[1] !== '') {
//echo explode('' . $csv[0] . ',' . $csv[1] . ',', $plotstring)[1];
//exit;
imagettftext($im, $tenpx, $za, $xis, $yis, $black, realpath('arial.ttf'), explode('' . $csv[0] . ',' . $csv[1] . ',', $plotstring)[1]);
}
}
} catch (Exception $e) { }

?>

… used by our changed latest draft image_venn.html Google Chart Image Chart Venn Chart or Scatter Chart or GraphViz Chart or Pie Chart or Line Chart or Bar Chart or Candlestick Chart or Map Chart interfacing web application you can also try below.


Previous relevant Google Chart Image Chart Rubber Banding Tutorial is shown below.

Google Chart Image Chart Rubber Banding Tutorial

Google Chart Image Chart Rubber Banding Tutorial

The Javascript clientside idea of “Rubber Banding”

Rubber banding is a popular technique of drawing geometric primitives such as line, polylines, rectangle, circle and ellipse on the computer screen.

… really appeals to our “inner programmer” … damn! … come, thou, out into the open, reveal thyself! … the sunshine is wonderful down here, and we’ve done away with death duties! … mostly! but it is …

  • only really a non-mobile prospect …

    function checkforaction(rubberbanding,nx,ny) {
    var bcbit='background-color:rgba(127,127,127,0.5);';
    var zeroes='';
    var classbit='';
    var brbit='';
    var ourdist=0;
    var ioff=(rubberbanding == true ? 1 : 0);
    var mone=1;

    curno=eval('' + xneeds.length);
    if (eval(ioff + curno) >= needtohave) {
    if (!rubberbanding) {
    document.getElementById('fauxdtext').innerHTML='';
    }
    if (curmode == 8) {
    zeroes='00000000';
    classbit=' class="crerect" ';
    } else if (curmode == -5) {
    //alert(1);
    bcbit='border:2px solid rgba(127,127,127,0.5);';
    if (rubberbanding) {
    ourdist=eval(2.0 * Math.sqrt((nx - xneeds[0]) * (nx - xneeds[0]) + (ny - yneeds[0]) * (ny - yneeds[0])));
    ourdist-=10;
    bcbit='border:2px solid gray;background-color:transparent;';
    } else {
    ourdist=eval(2.0 * Math.sqrt((xneeds[1] - xneeds[0]) * (xneeds[1] - xneeds[0]) + (yneeds[1] - yneeds[0]) * (yneeds[1] - yneeds[0])));
    }
    //alert(ourdist);
    //xneeds[1]=Math.floor('' + ourdist);
    //yneeds[1]=xneeds[1];
    brbit='border-radius:' + Math.floor(eval(ourdist / 2)) + 'px;';
    zeroes='00000';
    classbit=' class="ocirc" ';
    //alert('open circle');
    } else if (curmode == 6) {
    if (rubberbanding) {
    ourdist=eval(2.0 * Math.sqrt((nx - xneeds[0]) * (nx - xneeds[0]) + (ny - yneeds[0]) * (ny - yneeds[0])));
    ourdist-=10;
    } else {
    ourdist=eval(2.0 * Math.sqrt((xneeds[1] - xneeds[0]) * (xneeds[1] - xneeds[0]) + (yneeds[1] - yneeds[0]) * (yneeds[1] - yneeds[0])));
    }
    //xneeds[1]=Math.floor('' + ourdist);
    //yneeds[1]=xneeds[1];
    brbit='border-radius:' + Math.floor(eval(ourdist / 2)) + 'px;';
    //bcbit='border:2px solid rgba(127,127,127,0.5);';
    zeroes='000000';
    classbit=' class="ccirc" ';
    //alert('closed circle ' + bcbit);
    } else if (curmode == -4) {
    if (rubberbanding) {
    mone=0.90;
    bcbit='border:2px solid gray;background-color:transparent;';
    } else {
    bcbit='border:2px solid rgba(127,127,127,0.5);';
    }
    zeroes='00';
    classbit=' class="orect" ';
    } else if (curmode == 2) {
    zeroes='0';
    if (rubberbanding) {
    if (Math.min(xneeds[0],nx) == xneeds[0] && Math.min(yneeds[0],ny) == ny) { // thanks to https://stackoverflow.com/questions/18012420/draw-diagonal-lines-in-div-background-with-css
    classbit=' class="crossedtotl" ';
    } else if (Math.min(xneeds[0],nx) == nx && Math.min(yneeds[0],ny) == yneeds[0]) { // thanks to https://stackoverflow.com/questions/18012420/draw-diagonal-lines-in-div-background-with-css
    classbit=' class="crossedtotl" ';
    } else {
    classbit=' class="crossedtotr" ';
    }
    } else {
    if (Math.min(xneeds[0],xneeds[1]) == xneeds[0] && Math.min(yneeds[0],yneeds[1]) == yneeds[1]) { // thanks to https://stackoverflow.com/questions/18012420/draw-diagonal-lines-in-div-background-with-css
    classbit=' class="crossedtotl" ';
    } else if (Math.min(xneeds[0],xneeds[1]) == xneeds[1] && Math.min(yneeds[0],yneeds[1]) == yneeds[0]) { // thanks to https://stackoverflow.com/questions/18012420/draw-diagonal-lines-in-div-background-with-css
    classbit=' class="crossedtotl" ';
    } else {
    classbit=' class="crossedtotr" ';
    }
    }
    bcbit='';
    } else if (curmode == 4) {
    if (rubberbanding) {
    mone=0.90;
    }
    zeroes='0000';
    classbit=' class="crect" ';
    }
    if (!rubberbanding) {
    curno=-1;
    //if (brbit != '') {
    //document.getElementById('dtext').innerHTML+='<div' + classbit + ' style="' + brbit + 'position:absolute;left:' + Math.min(xneeds[0],nx) + 'px;top:' + Math.min(yneeds[0],ny) + 'px;width:' + Math.abs(xneeds[0] - nx) + 'px;height:' + Math.abs(yneeds[0] - ny) + 'px;z-index:98;' + bcbit + '"></div>';
    //} else {
    //document.getElementById('dtext').innerHTML+='<div' + classbit + ' style="' + brbit + 'position:absolute;left:' + Math.min(xneeds[0],xneeds[1]) + 'px;top:' + Math.min(yneeds[0],yneeds[1]) + 'px;width:' + Math.abs(xneeds[0] - xneeds[1]) + 'px;height:' + Math.abs(yneeds[0] - yneeds[1]) + 'px;z-index:98;' + bcbit + '"></div>';
    //}
    document.getElementById('aemail').href+='&text' + textnum + '=' + encodeURIComponent('' + xneeds[0] + '.' + zeroes + xneeds[1] + ',' + yneeds[0] + '.' + yneeds[1] + ',') + '';
    document.getElementById('asms').href+='&text' + textnum + '=' + encodeURIComponent('' + xneeds[0] + '.' + zeroes + xneeds[1] + ',' + yneeds[0] + '.' + yneeds[1] + ',') + '';
    aemailurl+='&text' + textnum + '=' + encodeURIComponent('' + xneeds[0] + '.' + zeroes + xneeds[1] + ',' + yneeds[0] + '.' + yneeds[1] + ',') + '';
    asmsurl+='&text' + textnum + '=' + encodeURIComponent('' + xneeds[0] + '.' + zeroes + xneeds[1] + ',' + yneeds[0] + '.' + yneeds[1] + ',') + '';
    arest+='&text' + textnum + '=' + encodeURIComponent('' + xneeds[0] + '.' + zeroes + xneeds[1] + ',' + yneeds[0] + '.' + yneeds[1] + ',') + '';
    }
    if (brbit != '') {
    //alert('brbit=' + brbit);
    //xneeds[0]-=(xneeds[1] - xneeds[0]);
    //yneeds[0]-=(yneeds[1] - yneeds[0]);
    //alert('xneeds[0]=' + xneeds[0]);
    if (rubberbanding) {
    document.getElementById('fauxdtext').innerHTML='<div' + classbit + ' style="' + brbit + 'z-index:-89;position:absolute;left:' + Math.floor(eval(Math.min(xneeds[0],xneeds[0]) - ourdist / 2)) + 'px;top:' + Math.floor(eval(Math.min(yneeds[0],yneeds[0]) - ourdist / 2)) + 'px;width:' + ourdist + 'px;height:' + ourdist + 'px;z-index:98;' + bcbit + '"></div>';
    } else {
    document.getElementById('dtext').innerHTML+='<div' + classbit + ' style="' + brbit + 'position:absolute;left:' + Math.floor(eval(Math.min(xneeds[0],xneeds[0]) - ourdist / 2)) + 'px;top:' + Math.floor(eval(Math.min(yneeds[0],yneeds[0]) - ourdist / 2)) + 'px;width:' + ourdist + 'px;height:' + ourdist + 'px;z-index:98;' + bcbit + '"></div>';
    }
    } else {
    if (rubberbanding) {
    document.getElementById('fauxdtext').innerHTML='<div' + classbit + ' style="' + brbit + 'z-index:-89;position:absolute;left:' + Math.min(xneeds[0],nx) + 'px;top:' + Math.min(yneeds[0],ny) + 'px;width:' + Math.max(Math.floor(eval(-30 + Math.abs(xneeds[0] - nx))),Math.floor(eval(mone * Math.abs(xneeds[0] - nx)))) + 'px;height:' + Math.max(Math.floor(eval(-30 + Math.abs(yneeds[0] - ny))),Math.floor(eval(mone * Math.abs(yneeds[0] - ny)))) + 'px;z-index:98;' + bcbit + '"></div>';
    } else {
    document.getElementById('dtext').innerHTML+='<div' + classbit + ' style="' + brbit + 'position:absolute;left:' + Math.min(xneeds[0],xneeds[1]) + 'px;top:' + Math.min(yneeds[0],yneeds[1]) + 'px;width:' + Math.abs(xneeds[0] - xneeds[1]) + 'px;height:' + Math.abs(yneeds[0] - yneeds[1]) + 'px;z-index:98;' + bcbit + '"></div>';
    }
    }
    if (!rubberbanding) {
    textnum++;
    xneeds=[];
    yneeds=[];
    //alert('arest=' + arest);
    document.getElementById('tdright').innerHTML="  <span id=spemail><a target=_blank href='mailto:?subject=My%20" + cencodename + "%20...%20best%20viewed%20in%20landscape%20...&body=" + encodeURIComponent((document.getElementById('myvenn').src + arest).replace((document.getElementById('myvenn').src + arest).split('?')[0].split('#')[0], document.URL.split('?')[0].split('#')[0])) + "' id=aemail title=Email>&#128231;</a></span>      <span id=spsms><a target=_blank onmouseover=\"if (smsee.length == 0 && origsmsurl.indexOf('sms:&') != -1) { smsee=prompt('Please enter SMS number to send to.', ''); if (smsee == null) { smsee=''; } else { origsmsurl=origsmsurl.replace('sms:&','sms:' + smsee + '&'); asmsurl=asmsurl.replace('sms:&','sms:' + smsee + '&'); this.href=asmsurl; } }\" ontouchstart=\"if (smsee.length == 0 && origsmsurl.indexOf('sms:&') != -1) { smsee=prompt('Please enter SMS number to send to.', ''); if (smsee == null) { smsee=''; } else { origsmsurl=origsmsurl.replace('sms:&','sms:' + smsee + '&'); asmsurl=asmsurl.replace('sms:&','sms:' + smsee + '&'); this.href=asmsurl; } }\" href='sms:&body=" + encodeURIComponent((document.getElementById('myvenn').src + arest).replace(document.getElementById('myvenn').src.split('?')[0].split('#')[0], document.URL.split('?')[0].split('#')[0])) + "' id=asms title=SMS>&#128223;</a></span><br><br>  <input title=\"\" onclick=\"event.stopPropagation();\" id=ilp onblur=\"waitfortwo(0); lasttext=this.value.replace(/\~\~/g, '<br>'); this.title=lasttext; if (!navigator.userAgent.match(/Android|BlackBerry|iPhone|iPad|iPod|Opera Mini|IEMobile/i)) { this.value=''; } this.placeholder='Click where you want ... ' + lasttext.replace(/\<br\>/g, String.fromCharCode(10)); mvp.setAttribute('content','initial-scale=1'); document.getElementById('myvenn').scrollIntoView();\" placeholder='Enter text and later click place for it on " + decodeURIComponent(cencodename) + " to left (line feed is ~~)' type=text style=width:500px; value=''></input>" + fszbit + "<br><br>  <img id=line src='/MarkItUp/line.png' onclick=\"event.stopPropagation(); this.style.border='1px dotted red'; waitfortwo(2);\"></img>  <img id=rectangle src='/MarkItUp/rectangle.png' onclick=\"event.stopPropagation(); this.style.border='1px dotted red'; waitfortwo(4);\"></img>  <img id=orectangle src='/MarkItUp/orectangle.png' onclick=\"event.stopPropagation(); this.style.border='1px dotted red'; waitfortwo(-4);\"></img>  <img id=circle src='/MarkItUp/circlefill.png' onclick=\"event.stopPropagation(); this.style.border='1px dotted red'; waitfortwo(6);\"></img>  <img id=ocircle src='/MarkItUp/circle.png' onclick=\"event.stopPropagation(); this.style.border='1px dotted red'; waitfortwo(-5);\"></img>  <button id=orerect onclick=\"event.stopPropagation(); this.style.border='1px dotted red'; waitfortwo(8);\" title=\"Zoom in on rectangle you define via two clicks\" style=display:none;>&#128270;</button>" + lastbit + atend;
    //alert(1);
    if (!navigator.userAgent.match(/Android|BlackBerry|iPhone|iPad|iPod|Opera Mini|IEMobile/i)) { document.getElementById('ilp').focus(); }
    document.getElementById('ilp').placeholder='Enter text and later click place for it on ' + decodeURIComponent(cencodename) + ' to left (line feed is ~~)';
    }
    } else if (curmode == 2 && !rubberbanding) {
    document.getElementById('line').style.border='1px dashed yellow';
    } else if (curmode == -4 && !rubberbanding) {
    document.getElementById('orectangle').style.border='1px dashed yellow';
    } else if (curmode == 4 && !rubberbanding) {
    document.getElementById('rectangle').style.border='1px dashed yellow';
    } else if (curmode == -5 && !rubberbanding) {
    document.getElementById('ocircle').style.border='1px dashed yellow';
    } else if (curmode == 6 && !rubberbanding) {
    document.getElementById('circle').style.border='1px dashed yellow';
    } else if (curmode == 8 && !rubberbanding) {
    document.getElementById('orerect').style.border='1px dashed yellow';
    }
    }

    // Rubber banding
    document.body.addEventListener('mousemove', function(evt){
    evt = evt || window.event;

    evt.preventDefault();

    elemLeft = document.getElementById('myvenn').offsetLeft;
    elemTop = document.getElementById('myvenn').offsetTop;

    //document.getElementById('myh3').innerHTML+=' ' + elemLeft + ':' + elemTop;
    //document.getElementById('myh3').innerHTML+=' ' + document.body.scrollLeft + '.' + document.body.scrollTop;

    if (evt.touches) {
    if (evt.touches[0].pageX) {
    //alert('here');
    xx = evt.touches[0].pageX + document.body.scrollLeft - elemLeft;
    yy = evt.touches[0].pageY + document.body.scrollTop - elemTop;
    if (xx >= 0 && xx <= eval(('' + document.getElementById('myvenn').width).replace('px','')) && yy >= 0 && yy <= eval(('' + document.getElementById('myvenn').height).replace('px',''))) {
    if (curno == 1 && (lastx != xx || lasty != yy)) {
    checkforaction(true,xx,yy);
    }
    //lastx=xx;
    //lasty=yy;
    //alert('x:' + x + ' and y:' + y);
    }
    } else {
    //alert('Here');
    xx = evt.touches[0].clientX + document.body.scrollLeft - elemLeft;
    yy = evt.touches[0].clientY + document.body.scrollTop - elemTop;
    if (xx >= 0 && xx <= eval(('' + document.getElementById('myvenn').width).replace('px','')) && yy >= 0 && yy <= eval(('' + document.getElementById('myvenn').height).replace('px',''))) {
    if (curno == 1 && (lastx != xx || lasty != yy)) {
    checkforaction(true,xx,yy);
    }
    //lastx=xx;
    //lasty=yy;
    //alert('x:' + x + ' and y:' + y);
    }
    }
    } else if (evt.clientX || ev.clientY) {
    //alert('HERE');
    xx = evt.clientX + document.body.scrollLeft - elemLeft;
    yy = evt.clientY + document.body.scrollTop - elemTop;
    if (xx >= 0 && xx <= eval(('' + document.getElementById('myvenn').width).replace('px','')) && yy >= 0 && yy <= eval(('' + document.getElementById('myvenn').height).replace('px',''))) {
    if (curno == 1 && (lastx != xx || lasty != yy)) {
    checkforaction(true,xx,yy);
    }
    //lastx=xx;
    //lasty=yy;
    }
    } else {
    //alert('HEre');
    xx = evt.pageX + document.body.scrollLeft - elemLeft;
    yy = evt.pageY + document.body.scrollTop - elemTop;
    if (xx >= 0 && xx <= eval(('' + document.getElementById('myvenn').width).replace('px','')) && yy >= 0 && yy <= eval(('' + document.getElementById('myvenn').height).replace('px',''))) {
    if (curno == 1 && (lastx != xx || lasty != yy)) {
    checkforaction(true,xx,yy);
    }
    //lastx=xx;
    //lasty=yy;
    }
    }
    });

    … at least for us (being as we do not want to clobber any pinch or spread gesture ideas, for the user)
  • is only a really, “nice to have” functionality idea

Even so, achieving even a 95% percent working “rubber band” is like … is like …

Barracking for Hairtie United …
You little beauty, Untied!

And so, further to yesterday’s Google Chart Image Chart Circle Annotation Tutorial we have this non-mobile “Rubber Banding” inhouse annotation functionality included in our changed latest draft image_venn.html Google Chart Image Chart Venn Chart or Scatter Chart or GraphViz Chart or Pie Chart or Line Chart or Bar Chart or Candlestick Chart or Map Chart interfacing web application you can also try below.

But there’s more! Despite how long out of the day it takes to barrack for Hairtie United, there was a mobile matter we resolved. A slide in today’s animated GIF presentation shows the issue. On mobile platforms, with these inhouse annotations, it would immediately show a tiny annotation. There panned out to be two event programming related issues we needed to fix related to this problem …

  1. change looking for a “touchstart” event, and instead look for a “touchdown” event for a document.body scope (else we might have restricted the “scope” to just document.getEleementById(‘myvenn’) as another approach (and you should note our event.stopPropagation() statements in lots of places as another research point for you)) because we are talking “discrete click” user behaviour we are targeting … as well as …
  2. start checking that the co-ordinates calculated fall into the range of the Google Charts Image Chart image dimensions … doh!


document.body.addEventListener('touchdown', function(evt){
//alert(8);
evt = evt || window.event;

evt.preventDefault();

elemLeft = document.getElementById('myvenn').offsetLeft;
elemTop = document.getElementById('myvenn').offsetTop;

//document.getElementById('myh3').innerHTML+=' ' + elemLeft + ';' + elemTop;

if (evt.touches) {
if (evt.touches[0].pageX) {
//alert('here');
x = evt.touches[0].pageX + document.body.scrollLeft - elemLeft;
y = evt.touches[0].pageY + document.body.scrollTop - elemTop;
if (x >= 0 && x <= eval(('' + document.getElementById('myvenn').width).replace('px','')) && y >= 0 && y <= eval(('' + document.getElementById('myvenn').height).replace('px',''))) {
if (curno >= 0 && (lastx != x || lasty != y)) {
xneeds.push(x);
yneeds.push(y);
checkforaction(false,-1,-1);
}
lastx=x;
lasty=y;
}
//alert('x:' + x + ' and y:' + y);
} else {
//alert('Here');
x = evt.touches[0].clientX + document.body.scrollLeft - elemLeft;
y = evt.touches[0].clientY + document.body.scrollTop - elemTop;
if (x >= 0 && x <= eval(('' + document.getElementById('myvenn').width).replace('px','')) && y >= 0 && y <= eval(('' + document.getElementById('myvenn').height).replace('px',''))) {
if (curno >= 0 && (lastx != x || lasty != y)) {
xneeds.push(x);
yneeds.push(y);
checkforaction(false,-1,-1);
}
lastx=x;
lasty=y;
}
//alert('x:' + x + ' and y:' + y);
}
} else if (evt.clientX || ev.clientY) {
//alert('HERE');
x = evt.clientX + document.body.scrollLeft - elemLeft;
y = evt.clientY + document.body.scrollTop - elemTop;
if (x >= 0 && x <= eval(('' + document.getElementById('myvenn').width).replace('px','')) && y >= 0 && y <= eval(('' + document.getElementById('myvenn').height).replace('px',''))) {
if (curno >= 0 && (lastx != x || lasty != y)) {
xneeds.push(x);
yneeds.push(y);
checkforaction(false,-1,-1);
}
lastx=x;
lasty=y;
}
} else {
//alert('HEre');
x = evt.pageX + document.body.scrollLeft - elemLeft;
y = evt.pageY + document.body.scrollTop - elemTop;
if (x >= 0 && x <= eval(('' + document.getElementById('myvenn').width).replace('px','')) && y >= 0 && y <= eval(('' + document.getElementById('myvenn').height).replace('px',''))) {
if (curno >= 0 && (lastx != x || lasty != y)) {
xneeds.push(x);
yneeds.push(y);
checkforaction(false,-1,-1);
}
lastx=x;
lasty=y;
}
}
});

Did you know?

Well … we didn’t?! We happened to try the web application above on a tiny iPad and saw that HTML button elements with an innerHTML label containing a line feed ( ie. <br> ) only showed the top line, and, alas, for that button in question, the vital new information used to be on the second line. Hence our fix …


//document.getElementById('bshare').innerHTML='Repainting Top Left Image Periodically ... <br>Click here to Broadcast this session to other interested parties ...';
document.getElementById('bshare').innerHTML='Click here to Broadcast this session to other interested parties ...<br>Repainting Top Left Image Periodically ...';


Previous relevant Google Chart Image Chart Circle Annotation Tutorial is shown below.

Google Chart Image Chart Circle Annotation Tutorial

Google Chart Image Chart Circle Annotation Tutorial

Today, we add …

  • open circle
  • filled circle

… annotation possibilities onto the “Broadcast Talk” work in yesterday’s Google Chart Image Chart Broadcast Talk Context Tutorial.

The CSS border-radius property has come to the rescue of many a programmer, saving us from resorting to SVG to display circle or ellipses or arcs of various sorts …


function checkforaction() {
var bcbit='background-color:rgba(127,127,127,0.5);';
var zeroes='';
var classbit='';
var brbit='';
var ourdist=0;


curno=eval('' + xneeds.length);
if (curno >= needtohave) {
if (curmode == 8) {
zeroes='00000000';
classbit=' class="crerect" ';
} else if (curmode == -5) {
//alert(1);
ourdist=eval(2.0 * Math.sqrt((xneeds[1] - xneeds[0]) * (xneeds[1] - xneeds[0]) + (yneeds[1] - yneeds[0]) * (yneeds[1] - yneeds[0])));
//alert(ourdist);
//xneeds[1]=Math.floor('' + ourdist);
//yneeds[1]=xneeds[1];
brbit='border-radius:' + Math.floor(eval(ourdist / 2)) + 'px;';
bcbit='border:2px solid rgba(127,127,127,0.5);';
zeroes='00000';
classbit=' class="ocirc" ';
//alert('open circle');
} else if (curmode == 6) {
ourdist=eval(2.0 * Math.sqrt((xneeds[1] - xneeds[0]) * (xneeds[1] - xneeds[0]) + (yneeds[1] - yneeds[0]) * (yneeds[1] - yneeds[0])));
//xneeds[1]=Math.floor('' + ourdist);
//yneeds[1]=xneeds[1];
brbit='border-radius:' + Math.floor(eval(ourdist / 2)) + 'px;';
//bcbit='border:2px solid rgba(127,127,127,0.5);';
zeroes='000000';
classbit=' class="ccirc" ';
//alert('closed circle ' + bcbit);
}
else if (curmode == -4) {
bcbit='border:2px solid rgba(127,127,127,0.5);';
zeroes='00';
classbit=' class="orect" ';
} else if (curmode == 2) {
zeroes='0';
if (Math.min(xneeds[0],xneeds[1]) == xneeds[0] && Math.min(yneeds[0],yneeds[1]) == yneeds[1]) { // thanks to https://stackoverflow.com/questions/18012420/draw-diagonal-lines-in-div-background-with-css
classbit=' class="crossedtotl" ';
} else if (Math.min(xneeds[0],xneeds[1]) == xneeds[1] && Math.min(yneeds[0],yneeds[1]) == yneeds[0]) { // thanks to https://stackoverflow.com/questions/18012420/draw-diagonal-lines-in-div-background-with-css
classbit=' class="crossedtotl" ';
} else {
classbit=' class="crossedtotr" ';
}
bcbit='';
} else if (curmode == 4) {
zeroes='0000';
classbit=' class="crect" ';
}
curno=-1;
//if (brbit != '') {
//document.getElementById('dtext').innerHTML+='<div' + classbit + ' style="' + brbit + 'position:absolute;left:' + Math.min(xneeds[0],xneeds[1]) + 'px;top:' + Math.min(yneeds[0],yneeds[1]) + 'px;width:' + Math.abs(xneeds[0] - xneeds[1]) + 'px;height:' + Math.abs(yneeds[0] - yneeds[1]) + 'px;z-index:98;' + bcbit + '"></div>';
//} else {
//document.getElementById('dtext').innerHTML+='<div' + classbit + ' style="' + brbit + 'position:absolute;left:' + Math.min(xneeds[0],xneeds[1]) + 'px;top:' + Math.min(yneeds[0],yneeds[1]) + 'px;width:' + Math.abs(xneeds[0] - xneeds[1]) + 'px;height:' + Math.abs(yneeds[0] - yneeds[1]) + 'px;z-index:98;' + bcbit + '"></div>';
//}
document.getElementById('aemail').href+='&text' + textnum + '=' + encodeURIComponent('' + xneeds[0] + '.' + zeroes + xneeds[1] + ',' + yneeds[0] + '.' + yneeds[1] + ',') + '';
document.getElementById('asms').href+='&text' + textnum + '=' + encodeURIComponent('' + xneeds[0] + '.' + zeroes + xneeds[1] + ',' + yneeds[0] + '.' + yneeds[1] + ',') + '';
aemailurl+='&text' + textnum + '=' + encodeURIComponent('' + xneeds[0] + '.' + zeroes + xneeds[1] + ',' + yneeds[0] + '.' + yneeds[1] + ',') + '';
asmsurl+='&text' + textnum + '=' + encodeURIComponent('' + xneeds[0] + '.' + zeroes + xneeds[1] + ',' + yneeds[0] + '.' + yneeds[1] + ',') + '';
arest+='&text' + textnum + '=' + encodeURIComponent('' + xneeds[0] + '.' + zeroes + xneeds[1] + ',' + yneeds[0] + '.' + yneeds[1] + ',') + '';
if (brbit != '') {
//alert('brbit=' + brbit);
//xneeds[0]-=(xneeds[1] - xneeds[0]);
//yneeds[0]-=(yneeds[1] - yneeds[0]);
//alert('xneeds[0]=' + xneeds[0]);
document.getElementById('dtext').innerHTML+='<div' + classbit + ' style="' + brbit + 'position:absolute;left:' + Math.floor(eval(Math.min(xneeds[0],xneeds[0]) - ourdist / 2)) + 'px;top:' + Math.floor(eval(Math.min(yneeds[0],yneeds[0]) - ourdist / 2)) + 'px;width:' + ourdist + 'px;height:' + ourdist + 'px;z-index:98;' + bcbit + '"></div>';
} else {

document.getElementById('dtext').innerHTML+='<div' + classbit + ' style="' + brbit + 'position:absolute;left:' + Math.min(xneeds[0],xneeds[1]) + 'px;top:' + Math.min(yneeds[0],yneeds[1]) + 'px;width:' + Math.abs(xneeds[0] - xneeds[1]) + 'px;height:' + Math.abs(yneeds[0] - yneeds[1]) + 'px;z-index:98;' + bcbit + '"></div>';
}
textnum++;
xneeds=[];
yneeds=[];
//alert('arest=' + arest);
document.getElementById('tdright').innerHTML="  <span id=spemail><a target=_blank href='mailto:?subject=My%20" + cencodename + "%20...%20best%20viewed%20in%20landscape%20...&body=" + encodeURIComponent((document.getElementById('myvenn').src + arest).replace((document.getElementById('myvenn').src + arest).split('?')[0].split('#')[0], document.URL.split('?')[0].split('#')[0])) + "' id=aemail title=Email>&#128231;</a></span>      <span id=spsms><a target=_blank onmouseover=\"if (smsee.length == 0 && origsmsurl.indexOf('sms:&') != -1) { smsee=prompt('Please enter SMS number to send to.', ''); if (smsee == null) { smsee=''; } else { origsmsurl=origsmsurl.replace('sms:&','sms:' + smsee + '&'); asmsurl=asmsurl.replace('sms:&','sms:' + smsee + '&'); this.href=asmsurl; } }\" ontouchstart=\"if (smsee.length == 0 && origsmsurl.indexOf('sms:&') != -1) { smsee=prompt('Please enter SMS number to send to.', ''); if (smsee == null) { smsee=''; } else { origsmsurl=origsmsurl.replace('sms:&','sms:' + smsee + '&'); asmsurl=asmsurl.replace('sms:&','sms:' + smsee + '&'); this.href=asmsurl; } }\" href='sms:&body=" + encodeURIComponent((document.getElementById('myvenn').src + arest).replace(document.getElementById('myvenn').src.split('?')[0].split('#')[0], document.URL.split('?')[0].split('#')[0])) + "' id=asms title=SMS>&#128223;</a></span><br><br>  <input title=\"\" onclick=\"event.stopPropagation();\" id=ilp onblur=\"waitfortwo(0); lasttext=this.value.replace(/\~\~/g, '<br>'); this.title=lasttext; if (!navigator.userAgent.match(/Android|BlackBerry|iPhone|iPad|iPod|Opera Mini|IEMobile/i)) { this.value=''; } this.placeholder='Click where you want ... ' + lasttext.replace(/\<br\>/g, String.fromCharCode(10)); mvp.setAttribute('content','initial-scale=1'); document.getElementById('myvenn').scrollIntoView();\" placeholder='Enter text and later click place for it on " + decodeURIComponent(cencodename) + " to left (line feed is ~~)' type=text style=width:500px; value=''></input>" + fszbit + "<br><br>  <img id=line src='/MarkItUp/line.png' onclick=\"event.stopPropagation(); this.style.border='1px dotted red'; waitfortwo(2);\"></img>  <img id=rectangle src='/MarkItUp/rectangle.png' onclick=\"event.stopPropagation(); this.style.border='1px dotted red'; waitfortwo(4);\"></img>  <img id=orectangle src='/MarkItUp/orectangle.png' onclick=\"event.stopPropagation(); this.style.border='1px dotted red'; waitfortwo(-4);\"></img>  <img id=circle src='/MarkItUp/circlefill.png' onclick=\"event.stopPropagation(); this.style.border='1px dotted red'; waitfortwo(6);\"></img>  <img id=ocircle src='/MarkItUp/circle.png' onclick=\"event.stopPropagation(); this.style.border='1px dotted red'; waitfortwo(-5);\"></img>  <button id=orerect onclick=\"event.stopPropagation(); this.style.border='1px dotted red'; waitfortwo(8);\" title=\"Zoom in on rectangle you define via two clicks\" style=display:none;>&#128270;</button>" + lastbit + atend;
//alert(1);
if (!navigator.userAgent.match(/Android|BlackBerry|iPhone|iPad|iPod|Opera Mini|IEMobile/i)) { document.getElementById('ilp').focus(); }
document.getElementById('ilp').placeholder='Enter text and later click place for it on ' + decodeURIComponent(cencodename) + ' to left (line feed is ~~)';
} else if (curmode == 2) {
document.getElementById('line').style.border='1px dashed yellow';
} else if (curmode == -4) {
document.getElementById('orectangle').style.border='1px dashed yellow';
} else if (curmode == 4) {
document.getElementById('rectangle').style.border='1px dashed yellow';
} else if (curmode == -5) {
document.getElementById('ocircle').style.border='1px dashed yellow';
} else if (curmode == 6) {
document.getElementById('circle').style.border='1px dashed yellow';
} else if (curmode == 8) {
document.getElementById('orerect').style.border='1px dashed yellow';
}
}

… to team up with WordPress blog 404.php changes …

<?php

if (strlen($zeroesbit) == 6) { // filled in circle
if (sizeof($csv) == 3) {
array_push($csv, $csv[2]);
} else if (sizeof($csv) >= 4) {
$dist=(2.0 * sqrt(($csv[0] - $csv[2]) * ($csv[0] - $csv[2]) + ($csv[1] - $csv[3]) * ($csv[1] - $csv[3])));
$csv[2]=$dist;
$csv[3]=$dist;
}
imagefilledellipse($im, $csv[0], $csv[1], $csv[2], $csv[3], $blackish);
} else if (strlen($zeroesbit) == 5) { // circle
if (sizeof($csv) == 3) {
array_push($csv, $csv[2]);
} else if (sizeof($csv) >= 4) {
$dist=(2.0 * sqrt(($csv[0] - $csv[2]) * ($csv[0] - $csv[2]) + ($csv[1] - $csv[3]) * ($csv[1] - $csv[3])));
$csv[2]=$dist;
$csv[3]=$dist;
}
imageellipse($im, $csv[0], $csv[1], $csv[2], $csv[3], $black);
}

?>

… with our changed ninth draft image_venn.html Google Chart Image Chart Venn Chart or Scatter Chart or GraphViz Chart or Pie Chart or Line Chart or Bar Chart or Candlestick Chart or Map Chart interfacing web application you can also try below.


Previous relevant Google Chart Image Chart Broadcast Talk Context Tutorial is shown below.

Google Chart Image Chart Broadcast Talk Context Tutorial

Google Chart Image Chart Broadcast Talk Context Tutorial

The progress, today, along the same lines as yesterday’s Google Chart Image Chart Broadcast Talk Tutorial‘s introduction of a “Broadcast Talk” functionality, was to …

  • improve “Broadcast Talk” context, by adding onto yesterday’s …

    presented as an update image still presented and updated periodically

    … only display option, with, as of today …

  • a presenter’s first snapshotted image retained for user display (in case they arrive late to the lesson … tutt tutt) … and …
  • ImageMagick created animated GIF with slides for just this first image and the most recent image, updated periodically, in bottom right cell of user display …
    <?php

    if (isset($_POST['canvcont']) && isset($_POST['uniquifier']) && strpos(('?' . $_SERVER['QUERY_STRING']), 'cht=') === false) {
    if (isset($_POST['uniquifier'])) {
    $uniquifier=str_replace('+',' ',urldecode($_POST['uniquifier']));
    }
    if ($uniquifier == '') {
    $uniquifier='_' . rand(0,78654356);
    file_put_contents($_SERVER['DOCUMENT_ROOT'] . DIRECTORY_SEPARATOR . "presentation" . $uniquifier . ".png", base64_decode( explode('base64,', str_replace(' ','+',urldecode($_POST['canvcont'])))[1]));
    exec("/usr/local/cpanel/3rdparty/bin/convert -delay 20 -loop 0 " . $_SERVER['DOCUMENT_ROOT'] . DIRECTORY_SEPARATOR . "presentation" . $uniquifier . ".png" . " " . $_SERVER['DOCUMENT_ROOT'] . DIRECTORY_SEPARATOR . "presentation" . $uniquifier . ".gif");
    echo "<html><body onload=\"if (parent.document.getElementById('uniquifier')) { if (parent.document.getElementById('uniquifier').value == '') { parent.document.getElementById('uniquifier').value='" . $uniquifier . "'; } }\"></body></html>";
    } else {
    file_put_contents($_SERVER['DOCUMENT_ROOT'] . DIRECTORY_SEPARATOR . "presentation" . $uniquifier . ".png", base64_decode( explode('base64,', str_replace(' ','+',urldecode($_POST['canvcont'])))[1]));
    exec("rm -f " . $_SERVER['DOCUMENT_ROOT'] . DIRECTORY_SEPARATOR . "presentation" . $uniquifier . ".gif ; /usr/local/cpanel/3rdparty/bin/convert -delay 200 -loop 0 " . $_SERVER['DOCUMENT_ROOT'] . DIRECTORY_SEPARATOR . "presentation_" . $uniquifier . ".png " . $_SERVER['DOCUMENT_ROOT'] . DIRECTORY_SEPARATOR . "presentation" . $uniquifier . ".png" . " " . $_SERVER['DOCUMENT_ROOT'] . DIRECTORY_SEPARATOR . "presentation" . $uniquifier . ".gif");
    }
    exit;
    }

    ?>
    … and …
  • images saved as changes are detected gathered, as ever smaller thumbnails, in the top right of four table cells of the user display …

    var iijk=0, uniquif=''; snapshots=[], elem=null, elemcontext=null, oimg=null, checkforsquare=2;

    function canvinit() {
    var kkii=0, wpx=0, hpx=0;
    var tdr=document.getElementById('tdtr').getBoundingClientRect();
    wpx=eval('' + tdr.width);
    hpx=eval('' + tdr.height);
    elem=document.getElementById('agcanvas');
    elemcontext=elem.getContext('2d');
    elem.width=elem.width;
    elemcontext.drawImage(document.getElementById('talkimg'),0,0);
    if (iijk == 0 || ('' + document.getElementById('tdtr').style.backgroundImage).indexOf('rand=0') != -1) {
    //alert('89 ' + elem.toDataURL().length);
    //snapshots.push(elem.toDataURL());
    iijk=eval(-1 + eval('' + ('' + document.getElementById('tdtr').style.backgroundImage).split('),').length));
    document.getElementById('tdtr').style.backgroundImage=('' + document.getElementById('tdtr').style.backgroundImage).replace(('' + document.getElementById('tdtr').style.backgroundImage).split('),')[iijk], '' + 'url(' + elem.toDataURL() + '),' + ('' + document.getElementById('tdtr').style.backgroundImage).split('),')[iijk]).replace('rand=0', 'rand=x');
    iijk=eval(0 + eval('' + ('' + document.getElementById('tdtr').style.backgroundImage).split('),').length));
    setInterval(canvinit, 9000);
    } else {
    elem.width=elem.width;
    elemcontext.drawImage(document.getElementById('talkimg'),0,0);
    if (document.body.innerHTML.indexOf(elem.toDataURL()) == -1) {
    //snapshots.push(elem.toDataURL());
    iijk=eval(-1 + eval('' + ('' + document.getElementById('tdtr').style.backgroundImage).split('),').length));
    document.getElementById('tdtr').style.backgroundImage=('' + document.getElementById('tdtr').style.backgroundImage).replace(('' + document.getElementById('tdtr').style.backgroundImage).split('),')[iijk], '' + 'url(' + elem.toDataURL() + '),' + ('' + document.getElementById('tdtr').style.backgroundImage).split('),')[iijk]).replace('rand=x','rand=x' + Math.floor(Math.random() * 9));
    iijk=eval(0 + eval('' + ('' + document.getElementById('tdtr').style.backgroundImage).split('),').length));
    }
    }
    var bpx='background-position:;';
    var bbpx='background-position:;';
    var bsx='background-size:;';
    var brx='background-repeat:;';
    var xstart=0;
    var ystart=0;
    var xxstart=eval('' + tdr.left);
    var yystart=eval('' + tdr.top);
    if (iijk > eval(checkforsquare * checkforsquare)) { checkforsquare++; }
    for (kkii=1; kkii<=iijk; kkii++) {
    if (bsx.indexOf(':;') != -1) {
    bsx=bsx.replace(':;', ':' + Math.round(eval(wpx / checkforsquare)) + 'px ' + Math.round(eval(hpx /checkforsquare)) + 'px;');
    brx=brx.replace(':;', ':no-repeat;');
    bpx=bpx.replace(':;', ':' + Math.round(xstart) + 'px ' + Math.round(ystart) + 'px;');
    bbpx=bbpx.replace(':;', ':' + Math.round(xxstart) + 'px ' + Math.round(yystart) + 'px;');
    } else {
    bsx=bsx.replace(';', ',' + Math.round(eval(wpx / checkforsquare)) + 'px ' + Math.round(eval(hpx /checkforsquare)) + 'px;');
    brx=brx.replace(';', ',no-repeat;');
    bpx=bpx.replace(';', ',' + Math.round(xstart) + 'px ' + Math.round(ystart) + 'px;');
    bbpx=bbpx.replace(';', ',' + Math.round(xxstart) + 'px ' + Math.round(yystart) + 'px;');
    }
    if (eval(kkii % checkforsquare) == 0) {
    xstart=0;
    xxstart=eval('' + tdr.left);
    ystart+=eval(hpx / checkforsquare);
    yystart+=eval(hpx / checkforsquare);
    } else {
    xstart+=eval(wpx / checkforsquare);
    xxstart+=eval(wpx / checkforsquare);
    }
    }
    //alert('iijk=' + iijk + ' ' + bbpx + ' ' + bpx + ' ' + bsx + ' ' + brx);
    document.getElementById('tdtr').style.backgroundRepeat=brx.split(':')[1];
    document.getElementById('tdtr').style.backgroundSize=bsx.split(':')[1];
    document.getElementById('tdtr').style.backgroundPosition=bpx.split(':')[1];
    //document.body.style.backgroundImage=('' + document.getElementById('tdtr').style.backgroundImage);
    //document.body.style.backgroundRepeat=brx.split(':')[1];
    //document.body.style.backgroundSize=bsx.split(':')[1];

    document.body.style.backgroundPosition=bbpx.split(':')[1];
    var kdss=bsx.split(':')[1].replace(/\;/g,'').split(',');
    var idss=bbpx.split(':')[1].replace(/\;/g,'').split(',');
    var jdss=(('' + document.getElementById('tdtr').style.backgroundImage) + ',').replace(';,',',').replace(/url\(/g,'').replace(/URL\(/g,'').replace(/\"\;/g,'').replace(/\"/g,'').split('),');
    document.getElementById('idiv').innerHTML='';
    var istuff='', laststuff='';
    for (var iop=0; iop<idss.length; iop++) {
    //while (istuff == laststuff) {
    if (('' + jdss[iop]) != 'undefined' && ('' + jdss[iop]).trim() != '') {
    if (jdss[iop].trim().indexOf('iVBOR') != -1) {
    istuff+='<img style="position:absolute;width:' + kdss[iop].split(' ')[0] + ';height:' + kdss[iop].split(' ')[1] + ';left:' + idss[iop].split(' ')[0] + ';top:' + idss[iop].split(' ')[1] + ';" src="data:image/png;base64,iVBOR' + jdss[iop].trim().split('iVBOR')[1] + '"></img>';
    } else if (jdss[iop].trim() .indexOf('//') != -1) {
    istuff+='<img style="position:absolute;width:' + kdss[iop].split(' ')[0] + ';height:' + kdss[iop].split(' ')[1] + ';left:' + idss[iop].split(' ')[0] + ';top:' + idss[iop].split(' ')[1] + ';" src="' + jdss[iop].trim() + '"></img>';
    }
    //}
    laststuff=istuff;
    }
    }
    document.getElementById('idiv').innerHTML=istuff;
    }

We hope you try new functionality in our changed eighth draft image_venn.html Google Chart Image Chart Venn Chart or Scatter Chart or GraphViz Chart or Pie Chart or Line Chart or Bar Chart or Candlestick Chart or Map Chart interfacing web application you can also try below.


Previous relevant Google Chart Image Chart Broadcast Talk Tutorial is shown below.

Google Chart Image Chart Broadcast Talk Tutorial

Google Chart Image Chart Broadcast Talk Tutorial

Onto yesterday’s Google Chart Image Chart Statistical Charts Tutorial progress we want to offer …

  • once a user has that “More Annotation” annotating happening … offer the chance to …
  • Broadcast … their work as it happens, dynamically …
  • to an emailee list audience

… and we’re calling this …

Broadcast Talk

… even though it is only visual by nature, presented as an update image still presented and updated periodically. Go figure?! We’re blaming that supper time two back. We’re not sure?!

Anyway, we hope you try out the new arrangements in our changed seventh draft image_venn.html Google Chart Image Chart Venn Chart or Scatter Chart or GraphViz Chart or Pie Chart or Line Chart or Bar Chart or Candlestick Chart or Map Chart interfacing web application you can also try below, and helped out by a WordPress blog good ol’ TwentyTen theme 404.php which now includes …

<?php

if (isset($_POST['canvcont']) && isset($_POST['uniquifier']) && strpos(('?' . $_SERVER['QUERY_STRING']), 'cht=') === false) {
if (isset($_POST['uniquifier'])) {
$uniquifier=str_replace('+',' ',urldecode($_POST['uniquifier']));
}
if ($uniquifier == '') {
$uniquifier='_' . rand(0,78654356);
file_put_contents($_SERVER['DOCUMENT_ROOT'] . DIRECTORY_SEPARATOR . "presentation" . $uniquifier . ".png", base64_decode( explode('base64,', str_replace(' ','+',urldecode($_POST['canvcont'])))[1]));
echo "<html><body onload=\"if (parent.document.getElementById('uniquifier')) { if (parent.document.getElementById('uniquifier').value == '') { parent.document.getElementById('uniquifier').value='" . $uniquifier . "'; } }\"></body></html>";
} else {
file_put_contents($_SERVER['DOCUMENT_ROOT'] . DIRECTORY_SEPARATOR . "presentation" . $uniquifier . ".png", base64_decode( explode('base64,', str_replace(' ','+',urldecode($_POST['canvcont'])))[1]));
}
exit;
}

?>

… featuring our first use of this 404.php in response to a method=POST form call. Verrrrrryyyy interesting!


Previous relevant Google Chart Image Chart Statistical Charts Tutorial is shown below.

Google Chart Image Chart Statistical Charts Tutorial

Google Chart Image Chart Statistical Charts Tutorial

Further to yesterday’s Google Chart Image Chart Pie Chart Tutorial, today, we embark on our first ventures into composite charts, along what we like to think of as “statistical lines”, regarding interfacing to Google Charts Image Chart

… the latter being like a “parasite” display idea off the more conventional Statistical Graph favourites, the Line Chart and Bar Chart, where you have a relationship between a numerical concept (eg. sales) and another type of concept (eg. month of the year), and you want to present the data in a graphical form.

Again, we haven’t stopped our “retweaking”. We might “retweak” in the morning or we might “retweak” over a coffee break or we might “retweak” at supper time, but the end result is, well, you’re reading it now!


var pretherest='';
var newtherest='';
var tmod='';
var cht=location.search.split('cht=')[1] ? decodeURIComponent(location.search.split('cht=')[1].split('&')[0]) : "v";
if ((cht + ' ').substring(0,1) == 'p' && cht != 'p') { pretherest=cht.substring(1); }
if ((cht + ' ').substring(0,2) == 'bv' && cht != 'bv') { pretherest=cht.substring(2); if (1 == 1) { cht='bv'; } }
if ((cht + ' ').substring(0,1) == 'l' && cht != 'l') { pretherest=cht.substring(1); if (1 == 1) { cht='l'; } }
var ctype=location.search.split('type=')[1] ? decodeURIComponent(location.search.split('type=')[1].split('&')[0]) : cht;
var cname=(ctype == 'v' ? 'Venn Chart' : (ctype == 's' ? 'Scatter Chart' : (ctype == 'gv' ? 'GraphViz Chart' :
(ctype.substring(0,1) == 'p' ? 'Pie Chart' :
((ctype + ' ').substring(0,2) == 'bv' ? 'Bar Chart' : (ctype.substring(0,1) == 'l' ? 'Line Chart' : ''))))));
var cencodename=(ctype == 'v' ? 'Venn%20Diagram' : (ctype == 's' ? 'Scatter%20Chart' : (ctype == 'gv' ? 'GraphViz%20Chart' :
(ctype.substring(0,1) == 'p' ? 'Pie%20Chart' :
((ctype + ' ').substring(0,2) == 'bv' ? 'Bar%20Chart' : (ctype.substring(0,1) == 'l' ? 'Line%20Chart' : ''))))));
var chdt=(ctype == 'v' ? '&chd=t:' : (ctype == 's' ? '&chd=t:' : (ctype == 'gv' ? '&chl=' :
(ctype.substring(0,1) == 'p' ? pretherest + '&chd=t:' :
((ctype + ' ').substring(0,2) == 'bv' ? '&chd=t:' : (ctype.substring(0,1) == 'l' ? '&chd=t:' : ''))))));
var chdeq=(ctype == 'v' ? '&chd=' : (ctype == 's' ? '&chd=' : (ctype == 'gv' ? '&chl=' :
(ctype.substring(0,1) == 'p' ? '&chd=' :
((ctype + ' ').substring(0,2) == 'bv' ? '&chd=' : (ctype.substring(0,1) == 'l' ? '&chd=' : ''))))));
var tc=(ctype == 'v' ? 't:' : (ctype == 's' ? 't:' : (ctype == 'gv' ? '' :
(ctype.substring(0,1) == 'p' ? 't:' :
((ctype + ' ').substring(0,2) == 'bv' ? 't:' : (ctype.substring(0,1) == 'l' ? 't:' : ''))))));
var chdl=(ctype == 'v' ? '&chdl=' : (ctype == 's' ? '&chdl=' : (ctype == 'gv' ? '' :
(ctype.substring(0,1) == 'p' ? '&chdl=' :
((ctype + ' ').substring(0,2) == 'bv' ? '&chbh=' : (ctype.substring(0,1) == 'l' ? '&chbh=' : ''))))));

var prenchtt=(ctype == 'v' ? '100,80,60,30,30,30,10' : (ctype == 's' ? '12,87,75,41,23,96,68,71,34,9|98,60,27,34,56,79,58,74,18,76|84,23,69,81,47,94,60,93,64,54' : (ctype == 'gv' ? 'graph{C_0--H_0[type=s];C_0--H_1[type=s];C_0--H_2[type=s];C_0--C_1[type=s];C_1--H_3[type=s];C_1--H_4[type=s];C_1--H_5[type=s]}' :
(ctype.substring(0,1) == 'p' ? '1,2,3,4' :
((ctype + ' ').substring(0,2) == 'bv' ? '5,5,5|10,10,10|15,15,15' : (ctype.substring(0,1) == 'l' ? '5,45,5|10,60,10|15,85,15' : ''))))));
var preachtt=(ctype == 'v' ? 'A|B|C' : (ctype == 's' ? 'Cats|Dogs' : (ctype == 'gv' ? '' :
(ctype.substring(0,1) == 'p' ? 'January|February|March|April' :
((ctype + ' ').substring(0,2) == 'bv' ? '15,4,15' : (ctype.substring(0,1) == 'l' ? '15,4,15' : ''))))));
var defchco=(ctype == 'v' ? 'ff0000,00ff00,0000ff' : (ctype == 's' ? 'FF0000|0000FF&chxt=x,y' : (ctype == 'gv' ? '' :
(ctype.substring(0,1) == 'p' ? 'ff0000,00ff00,0000ff,ff00ff' :
((ctype + ' ').substring(0,2) == 'bv' ? '4D89F9,C6D9FD,C6FDD9&chxt=x,y' : (ctype.substring(0,1) == 'l' ? '3D89F9.B6D9FD,B6FDD9&chxt=x,y' : ''))))));

var prechtt=(ctype == 'v' ? chdt + prenchtt + chdl + preachtt : (ctype == 's' ? chdt + prenchtt + chdl + preachtt + '&chxt=x,y' : (ctype == 'gv' ? chdt + prenchtt :
(ctype.substring(0,1) == 'p' ? chdt + prenchtt + chdl + preachtt :
((ctype + ' ').substring(0,2) == 'bv' ? chdt + prenchtt + chdl + preachtt : (ctype.substring(0,1) == 'l' ? chdt + prenchtt + chdl + preachtt : ''))))));
var promptone=(ctype == 'v' ? "Enter delimited values string for Venn Diagram such that ... " + String.fromCharCode(10) + "The first three values specify the sizes of three circles: A, B, & C. For chart with only two circles, specify zero for the third value." + String.fromCharCode(10) + "The fourth value specifies the size of the intersection of A and B." + String.fromCharCode(10) + "The fifth value specifies the size of the intersection of A and C. For a chart with only two circles, do not specify a value here." + String.fromCharCode(10) + "The sixth value specifies the size of the intersection of B and C. For a chart with only two circles, do not specify a value here." + String.fromCharCode(10) + "The seventh value specifies the size of the common intersection of A, B, and C. For a chart with only two circles, do not specify a value here." + String.fromCharCode(10) + String.fromCharCode(10) + "" : (ctype == 's' ? "Enter delimited values string for Scatter Chart" : (ctype == 'gv' ? "Enter delimited values string for GraphViz Chart" :
(ctype.substring(0,1) == 'p' ? "Enter delimited values string for Pie Chart" :
((ctype + ' ').substring(0,2) == 'bv' ? "Enter g for Group or s for Stacked or o for Overlapped Bar Chart look then a space and then enter delimited values string for Bar Chart. Here is a Candlestick and Bar Chart idea eg. g 1:20,10,15,25,17,30|0,5,10,7,12,6|35,25,45,47,24,46|15,40,30,27,39,54|70,55,63,59,80,6 Prefix just the delimited string you enter by 1: to additionally display Candlestick Charts or by 0: to only display Candlestick Chart" :
(ctype.substring(0,1) == 'l' ? "Enter c for Even or s for Sparklines or xy for Just XY Line Chart look then a space and then enter delimited values string for Line Chart. Here is a Candlestick and Line Chart idea eg. c 1:20,10,15,25,17,30|0,5,10,7,12,6|35,25,45,47,24,46|15,40,30,27,39,54|70,55,63,59,80,6 Prefix just the delimited string you enter by 1: to additionally display Candlestick Charts or by 0: to only display Candlestick Chart" : ""))))));
var oneprompt=(ctype == 'v' ? "Enter delimited values string for your Venn Diagram collaborations, optionally, such that ... " + String.fromCharCode(10) + "The first three values specify the sizes of three circles: A, B, & C. For chart with only two circles, specify zero for the third value." + String.fromCharCode(10) + "The fourth value specifies the size of the intersection of A and B." + String.fromCharCode(10) + "The fifth value specifies the size of the intersection of A and C. For a chart with only two circles, do not specify a value here." + String.fromCharCode(10) + "The sixth value specifies the size of the intersection of B and C. For a chart with only two circles, do not specify a value here." + String.fromCharCode(10) + "The seventh value specifies the size of the common intersection of A, B, and C. For a chart with only two circles, do not specify a value here." + String.fromCharCode(10) + String.fromCharCode(10) + "" : (ctype == 's' ? "Enter delimited values string for Scatter Chart" : (ctype == 'gv' ? "Enter delimited values string for GraphViz Chart" :
(ctype.substring(0,1) == 'p' ? "Enter delimited values string for Pie Chart" :
((ctype + ' ').substring(0,2) == 'bv' ? "Enter g for Grouped or s for Stacked or o for Overlapped Bar Chart look then a space and then enter delimited values string for Bar Chart. Here is a Candlestick and Bar Chart idea eg. g 1:20,10,15,25,17,30|0,5,10,7,12,6|35,25,45,47,24,46|15,40,30,27,39,54|70,55,63,59,80,6 Prefix just the delimited string you enter by 1: to additionally display Candlestick Charts or by 0: to only display Candlestick Chart" :
(ctype.substring(0,1) == 'l' ? "Enter c for Even or s for Sparklines or xy for Just XY Line Chart look then a space and then enter delimited values string for Line Chart. Here is a Candlestick and Line Chart idea eg. c 1:20,10,15,25,17,30|0,5,10,7,12,6|35,25,45,47,24,46|15,40,30,27,39,54|70,55,63,59,80,6 Prefix just the delimited string you enter by 1: to additionally display Candlestick Charts or by 0: to only display Candlestick Chart" : ""))))));
var asktwo=(ctype == 'v' ? true : (ctype == 's' ? true : (ctype == 'gv' ? false :
(ctype.substring(0,1) == 'p' ? true :
((ctype + ' ').substring(0,2) == 'bv' ? true : (ctype.substring(0,1) == 'l' ? true : false))))));
var twopb=(ce.substring(0,1) == 'p' ? 'Any optional legend or title argument snippets? Optionally prefix by 3 for 3d Pie Chart or by c for Concentric Pie Chart. Eg. 3' + chdl + preachtt + '&chtt=My%20' + cencodename + '&chco=' + defchco : 'Any optional legend or title argument snippets? Eg. ' + chdl + preachtt + '&chtt=My%20' + cencodename + '&chco=' + defchco);
var beforeanswer=(ctype.substring(0,1) == 'l' ? 'c ' : ((ctype + ' ').substring(0,2) == 'bv' ? 'g ' : ''));

if ((document.URL.toLowerCase().indexOf('chd=t%3a') == -1 && document.URL.toLowerCase().indexOf('chd=t:') == -1) && document.URL.toLowerCase().indexOf('chd=t') != -1 && document.URL.toLowerCase().indexOf('%3a') != -1) {
tmod=document.URL.toLowerCase().split('chd=t')[1].split('%3')[0];
//tc='t' + tmod + ':';
//chdt=chdt.replace('t:', 't' + tmod + ':');
//answer=answer.trim().replace(tmod + ':','');
//therest+='&chm=F,,1,1:4,20';
} else if ((document.URL.toLowerCase().indexOf('chd=t%3a') == -1 && document.URL.toLowerCase().indexOf('chd=t:') == -1) && document.URL.toLowerCase().indexOf('chd=t') != -1 && document.URL.toLowerCase().substring(8).indexOf(':') != -1) {
tmod=document.URL.toLowerCase().split('chd=t')[1].split(':')[0];
//tc='t' + tmod + ':';
//chdt=chdt.replace('t:', 't' + tmod + ':');
//answer=answer.trim().replace(tmod + ':','');
//therest+='&chm=F,,1,1:4,20';
}

var atend="<canvas id=sharecanvas style=display:none;></canvas><div style=display:none;><label for='shareurl'><input type=button onclick='downloadmaybe(); shareurl();' id='sbut' value='Share URL Link'></input>: </label><input onblur=changeu(this.value); title='Suffix by hashtag 1 is text and hashtag 2 is title' style='width:45%;' type=url value='' placeholder='https://www.rjmprogramming.com.au/ITblog/#RJM Programming Blog#IT Blog' id=shareurl ondblclick='this.value=trythis(this.placeholder);'></input><br><br><span> ... and/or ... </span><br><br><label for='files'><input type=button onclick=document.getElementById('share').click(); value='Share media or document files'></input>: </label><input id='files' type='file' accept='image/*,video/*,audio/*,application/*,text/*' multiple></div><br><br><button id='share' type='button'>Share your media or documents or link!</button><output id='output'></output><scr" + "ipt type='text/javascript' src='/web_share_api_test.js?canv" + "asshare=as_necessary9867654' defer></scr" + "ipt>";
atend='';

var vals=[], annowin=null;


var lastbit="<br><br><br><br>  <button title='Other complex canvas annotation functionalities (forgoes the simpler ones above) ...' id=annobut onclick=\"document.getElementById('tdleft').style.verticalAlign='top'; setTimeout(prerepaint, 12000); if (arest.length != 0) { alert('arest=' + arest); if (document.getElementById('myvenn').src.indexOf(arest) == -1) { pdivhide(); document.getElementById('myvenn').src=document.getElementById('myvenn').src.split(arest.substring(0,5))[0] + arest; document.getElementById('tdleft').style.verticalAlign='top'; } } annowin=window.open('/HTMLCSS/user_of_signature_signature.htm?elemode=img','_blank','top=420,left=620,width=900,height=420'); \" style=\"background-color:yellow;\">More Annotations</button>  <button id=bshare onclick=repaint(); style=display:none;>Repaint <font size=1>(but lose sharing emojis above)</font></button><br><div id=divcanvas style=display:none;><canvas id=bottomcanvas></canvas></div>";
var fszbit='  <span id=spanfsz><select id=fsz onchange="fsz=this.value;"><option value=".10">10px</option><option value=".6">6px</option><option value=".8">8px</option><option value=".9">9px</option><option value=".11">11px</option><option value=".12">12px</option><option value=".14">14px</option><option value=".16">16px</option><option value=".18">18px</option><option value=".20">20px</option><option value=".24">24px</option><option value=".30">30px</option><option value=".36">36px</option><option value=".40">40px</option><option value=".48">48px</option><option value=".50">50px</option><option value=".64">64px</option></select></span>';
var origemailurl='mailto:?subject=My%20' + cencodename + '%20...%20best%20viewed%20in%20landscape%20...&body=';
var origsmsurl='sms:&body=My%20' + cencodename + '%20...%20best%20viewed%20in%20landscape%20...';
var smsee='';
var chd=location.search.split(chdeq)[1] ? (tc + dectypodeURIComponent(location.search.split(chdeq)[1].split('&')[0])).replace('t:t:', 't:').replace(/^t\:$/g, '') : "";
var therest=location.search.split(chdeq)[1] ? (pretherest + document.URL.split(document.URL.split('#')[0].split(chdeq)[1].split('&')[0])[1].split('#')[0]) : "";
newtherest=((ctype + ' ').substring(0,2) == 'bv' ? therest : '');

And yes, you can, and we did, put line feeds into those ternery statements to help with their readability as we add complexity to the parameterization, as we go along, in our changed sixth draft image_venn.html Google Chart Image Chart Venn Chart or Scatter Chart or GraphViz Chart or Pie Chart or Line Chart or Bar Chart or Candlestick Chart interfacing web application you can also try below.


Previous relevant Google Chart Image Chart Pie Chart Tutorial is shown below.

Google Chart Image Chart Pie Chart Tutorial

Google Chart Image Chart Pie Chart Tutorial

As we intimated in yesterday’s Google Chart Image Chart GraphViz Chart Tutorial

start with an at least two part “inhouse phase” of additional “extra to text” annotation functionality possibilities …

… we would return! And so, here thou lingers. It’s “part two” day, even bigger than “Ben Hur” in certain outback towns we’re a little bit shy to divulge until we get to know our readers that little bit better.

Yes, we are dovetailing with work we’ve done in the past using the excellent …

  • canvas … element introduced with HTML5 … whereby …
  • annotations like …
    1. scribble … as the default, and various other …
    2. discrete click shapes … and …
    3. text … including emojis … and …
    4. image

    … annotating modus operandi

… can be part of the arrangements. It works that the Annotation Helper is opened …

  • in a new “known about” popup window … looking out for …
  • parent based “img” element (in the modus operandi we use, calling it, regarding the parent top left image) … so as to be able to …
  • populate its canvas element with a clone of that calling “img” graphical content … but add into the mix …
  • menu driven annotation functionality which can change that canvas look and underlying data … and …
  • the caller can keep track of this and arrange, or not, for these changes to be reflected back at its top left “img” element … the catch being …
  • the “within range of GET argument” limits are ruined by this introduction of graphical data, and so in agreeing to this, a user forgoes those simpler sharing and annotating functionalities of yesterday’s (and before) work … though your normal image sharing capabilities via the web browser remain in the caller and the called

As well, today, we are introducing new Google Charts Image Chart Pie Chart interfacing, and because this chart type can have the three …

  • Normal
  • 3D
  • Concentric

… guises, there was some work to keep us off this street (okay … so we divulgedagain)


var pretherest='';
var cht=location.search.split('cht=')[1] ? decodeURIComponent(location.search.split('cht=')[1].split('&')[0]) : "v";
if ((cht + ' ').substring(0,1) == 'p' && cht != 'p') { pretherest=cht.substring(1); }
var ctype=location.search.split('type=')[1] ? decodeURIComponent(location.search.split('type=')[1].split('&')[0]) : cht;
var cname=(ctype == 'v' ? 'Venn Chart' : (ctype == 's' ? 'Scatter Chart' : (ctype == 'gv' ? 'GraphViz Chart' : (ctype.substring(0,1) == 'p' ? 'Pie Chart' : ''))));
var cencodename=(ctype == 'v' ? 'Venn%20Diagram' : (ctype == 's' ? 'Scatter%20Chart' : (ctype == 'gv' ? 'GraphViz%20Chart' : (ctype.substring(0,1) == 'p' ? 'Pie%20Chart' : ''))));
var chdt=(ctype == 'v' ? '&chd=t:' : (ctype == 's' ? '&chd=t:' : (ctype == 'gv' ? '&chl=' : (ctype.substring(0,1) == 'p' ? pretherest + '&chd=t:' : ''))));
var chdeq=(ctype == 'v' ? '&chd=' : (ctype == 's' ? '&chd=' : (ctype == 'gv' ? '&chl=' : (ctype.substring(0,1) == 'p' ? '&chd=' : ''))));
var tc=(ctype == 'v' ? 't:' : (ctype == 's' ? 't:' : (ctype == 'gv' ? '' : (ctype.substring(0,1) == 'p' ? 't:' : ''))));
var chdl=(ctype == 'v' ? '&chdl=' : (ctype == 's' ? '&chdl=' : (ctype == 'gv' ? '' : (ctype.substring(0,1) == 'p' ? '&chdl=' : ''))));
var prenchtt=(ctype == 'v' ? '100,80,60,30,30,30,10' : (ctype == 's' ? '12,87,75,41,23,96,68,71,34,9|98,60,27,34,56,79,58,74,18,76|84,23,69,81,47,94,60,93,64,54' : (ctype == 'gv' ? 'graph{C_0--H_0[type=s];C_0--H_1[type=s];C_0--H_2[type=s];C_0--C_1[type=s];C_1--H_3[type=s];C_1--H_4[type=s];C_1--H_5[type=s]}' : (ctype.substring(0,1) == 'p' ? '1,2,3,4' : ''))));
var preachtt=(ctype == 'v' ? 'A|B|C' : (ctype == 's' ? 'Cats|Dogs' : (ctype == 'gv' ? '' : (ctype.substring(0,1) == 'p' ? 'January|February|March|April' : ''))));
var prechtt=(ctype == 'v' ? chdt + prenchtt + chdl + preachtt : (ctype == 's' ? chdt + prenchtt + chdl + preachtt + '&chxt=x,y' : (ctype == 'gv' ? chdt + prenchtt : (ctype.substring(0,1) == 'p' ? chdt + prenchtt + chdl + preachtt : ''))));
var defchco=(ctype == 'v' ? 'ff0000,00ff00,0000ff' : (ctype == 's' ? 'FF0000|0000FF&chxt=x,y' : (ctype == 'gv' ? '' : (ctype.substring(0,1) == 'p' ? 'ff0000,00ff00,0000ff,ff00ff' : ''))));
var promptone=(ctype == 'v' ? "Enter delimited values string for Venn Diagram such that ... " + String.fromCharCode(10) + "The first three values specify the sizes of three circles: A, B, & C. For chart with only two circles, specify zero for the third value." + String.fromCharCode(10) + "The fourth value specifies the size of the intersection of A and B." + String.fromCharCode(10) + "The fifth value specifies the size of the intersection of A and C. For a chart with only two circles, do not specify a value here." + String.fromCharCode(10) + "The sixth value specifies the size of the intersection of B and C. For a chart with only two circles, do not specify a value here." + String.fromCharCode(10) + "The seventh value specifies the size of the common intersection of A, B, and C. For a chart with only two circles, do not specify a value here." + String.fromCharCode(10) + String.fromCharCode(10) + "" : (ctype == 's' ? "Enter delimited values string for Scatter Chart" : (ctype == 'gv' ? "Enter delimited values string for GraphViz Chart" : (ctype.substring(0,1) == 'p' ? "Enter delimited values string for Pie Chart" : ""))));
var oneprompt=(ctype == 'v' ? "Enter delimited values string for your Venn Diagram collaborations, optionally, such that ... " + String.fromCharCode(10) + "The first three values specify the sizes of three circles: A, B, & C. For chart with only two circles, specify zero for the third value." + String.fromCharCode(10) + "The fourth value specifies the size of the intersection of A and B." + String.fromCharCode(10) + "The fifth value specifies the size of the intersection of A and C. For a chart with only two circles, do not specify a value here." + String.fromCharCode(10) + "The sixth value specifies the size of the intersection of B and C. For a chart with only two circles, do not specify a value here." + String.fromCharCode(10) + "The seventh value specifies the size of the common intersection of A, B, and C. For a chart with only two circles, do not specify a value here." + String.fromCharCode(10) + String.fromCharCode(10) + "" : (ctype == 's' ? "Enter delimited values string for Scatter Chart" : (ctype == 'gv' ? "Enter delimited values string for GraphViz Chart" : (ctype.substring(0,1) == 'p' ? "Enter delimited values string for Pie Chart" : ""))));
var asktwo=(ctype == 'v' ? true : (ctype == 's' ? true : (ctype == 'gv' ? false : (ctype.substring(0,1) == 'p' ? true : false))));
var twopb=(ctype.substring(0,1) == 'p' ? 'Any optional legend or title argument snippets? Optionally prefix by 3 for 3d Pie Chart or by c for Concentric Pie Chart. Eg. 3' + chdl + preachtt + '&chtt=My%20' + cencodename + '&chco=' + defchco : 'Any optional legend or title argument snippets? Eg. ' + chdl + preachtt + '&chtt=My%20' + cencodename + '&chco=' + defchco);

var atend="<canvas id=sharecanvas style=display:none;></canvas><div style=display:none;><label for='shareurl'><input type=button onclick='downloadmaybe(); shareurl();' id='sbut' value='Share URL Link'></input>: </label><input onblur=changeu(this.value); title='Suffix by hashtag 1 is text and hashtag 2 is title' style='width:45%;' type=url value='' placeholder='https://www.rjmprogramming.com.au/ITblog/#RJM Programming Blog#IT Blog' id=shareurl ondblclick='this.value=trythis(this.placeholder);'></input><br><br><span> ... and/or ... </span><br><br><label for='files'><input type=button onclick=document.getElementById('share').click(); value='Share media or document files'></input>: </label><input id='files' type='file' accept='image/*,video/*,audio/*,application/*,text/*' multiple></div><br><br><button id='share' type='button'>Share your media or documents or link!</button><output id='output'></output><scr" + "ipt type='text/javascript' src='/web_share_api_test.js?canv" + "asshare=as_necessary9867654' defer></scr" + "ipt>";
atend='';

var vals=[], annowin=null;
var lastbit="<br><br><br><br>  <button title='Other complex canvas annotation functionalities (forgoes the simpler ones above) ...' id=annobut onclick=\"document.getElementById('tdleft').style.verticalAlign='top'; setTimeout(prerepaint, 12000); if (arest.length != 0) { if (document.getElementById('myvenn').src.indexOf(arest) == -1) { pdivhide(); document.getElementById('myvenn').src=document.getElementById('myvenn').src.split(arest.substring(0,5))[0] + arest; document.getElementById('tdleft').style.verticalAlign='top'; } } annowin=window.open('/HTMLCSS/user_of_signature_signature.htm?elemode=img','_blank','top=420,left=620,width=900,height=420'); \" style=\"background-color:yellow;\">More Annotations</button>  <button id=bshare onclick=repaint(); style=display:none;>Repaint <font size=1>(but lose sharing emojis above)</font></button><br><div id=divcanvas style=display:none;><canvas id=bottomcanvas></canvas></div>";
var fszbit='  <span id=spanfsz><select id=fsz onchange="fsz=this.value;"><option value=".10">10px</option><option value=".6">6px</option><option value=".8">8px</option><option value=".9">9px</option><option value=".11">11px</option><option value=".12">12px</option><option value=".14">14px</option><option value=".16">16px</option><option value=".18">18px</option><option value=".20">20px</option><option value=".24">24px</option><option value=".30">30px</option><option value=".36">36px</option><option value=".40">40px</option><option value=".48">48px</option><option value=".50">50px</option><option value=".64">64px</option></select></span>';
var origemailurl='mailto:?subject=My%20' + cencodename + '%20...%20best%20viewed%20in%20landscape%20...&body=';
var origsmsurl='sms:&body=My%20' + cencodename + '%20...%20best%20viewed%20in%20landscape%20...';
var smsee='';
var chd=location.search.split(chdeq)[1] ? (tc + decodeURIComponent(location.search.split(chdeq)[1].split('&')[0])).replace('t:t:', 't:').replace(/^t\:$/g, '') : "";
var therest=location.search.split(chdeq)[1] ? (pretherest + document.URL.split(document.URL.split('#')[0].split(chdeq)[1].split('&')[0])[1].split('#')[0]) : "";

Please acquaint yourself with these new annotating features in our changed fifth draft image_venn.html Google Chart Image Chart Venn Chart or Scatter Chart or GraphViz Chart or Pie Chart interfacing web application you can also try below.


Previous relevant Google Chart Image Chart GraphViz Chart Tutorial is shown below.

Google Chart Image Chart GraphViz Chart Tutorial

Google Chart Image Chart GraphViz Chart Tutorial

Today we have two strands of forward progress, onto the progress up to yesterday’s Google Chart Image Chart Scatter Chart Tutorial, they being …

  • establish a new interfacing to GraphViz Chart

    GraphViz is a package of open source tools for visualizing connectivity graphs. You can create GraphViz graphs using the DOT language and your choice of layout engines.

    … a chart looking a bit like Organization Charts

    Org charts are diagrams of a hierarchy of nodes, commonly used to portray superior/subordinate relationships in an organization. A family tree is a type of org chart.


  • start with an at least two part “inhouse phase” of additional “extra to text” annotation functionality possibilities … just starting with …
    1. line
    2. open rectangle
    3. filled rectangle

… additional functionality, that we may well add to, but being as we feel a change we’ll leave that for another time.

The WordPress blog “404.php” code snippet becomes …

<?php

if (strpos(('?' . $_SERVER['QUERY_STRING']), '?cht=') !== false || strpos(('?' . $_SERVER['QUERY_STRING']), '&cht=') !== false) {

$theqs=str_replace('??','?',('?' . $_SERVER['QUERY_STRING']));
if (strpos($theqs, '?chs=') === false && strpos($theqs, '&chs=') === false) {
$theqs='?chs=' . $newWidth . 'x' . $newHeight . '&' . explode('?', $theqs)[1];
}


if (strpos(('?' . $_SERVER['QUERY_STRING']), 'text1=') !== false) {
$theone=2;
$im = imagecreatefromstring(file_get_contents('http://chart.googleapis.com/chart' . explode('&text1=', $theqs)[0]));

if (7 == 7) {

$plotstring=str_replace('+',' ',urldecode($_GET['text1']));
$csv=explode(',', $plotstring);
$black = imagecolorallocatealpha($im, 1, 1, 1, 0);
$blackish = imagecolorallocatealpha($im, 127, 127, 127, 64);
if (sizeof($csv) >= 3) {
if (trim($csv[2]) == '') { // non text annotations

$zeroesbit='';
$izeroes=0;
$xmantissae=explode('.', ('' . $csv[0]));
if (sizeof($xmantissae) > 1) {
$csv[0]=$xmantissae[0];
while (substr($xmantissae[1],0,1) == '0') {
$zeroesbit.='0';
$xmantissae[1]=substr($xmantissae[1],1);
}
$csv[2]=$xmantissae[1];
}
$ymantissae=explode('.', ('' . $csv[1]));
if (sizeof($ymantissae) > 1) {
$csv[1]=$ymantissae[0];
if (sizeof($csv) > 3) {
$csv[3]=$ymantissae[1];
} else {
array_push($csv, $ymantissae[1]);
}
}


if (strlen($zeroesbit) == 4) { // filled in rectangle
imagefilledrectangle($im, $csv[0], $csv[1], $csv[2], $csv[3], $blackish);
} else if (strlen($zeroesbit) == 2) { // rectangle
imagerectangle($im, $csv[0], $csv[1], $csv[2], $csv[3], $black);
} else if (strlen($zeroesbit) == 1) { // line
imageline($im, $csv[0], $csv[1], $csv[2], $csv[3], $black);
}

} else { // text placement
$xis=$csv[0];
$mantissae=explode('.', ('' . $csv[0]));
if (sizeof($mantissae) > 1) {
$tenpx=$mantissae[1];
$xis=$mantissae[0];
}
try {
if (function_exists('imagettftext')) {
if (explode('' . $csv[0] . ',' . $csv[1] . ',', $plotstring)[1] !== '') {
//echo explode('' . $csv[0] . ',' . $csv[1] . ',', $plotstring)[1];
//exit;
imagettftext($im, $tenpx, 0, $xis, $csv[1], $black, realpath('arial.ttf'), explode('' . $csv[0] . ',' . $csv[1] . ',', $plotstring)[1]);
}
}
} catch (Exception $e) { }
}
while (isset($_GET['text' . $theone])) {
$plotstring=str_replace('+',' ',urldecode($_GET['text' . $theone]));
$csv=explode(',', $plotstring);
if (sizeof($csv) >= 3) {
if (trim($csv[2]) == '') { // non text annotations

$zeroesbit='';
$izeroes=0;
$xmantissae=explode('.', ('' . $csv[0]));
if (sizeof($xmantissae) > 1) {
$csv[0]=$xmantissae[0];
while (substr($xmantissae[1],0,1) == '0') {
$zeroesbit.='0';
$xmantissae[1]=substr($xmantissae[1],1);
}
$csv[2]=$xmantissae[1];
}
$ymantissae=explode('.', ('' . $csv[1]));
if (sizeof($ymantissae) > 1) {
$csv[1]=$ymantissae[0];
if (sizeof($csv) > 3) {
$csv[3]=$ymantissae[1];
} else {
array_push($csv, $ymantissae[1]);
}
}


if (strlen($zeroesbit) == 4) { // filled in rectangle
imagefilledrectangle($im, $csv[0], $csv[1], $csv[2], $csv[3], $blackish);
} else if (strlen($zeroesbit) == 2) { // rectangle
imagerectangle($im, $csv[0], $csv[1], $csv[2], $csv[3], $black);
} else if (strlen($zeroesbit) == 1) { // line
imageline($im, $csv[0], $csv[1], $csv[2], $csv[3], $black);
}

} else { // text placement
try {
$xis=$csv[0];
$mantissae=explode('.', ('' . $csv[0]));
if (sizeof($mantissae) > 1) {
$tenpx=$mantissae[1];
$xis=$mantissae[0];
}
if (function_exists('imagettftext')) {
if (explode('' . $csv[0] . ',' . $csv[1] . ',', $plotstring)[1] !== '') {
imagettftext($im, $tenpx, 0, $xis, $csv[1], $black, realpath('arial.ttf'), explode('' . $csv[0] . ',' . $csv[1] . ',', $plotstring)[1]);
}
}
} catch (Exception $e) { }
}
$theone++;
}
}
//}
}


}

header('Content-Type: image/png');

imagepng($im);
imagedestroy($im);
} else {
header('Content-Type: image/png');
echo file_get_contents('http://chart.googleapis.com/chart' . $theqs);
}
exit;

}

?>

… utilizing that good ol’ PHP GD image library.

We hope you enjoy the …

Mantissa Madness Monday

… coding feel utilized to retain yesterday’s …


&textn=x,y,Text

… argument snippet basis, adding “x” and “y” mantissa arrangement smarts with a “nothing” Text in our changed fourth draft image_venn.html Google Chart Image Chart Venn Chart or Scatter Chart or GraphViz Chart interfacing web application you can also try below.

Did you know?

Would you believe, at least to us, it is far less obvious how to display a straight line (that is perhaps not horizontal nor vertical) within a webpage, than it is to display a rectangle, filled or not?! Talk about irony! Over time, we have developed …

  • HTML hr elements (with a rotation) … and the less kludgy …
  • HTML div (defining a box with defined dimensions) for a nested SVG element containing the line definition using percentage dimensions

… in the past, for when we needed to do this. But, today, we’d like to thank this great webpage for its suggestion to involve linear gradients …


<style>

.crossedtotl {
background:
linear-gradient(to top left,
rgba(0,0,0,0) 0%,
rgba(0,0,0,0) calc(50% - 0.8px),
rgba(0,0,0,1) 50%,
rgba(0,0,0,0) calc(50% + 0.8px),
rgba(0,0,0,0) 100%);
}
.crossedtotr {
background:
linear-gradient(to top right,
rgba(0,0,0,0) 0%,
rgba(0,0,0,0) calc(50% - 0.8px),
rgba(0,0,0,1) 50%,
rgba(0,0,0,0) calc(50% + 0.8px),
rgba(0,0,0,0) 100%);
}
</style>

… in a, basically, CSS solution. Great stuff, thanks!


Previous relevant Google Chart Image Chart Scatter Chart Tutorial is shown below.

Google Chart Image Chart Scatter Chart Tutorial

Google Chart Image Chart Scatter Chart Tutorial

Today, we bring the Google Charts Image Chart

… making distributing “Venn Chart” hardcodings into a dropdown selectable arrangement, because there are more commonalities than differences, really, and we do like to parameterize … even in the shower, with a fairly loud rendition of this, perhaps.

Here is our framework for parameterization, here, and into the future


<title>Interfacing to Google Charts Image Chart Venn Chart or Scatter Chart - RJM Programming - November, 2023</title>
<script type=text/javascript>
var cht=location.search.split('cht=')[1] ? decodeURIComponent(location.search.split('cht=')[1].split('&')[0]) : "v";
var ctype=location.search.split('type=')[1] ? decodeURIComponent(location.search.split('type=')[1].split('&')[0]) : cht;
var cname=(ctype == 'v' ? 'Venn Chart' : (ctype == 's' ? 'Scatter Chart' : ''));
var cencodename=(ctype == 'v' ? 'Venn%20Diagram' : (ctype == 's' ? 'Scatter%20Chart' : ''));
var prenchtt=(ctype == 'v' ? '100,80,60,30,30,30,10' : (ctype == 's' ? '12,87,75,41,23,96,68,71,34,9|98,60,27,34,56,79,58,74,18,76|84,23,69,81,47,94,60,93,64,54' : ''));
var preachtt=(ctype == 'v' ? 'A|B|C' : (ctype == 's' ? 'Cats|Dogs' : ''));
var prechtt=(ctype == 'v' ? '&chd=t:' + prenchtt + '&chdl=' + preachtt : (ctype == 's' ? '&chd=t:' + prenchtt + '&chdl=' + preachtt + '&chxt=x,y' : ''));
var defchco=(ctype == 'v' ? 'ff0000,00ff00,0000ff' : (ctype == 's' ? 'FF0000|0000FF&chxt=x,y' : ''));
var promptone=(ctype == 'v' ? "Enter delimited values string for Venn Diagram such that ... " + String.fromCharCode(10) + "The first three values specify the sizes of three circles: A, B, & C. For chart with only two circles, specify zero for the third value." + String.fromCharCode(10) + "The fourth value specifies the size of the intersection of A and B." + String.fromCharCode(10) + "The fifth value specifies the size of the intersection of A and C. For a chart with only two circles, do not specify a value here." + String.fromCharCode(10) + "The sixth value specifies the size of the intersection of B and C. For a chart with only two circles, do not specify a value here." + String.fromCharCode(10) + "The seventh value specifies the size of the common intersection of A, B, and C. For a chart with only two circles, do not specify a value here." + String.fromCharCode(10) + String.fromCharCode(10) + "" : (ctype == 's' ? "Enter delimited values string for Scatter Chart" : ""));
var oneprompt=(ctype == 'v' ? "Enter delimited values string for your Venn Diagram collaborations, optionally, such that ... " + String.fromCharCode(10) + "The first three values specify the sizes of three circles: A, B, & C. For chart with only two circles, specify zero for the third value." + String.fromCharCode(10) + "The fourth value specifies the size of the intersection of A and B." + String.fromCharCode(10) + "The fifth value specifies the size of the intersection of A and C. For a chart with only two circles, do not specify a value here." + String.fromCharCode(10) + "The sixth value specifies the size of the intersection of B and C. For a chart with only two circles, do not specify a value here." + String.fromCharCode(10) + "The seventh value specifies the size of the common intersection of A, B, and C. For a chart with only two circles, do not specify a value here." + String.fromCharCode(10) + String.fromCharCode(10) + "" : (ctype == 's' ? "Enter delimited values string for Scatter Chart" : ""));

// etcetera etcetera etcetera

… but, as you can imagine, there will probably be small retweaks of this arrangement, which is holding out okay so far for Scatter Charts in our changed third draft image_venn.html Google Chart Image Chart Venn Chart or Scatter Chart interfacing web application you can also try below.

Did you know?

In this online world with so many platforms and devices and software choices, there is no need to ever be embarrassed by what might seem an obvious feature you’ve missed.

Take the way on macOS, but not iOS, using a web browser to get to YouTube, you can flag that a video should loop. Especially good for …

  • song obsessions …
  • earworms you need to salve

… and what about if your shower is taking an awfully long time?! Please be careful with moisture and devices, though, in the bathroom!

How does it happen? Right click the play button, and looping is there as the top option. Now back to that shower song obsession.


Previous relevant Google Chart Image Chart Venn Chart User Text Tutorial is shown below.

Google Chart Image Chart Venn Chart User Text Tutorial

Google Chart Image Chart Venn Chart User Text Tutorial

We think a way to improve on our interfacing web application start regarding yesterday’s Google Chart Image Chart Venn Chart Interfacing Primer Tutorial would be to offer the user the chance to enter their own text onto the Venn Diagrams …

But we would say that.

… given what we learnt in Primary school … or should we say …

“Gryffindor Slytherin Ravenclaw Hufflepuff Junior Business College”

… and, yes, is that you, Aoife? What did you want to point out? After you swallow those Rice Bubbles, that is?! Class is waiting …

.
.
.
.
.
.
.
.
.
.
.
.
.
.
.
.
.
.
.
.
.
.
.
.
.

Yes … miss something … and …

.
.
.
.
.
.
.
.
.
.
.
.
.
.
.
.
.
.
.
.
.
.
.
.
.

Use your words … okay … missing … don’t worry, the bus will wait … no … there’s no need to point … oh! …

… do you mean …

missing ewe … no … missing you … oh! … missing u … oh! … “Gryffindor Slytherin Ravenclaw Hufflepuff Juniour Business College” … quite so, Aiofe … 3 points for Hufflepuff!

Anyway we needed a fleshed out “function ask” to cater for potential onclick event logic catering for co-ordinates


function ask(evt) {
var answer='', answertherest='';
if (lasttext != '' && evt && normalcall) {
document.getElementById('ilp').placeholder='Enter text and later click place for it on Venn Diagram to left (line feed is ~~)';

elemLeft = document.getElementById('myvenn').offsetLeft;
elemTop = document.getElementById('myvenn').offsetTop;

if (evt.touches) {
if (evt.touches[0].pageX) {
x = evt.touches[0].pageX + document.body.scrollLeft - elemLeft;
y = evt.touches[0].pageY + document.body.scrollTop - elemTop;
} else {
x = evt.touches[0].clientX + document.body.scrollLeft - elemLeft;
y = evt.touches[0].clientY + document.body.scrollTop - elemTop;
}
} else if (evt.clientX || ev.clientY) {
x = evt.clientX + document.body.scrollLeft - elemLeft;
y = evt.clientY + document.body.scrollTop - elemTop;
} else {
x = evt.pageX + document.body.scrollLeft - elemLeft;
y = evt.pageY + document.body.scrollTop - elemTop;
}


document.getElementById('dtext').innerHTML+='<p style="position:absolute;font-size:10px;font-family:Arial;left:' + x + 'px;top:' + y + 'px;z-index:98;">' + lasttext + '</p>';

document.getElementById('aemail').href+='&text' + textnum + '=' + encodeURIComponent('' + x + ',' + y + ',') + encodeURIComponent(lasttext.replace(/\<br\>/g, String.fromCharCode(10)));
document.getElementById('asms').href+='&text' + textnum + '=' + encodeURIComponent('' + x + ',' + y + ',') + encodeURIComponent(lasttext.replace(/\<br\>/g, String.fromCharCode(10)));
arest+='&text' + textnum + '=' + encodeURIComponent('' + x + ',' + y + ',') + encodeURIComponent(lasttext.replace(/\<br\>/g, String.fromCharCode(10)));
therest+='&text' + textnum + '=' + encodeURIComponent('' + x + ',' + y + ',') + encodeURIComponent(lasttext.replace(/\<br\>/g, String.fromCharCode(10)));
asmsurl+='&text' + textnum + '=' + encodeURIComponent('' + x + ',' + y + ',') + encodeURIComponent(lasttext.replace(/\<br\>/g, String.fromCharCode(10)));
aemailurl+='&text' + textnum + '=' + encodeURIComponent('' + x + ',' + y + ',') + encodeURIComponent(lasttext.replace(/\<br\>/g, String.fromCharCode(10)));
document.getElementById('tdright').innerHTML="  <span id=spemail><a target=_blank href='mailto:?subject=My%20Venn%20Diagram%20...%20best%20viewed%20in%20landscape%20...&body=" + encodeURIComponent((document.getElementById('myvenn').src + arest).replace((document.getElementById('myvenn').src + arest).split('?')[0].split('#')[0], document.URL.split('?')[0].split('#')[0])) + "' id=aemail title=Email>&#128231;</a></span>      <span id=spsms><a target=_blank onmouseover=\"if (smsee.length == 0 && origsmsurl.indexOf('sms:&') != -1) { smsee=prompt('Please enter SMS number to send to.', ''); if (smsee == null) { smsee=''; } else { origsmsurl=origsmsurl.replace('sms:&','sms:' + smsee + '&'); asmsurl=asmsurl.replace('sms:&','sms:' + smsee + '&'); this.href=asmsurl; } }\" ontouchstart=\"if (smsee.length == 0 && origsmsurl.indexOf('sms:&') != -1) { smsee=prompt('Please enter SMS number to send to.', ''); if (smsee == null) { smsee=''; } else { origsmsurl=origsmsurl.replace('sms:&','sms:' + smsee + '&'); asmsurl=asmsurl.replace('sms:&','sms:' + smsee + '&'); this.href=asmsurl; } }\" href='sms:&body=" + encodeURIComponent((document.getElementById('myvenn').src + arest).replace(document.getElementById('myvenn').src.split('?')[0].split('#')[0], document.URL.split('?')[0].split('#')[0])) + "' id=asms title=SMS>&#128223;</a></span><br><br>  <input id=ilp onblur=\"lasttext=this.value.replace(/\~\~/g, '<br>'); this.value=''; this.placeholder='Click where you want ... ' + lasttext.replace(/\<br\>/g, String.fromCharCode(10)); mvp.setAttribute('content','initial-scale=1'); document.getElementById('myvenn').scrollIntoView();\" placeholder='Enter text and later click place for it on Venn Diagram to left (line feed is ~~)' type=text style=width:500px; value=''></input>";
//alert( document.getElementById('aemail').outerHTML );
//alert( document.getElementById('asms').outerHTML );
textnum++;
lasttext='';
} else if (!evt || !normalcall) {
if (chd == '') {
answer=prompt("Enter delimited values string for Venn Diagram such that ... " + String.fromCharCode(10) + "The first three values specify the sizes of three circles: A, B, & C. For chart with only two circles, specify zero for the third value." + String.fromCharCode(10) + "The fourth value specifies the size of the intersection of A and B." + String.fromCharCode(10) + "The fifth value specifies the size of the intersection of A and C. For a chart with only two circles, do not specify a value here." + String.fromCharCode(10) + "The sixth value specifies the size of the intersection of B and C. For a chart with only two circles, do not specify a value here." + String.fromCharCode(10) + "The seventh value specifies the size of the common intersection of A, B, and C. For a chart with only two circles, do not specify a value here." + String.fromCharCode(10) + String.fromCharCode(10) + "", (chd == '' ? "100,80,60,30,30,30,10" : (chd.replace('t:',''))));
} else {
answer=prompt("Enter delimited values string for your Venn Diagram collaborations, optionally, such that ... " + String.fromCharCode(10) + "The first three values specify the sizes of three circles: A, B, & C. For chart with only two circles, specify zero for the third value." + String.fromCharCode(10) + "The fourth value specifies the size of the intersection of A and B." + String.fromCharCode(10) + "The fifth value specifies the size of the intersection of A and C. For a chart with only two circles, do not specify a value here." + String.fromCharCode(10) + "The sixth value specifies the size of the intersection of B and C. For a chart with only two circles, do not specify a value here." + String.fromCharCode(10) + "The seventh value specifies the size of the common intersection of A, B, and C. For a chart with only two circles, do not specify a value here." + String.fromCharCode(10) + String.fromCharCode(10) + "", (chd == '' ? "100,80,60,30,30,30,10" : (chd.replace('t:',''))));
}
vals=[];
if (answer != null) {
answer=answer.trim();
if (answer.trim() != '') {
var delimis='';
for (var ii=0; ii<answer.length; ii++) {
if (delimis == '' && (answer.substring(ii).substring(0,1) < '0' || answer.substring(ii).substring(0,1) > '9')) {
delimis=answer.substring(ii).substring(0,1);
}
}
}
if (delimis != '') {
vals=answer.split(delimis);
}
if (vals.length == 6 || vals.length == 7) {
answertherest=prompt('Any optional legend or title argument snippets? Eg. &chdl=A|B|C&chtt=My%20Venn%20Diagram&chco=ff0000,00ff00,0000ff', therest);
if (answertherest == null) { answertherest=''; }
therest=answertherest.trim();
var aone=1;
var plotstring='';
var flds=[];
if (therest.indexOf('&text' + aone + '=') != -1) {
while (therest.indexOf('&text' + aone + '=') != -1) {
if (chd == '') {
plotstring=decodeURIComponent(therest.split('&text' + aone + '=')[1].split('&')[0]);
while (plotstring.indexOf(String.fromCharCode(10)) != -1) {
plotstring=plotstring.replace(String.fromCharCode(10), '<br>');
}
flds=plotstring.split(',');
if (eval('' + flds.length) >= 3) {
document.getElementById('dtext').innerHTML+='<p style="position:absolute;font-size:10px;font-family:Arial;left:' + flds[0] + 'px;top:' + flds[1] + 'px;z-index:98;">' + plotstring.split('' + flds[0] + ',' + flds[1] + ',')[1] + '</p>';
}
}
aone++;
textnum=aone;
}
}
//document.getElementById('myvenn').style.backgroundImage='URL(//www.rjmprogramming.com.au/ITblog/' + Math.min(550,window.innerWidth) + '/' + Math.min(350,window.innerHeight) + '/?cht=v&chd=t:' + encodeURIComponent(answer + therest) + ')';
document.getElementById('myvenn').src='//www.rjmprogramming.com.au/ITblog/' + Math.min(550,window.innerWidth) + '/' + Math.min(350,window.innerHeight) + '/?cht=v&chd=t:' + encodeURIComponent(answer) + therest + '';
if (document.getElementById('tdright').innerHTML == '') {
document.getElementById('tdright').innerHTML="  <span id=spemail><a target=_blank href='mailto:?subject=My%20Venn%20Diagram%20...%20best%20viewed%20in%20landscape%20...&body=" + encodeURIComponent((document.getElementById('myvenn').src + arest).replace(document.getElementById('myvenn').src.split('?')[0].split('#')[0], document.URL.split('?')[0].split('#')[0])) + "' id=aemail title=Email>&#128231;</a></span>      <span id=spsms><a target=_blank onmouseover=\"if (smsee.length == 0 && origsmsurl.indexOf('sms:&') != -1) { smsee=prompt('Please enter SMS number to send to.', ''); if (smsee == null) { smsee=''; } else { origsmsurl=origsmsurl.replace('sms:&','sms:' + smsee + '&'); asmsurl=asmsurl.replace('sms:&','sms:' + smsee + '&'); this.href=asmsurl; } }\" ontouchstart=\"if (smsee.length == 0 && origsmsurl.indexOf('sms:&') != -1) { smsee=prompt('Please enter SMS number to send to.', ''); if (smsee == null) { smsee=''; } else { origsmsurl=origsmsurl.replace('sms:&','sms:' + smsee + '&'); asmsurl=asmsurl.replace('sms:&','sms:' + smsee + '&'); this.href=asmsurl; } }\" href='sms:&body=" + encodeURIComponent((document.getElementById('myvenn').src + arest).replace(document.getElementById('myvenn').src.split('?')[0].split('#')[0], document.URL.split('?')[0].split('#')[0])) + "' id=asms title=SMS>&#128223;</a></span><br><br>  <input id=ilp onblur=\"lasttext=this.value.replace(/\~\~/g, '<br>'); this.value=''; this.placeholder='Click where you want ... ' + lasttext.replace(/\<br\>/g, String.fromCharCode(10));\" placeholder='Enter text and later click place for it on Venn Diagram to left (line feed is ~~)' type=text style=width:500px; value=''></input>";
}
} else {
alert('Try again.');
ask(null);
}
}
}
atstart=false;
normalcall=true;
}

… in our changed second draft image_venn.html Google Chart Image Chart Venn Chart interfacing web application you can also try below.

Did you know?

As far as this WordPress blog’s 404.php role goes in all this, we were keen to maintain Venn Diagrams that were purely image based data, because the web browser sharing mechanisms are so much better this way, else we were tempted to just construct a webpage HTML dataset positioning text in an absolute way with a Venn Chart background image. In order to do these purely image based Venn Diagrams we used PHP’s GD image library as per

<?php

if (strpos(('?' . $_SERVER['QUERY_STRING']), '?cht=') !== false || strpos(('?' . $_SERVER['QUERY_STRING']), '&cht=') !== false) {

$theqs=str_replace('??','?',('?' . $_SERVER['QUERY_STRING']));
if (strpos($theqs, '?chs=') === false && strpos($theqs, '&chs=') === false) {
$theqs='?chs=' . $newWidth . 'x' . $newHeight . '&' . explode('?', $theqs)[1];
}

if (strpos(('?' . $_SERVER['QUERY_STRING']), 'text1=') !== false) {
$theone=2;
$im = imagecreatefromstring(file_get_contents('ht
tp://chart.googleapis.com/chart' . explode('&text1=', $theqs)[0]));

if (7 == 7) {

$plotstring=str_replace('+',' ',urldecode($_GET['text1']));
$csv=explode(',', $plotstring);
$black = imagecolorallocatealpha($im, 1, 1, 1, 0);
if (sizeof($csv) >= 3) {
try {
if (function_exists('imagettftext')) {
if (explode('' . $csv[0] . ',' . $csv[1] . ',', $plotstring)[1] !== '') {
//echo explode('' . $csv[0] . ',' . $csv[1] . ',', $plotstring)[1];
//exit;
imagettftext($im, 10, 0, $csv[0], $csv[1], $black, realpath('arial.ttf'), explode('' . $csv[0] . ',' . $csv[1] . ',', $plotstring)[1]);
}
}
} catch (Exception $e) { }
while (isset($_GET['text' . $theone])) {
$plotstring=str_replace('+',' ',urldecode($_GET['text' . $theone]));
$csv=explode(',', $plotstring);
if (sizeof($csv) >= 3) {
try {
if (function_exists('imagettftext')) {
if (explode('' . $csv[0] . ',' . $csv[1] . ',', $plotstring)[1] !== '') {
imagettftext($im, 10, 0, $csv[0], $csv[1], $black, realpath('arial.ttf'), explode('' . $csv[0] . ',' . $csv[1] . ',', $plotstring)[1]);
}
}
} catch (Exception $e) { }
}
$theone++;
}
}

}


header('Content-Type: image/png');

imagepng($im);
imagedestroy($im);
} else {

header('Content-Type: image/png');
echo file_get_contents('http://chart.googleapis.com/chart' . $theqs);
}
exit;

}

?>


Previous relevant Google Chart Image Chart Venn Chart Interfacing Primer Tutorial is shown below.

Google Chart Image Chart Venn Chart Interfacing Primer Tutorial

Google Chart Image Chart Venn Chart Interfacing Primer Tutorial

So, moving on from Google Charts Image Chart Map Charts, today, let’s turn our attention to Google Charts Image Chart Venn Charts which we were dead set curious about given work we’d done in the past regarding Venn Diagrams, which we referenced when we presented Flowchart and Venn Diagram and Mind Map Token Subject Emoji Tutorial some time back. Gobsmackingly good is the Google approach, again, as you’d expect, but the approach covers different ground, so one feels one should go back to Primary School! You thought we were going to give away the answer to one of those security questions, didn’t you?! Didn’t you!?! Well, the answer is “Gryffindor Slytherin Ravenclaw Hufflepuff Junior Business College” … if you must know.

The sharing capabilities are good with the Google Charts approach too, given we are creating an HTML image, as our WordPress blog good ol’ 404.php has been woken up to address via …

<?php

if (strpos(('?' . $_SERVER['QUERY_STRING']), '?cht=') !== false || strpos(('?' . $_SERVER['QUERY_STRING']), '&cht=') !== false) {

$theqs=str_replace('??','?',('?' . $_SERVER['QUERY_STRING']));
if (strpos($theqs, '?chs=') === false && strpos($theqs, '&chs=') === false) {
$theqs='?chs=' . $newWidth . 'x' . $newHeight . '&' . explode('?', $theqs)[1];
}


header('Content-Type: image/png');
echo file_get_contents('http://chart.googleapis.com/chart' . $theqs);
exit;

}

?>

Yes, all these Image Chart smarts come, essentially, from a “one line” calling URL! Who’d have believed it! Shiver me timbers!

Well, it’s early days with this Venn Chart interfacing where we allow for …

  • circle (think up to three) definition … and the rest, in this first draft (hoping you’ve done some reading)
  • legend and title and colour selection user definitions dumped into a fairly unfriendly “the rest” Javascript prompt entry we ask of the user should they go ahead with the previous definition … and …
  • sharing and collaboration email and SMS functionality

… we hope you try via our “proof of concept” first draft image_venn.html Google Chart Image Chart Venn Chart interfacing web application you can also try below …


If this was interesting you may be interested in this too.


If this was interesting you may be interested in this too.


If this was interesting you may be interested in this too.


If this was interesting you may be interested in this too.


If this was interesting you may be interested in this too.


If this was interesting you may be interested in this too.


If this was interesting you may be interested in this too.


If this was interesting you may be interested in this too.


If this was interesting you may be interested in this too.


If this was interesting you may be interested in this too.


If this was interesting you may be interested in this too.


If this was interesting you may be interested in this too.


If this was interesting you may be interested in this too.


If this was interesting you may be interested in this too.


If this was interesting you may be interested in this too.


If this was interesting you may be interested in this too.


If this was interesting you may be interested in this too.


If this was interesting you may be interested in this too.


If this was interesting you may be interested in this too.


If this was interesting you may be interested in this too.


If this was interesting you may be interested in this too.


If this was interesting you may be interested in this too.


If this was interesting you may be interested in this too.

Posted in eLearning, Event-Driven Programming, Tutorials | Tagged , , , , , , , , , , , , , , , , , , , , , , , , , , , , , , , , , , , , , , , , , , , , , , , , , , , , , , , , , , , , , , , , , , | Leave a comment