We’ve found a new reason to tinker with deliberate image blurring on top of the usual …
- hiding sensitive data on images (where we find Gimp very good to use)
- as an SVG filter as used in Gimp Guillotine Follow Up SVG Filter Tutorial
- video blurring effects (via CSS “blur” filter) as shown at Video via Image Filter and Canvas Magnifier Tutorial … and now, today, we’re interested because …
- a game we’ve opened up to being an Inline HTML Email Form quiz benefits from having a “blurred” (actually bad resolution) image presented in an email
… stemming from a renewed desire to exhaust our interest in …
- data-URI image
- Inline HTML Email
… readily admitting that Gmail Webmail (email client) is a no go, but Apple Mail is a go, so we will offer an “a” link alternative for those email clients that do not allow data-URI images.
Our other interest was whether we could involve Google Charts directly in an Inline HTML Email. Well, it pans out … “not directly” … but what if we make use of the great Google Page Insights webpage screenshotting “smarts” (that we combine with Ajax). We were wary of URLs presented to Google Page Insights that involved “&” (second and on) argument delimiters, but on revisiting this, pleasantly surprised by these URLs working to …
- present a Google Chart after asking the user for graph drawing parameters
- those parameters allowing for a quiz emailee address to be defined, in which case …
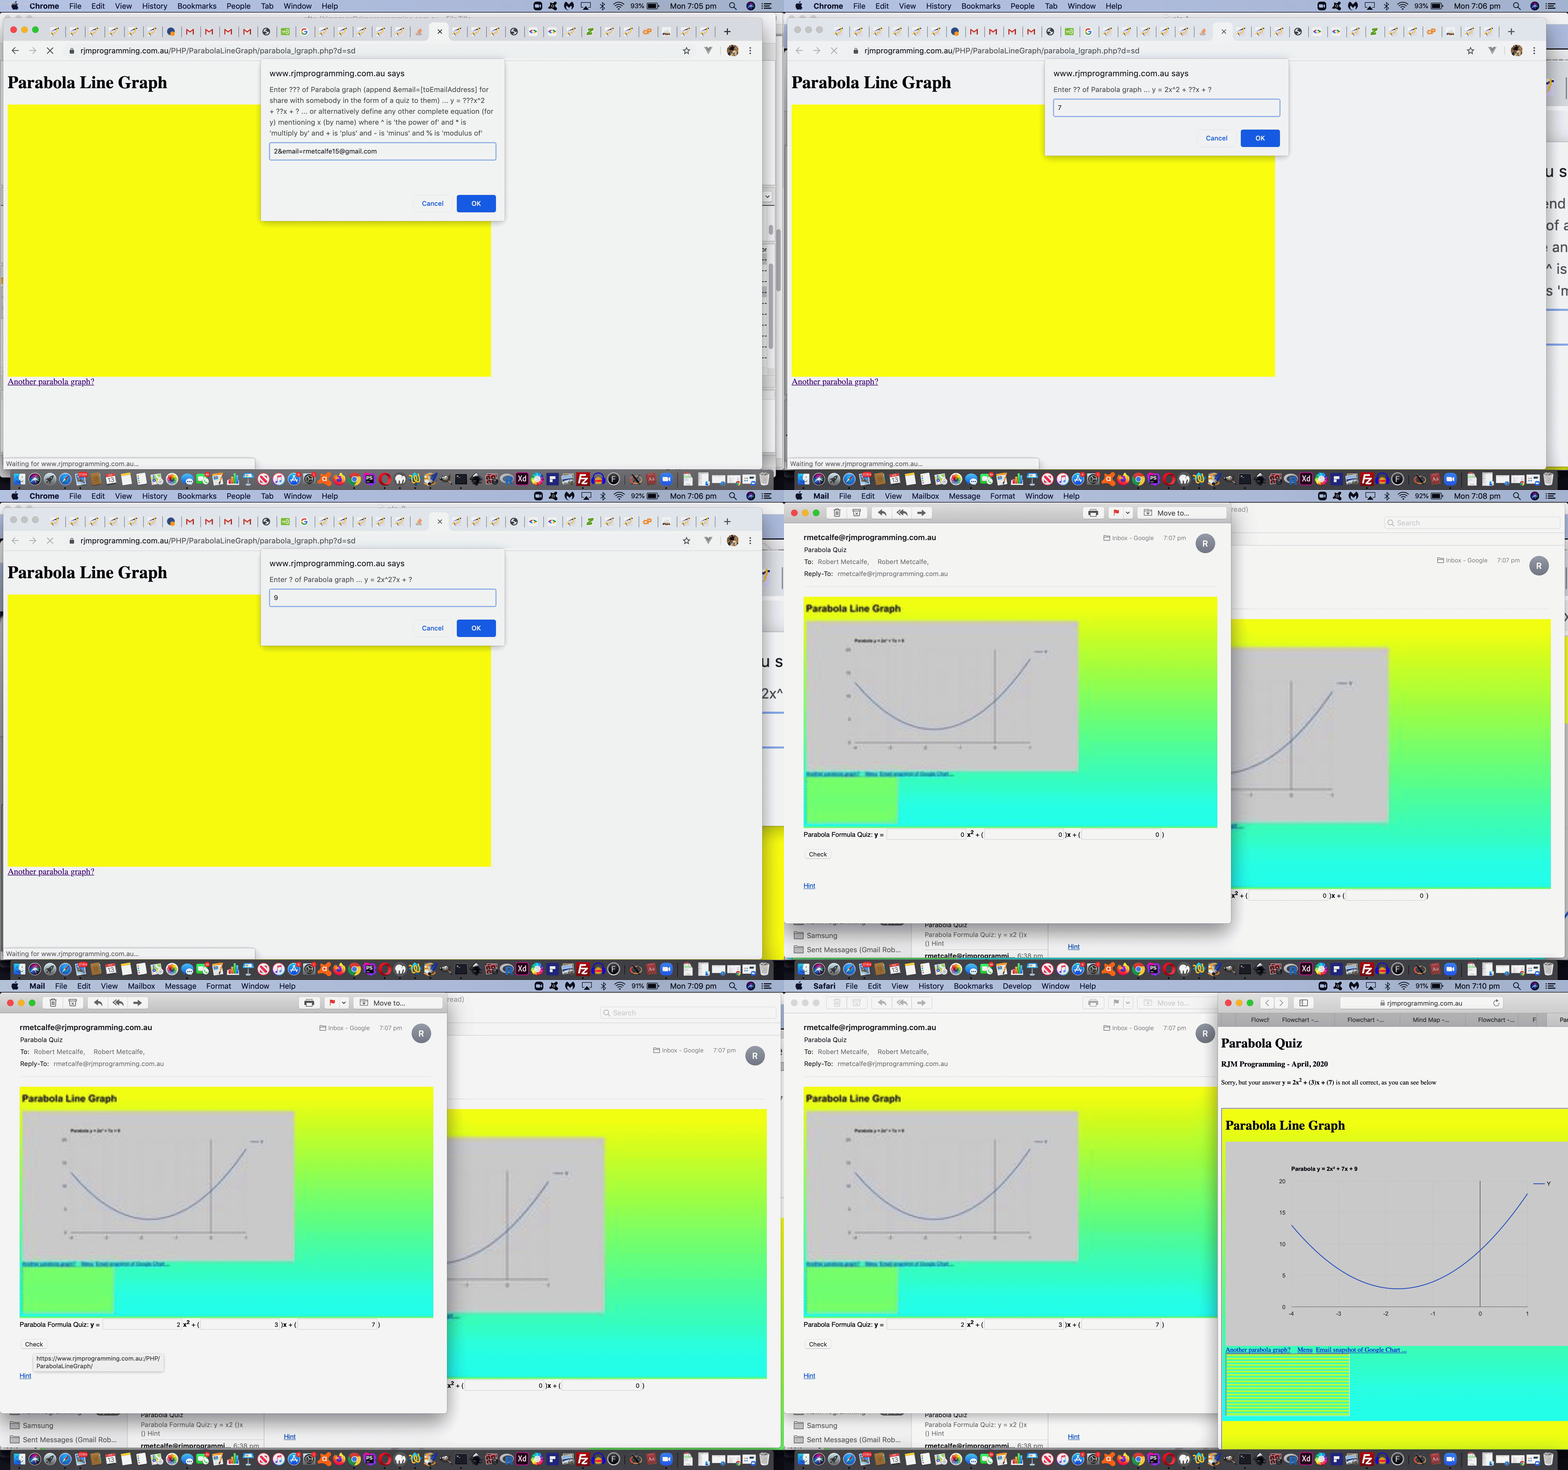
- the PHP web application, building on the previous one of Mathematics Equation Google Chart Line Chart Primer Tutorial calls Google Page Insights to receive a data-URI string as the “src” parameter for an “img” element that shows …
- in an Apple Mail (but not Gmail Webmail) email this data-URI (user defined parabola) image shows very blurry, too blurry to make out the numbers, so …
- as a quiz for that emailee we can ask them to try to guess what the user placed for …
y = ?x2 + (?)x + (?)
… but … - to avoid too much frustration, we offer a pretty helpful “Hint” link both for Gmail Webmail users (who will not see that data-URI image) and other users a tad worried by image blurriness you can see in today’s animated GIF presentation
And so there is now a new “Parabola Quiz” component to this Parabola Equation PHP (and Google Chart Line Chart interfacing) web application for you to try with the live run that you could call parabola_lgraph.php and which changed in this way.
Previous relevant Mathematics Equation Google Chart Line Chart Primer Tutorial is shown below.
In the recent Mathematics Equation Backtracking Game Primer Tutorial we found that there was not much to do to consider the drawing and display of a straight line by saying the a in …
Y = aX2 + bX + c
… is zero … and this turned the parabola data our Google Chart Parabola Line Graph code was initially designed for, into code that could display a straight line. But what about other equations? Well, we think the same code should suffice for that too, though we have to rearrange a fair bit more for that idea in the code, and ask a lot of the user. They use the ^ for “power of” for instance, and we’re sure we’ll think of more issues with requirements on this as time goes on, but the initial extension to functionality thoughts here swirled around equations where the most complex it gets for a parabola is “to the power of” 2. What about equations of curves of other powers bigger than 2 and less than 1, including negative powers. Given some suitable entries by the user, this is now possible using this same one codebase utilising the Google Chart Line Chart web application interface with this live run that you could call parabola_lgraph.php and which changed in this way. So you can look at today’s tutorial picture, and below we’d like to show you a Cubic Polynomial, as we found discussed at this useful link, thanks.
If this was interesting you may be interested in this too.
If this was interesting you may be interested in this too.


