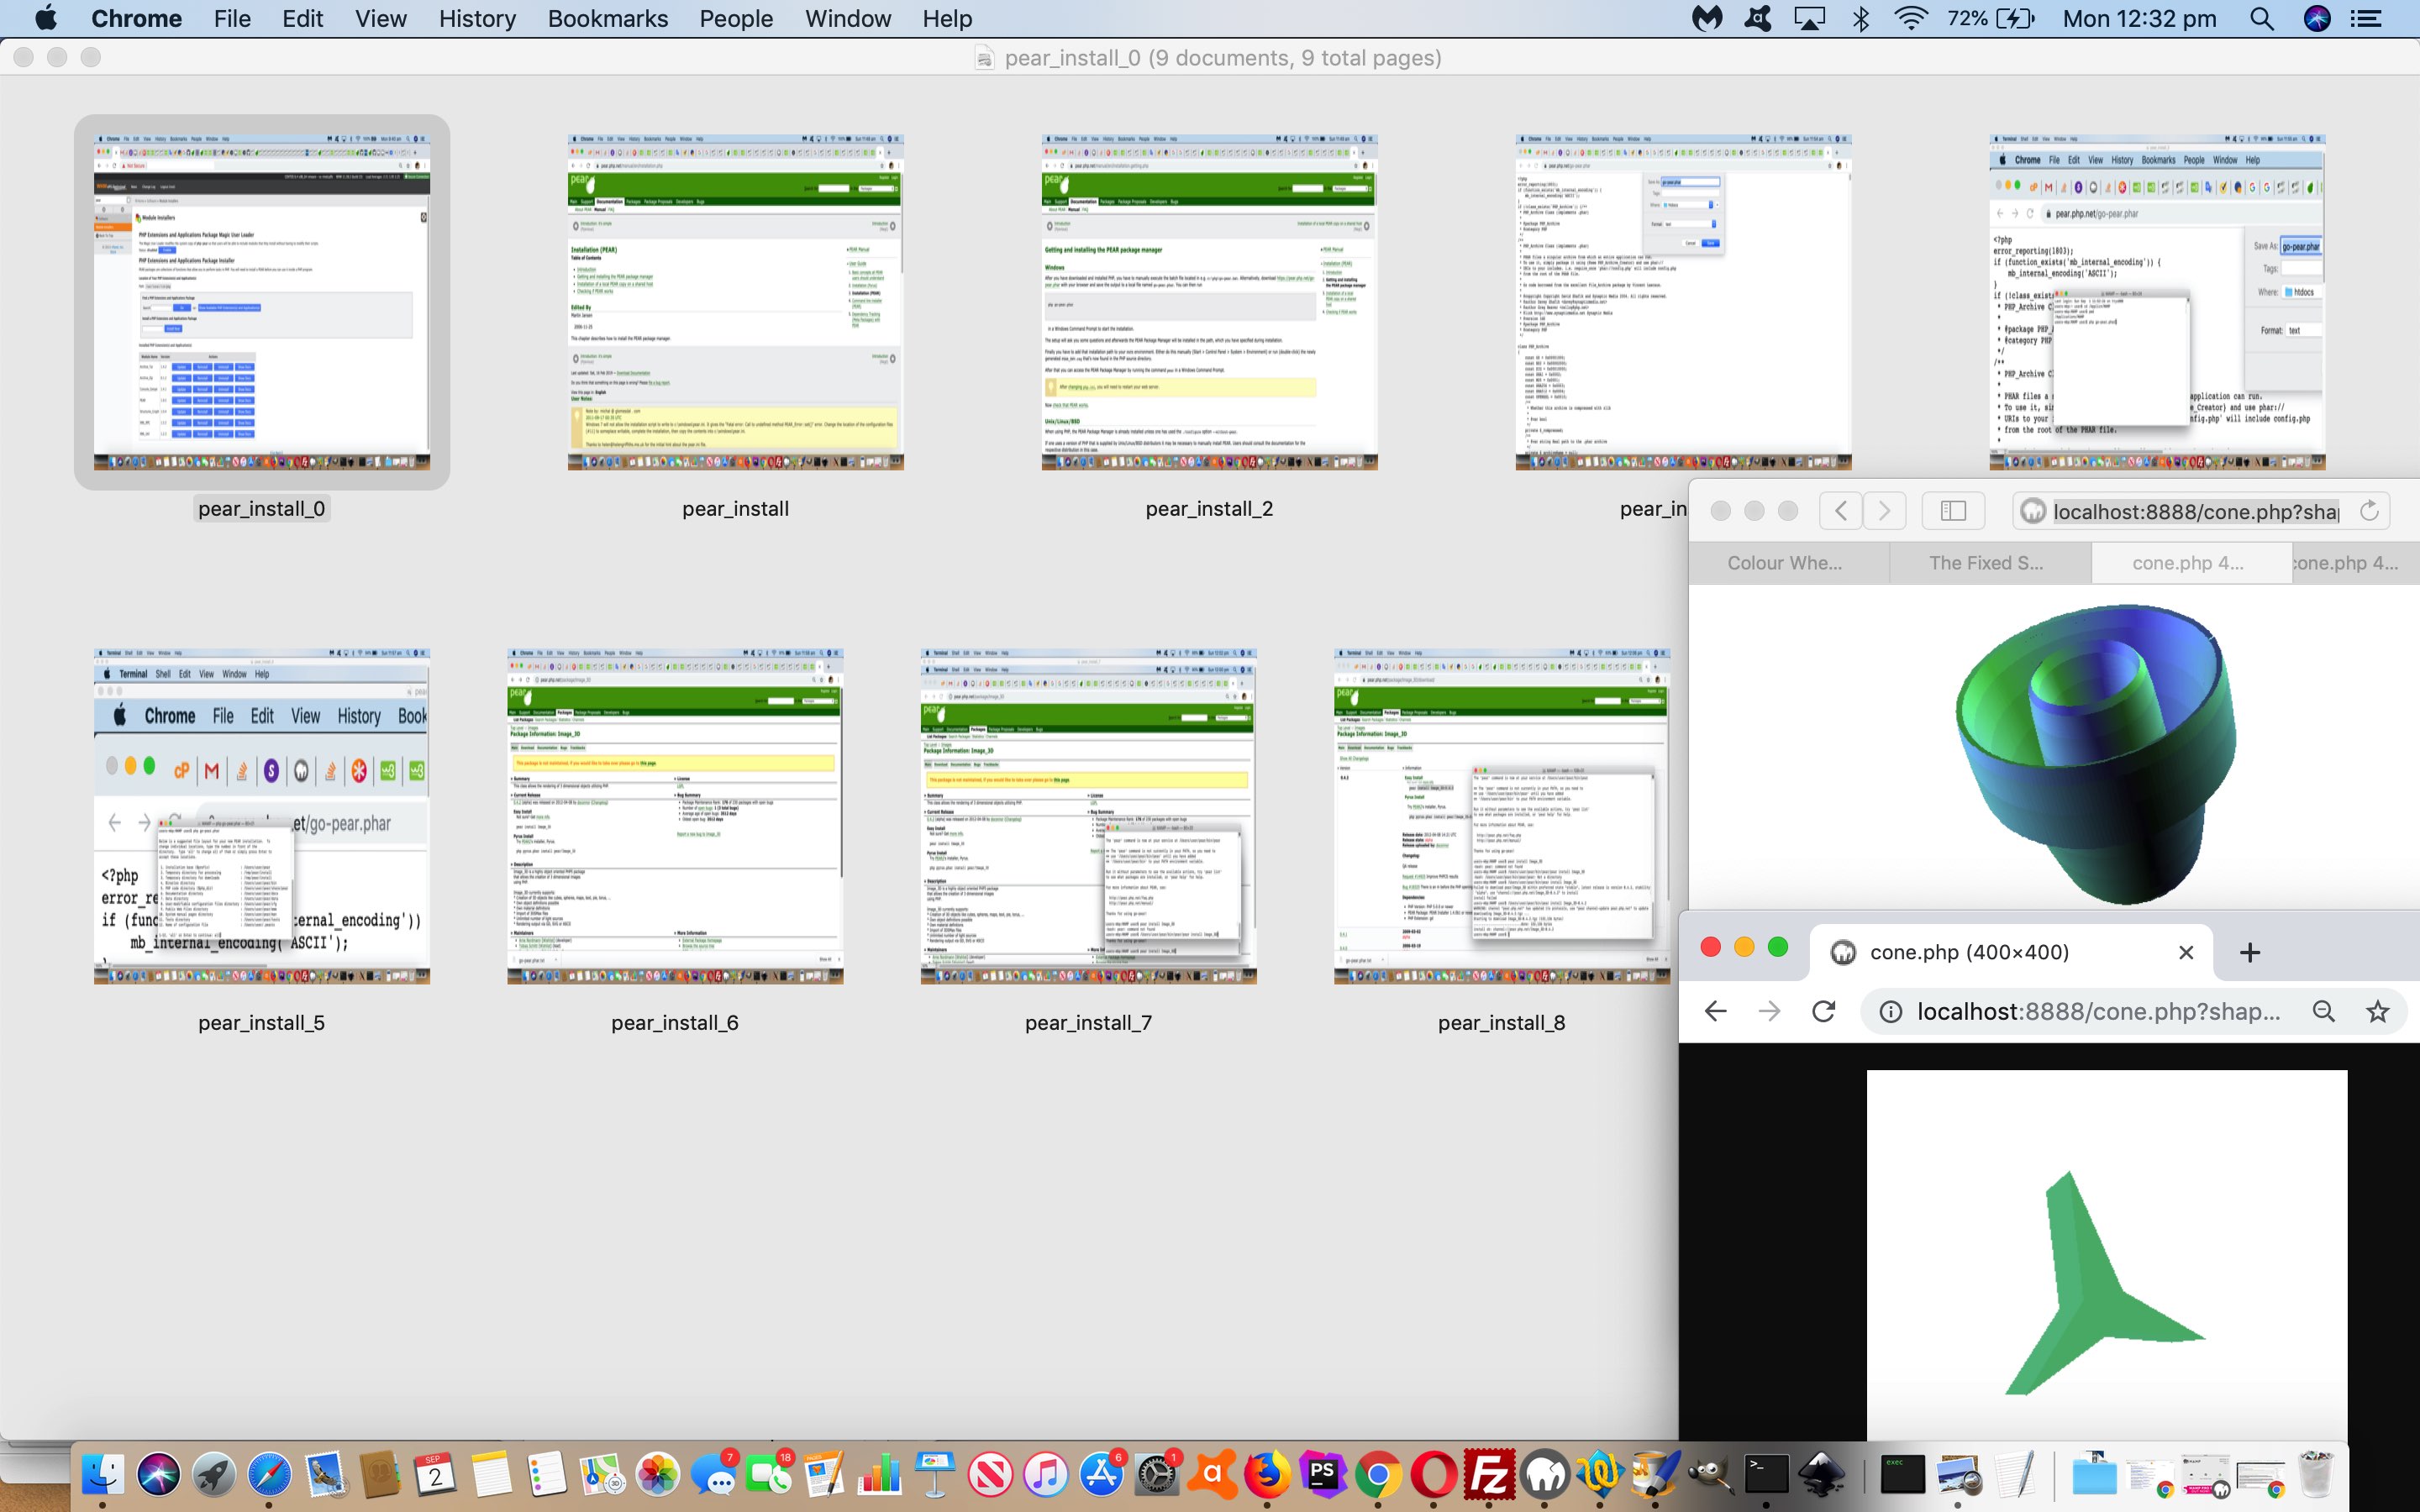
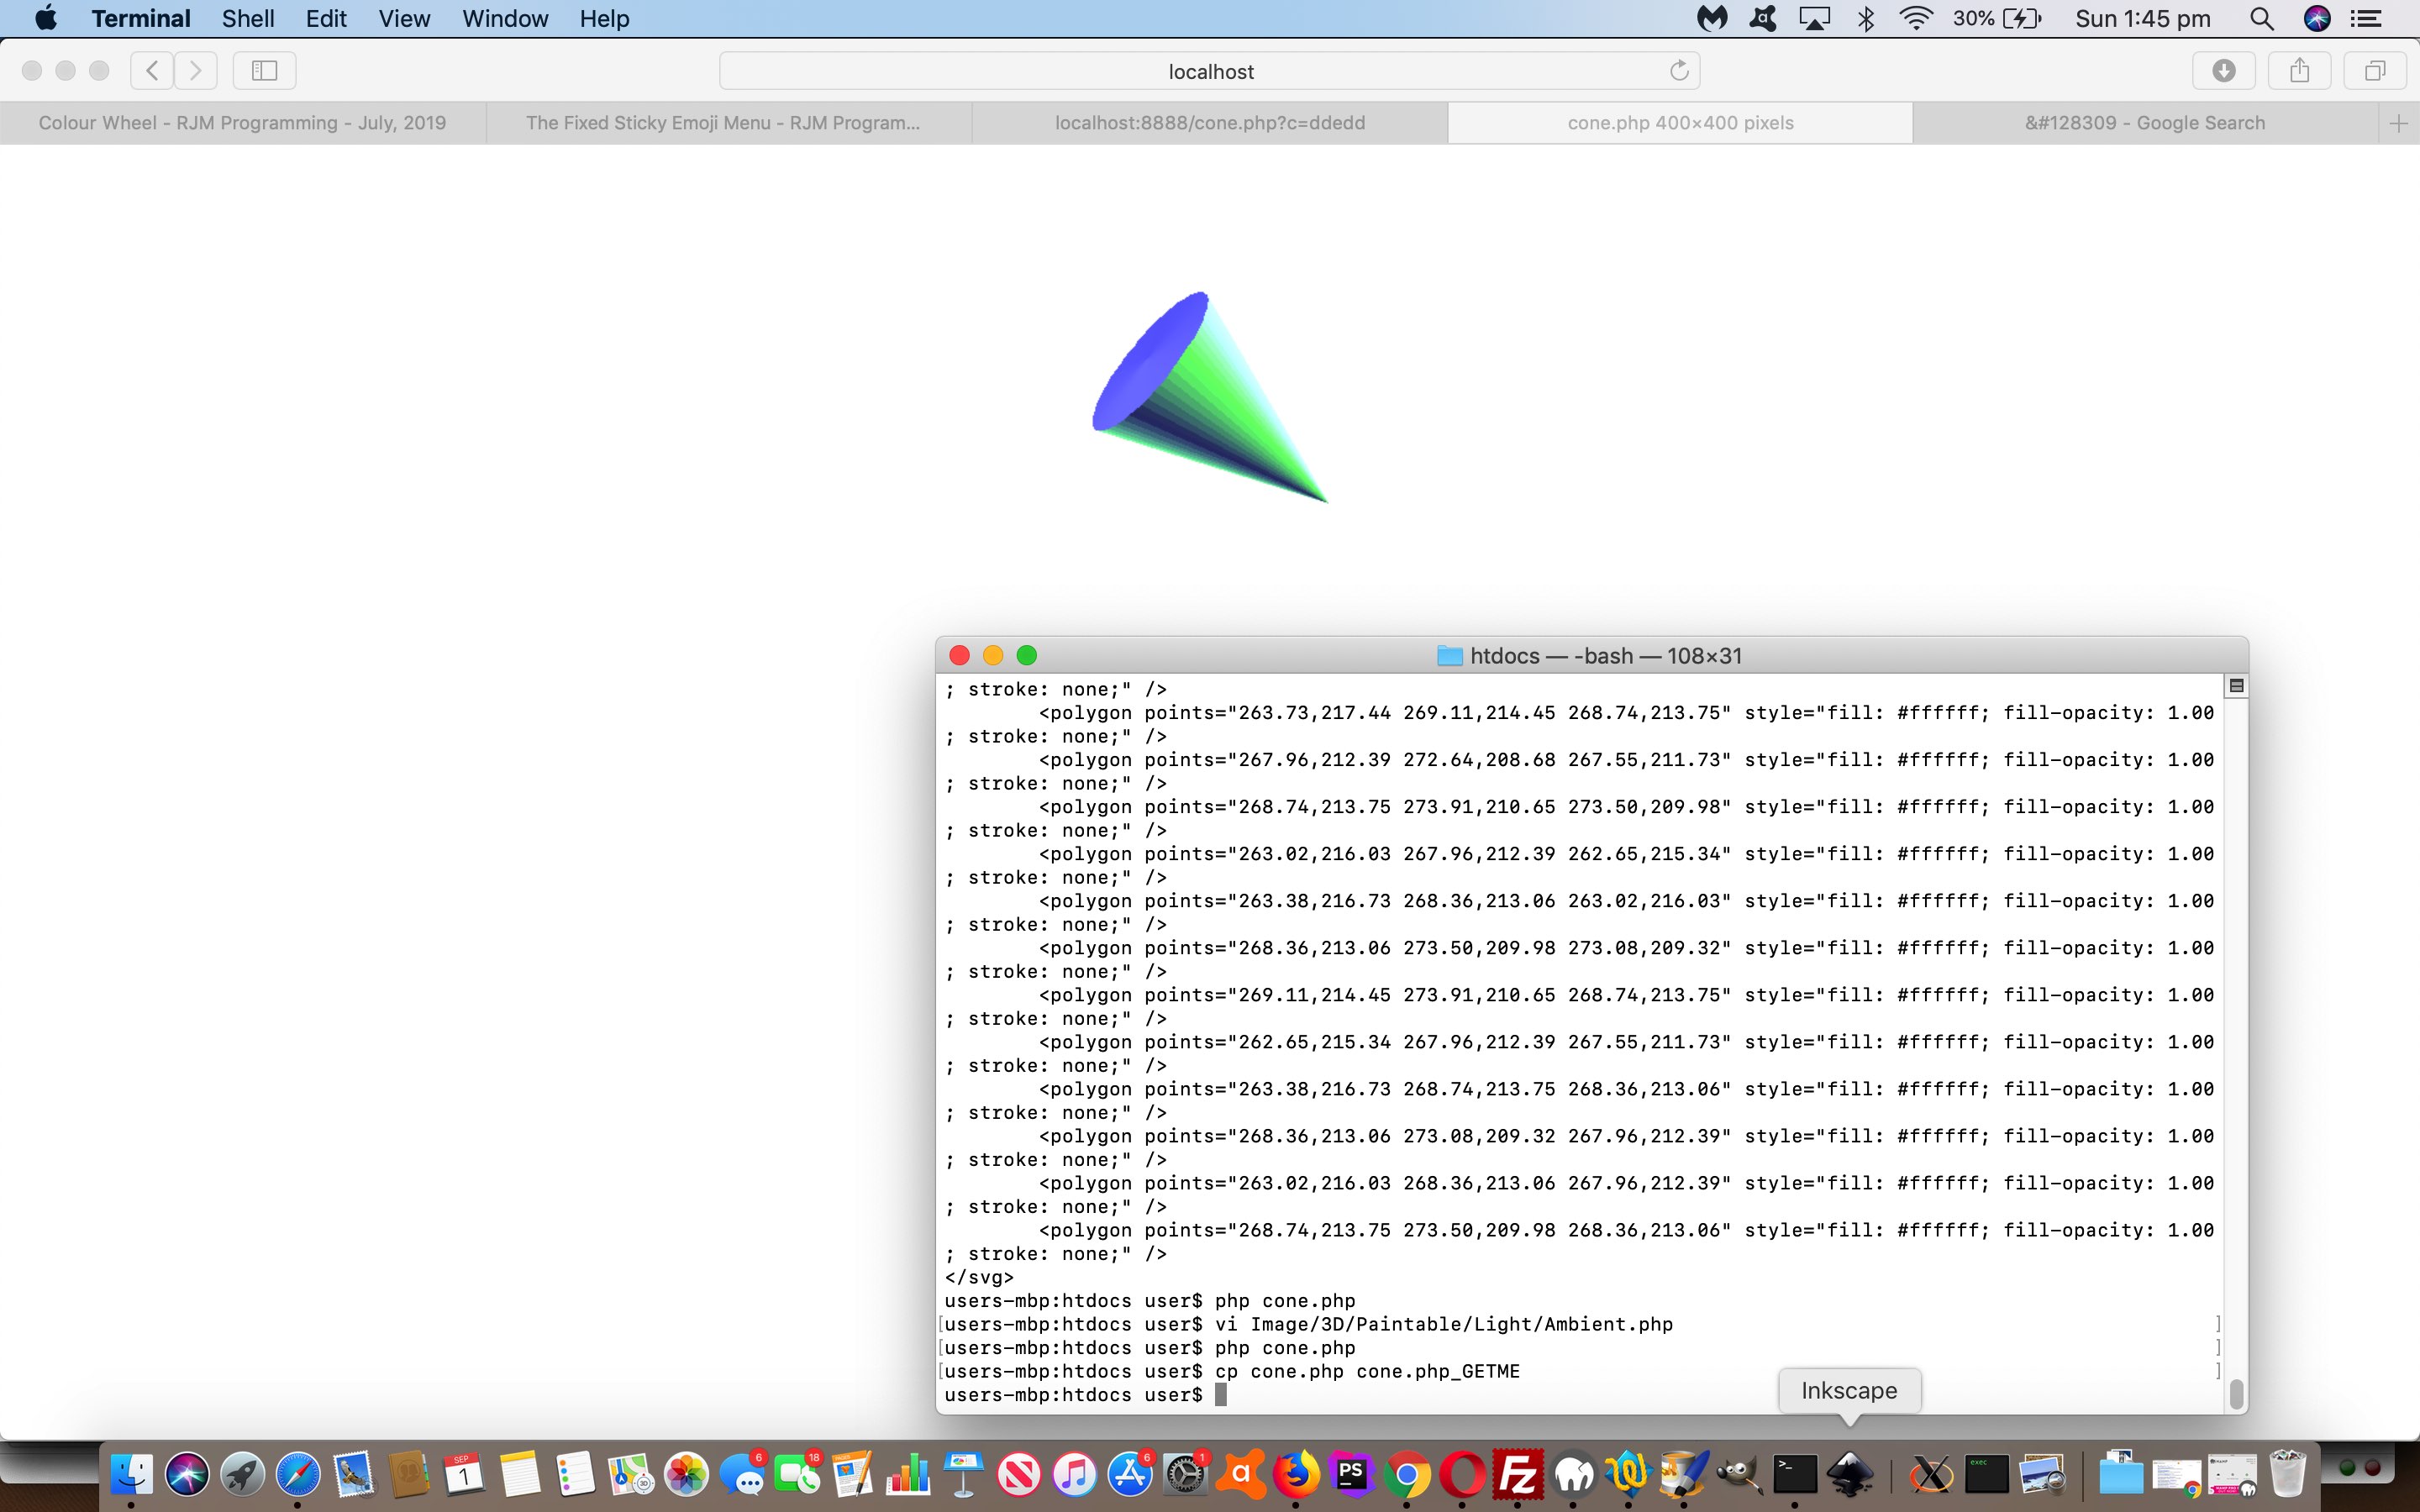
Yesterday’s Image_3D PHP Package Primer Tutorial introduced for this blog the very useful looking PHP “Image_3D” (3D graphics) package. But how did we reach this discovery? Well, it comes from “cPanelling” around, a faux verb an Apache web administrator will probably understand. The cPanel web server administrative suite of software has a vast number of features, and under …
Module Installers
… you’ll see there a pretty old installer, now, called Pear (the PHP Extension and Application Repository), which we’d never used, but were curious about, so we tried the link chain …
PHP Documentation -> Documentation of PEAR and the various packages -> Pear Packages -> Pear Package Image_3D
… which got us to thinking to deploy that to our PHP 7 (Image_3D needs PHP 5 or above) local MAMP web server system. To do this we needed to install Pear itself via …
- download from https://pear.php.net/go-pear.phar … to Downloads …
- copy to /Applications/MAMP …
- be in Terminal …
- cd /Applications/MAMP
- php go-pear.phar
- can add Pear to PATH (for “pear install Image_3D” command) or apply the “longhand” (in our case) /Users/user/pear/bin/pear install Image_3D
… and which you can see a lot of examining today’s PDF slideshow.
Apply that knowledge and software development over to the rjmprogramming.com.au domain, and then you can take a look at some new shapes (thanks to Paint 3-D images with PHP) we’ve added for the changed cone.php‘s live run (of a cone) link …
| Spherocube (metal) |
|---|
| Helicoid (metal) |
| Star (metal) |
| Bundt (metal) |
Stop Press
Word of caution here. We discovered a link you can read about with MacBook Pro Diskspace Issue Troubleshoot Tutorial regarding a security issue with Pear. You may want to read this first.
Previous relevant Image_3D PHP Package Primer Tutorial is shown below.
Today, we’re starting out on a new 3d graphics idea, talking about a PHP package named “Image_3D” written by Arne Nordmann, Tobias Schlitt and Kore Nordmann. You may recall an alternative 3d graphics idea called WebGL talked about with the thread of blog postings down from WebGL Prism Canvas Email Tutorial.
We installed “Image_3D” via the Pear PHP installer, but we shall talk more about that tomorrow. For today, it is more “proof of concept” territory, taking leads from the excellent Paint 3-D images with PHP resource we thank profusely.
So take a look at …
| Cone (metal) |
|---|
| Sphere (metal) |
| Torus (metal) |
| Cube (metal) |
… and at this starting PHP cone.php‘s live run (of a cone) link.
Previous relevant WebGL Prism Canvas Email Tutorial is shown below.
Today we’re revisiting our “Convex Polygon shape with an added dimension by displaying its 3D prism equivalent via the WebGL API scenario”, we last talked about with PHP and Javascript and CSS WebGL Prism Tutorial as shown below. We revisit with a view to …
- make it more aesthetically pleasing, we hope
- centre the main graphical elements of the web application when unsupervised and avoid our old “sinful” align=’center’ “habit” usage we talked about at W3C XHTML Nu Checker Validation Primer Tutorial going on, which we diligently changed to style=” width:100%;text-align:center; “ here today … when unsupervised, but …
- left justify the main graphical elements of the web application when supervised, so this involved detecting “supervision” and Javascript DOM changes at …
window.onload = function init() {

    if (document.URL.indexOf('huh=') != -1 || parent.document.getElementById('glcanvas') != null || (document.referrer.indexOf('/HTMLCSS/ShapeDraw') != -1 && document.referrer.indexOf('.htm') == -1)) {

      document.getElementById('myform').innerHTML+='<input type=hidden name=huh value=></input>';

      document.getElementById('mydiv').style.position='absolute';

      document.getElementById('mydiv').style.top='0px';

      document.getElementById('mydiv').style.left='0px';

      document.getElementById('mydiv').style.width='300px';

      document.getElementById('mydiv').style.textAlign='left';

      document.getElementById('mydiv').innerHTML='<canvas id="gl-canvas" width="300" height="300"></canvas>';

      document.getElementById('mydiv2').style.position='absolute';

      document.getElementById('mydiv2').style.top='310px';

      document.getElementById('mydiv2').style.left='0px';

      document.getElementById('mydiv2').style.textAlign='left';

      document.getElementById('mydiv3').style.position='absolute';

      document.getElementById('mydiv3').style.top='330px';

      document.getElementById('mydiv3').style.left='0px';

      document.getElementById('mydiv3').style.textAlign='left';

    } else {

      document.getElementById('mydiv').innerHTML='<canvas id="gl-canvas" width="400" height="400"></canvas>';

    }


    canvas = document.getElementById( "gl-canvas" );

    // more follows ...
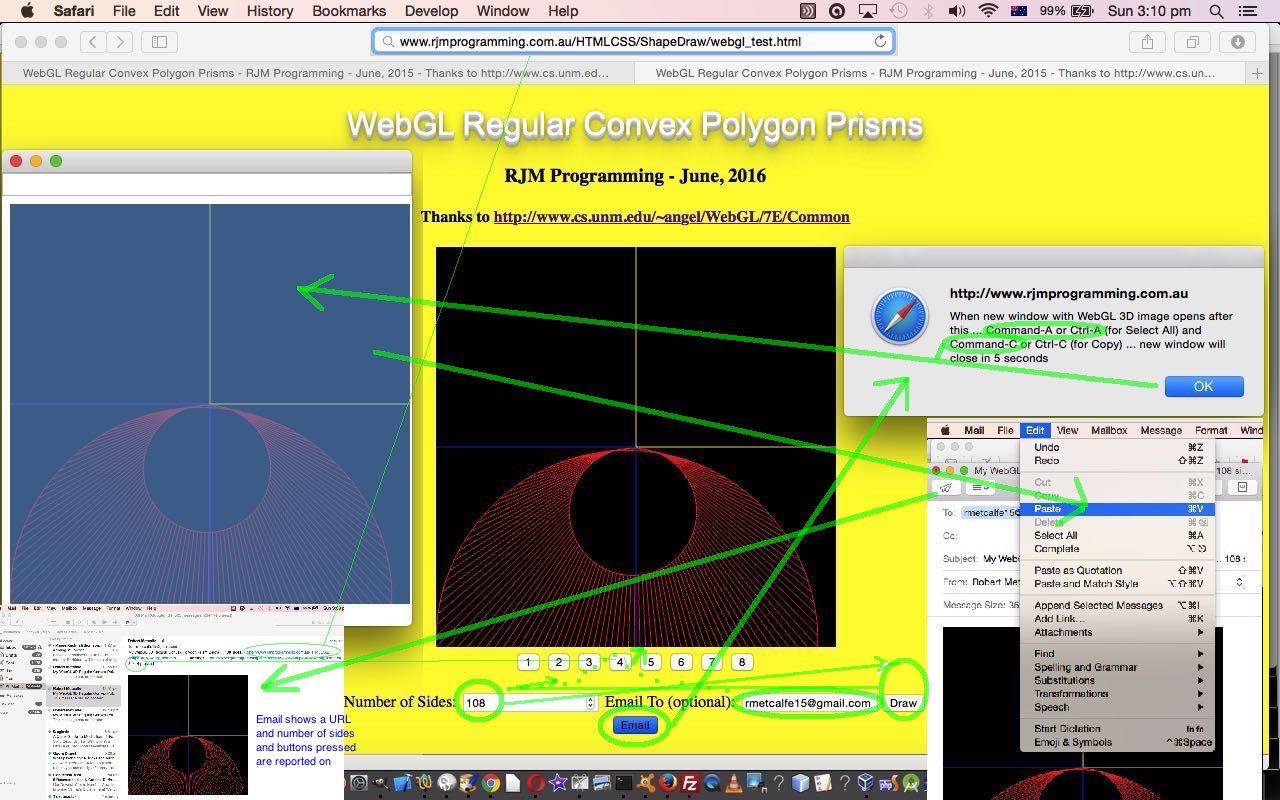
- adding new Email functionality via mailto: tags linking to the user’s default Email client program, featuring the ability to …
- have the body section of that email be able to have a clipboard image pasted into it, for which we can utilize HTML5 canvas element’s toDataURL() method, teamed up with a window.open popup window of the toDataURL image data, which can be selected and copied, optionally, by the user themselves, should they wish this to make their email more self explanatory … and that canvas element’s “meeting of minds” with WebGL changing as per …
gl = WebGLUtils.setupWebGL( canvas, {preserveDrawingBuffer:true} );
… the help for which we got great ideas from this useful link, thanks, and which allows the canvas element content to be retained long enough to be available for the toDataURL() call of it
As we’ve said before about email, as a communication tool, its use can add a lot of accountability to your web applications, as well as being a great “sharing” method.
So please feel free to try …
- an unsupervised live run
- a supervised live run
- HTML and Javascript and CSS (supervised) webgl_test.html …
- changed in this way …
- PHP (supervisor) ShapeDraw.php is unchanged
- see today’s tutorial picture up close
When will we see you … again … da, da da, da da?
Previous relevant PHP and Javascript and CSS WebGL Prism Tutorial is shown below.
To infinity and beyond!! … well, at least to the 3rd dimension … yes, we’re rejoining our Geometry and Land Surveying theme today, rejoining the discussion of PHP and Javascript and CSS Shape Rotation Tutorial as shown below, but giving some additional functionality to show the Convex Polygon shape with an added dimension by displaying its 3D prism equivalent via the WebGL API, modelling the additional code via the public generosity and wonderful resources from the University of New Mexico … our heartfelt thanks.
If you have been a recent reader you’ll have seen that we have been discussing OpenGL. OpenGL has a OpenGL.org landing page which will talk about all the platforms supported, and let’s just remind you about the purpose, with a quote from the webpage …
The Industry’s Foundation for High Performance Graphics
from games to virtual reality, mobile phones to supercomputers
… well, today, we use some of that knowledge … some being the operative word, and we’ll talk more on this tomorrow, but … with the sequence of blog posts culminating in C++ OpenGL in Xcode Generic Regular Prism Drawing Tutorial we learnt some things about graphics software and the concepts of …
- object vertices definition
- object colour
- lighting … direction, type, angle, numbers of sources etcetera
- perspective … field of view, aspect ratio, Z position
… and the Land Surveying use of thinking about Survey Traverses as an idea to genericize the vertex definition phase, as this is the major difference between drawing a “cube” or a “hexagonal prism” or a “butterfly in Brazil” (just kidding … that’s for tomorrow (in Klingon time)).
So the wonderful code from the University of New Mexico (via StackOverflow) was to show a cube, and the use of buttons to display animation and rendering “smarts” … so am really really really keen for you to examine this additional HTML code of today you could call webgl_test.html … we change it to add some Land Surveying feeling to the creation of vertices for our Convex Polygon extended into a Prism arrangement as per the Javascript code …
var numsides = location.search.split('numsides=')[1] ? location.search.split('numsides=')[1].split('&')[0] : 4;

var NumVertices  = eval((numsides * 2) * 3);

var evalc="", evalcol="";

var delim="[";

var sidelen=eval((1.0 * 3.0) / numsides);

var x=eval(0.0 - (sidelen / 2.0) * (numsides / 3)), y=eval(0.0 - (sidelen / 2.0) * (numsides / 3)), z=1.5, otherz=0.5, thisis=1;

var bearing=0.0;

var prevbearing;

var nextx, nexty, nextis=2;

var prevx, prevy, previs=numsides, downis=eval(numsides);

downis++;

evalc="";

for (ij=0; ij<eval(numsides * 2); ij++) {

  if (ij == numsides) {

    z=0.5;

    otherz=1.5;

  }

  nextx=eval(x + sidelen * Math.sin(bearing / 57.2957795));

  if (Math.abs(nextx) < 0.00001) nextx = 0.0;

  nexty=eval(y + sidelen * Math.cos(bearing / 57.2957795));

  if (Math.abs(nexty) < 0.00001) nexty = 0.0;

  prevbearing = ((bearing + 540 - (360.0 / numsides)) % 360.0);

  prevx=eval(x + sidelen * Math.sin(prevbearing / 57.2957795));

  if (Math.abs(prevx) < 0.00001) prevx = 0.0;

  prevy=eval(y + sidelen * Math.cos(prevbearing / 57.2957795));

  if (Math.abs(prevy) < 0.00001) prevy = 0.0;

  if (eval((ij + 1) % numsides) != 0) {

   evalc += (delim + "vec4(" + x + "," + y + "," + z + ",1.0) /" + "/" + thisis + "\n");

   evalcol += (delim + "vec4( 1.0, 0.0, 0.0, 1.0 ) /" + "/red \n");

   delim=",";

   evalc += (delim + "vec4(" + nextx + "," + nexty + "," + z + ",1.0) /" + "/" + nextis + "\n");

   evalcol += (delim + "vec4( 1.0, 0.0, 0.0, 1.0 ) /" + "/red \n");

  }

  if ((ij % numsides) == 0) {

   evalc += (delim + "vec4(" + x + "," + y + "," + z + ",1.0) /" + "/" + thisis + "\n");

   evalcol += (delim + "vec4( 1.0, 0.0, 0.0, 1.0 ) /" + "/red \n");

   evalc += (delim + "vec4(" + prevx + "," + prevy + "," + z + ",1.0) /" + "/" + previs + "\n");

   evalcol += (delim + "vec4( 1.0, 0.0, 0.0, 1.0 ) /" + "/red \n");

   previs = eval(previs * 2);

  }

  if (ij < numsides) {

   evalc += (delim + "vec4(" + x + "," + y + "," + z + ",1.0) /" + "/" + thisis + "\n");

   evalcol += (delim + "vec4( 1.0, 0.0, 0.0, 1.0 ) /" + "/red \n");

   evalc += (delim + "vec4(" + x + "," + y + "," + otherz + ",1.0) /" + "/" + downis + "\n");

   evalcol += (delim + "vec4( 1.0, 0.0, 0.0, 1.0 ) /" + "/red \n");

  }

  x = nextx;

  y = nexty;

  thisis++;

  nextis++;

  downis++;

  bearing += (360.0 / numsides);

}

evalc += "];";

evalcol += "];";

var vertices;

vertices = eval(evalc);
WebGL API performs its graphics via the use of the HTML5 canvas element. We’ll be discussing more on this topic, no doubt, as time goes on.
Here is a link to Shape Draw live run (with Google Line Chart and HTML svg and WebGL 3D Prism drawing and University of New Mexico inspired animation functionality) here.
Here is a link to Shape Draw PHP source code ShapeDraw.php with changes from previous code as per this link.
Try it out, and get into web based 3D graphics via the WebGL API … you’ll be drawing prism animals before the sun goes down!
Previous relevant PHP and Javascript and CSS Shape Rotation Tutorial is shown below.
We’re continuing on with our Geometry and Land Surveying theme today, following on from yesterday’s PHP and Javascript and CSS Shape Drawing Tutorial as shown below. When there are only small distances we talk about Plane Geometry because the curvature of the earth doesn’t come into the equation. When Earth curvature matters, over longer distances, in Land Surveying the term Geodetic Surveying is often used. Here, the equations used need to model the Earth as close as possible to known measurements.
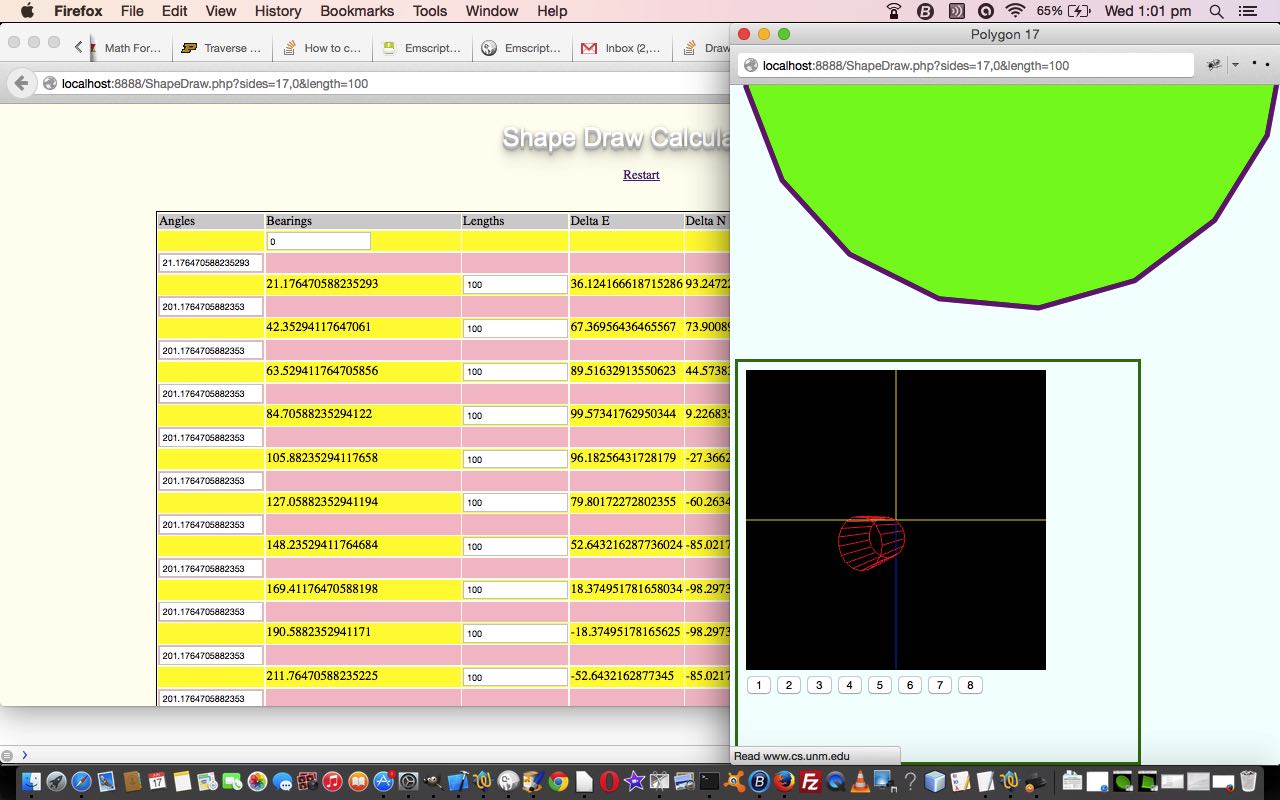
If you read yesterday’s posting you’ll see that we added some popup window functionality to display the Convex Polygon created by the web application in a relative sense, and to do this we called on (where variable “opop” is global in scope) …
opop = window.open("", "Polygon " + numlegs, "left=400,top=250,height=" + parseFloat(50 + maxy) + ",width=" + parseFloat(50 + maxx));
opop.document.write([someDerivedHTML]);
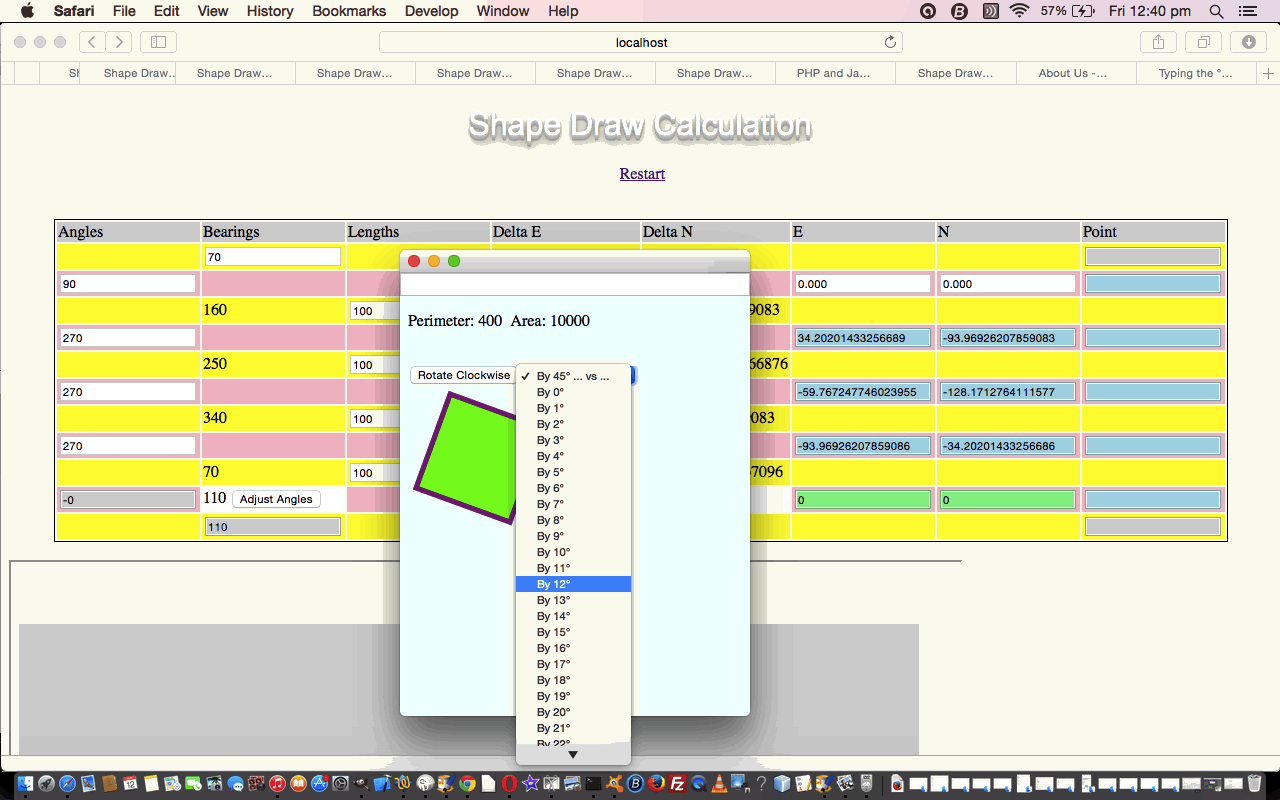
We’re here, today, to remind you, that that popup doesn’t have to be like a dead fish, just displaying information. It can be interactive itself, and is known to the “parent” window, so can have its own “hidden input” HTML element (for example) as per …
<input id="myunload" type="hidden" value=""></input>
… that is updated when a button as per (this function, that is used to create this button and a related dropdown) …
function buttonideas() {

  var crotate1 = "<input type='button' onclick=' if (document.getElementById(\"myunload\") != null) { document.getElementById(\"myunload\").value=\"" +  initiallength + "," + numlegs + "," + "\" + document.getElementById(\"myselect\").value; }' value='Rotate Clockwise'></input> <select id='myselect'><option value='" + eval(180.0 / numlegs) + "'>By " + eval(180.0 / numlegs) + "° ... vs ...</option></select>";

  for (var steps=0; steps<=360; steps++) {

    crotate1=crotate1.replace("</option></select>", "</option><option value='" + steps + "'>By " + steps + "°</option></select>");

  }

  return crotate1;

}
… then our “parent” window can swing into action via a setInterval() scenario (where variable sipos is global) …
sipos = setInterval(takealook, 5000);
… with code like …
function takealook() {

  var things;

  if (opop != null) {

    if (opop.document.getElementById('myunload').value.indexOf(",") != -1) {

      things = opop.document.getElementById('myunload').value.split(",");

      opop.close();

      opop = null;

      if (things.length >= 3) {

        if (sipos != null) { clearInterval(sipos); sipos = null; }

        var bis = 0.0;

        bis += parseFloat(initialbearing);

        bis += parseFloat(things[2]);

        window.location = "./ShapeDraw.php?sides=" + things[1] + ",0&length=" + things[0] + "&bearing=" + posval(bis);

      }

    }

  }

}
… to allow for some HTML “svg” element rotation functionality, if the button is pressed, that is. One last nicety is to use the Window Event “onunload” to clear the setInterval handler with a web browser close or a user closing the parent webpage as per …
<body onunload=" if (sipos != null) { clearInterval(sipos); sipos = null; }" style="background-color: #fffff0;">
Link to Shape Draw live run (with Google Line Chart and HTML svg functionality) here.
Link to Shape Draw PHP source code ShapeDraw.php with changes from code yesterday as per this link.
You may be interested in CSS3 ways to rotate HTML elements as well, so we’ll leave you with this link to point you in the direction of where we have discussed this previously.
Previous relevant PHP and Javascript and CSS Shape Drawing Tutorial is shown below.
It is no coincidence that Geometry and Land Surveying have a lot in common. When there are only small distances we talk about Plane Geometry because the curvature of the earth doesn’t come into the equation. When Earth curvature matters, over longer distances, in Land Surveying the term Geodetic Surveying is often used. Here, the equations used need to model the Earth as close as possible to known measurements.
So today, with our Plane Geometry web application, we start with our previous Survey Traverse web application, and add to its functionality with ability for it to fill out more for the user to describe a regular polygon of their choosing, defined by …
- number of polygon sides
- length of each polygon side
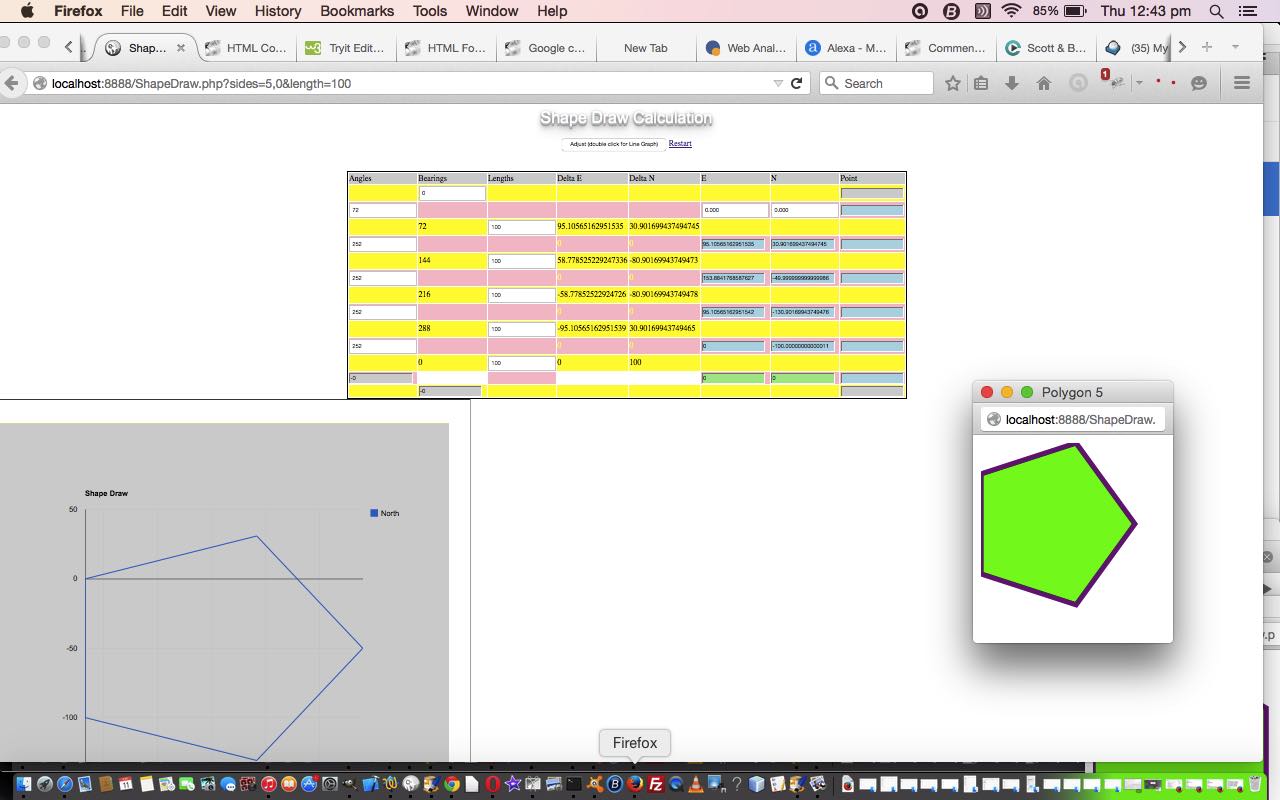
We also add to the Google Charts Line Graph of the Drawn Shape a popup window showing the polygon as an HTML svg element. Part of the reason for this is that the Google Chart Line Graph can exaggerate the x or y co-ordinate of its plots, but with the HTML svg element, you avoid this issue, as we are just showing you a “relative” view of the shape (ie. as distinct from an “absolute” view with distinct co-ordinates).
The thinking here started with a look at New Century Maths stages 5.2/5.3 “Exterior angle sum of a convex polygon”. Did you know?
The sum of the exterior angles of a convex polygon is 360°.
What we found to be the case, practically speaking, to imagine the drawing of a regular even-sided convex polygon (with “numsides” sides) was …
- look north …
- turn clockwise (360° / numsides) for first line to draw (NB. there is more symmetry if this number is then divided by 2) … then from then on …
- off this previous line, turn clockwise (180° + (360° / numsides)) for subsequent lines
Link to Shape Draw live run (with Google Line Chart and HTML svg functionality) here.
Link to Shape Draw PHP source code ShapeDraw.php with changes from code below as per this link.
Hope you enjoy the geometry ideas, and will leave you with a very useful link that helped with the Convex Polygon method to calculate the Surface Area here.
Previous relevant HTML and Javascript and CSS Survey Traverse Tutorial is shown below.
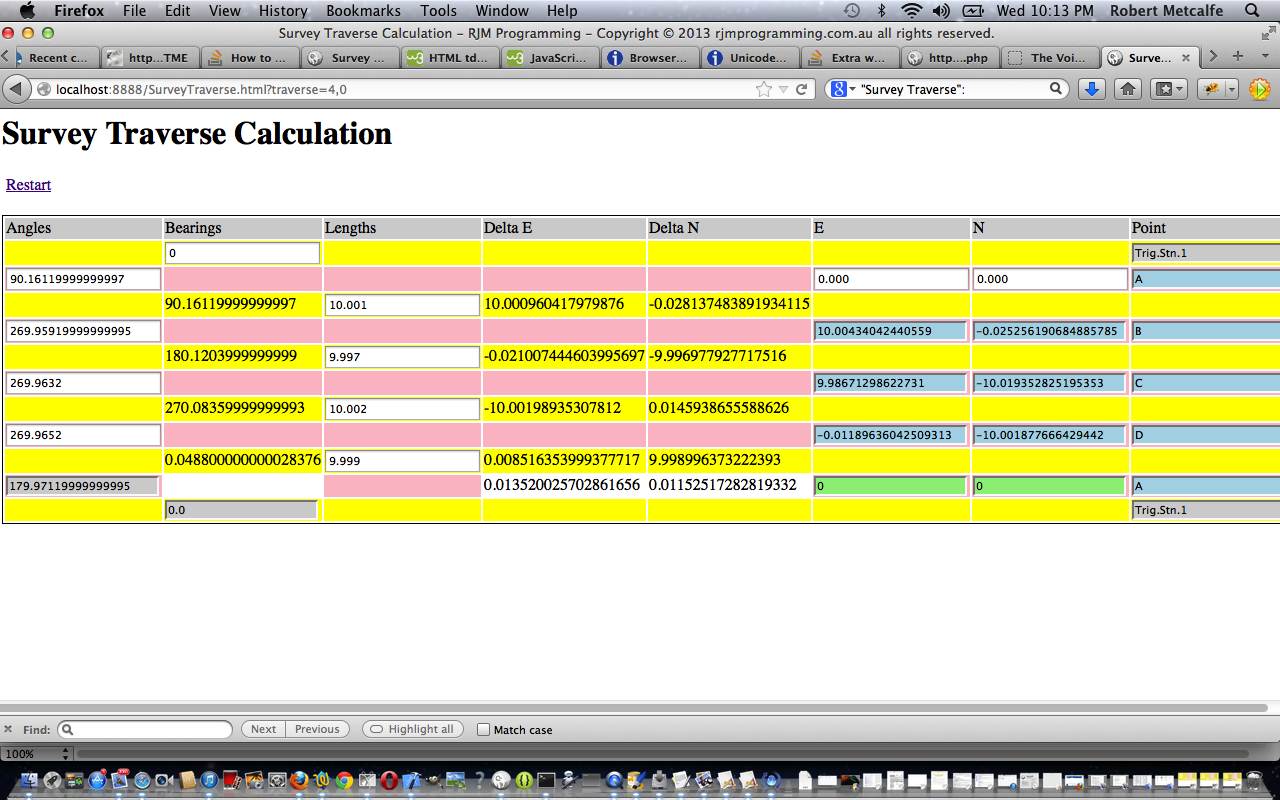
Here is a tutorial showing some client-side basics in HTML and Javascript and CSS all in the one HTML file, to simplify concepts. The tutorial subject matter is a webpage to perform Survey Traverse calculations. A Survey Traverse is:
Traverse is a method in the field of surveying to establish control networks.[1] It is also used in geodesy. Traverse networks involve placing survey stations along a line or path of travel, and then using the previously surveyed points as a base for observing the next point. Traverse networks have many advantages, including:
Less reconnaissance and organization needed;
While in other systems, which may require the survey to be performed along a rigid polygon shape, the traverse can change to any shape and thus can accommodate a great deal of different terrains;
Only a few observations need to be taken at each station, whereas in other survey networks a great deal of angular and linear observations need to be made and considered;
Traverse networks are free of the strength of figure considerations that happen in triangular systems;
Scale error does not add up as the traverse is performed. Azimuth swing errors can also be reduced by increasing the distance between stations.The traverse is more accurate than triangulateration[2] (a combined function of the triangulation and trilateration practice).[3]
Let’s see some simple HTML in action in a tutorial …
Link to HTML “spiritual home” … at W3Schools has many tutorials.
Link to Survey Traverse live run … here.
Link to Survey Traverse live run (additional Google Line Chart functionality) here.
Link to Survey Traverse information … from Wikipedia from which quote above comes.
Link to some downloadable HTML code … rename to SurveyTraverse.html which packages up a lot of Javascript and a little bit of CSS … or JaCvasScriptS … not sure whether this would ever catch on.
Link to some downloadable PHP programming code (additional Google Line Chart functionality) … rename to SurveyTraverse.php
If this was interesting you may be interested in this too.
If this was interesting you may be interested in this too.
If this was interesting you may be interested in this too.
If this was interesting you may be interested in this too.
If this was interesting you may be interested in this too.
If this was interesting you may be interested in this too.
If this was interesting you may be interested in this too.

