We’ve said it before, and (no doubt) we’ll say it again … there are great public data sources out there for you to explore.
As far as international data goes the Worldbank series of statistics is great, so, thanks.
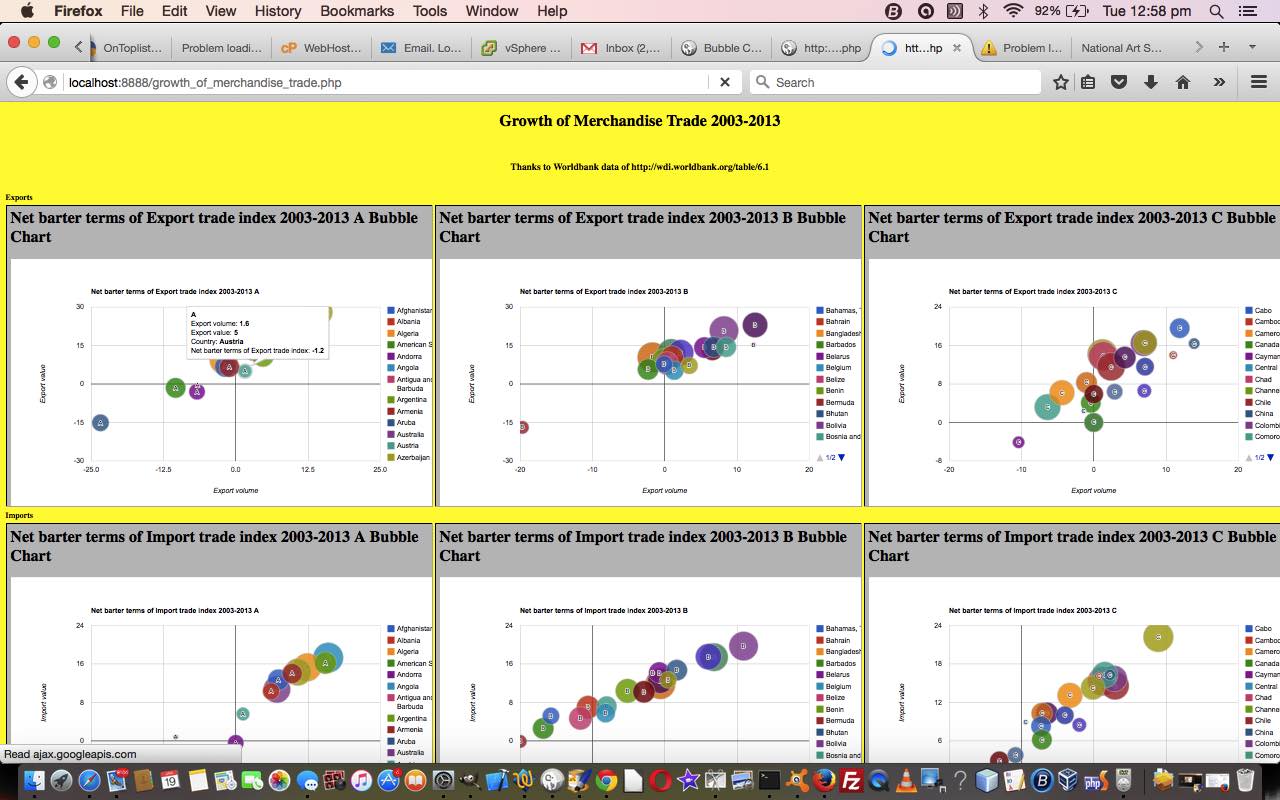
Today we combine the Worldbank data for Growth of Merchandise Trade 2003-2013 with the wonderful Google Chart Bubble Chart to create (52 = (first letters of country name) 26 x 2 (concepts: Exports and Imports)) reporting charts of interest, we hope. Again, as with any reporting subject, it is a personal thing, whether the subject matter of a report is of interest, but you could say that about so many things in life.
So, we offer some PHP source code you could call growth_of_merchandise_trade.php and a live run link as well, the full loading of which requires patience.
Stop Press
Tomorrow we go over what was needed to change PHP code above to be more mobile friendly …
- growth_of_merchandise_trade.php changes (to cater for select event (mobile touch) functionality) and live run link for yesterday’s web application
If this was interesting you may be interested in this too.


