Here is a tutorial that reacquaints you, perhaps, with the Google Graphs API, or Google Chart Tools, and its Line Chart functionality, first talked about at this blog with PHP/Javascript/HTML Google Chart Line Chart Tutorial as shown below.
Google Chart Tools provide a perfect way to visualize data on your website. From simple line charts to complex hierarchical tree maps, the chart galley provides a large number of well-designed chart types. Populating your data is easy using the provided client- and server-side tools.
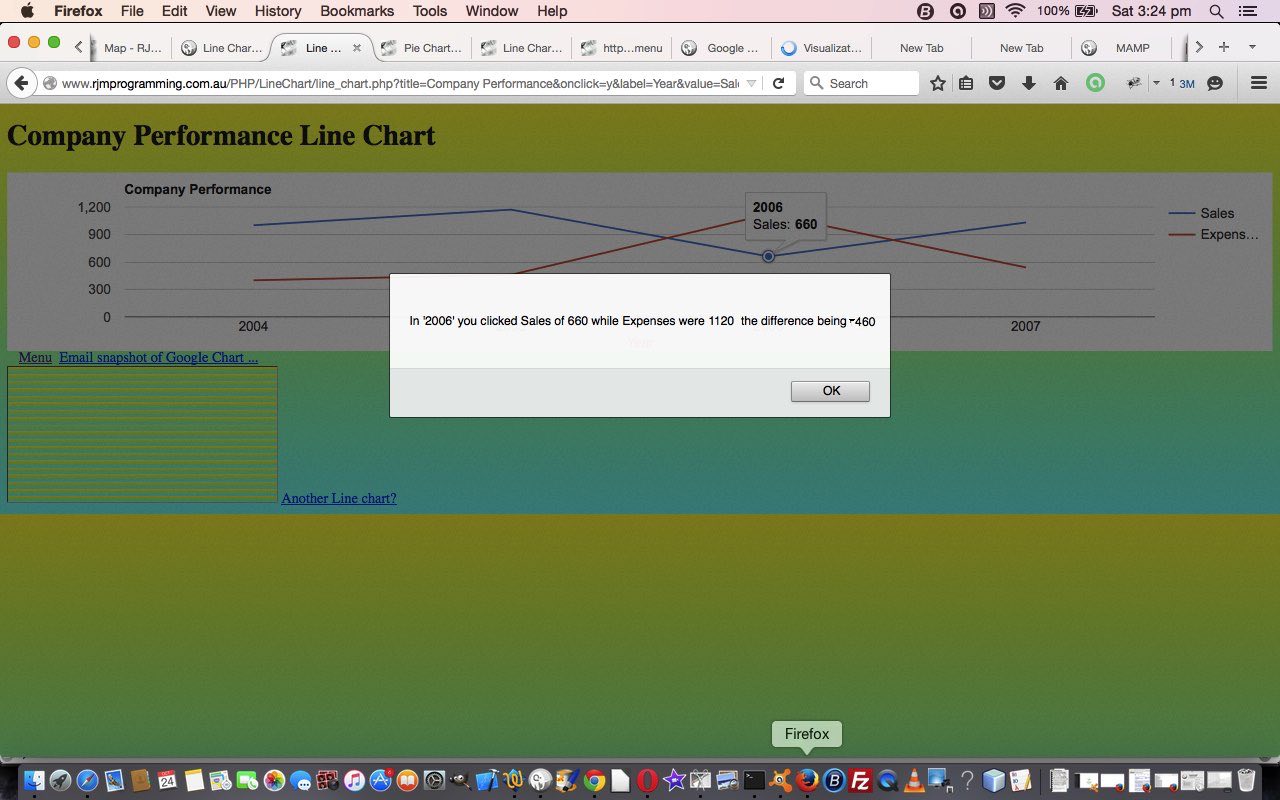
The reason for the revisit concerns a push to make more use of the onclick “feeling” Google Chart “select” event, an event triggered when you click on a feature of, in this case, a Google Chart Line Chart that our web application helps you create.
Here is some PHP code in live action for this tutorial where you define your line chart characteristics and data, where am appending of “&onclick=y” to your line chart title means the additional “select” event functionality can kick in.
The “select” event functionality (which you can read a lot about here … thanks, Google) would be full of business logic and specific to how you want to use the chart, so it is a bit hard to pin down how you should use it, but in today’s tutorial picture you can see that in a Company Performance line chart showing Sales and Expenses if you click on a Sales figure for any given Year the “select” event business logic brings up a Javascript alert() box that informs the user of the Expenses for that same Year, along with the difference between Sales and Expenses. The logic is not tied down to the exact words “Sales” and “Expenses”, and it will work this out from what you entered in for this earlier on.
Some findings here led to some small changes to that generic Javascript behind the scenes of these Google Chart suite of web applications as well so, all told, the changes involved …
- line_chart.php is the changed PHP programming source code as per changes
- gchartgen.js is the changed Javascript programming source code as per changes
Link to Google Chart Tools “spiritual home” … via Google.
Link to Google Chart Tools Line Chart information … via Google.
So please try creating you own emailable Google Chart Line Chart here.
Previous relevant PHP/Javascript/HTML Google Chart Line Chart Tutorial is shown below.
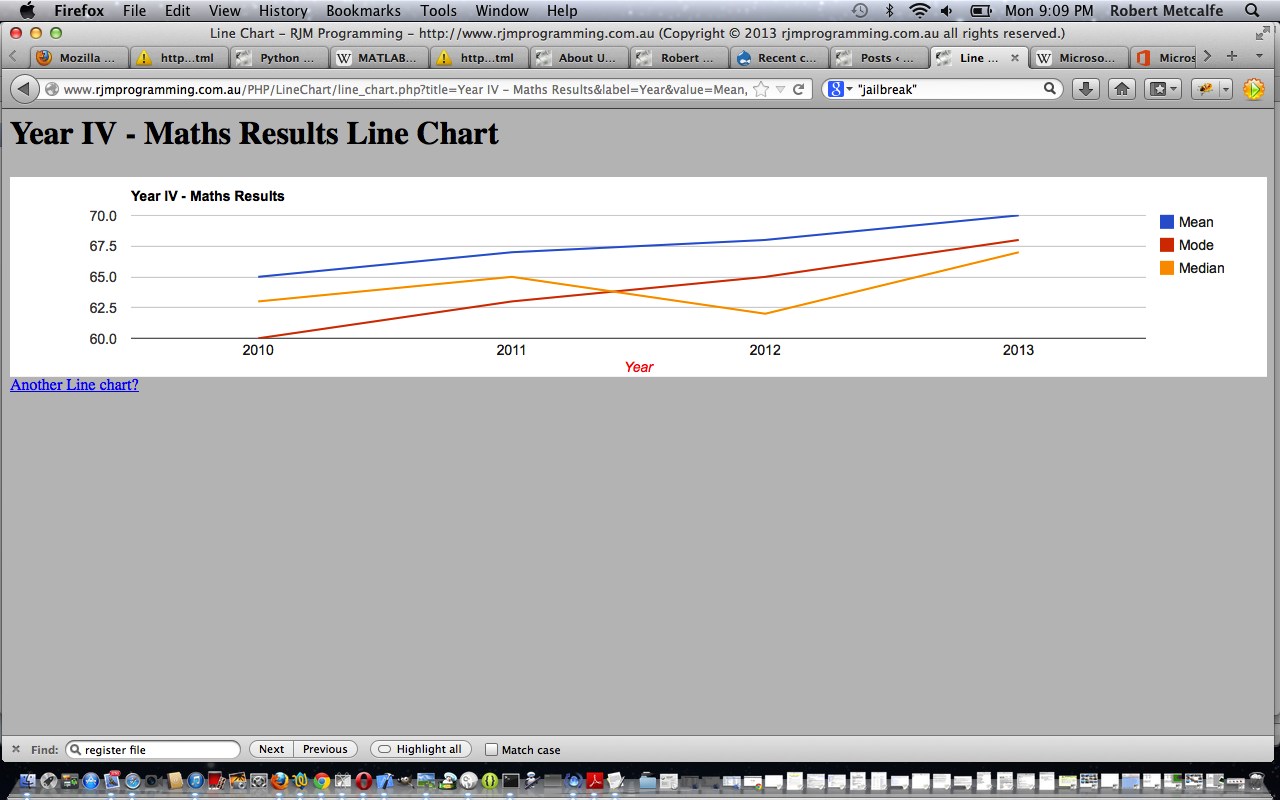
Here is a tutorial that introduces you to Google Graphs API, or Google Chart Tools, and its Line Chart functionality.
Google Chart Tools provide a perfect way to visualize data on your website. From simple line charts to complex hierarchical tree maps, the chart galley provides a large number of well-designed chart types. Populating your data is easy using the provided client- and server-side tools.
Let’s see some PHP code in live action for this tutorial where you define your line chart characteristics and data.
Link to Google Chart Tools “spiritual home” … via Google.
Link to Google Chart Tools Line Chart information … via Google.
Link to some downloadable PHP programming code … rename to line_chart.php.
If this was interesting you may be interested in this too.
If this was interesting you may be interested in this too.


