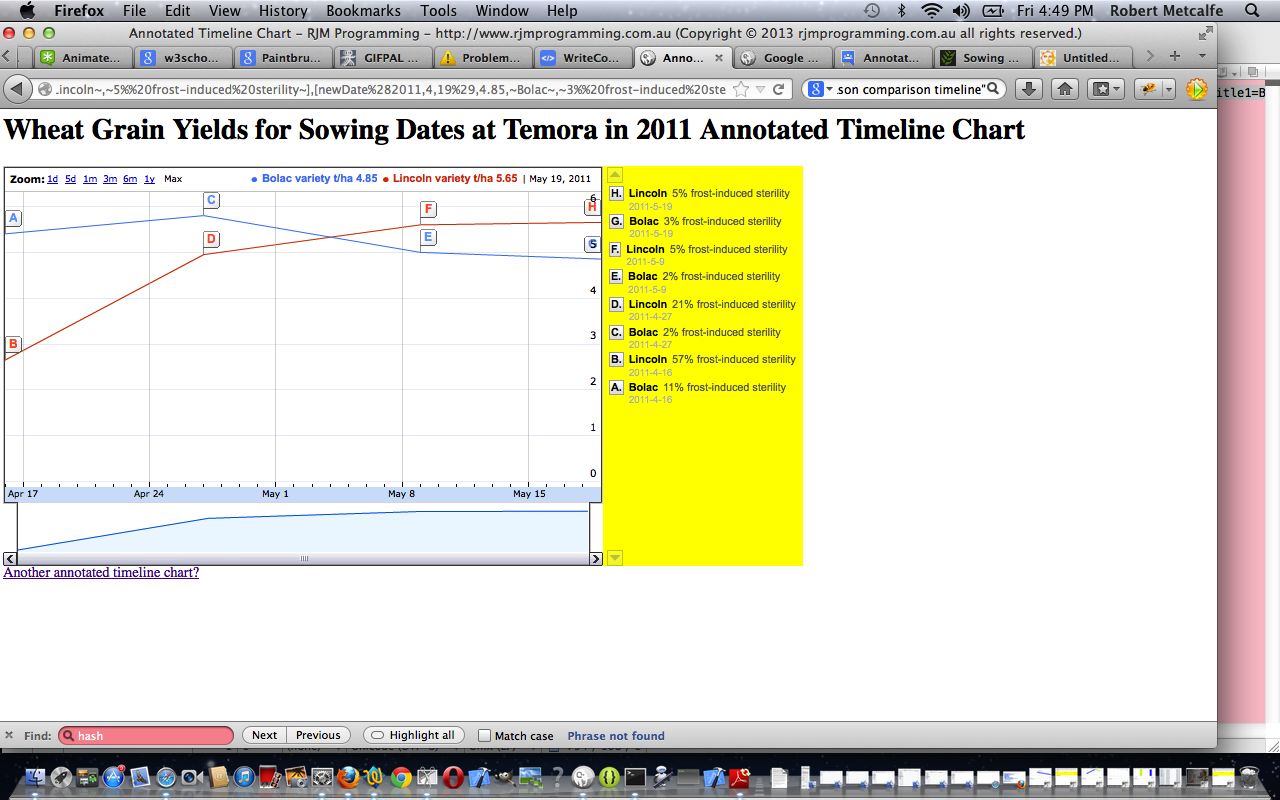
PHP/Javascript/HTML Google Chart Annotated Timeline Chart Tutorial (try twirling round bottom of image for a synopsis ... 'do the twirl now')
Here is a tutorial that introduces you to Google Graphs API, or Google Chart Tools, and its Annotated Timeline Chart functionality.
Google Chart Tools provide a perfect way to visualize data on your website. From simple line charts to complex hierarchical tree maps, the chart galley provides a large number of well-designed chart types. Populating your data is easy using the provided client- and server-side tools.
Let’s see some PHP code in live action for this tutorial where you define your motion chart characteristics and data.
Of interest with this tutorial is this YUI UI Calendar Primer Tutorial.
Link to Google Chart Tools “spiritual home” … via Google.
Link to Google Chart Tools Annotated Timeline Chart information … via Google.
Link to some downloadable PHP programming code … rename to annotatedtimeline_chart.php.
The source information for the data of this tutorial originated from Sowing dates – Getting the best from our varieties and optimising whole-farm wheat yield (NSW) … thanks.
If this was interesting you may be interested in this too.


