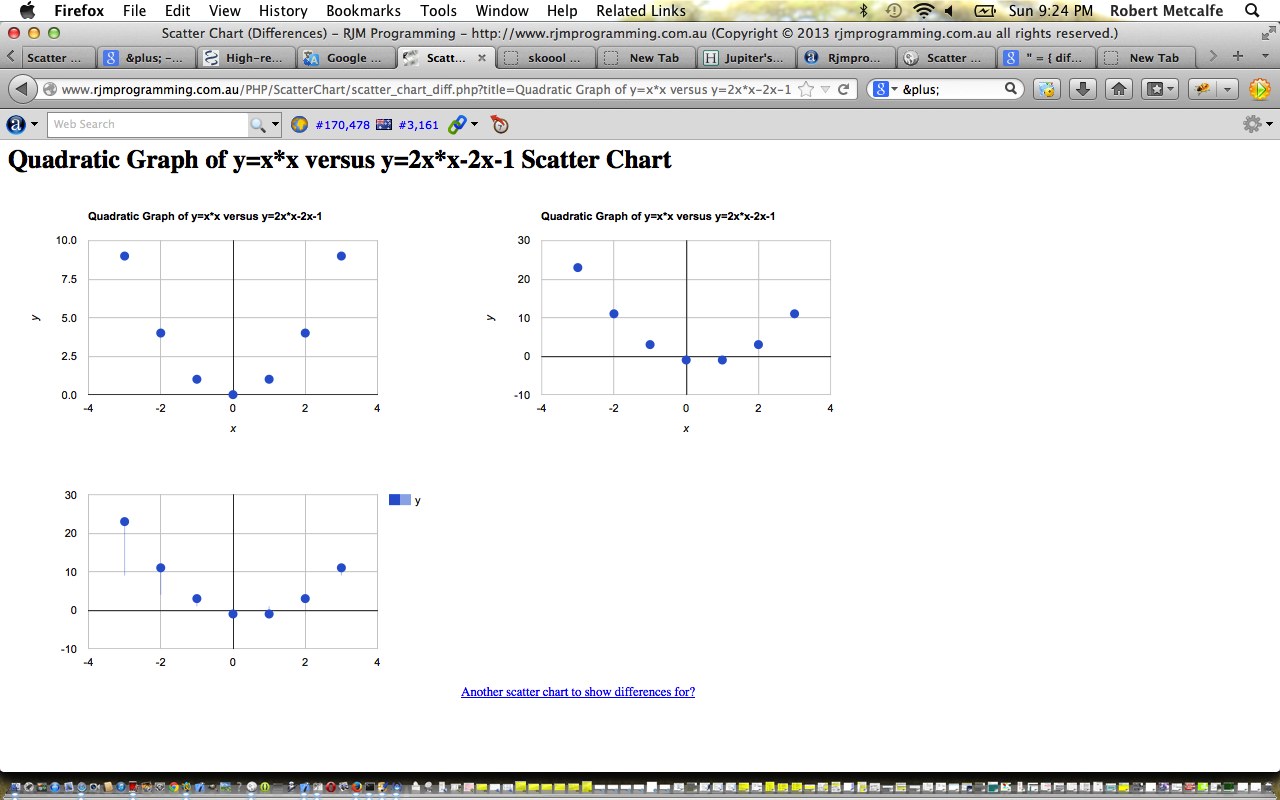
Here is a tutorial that introduces you to Google Graphs API, or Google Chart Tools, and its Scatter Chart functionality as outlined in previous PHP/Javascript/HTML Google Chart Scatter Chart Tutorial (as shown below) is developed further here with the concept of differences between data sets. So today we use Google Charts for two data sets of similar criteria and then present a presentation of the differences. Scatter charts, column charts, bar charts, and pie charts can all be used as the data basis for your “difference” analysis.
Google Chart Tools provide a perfect way to visualize data on your website. From simple line charts to complex hierarchical tree maps, the chart galley provides a large number of well-designed chart types. Populating your data is easy using the provided client- and server-side tools.
Let’s see some PHP code in live action for this tutorial where you define your scatter chart characteristics and data, twice … and you’ll see that stereo has advantages over mono … but Mono rocks!
Link to Google Chart Tools “spiritual home” … via Google.
Link to Google Chart Tools Scatter Chart information … via Google.
Link to Google Chart Diff Charts information … via Google.
Link to some downloadable PHP programming code … rename to scatter_chart_diff.php
Here is a new link to some downloadable PHP programming source code explaining changes made (from tutorial below) here.
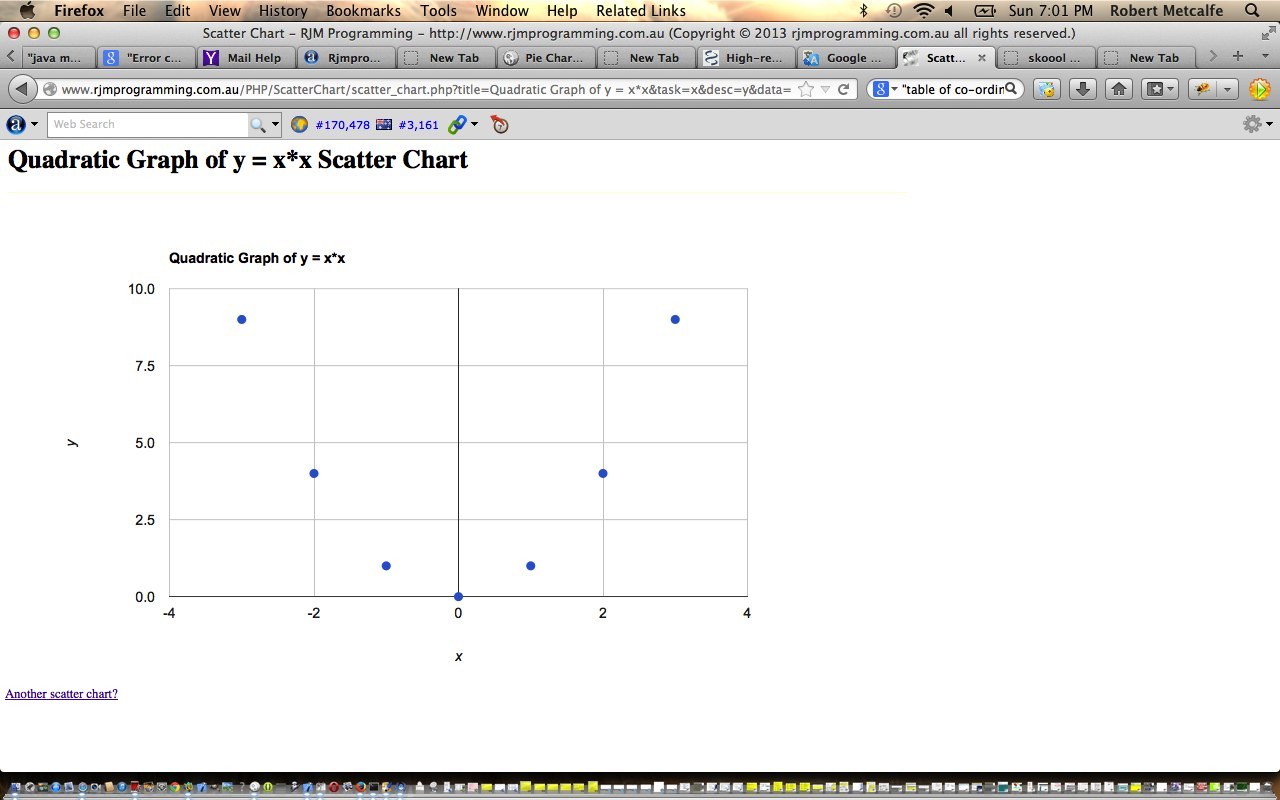
Previous PHP/Javascript/HTML Google Chart Scatter Chart Tutorial is shown below.
Here is a tutorial that introduces you to Google Graphs API, or Google Chart Tools, and its Scatter Chart functionality, which is a way to represent discrete points. In Land Surveying, for instance, such a tool could be used to plot borehole positions in grid co-ordinates, perhaps overlaying a similar geophysical “underlay” map. Maps are full of discrete point requirements. Taken to the right small scale, cities on a map become “dots” or points. If this “blows your mind” or interests you, study fractals.
Google Chart Tools provide a perfect way to visualize data on your website. From simple line charts to complex hierarchical tree maps, the chart galley provides a large number of well-designed chart types. Populating your data is easy using the provided client- and server-side tools.
Let’s see some PHP code in live action for this tutorial where you define your scatter chart characteristics and data.
Link to Google Chart Tools “spiritual home” … via Google.
Link to Google Chart Tools Scatter Chart information … via Google.
Link to some downloadable PHP programming code … rename to scatter_chart.php.
If this was interesting you may be interested in this too.
If this was interesting you may be interested in this too.


