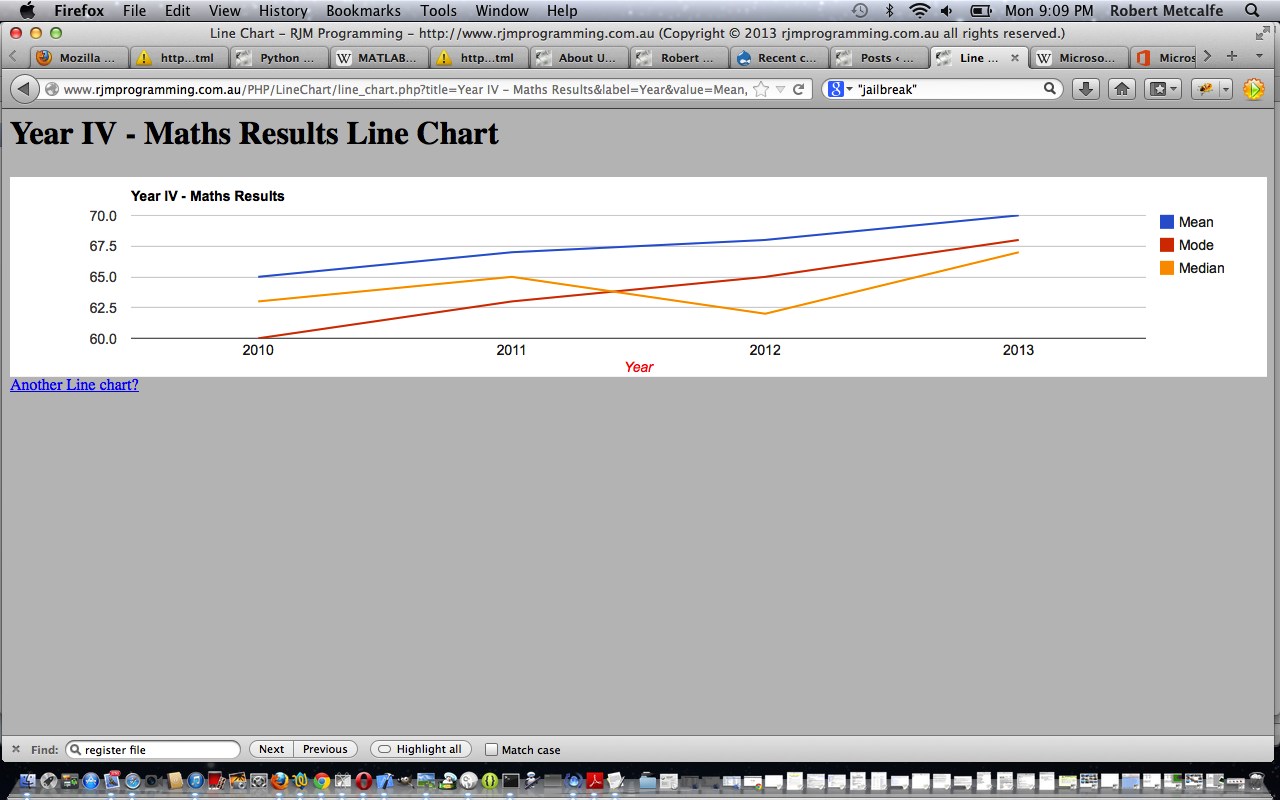
Here is a tutorial that introduces you to Google Graphs API, or Google Chart Tools, and its Line Chart functionality.
Google Chart Tools provide a perfect way to visualize data on your website. From simple line charts to complex hierarchical tree maps, the chart galley provides a large number of well-designed chart types. Populating your data is easy using the provided client- and server-side tools.
Let’s see some PHP code in live action for this tutorial where you define your line chart characteristics and data.
Link to Google Chart Tools “spiritual home” … via Google.
Link to Google Chart Tools Line Chart information … via Google.
Link to some downloadable PHP programming code … rename to line_chart.php.
If this was interesting you may be interested in this too.


