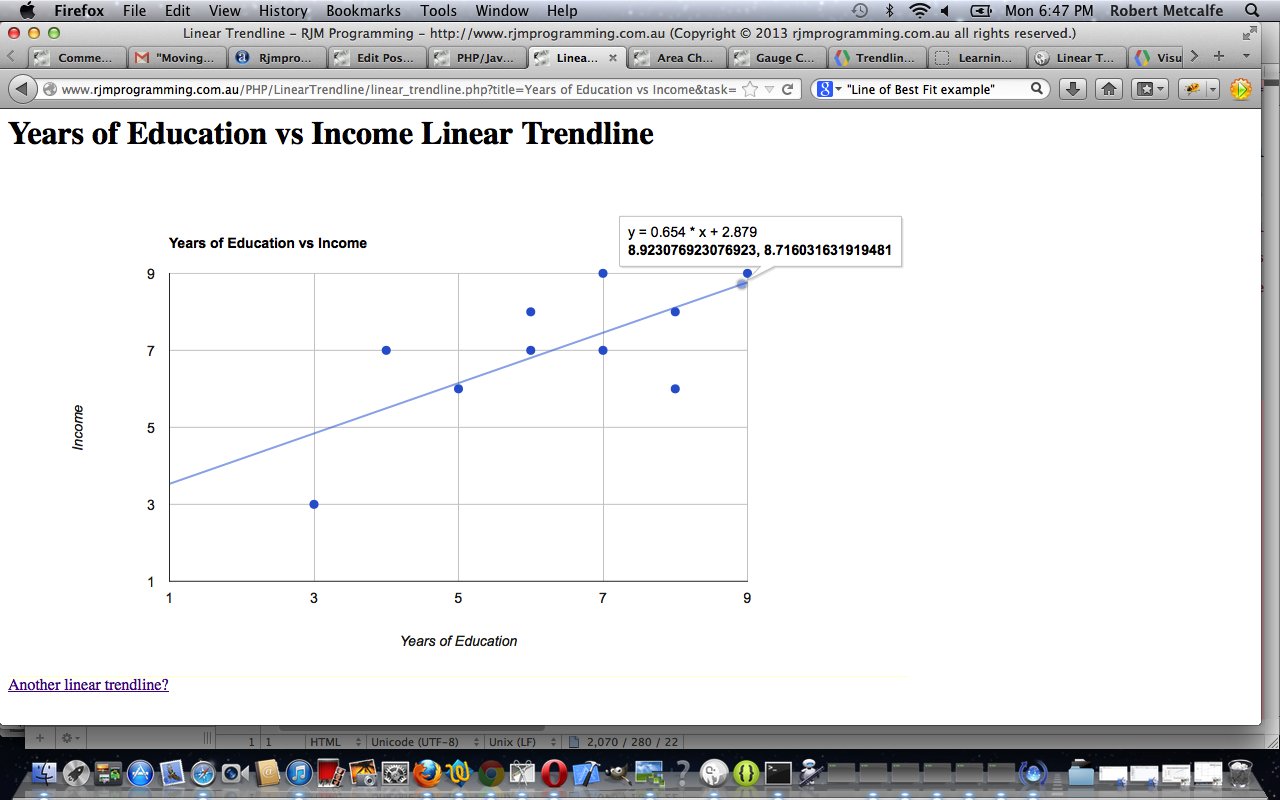
Here is a tutorial that introduces you to Google Graphs API, or Google Chart Tools, and its Linear Trendline functionality. For the data of picture above I give thanks to Action Research Projects.
Google Chart Tools provide a perfect way to visualize data on your website. From simple line charts to complex hierarchical tree maps, the chart galley provides a large number of well-designed chart types. Populating your data is easy using the provided client- and server-side tools.
This Linear Trendline illustrates Linear Regression (or “Line of Best Fit”) used a lot in Mathematics, Statistics, Economics, Engineering (for example, Land Surveying) and the Sciences. Read about it from Wikipedia below:
In statistics, linear regression is an approach to modeling the relationship between a scalar dependent variable y and one or more explanatory variables denoted X. The case of one explanatory variable is called simple linear regression. For more than one explanatory variable, it is called multiple linear regression. (This term should be distinguished from multivariate linear regression, where multiple correlated dependent variables are predicted,[citation needed] rather than a single scalar variable.)
In linear regression, data are modeled using linear predictor functions, and unknown model parameters are estimated from the data. Such models are called linear models. Most commonly, linear regression refers to a model in which the conditional mean of y given the value of X is an affine function of X. Less commonly, linear regression could refer to a model in which the median, or some other quantile of the conditional distribution of y given X is expressed as a linear function of X. Like all forms of regression analysis, linear regression focuses on the conditional probability distribution of y given X, rather than on the joint probability distribution of y and X, which is the domain of multivariate analysis.
Linear regression was the first type of regression analysis to be studied rigorously, and to be used extensively in practical applications. This is because models which depend linearly on their unknown parameters are easier to fit than models which are non-linearly related to their parameters and because the statistical properties of the resulting estimators are easier to determine.
Linear regression has many practical uses. Most applications fall into one of the following two broad categories:
If the goal is prediction, or forecasting, linear regression can be used to fit a predictive model to an observed data set of y and X values. After developing such a model, if an additional value of X is then given without its accompanying value of y, the fitted model can be used to make a prediction of the value of y.
Given a variable y and a number of variables X1, …, Xp that may be related to y, linear regression analysis can be applied to quantify the strength of the relationship between y and the Xj, to assess which Xj may have no relationship with y at all, and to identify which subsets of the Xj contain redundant information about y.Linear regression models are often fitted using the least squares approach, but they may also be fitted in other ways, such as by minimizing the “lack of fit” in some other norm (as with least absolute deviations regression), or by minimizing a penalized version of the least squares loss function as in ridge regression. Conversely, the least squares approach can be used to fit models that are not linear models. Thus, although the terms “least squares” and “linear model” are closely linked, they are not synonymous.
Let’s see some PHP code in live action for this tutorial where you define your linear trendline characteristics and data.
Link to Google Chart Tools “spiritual home” … via Google.
Link to Google Chart Tools Linear Trendline information … via Google.
Link to some downloadable PHP programming code … rename to linear_trendline.php.
If this was interesting you may be interested in this too.


