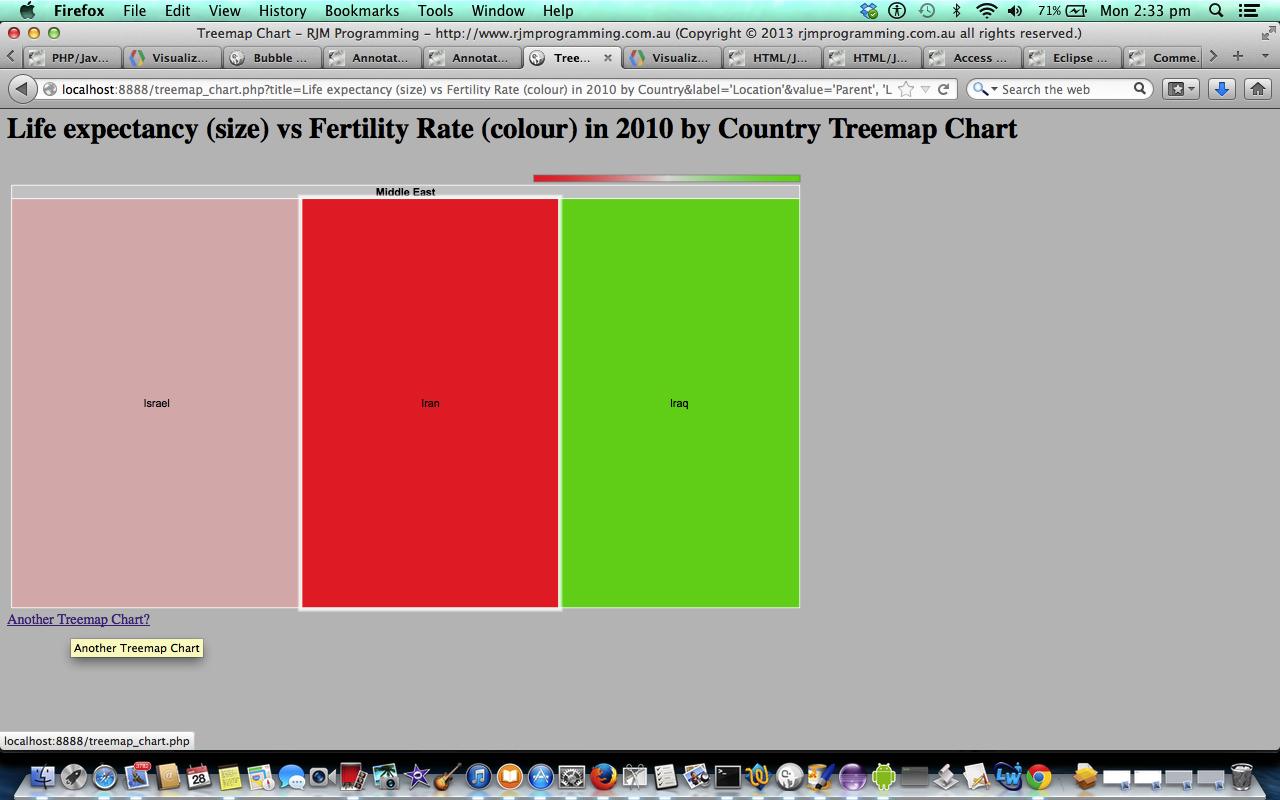
Here is a tutorial that introduces you to Google Graphs API, or Google Chart Tools, and its Treemap Chart functionality.
Google Chart Tools provide a perfect way to visualize data on your website. From simple line charts to complex hierarchical tree maps, the chart galley provides a large number of well-designed chart types. Populating your data is easy using the provided client- and server-side tools.
Let’s see some PHP code in live action for this tutorial where you define your Treemap chart characteristics and data. Treemaps, as the name suggests, does not have to use the one layer of drilldown functionality (as long as you have predefined the Parent Concept of each Primary Concept you can keep building up data with more and more drilling down capabilities) … the incoming one does this with Global (representing Earth) as the Parent Concept of (Primary Concepts) Europe, Africa etcetera … if you immediately answer Cancel you can see this in action.
Link to Google Chart Tools “spiritual home” … via Google.
Link to Google Chart Tools Treemap Chart information … via Google.
Link to some downloadable PHP code … rename to treemap_chart.php.
If this was interesting you may be interested in this too.


