Powerball Number Pick Counts XML Tutorial
We’re starting a …
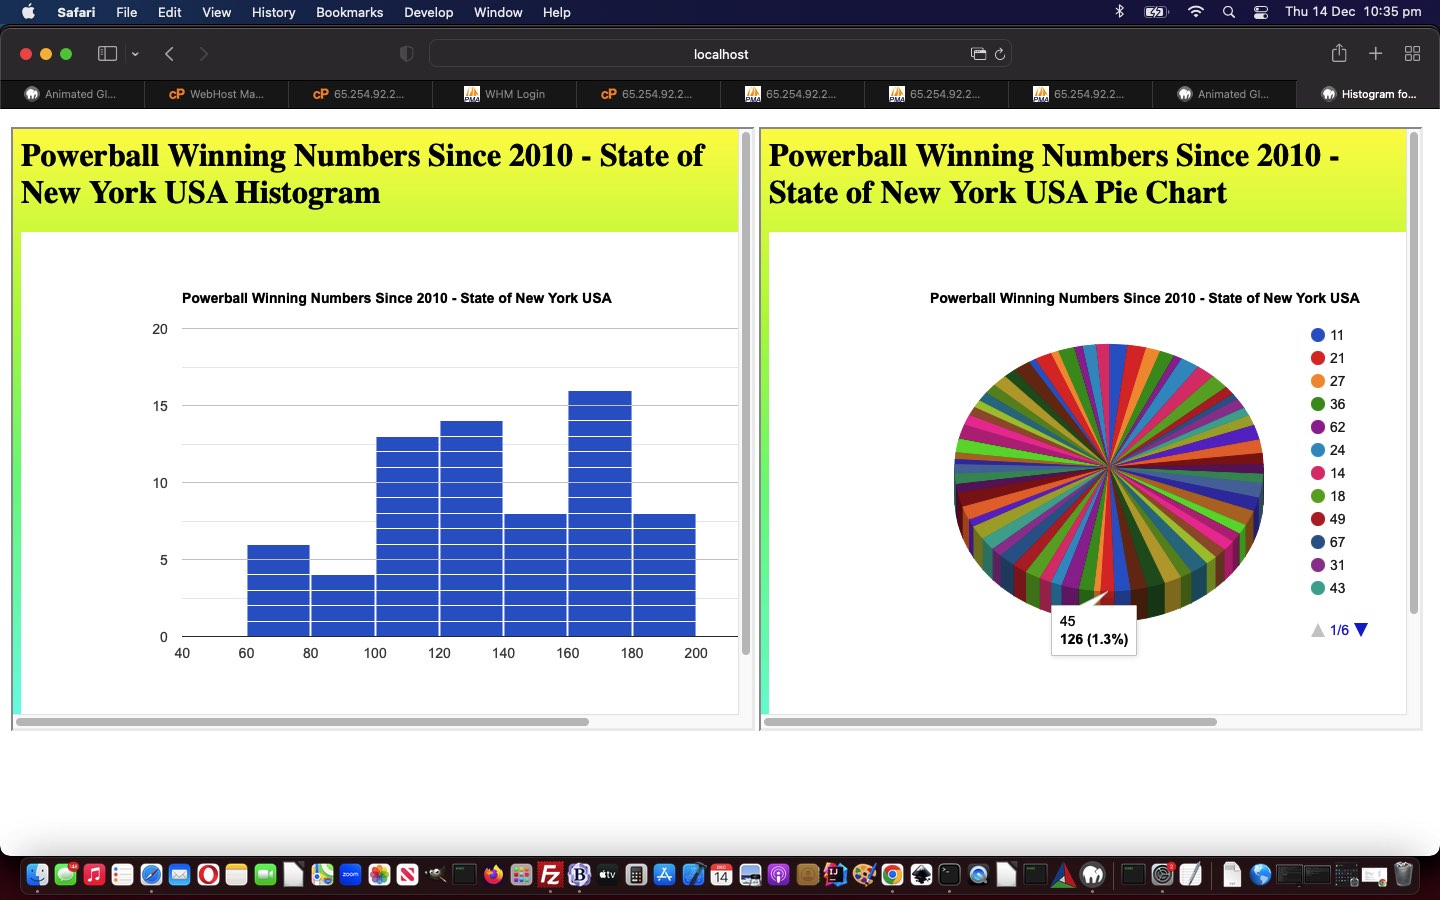
… new powerball_us_ny_winning_numbers_since_21010.html web application project today. Why those two charts? Well, they give different views of built up data pairings, involving two data members, one “subject item” (which today, happens to be numerical, but does not have to be) and the other numerical data item having a relationship with that “subject item” as a measure, in today’s case that being a count of …
New York State, US Powerball Number Pick Counts since 2010
Yes, you can glean many things from the public online data resources out there, today’s one for us coming from the US Governmental data.gov … thanks all around.
In the code, what is the crucial single codeline, at least for us? It’s …
var datasofar='', nums=[], ij=0, jk=0;

var xhttp = new XMLHttpRequest();

xhttp.onreadystatechange = function() {

    if (this.readyState == 4 && this.status == 200) {

        showResult(xhttp.responseXML);

    }

};

xhttp.open("GET", "//data.ny.gov/api/views/d6yy-54nr/rows.xml", true);

xhttp.send();


function showResult(xml) {

    var txt = "";
path = "/response/row/row/winning_numbers"
    if (xml.evaluate) {

        var nodes = xml.evaluate(path, xml, null, XPathResult.ANY_TYPE, null);

        var result = nodes.iterateNext();

        while (result) {

            txt += result.childNodes[0].nodeValue + "<br>";

    nums=('' + result.childNodes[0].nodeValue).split(' ');

    for (ii=0; ii<nums.length; ii++) {

      if (datasofar.indexOf(',[~' + nums[ii] + '~,') == -1) {

       datasofar+=',[~' + nums[ii] + '~,1]';

      } else {

       jk=eval(datasofar.split(',[~' + nums[ii] + '~,')[1].split(']')[0]);

       datasofar=datasofar.replace(',[~' + nums[ii] + '~,' + jk + ']', ',[~' + nums[ii] + '~,' + eval(1 + jk) + ']');

      }

    }

            result = nodes.iterateNext();

        }

    // Code For Internet Explorer

    } else if (window.ActiveXObject || xhttp.responseType == "msxml-document") {

        xml.setProperty("SelectionLanguage", "XPath");

        nodes = xml.selectNodes(path);

        for (i = 0; i < nodes.length; i++) {

            txt += nodes[i].childNodes[0].nodeValue + "<br>";

    nums=('' + nodes[i].childNodes[0].nodeValue).split(' ');

    for (ii=0; ii<nums.length; ii++) {

      if (datasofar.indexOf(',[~' + nums[ii] + '~,') == -1) {

       datasofar+=',[~' + nums[ii] + '~,1]';

      } else {

       jk=eval(datasofar.split(',[~' + nums[ii] + '~,')[1].split(']')[0]);

       datasofar=datasofar.replace(',[~' + nums[ii] + '~,' + jk + ']', ',[~' + nums[ii] + '~,' + eval(1 + jk) + ']');

      }

    }

        }

    }

    //document.getElementById("demo").innerHTML = txt;

    var proposed=document.getElementById('myi').src.split('&data=')[0] + '&data=' + datasofar;

    if (eval('' + proposed.length) < 850) {

    document.getElementById('myi').src=document.getElementById('myi').src.split('&data=')[0] + '&data=' + datasofar;

    document.getElementById('mpi').src=document.getElementById('mpi').src.split('&data=')[0] + '&data=' + datasofar.replace(/\]\,\[/g, ']%20,%20[').replace(',[', ',%20[');

    } else {

    document.getElementById('data').value=datasofar;

    document.getElementById('mybut').click();

    document.getElementById('datap').value=datasofar.replace(/\]\,\[/g, '] , [').replace(',[', ', ['); // ,%20[~45~,23]%20,%20[~

    document.getElementById('mybutp').click();

    }

    document.getElementById('myi').style.display='block';

    document.getElementById('mpi').style.display='block';

}
|
<response>

<row>

<row _id="row-nx2r_usun.g52b" _uuid="00000000-0000-0000-9D99-B9EA775FDC5E" _position="0" _address="https://data.ny.gov/resource/d6yy-54nr/row-nx2r_usun.g52b">

<draw_date>2020-09-26T00:00:00</draw_date>

<winning_numbers>11 21 27 36 62 24</winning_numbers>

<multiplier>3</multiplier>

</row>

<row _id="row-e8ru_54jr.pm4v" _uuid="00000000-0000-0000-43B5-52ACB7706E11" _position="0" _address="https://data.ny.gov/resource/d6yy-54nr/row-e8ru_54jr.pm4v">

<draw_date>2020-09-30T00:00:00</draw_date>

<winning_numbers>14 18 36 49 67 18</winning_numbers>

<multiplier>2</multiplier>

</row>

<row _id="row-tq8m.jys2~s8vu" _uuid="00000000-0000-0000-A5B2-0AAE86635EA3" _position="0" _address="https://data.ny.gov/resource/d6yy-54nr/row-tq8m.jys2~s8vu">

<draw_date>2020-10-03T00:00:00</draw_date>

<winning_numbers>18 31 36 43 47 20</winning_numbers>

<multiplier>2</multiplier>

</row>

<row _id="row-fyha_3jj2-8cdk" _uuid="00000000-0000-0000-8755-E68E26427D31" _position="0" _address="https://data.ny.gov/resource/d6yy-54nr/row-fyha_3jj2-8cdk">

<draw_date>2020-10-07T00:00:00</draw_date>

<winning_numbers>06 24 30 53 56 19</winning_numbers>

<multiplier>2</multiplier>

</row>

<row _id="row-t7k7-dhjv-h47w" _uuid="00000000-0000-0000-EF27-CF03FBB38022" _position="0" _address="https://data.ny.gov/resource/d6yy-54nr/row-t7k7-dhjv-h47w">

<draw_date>2020-10-10T00:00:00</draw_date>

<winning_numbers>05 18 23 40 50 18</winning_numbers>

<multiplier>3</multiplier>

</row>

// many more rows here

// end of many more rows

</row>

</response>
|
… this codeline’s “slicing through complexity” cut through, perfectly suited to the XML data scenario above, presenting those Google Chart displays, as the end result.
If this was interesting you may be interested in this too.


