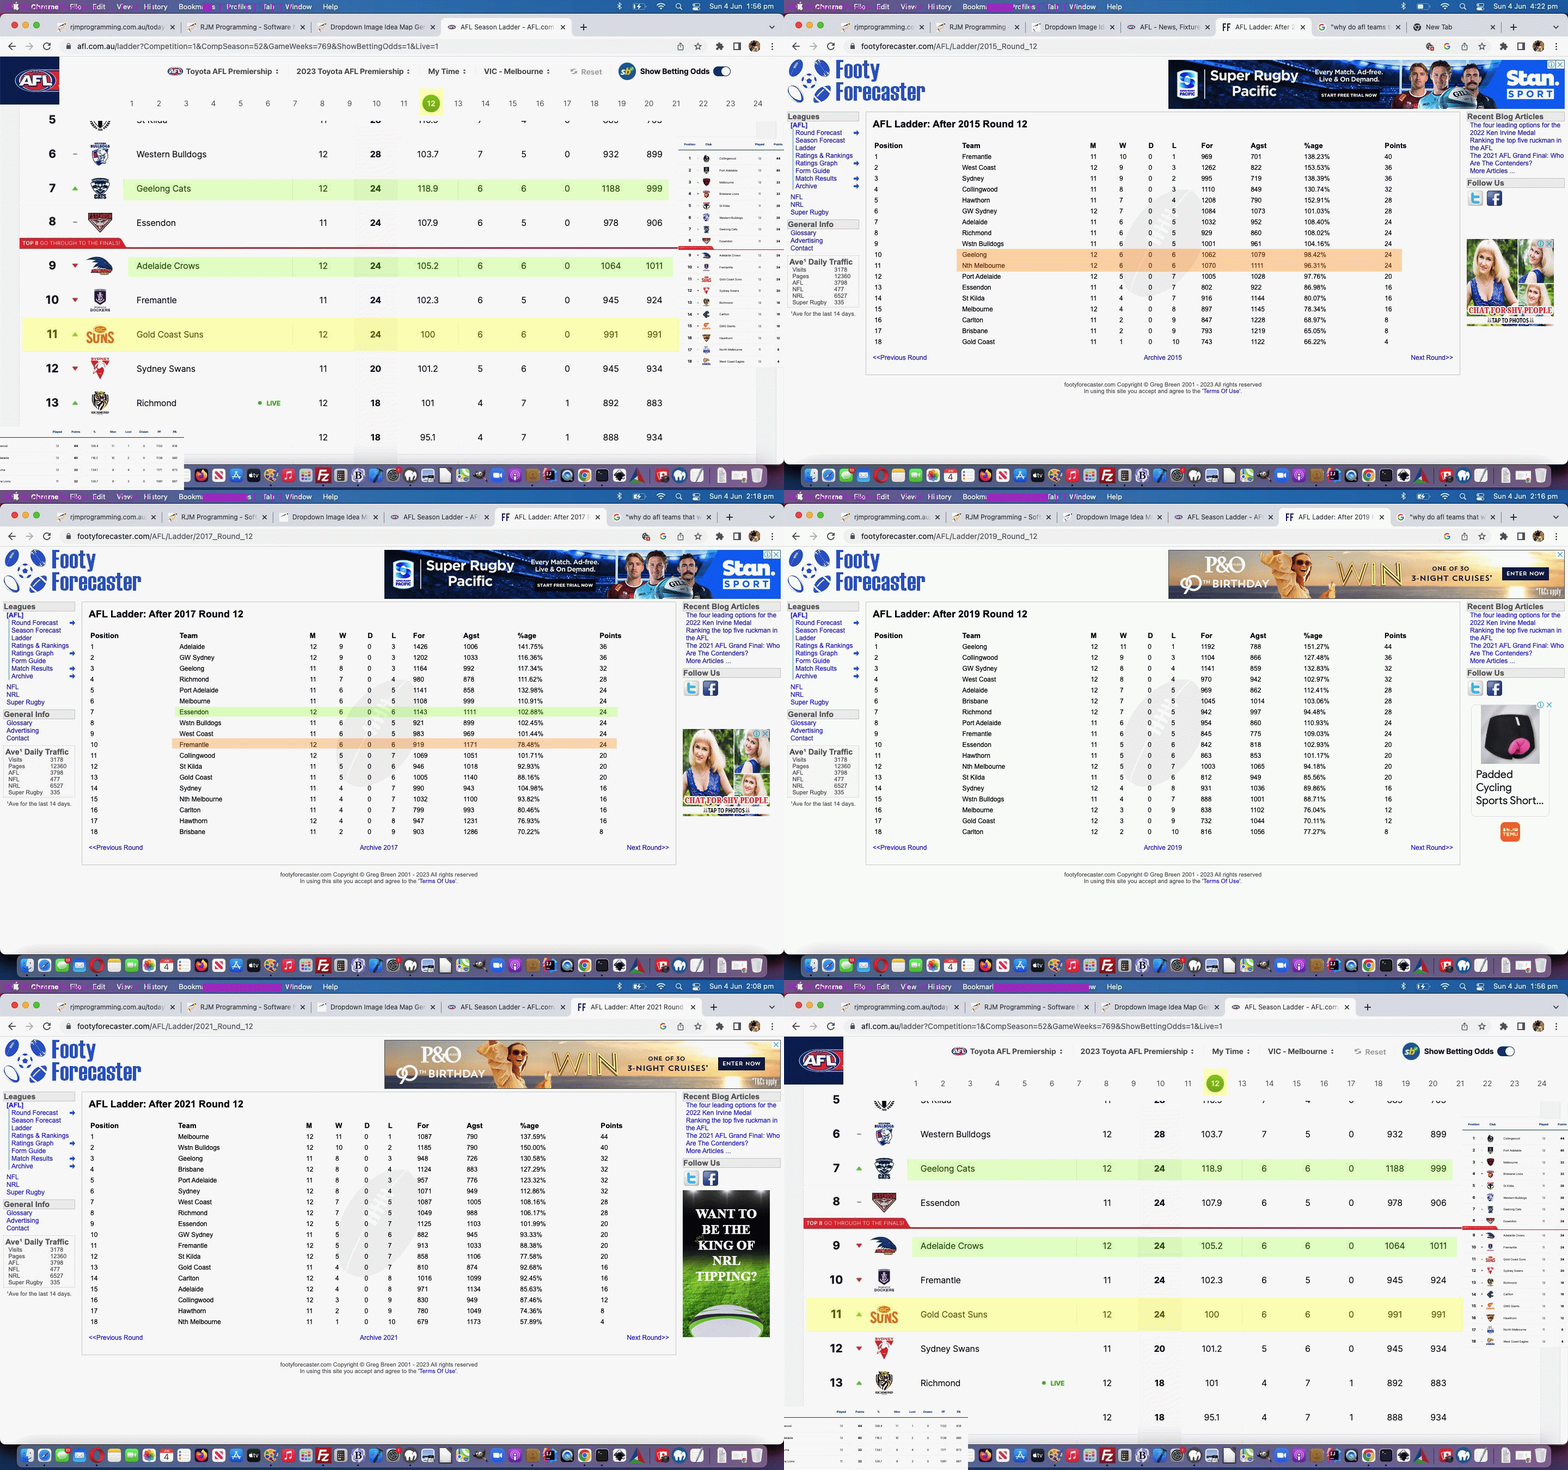
It’s midway through our home and away part to the AFL (Australian Football League) season here in Australia. Of course we’d like to rave about the brilliance of the all-conquering 2023 Collingwood magpies, but now is not the time … it’s only “midway”!
However, statistically, we watchers of the AFL Ladder (whether live, on weekends, or not) might see a bit of “spookiness” in the middle of the ladder, where top 8 finals aspirations still run deep, where …
- Gold Coast Suns … in …
- round 12 of 24 home and aways … have …
- won 6 …
- lost 6 … involving …
- points for 991 …
- points against 991 … resulting in …
- percentage 100.0%
… and they are at the bottom of the …
- won 6 …
- lost 6 …
… ladder list (because all 6/6 others have a percentage above 100.0%) here at this halfway point. Does aspiration beat statistics, and mathematics? We tried Google searches in case there is an “aspiration bias”, but could not frame a proper working question, so any mathematicians or statisticians out there with ideas, feel free to leave a comment?!
But we decided to leave “spookiness” thoughts behind, and tried a more “scientific approach” by looking at past Round 12 snapshots, and it somewhat eased my “spookiness” thoughts. Some 6/6 teams over recent years have had percentages below 100.0%. Actually, my relief was palpable, as we do believe in logic and mathematics and non-warped statistics. Still, and all, if someone does have a second hand ouija board you know that the comments section is only a short downward distance away?!
If this was interesting you may be interested in this too.


