We were thankful and tickled pink recently, learning how to absolutely position SVG from this great link and which first helped out with Area Graphs, as we explain …
Area Graph challenge primarily revolved around how to create polygonal backgrounds, and here we got great help from both encasing SVG within an absolutely positioned HTML div in order to control SVG positioning (thanks heaps) and regarding Area Chart looks to end up with some Area Graph only Javascript …
      if (document.getElementById('h1column').innerHTML == 'Area') { // thanks to https://stackoverflow.com/questions/41988955/absolute-positioning-of-svg-element-not-working and https://datavizcatalogue.com/methods/area_graph.html

        var mintop=Math.min(eval('' + document.getElementById('hrlg' + lasthr).style.top.replace('px','')),  eval('' + document.getElementById('hrlg' + hrlgcnt).style.top.replace('px','')));

        var minleft=Math.min(eval('' + document.getElementById('hrlg' + lasthr).style.left.replace('px','')),  eval('' + document.getElementById('hrlg' + hrlgcnt).style.left.replace('px','')));

        var thisheight=Math.abs(zerozeroy - mintop);

        var thiswidth=Math.abs(eval('' + document.getElementById('hrlg' + lasthr).style.left.replace('px','')) - eval('' + document.getElementById('hrlg' + hrlgcnt).style.left.replace('px','')));

        var az='<div class="svg-container" style="opacity:0.5;position:absolute;top:' + Math.floor(eval(14 + mintop)) + 'px;left:' + Math.floor(minleft) + 'px;width:' + Math.floor(thiswidth) + 'px;height:' + Math.floor(thisheight) + 'px;"><svg height="100%" width="100%"><polygon points="'; //0,0 ' + Math.floor(eval('' + dwl) + eval(eval('' + dw) / 2)) + ',0 ' + Math.floor(eval('' + dwl) + eval(eval('' + dw) / 2)) + ',' + Math.floor(eval(yfactor * eval(eval('' + yvalue) - eval('' + yoffset)))) + ' ' + Math.floor(eval('' + dwl) + eval(eval('' + dw) / 2)) + ',' + Math.floor(eval(yfactor * eval(eval('' + yvalue) - eval('' + yoffset)))) + '" style="fill:lime;stroke:purple;stroke-width:1" /></svg></div>';

        az+='' + Math.floor(eval('' + document.getElementById('hrlg' + lasthr).style.left.replace('px','')) - minleft) + ',';

        az+='' + Math.floor(eval('' + document.getElementById('hrlg' + lasthr).style.top.replace('px','')) - mintop) + ' ';

        az+='' + Math.floor(eval('' + document.getElementById('hrlg' + hrlgcnt).style.left.replace('px','')) - minleft) + ',';

        az+='' + Math.floor(eval('' + document.getElementById('hrlg' + hrlgcnt).style.top.replace('px','')) - mintop) + ' ';

        az+='' + Math.floor(eval('' + document.getElementById('hrlg' + hrlgcnt).style.left.replace('px','')) - minleft) + ',';

        az+='' + Math.floor(eval(eval(eval('' + zerozeroy)) - mintop)) + ' ';

        az+='' + Math.floor(eval('' + document.getElementById('hrlg' + lasthr).style.left.replace('px','')) - minleft) + ',';

        az+='' + Math.floor(eval(eval(eval('' + zerozeroy)) - mintop)) + ' ';

        az+='" style="fill:' + acol + ';stroke:purple;stroke-width:1" /></svg></div>';

        document.getElementById('daxes').innerHTML+=az;

      }
… half the day gone
… idea from HTML Square Horizontal Rule Four Graphs Tutorial the other day, and then we used that same technique incorporated with HTML map element scenarios when we presented HTML Map Element SVG Context Tutorial.
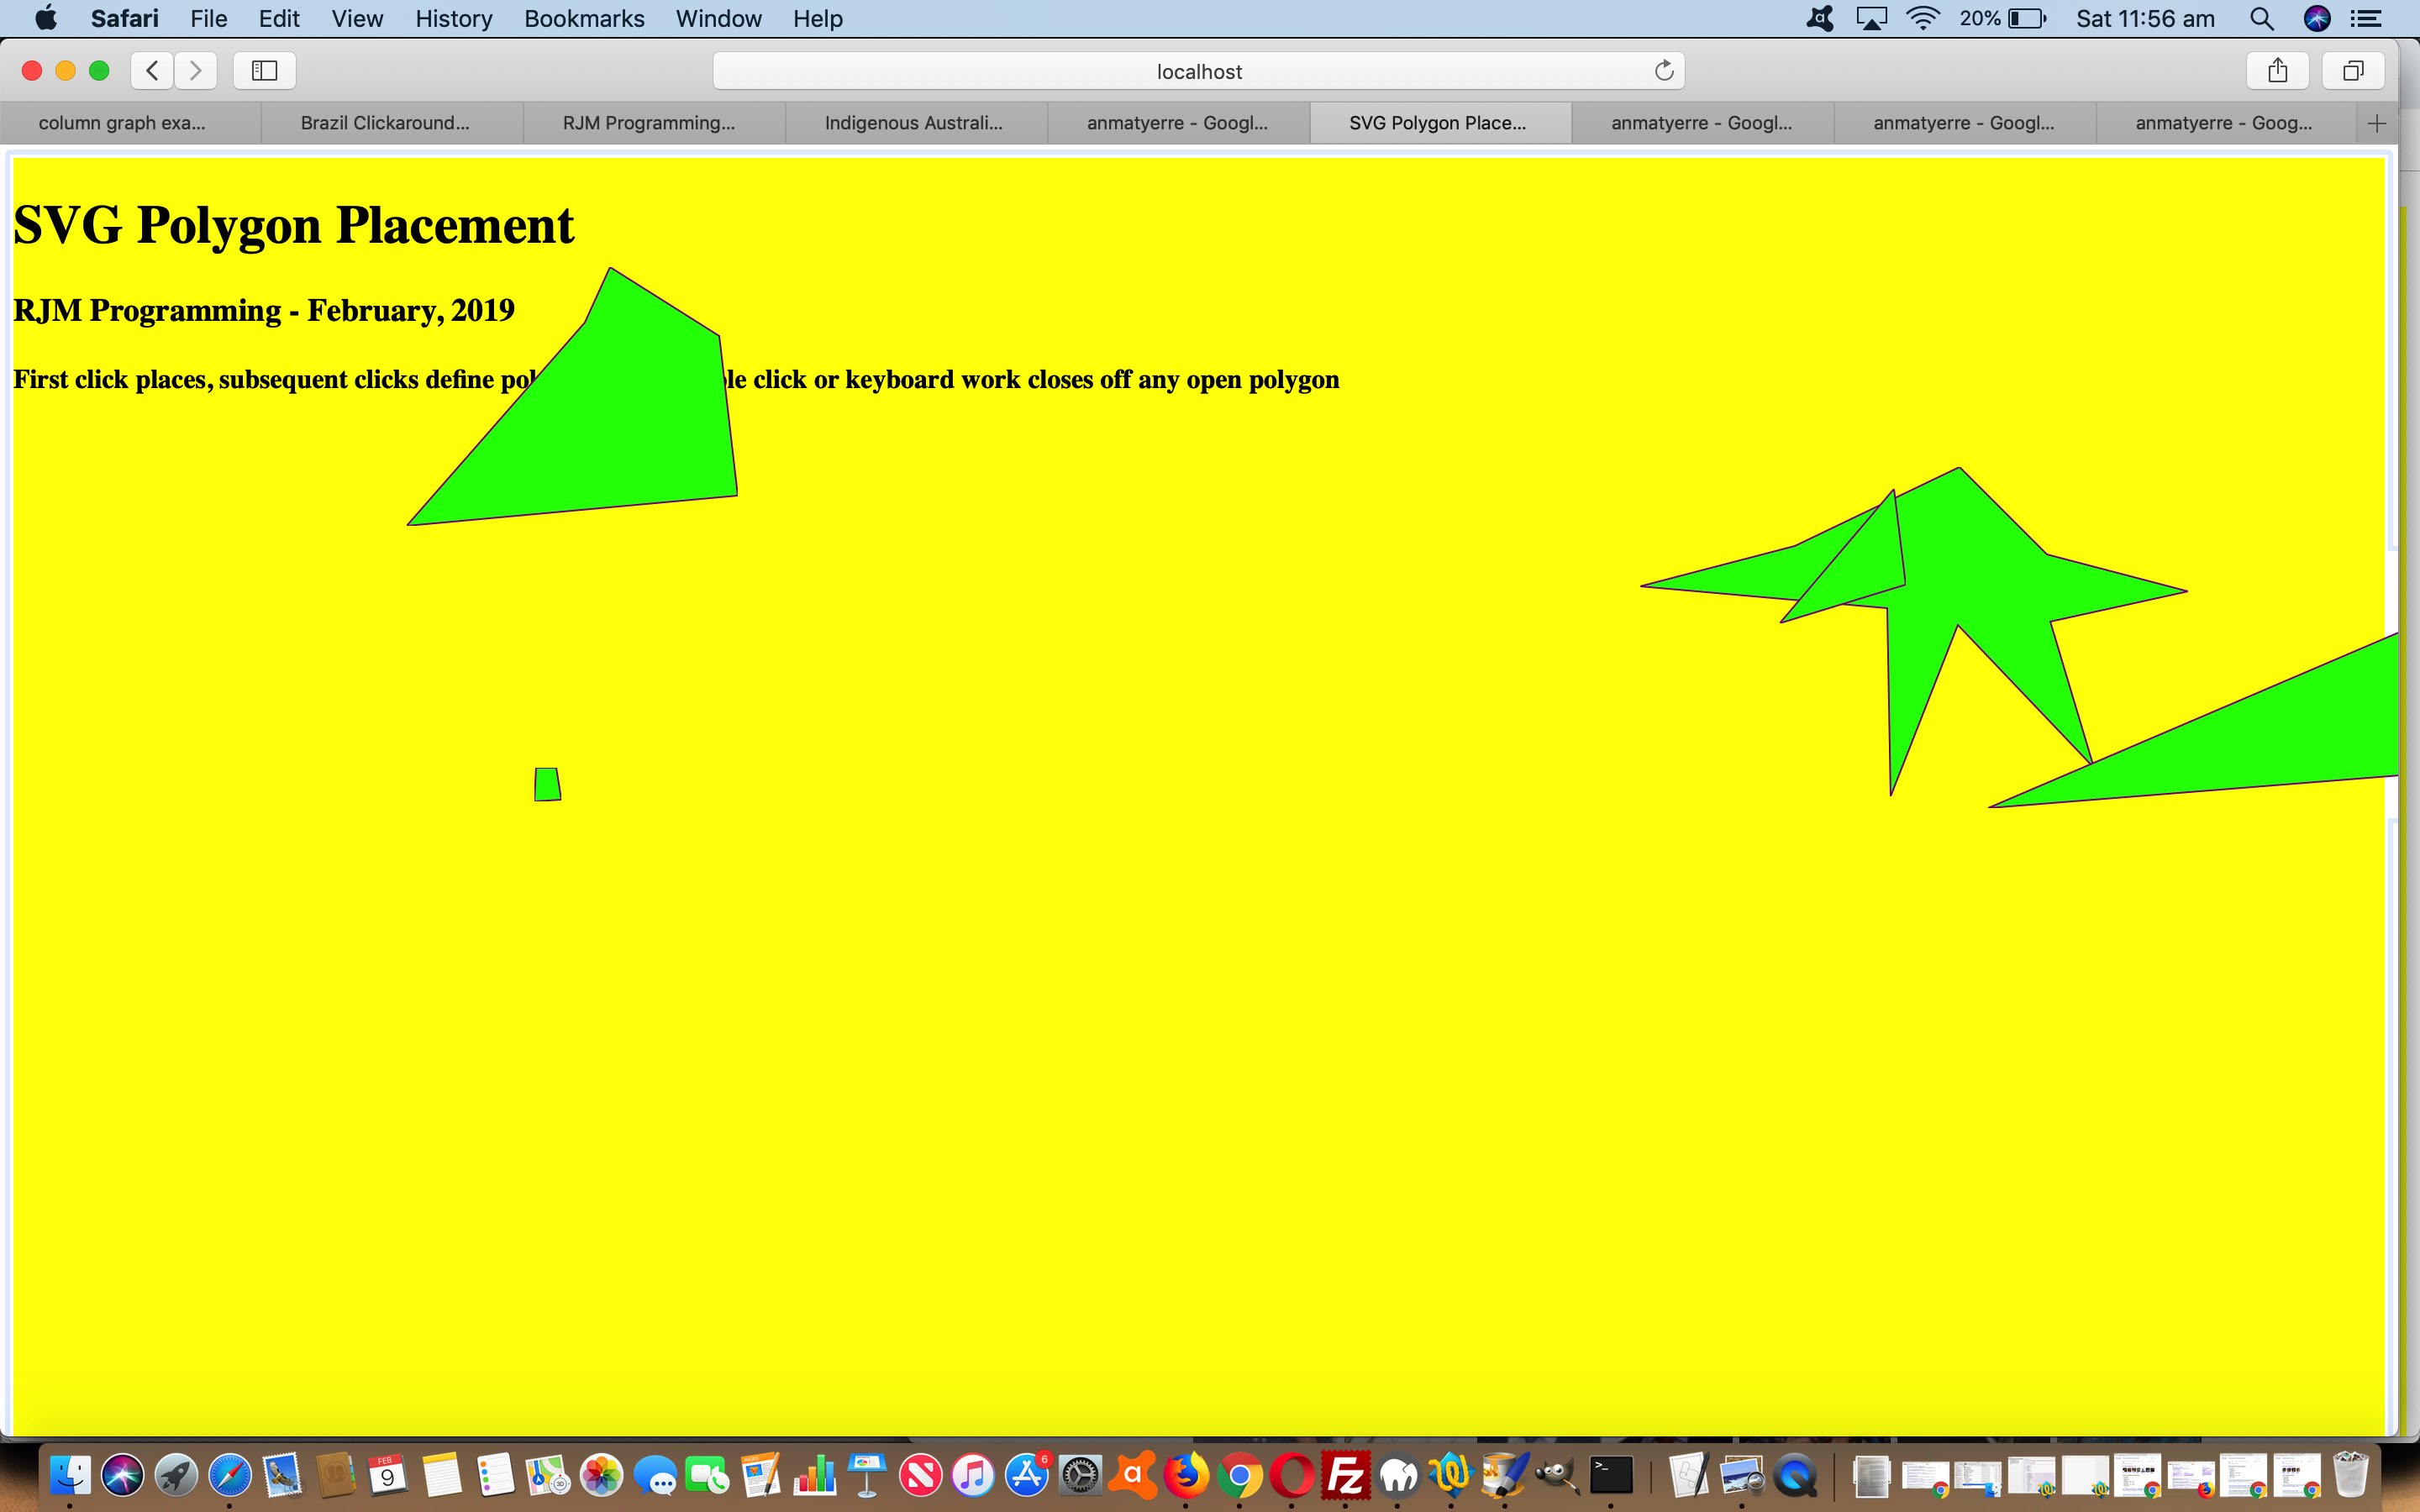
However, we want to explore this concept as the central theme of a web application, as much as anything because we think we’ll turn up more uses for this idea that way, and so, today, we have a “proof of concept” web application with very little to it other than the ability for the user to create their own “lime” SVG polygon shapes whereby …
- click one determines top left position of SVG (nested within its position:absolute HTML div element parent, which in turn is ordered within the HTML within a width:100% height:100vh grandparent element (contenteditable=true) which is position:relative within document.body (within Newtown, within Sydney, within Australia, within Oceania, within Earth, within Solar System, within Milky Way, within Universe (but we digress a little)))
- other subsequent clicks define polygon vertices until a doubleclick or keyboard intervention (remember “contenteditable=true”), when the polygon is closed off and a “lime” infilled SVG then displayed on the webpage
As easy as falling off a log (without “a rhythm” … chortle, chortle)! Feel free to try this “proof of concept” svg_position.html‘s live run link for yourself.
Previous relevant HTML Square Horizontal Rule Four Graphs Tutorial is shown below.
Yesterday’s Mathematical Induction n + 1 feeling HTML Square Horizontal Rule Line Graph Tutorial dealt with the simpler two …
- Column Graph
- Line Graph … the scaffolding needed for today’s harder work to add functionality for …
- Area Graph
- Bar Graph
… where …
- Area Graph challenge primarily revolved around how to create polygonal backgrounds, and here we got great help from both encasing SVG within an absolutely positioned HTML div in order to control SVG positioning (thanks heaps) and regarding Area Chart looks to end up with some Area Graph only Javascript …
      if (document.getElementById('h1column').innerHTML == 'Area') { // thanks to https://stackoverflow.com/questions/41988955/absolute-positioning-of-svg-element-not-working and https://datavizcatalogue.com/methods/area_graph.html

        var mintop=Math.min(eval('' + document.getElementById('hrlg' + lasthr).style.top.replace('px','')),  eval('' + document.getElementById('hrlg' + hrlgcnt).style.top.replace('px','')));

        var minleft=Math.min(eval('' + document.getElementById('hrlg' + lasthr).style.left.replace('px','')),  eval('' + document.getElementById('hrlg' + hrlgcnt).style.left.replace('px','')));

        var thisheight=Math.abs(zerozeroy - mintop);

        var thiswidth=Math.abs(eval('' + document.getElementById('hrlg' + lasthr).style.left.replace('px','')) - eval('' + document.getElementById('hrlg' + hrlgcnt).style.left.replace('px','')));

        var az='<div class="svg-container" style="opacity:0.5;position:absolute;top:' + Math.floor(eval(14 + mintop)) + 'px;left:' + Math.floor(minleft) + 'px;width:' + Math.floor(thiswidth) + 'px;height:' + Math.floor(thisheight) + 'px;"><svg height="100%" width="100%"><polygon points="'; //0,0 ' + Math.floor(eval('' + dwl) + eval(eval('' + dw) / 2)) + ',0 ' + Math.floor(eval('' + dwl) + eval(eval('' + dw) / 2)) + ',' + Math.floor(eval(yfactor * eval(eval('' + yvalue) - eval('' + yoffset)))) + ' ' + Math.floor(eval('' + dwl) + eval(eval('' + dw) / 2)) + ',' + Math.floor(eval(yfactor * eval(eval('' + yvalue) - eval('' + yoffset)))) + '" style="fill:lime;stroke:purple;stroke-width:1" /></svg></div>';

        az+='' + Math.floor(eval('' + document.getElementById('hrlg' + lasthr).style.left.replace('px','')) - minleft) + ',';

        az+='' + Math.floor(eval('' + document.getElementById('hrlg' + lasthr).style.top.replace('px','')) - mintop) + ' ';

        az+='' + Math.floor(eval('' + document.getElementById('hrlg' + hrlgcnt).style.left.replace('px','')) - minleft) + ',';

        az+='' + Math.floor(eval('' + document.getElementById('hrlg' + hrlgcnt).style.top.replace('px','')) - mintop) + ' ';

        az+='' + Math.floor(eval('' + document.getElementById('hrlg' + hrlgcnt).style.left.replace('px','')) - minleft) + ',';

        az+='' + Math.floor(eval(eval(eval('' + zerozeroy)) - mintop)) + ' ';

        az+='' + Math.floor(eval('' + document.getElementById('hrlg' + lasthr).style.left.replace('px','')) - minleft) + ',';

        az+='' + Math.floor(eval(eval(eval('' + zerozeroy)) - mintop)) + ' ';

        az+='" style="fill:' + acol + ';stroke:purple;stroke-width:1" /></svg></div>';

        document.getElementById('daxes').innerHTML+=az;

      }
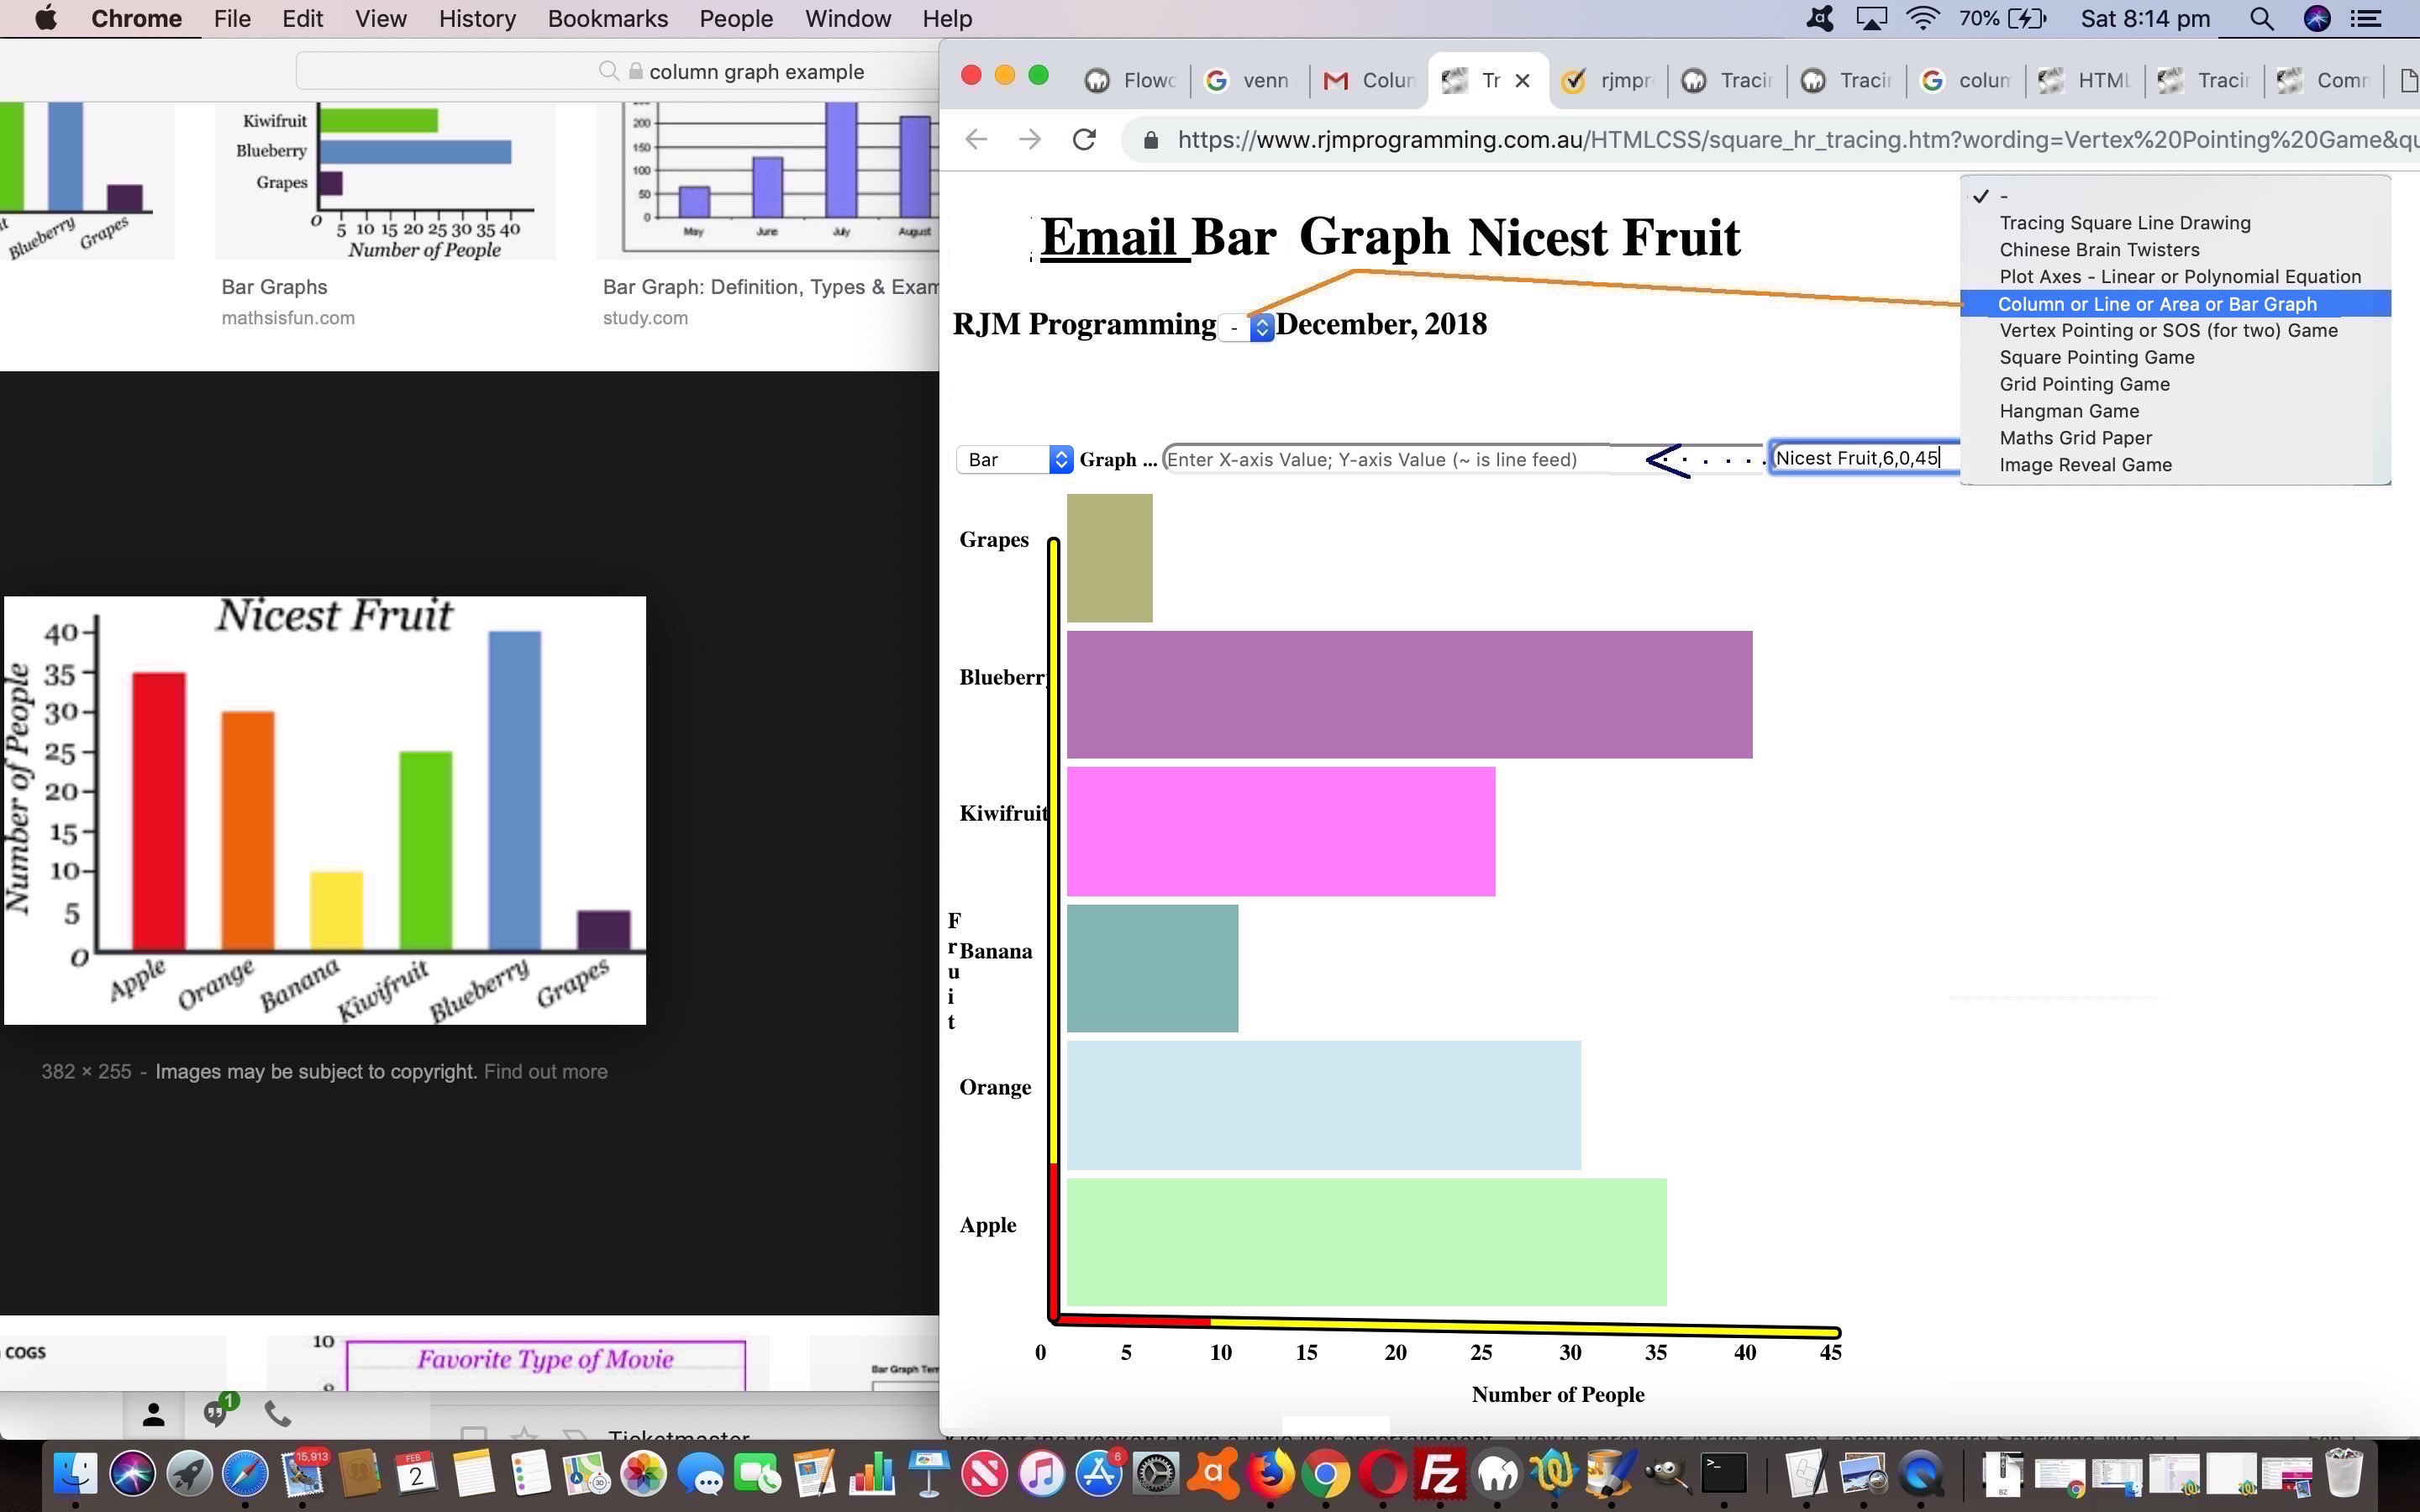
… half the day gone … while … - Bar Graph challenge was the posterior-about-visage way X is Y and Y is X about it, and deciding on a messaging strategy, that being in broad brush terms …
- sending out a URL into an email link URL the order of first and second items in any semicolon separated data is reversed (so as to fit in with the other 3 graph types) … meaning that …
- as you get into the web application an email link to a Bar Graph and before it is “fed” to our one hard working textbox (in order … doh!) you re-reverse the message first and second items of a semicolon separated record (to fit back in with Bar Graph thinking)
… another half day gone … getting the X is Y and Y is X display aspects correct
Well, at least yesterday paved the way for “where” we plugged in these changes … phew!
To see the four graphs in action please don’t be shy trying the changed square_hr_tracing.htm‘s Bar Graph live run or Area Graph live run or Line Graph live run or Column Graph live run link.
Previous relevant HTML Square Horizontal Rule Line Graph Tutorial is shown below.
Software integration work, whether it be internally in amongst your own code, or externally, integrating with APIs and our software sharing arrangements, needs to be approached systematically, and not in a rush. As such, we find the general idea of mathematical induction, as we first came across in high school mathematics …
The method of induction requires two cases to be proved. The first case, called the base case (or, sometimes, the basis), proves that the property holds for the number 0. The second case, called the induction step, proves that, if the property holds for one natural number n, then it holds for the next natural number n + 1. These two steps establish the property P(n) for every natural number n = 0, 1, 2, 3, … The base step need not begin with zero. Often it begins with the number one, and it can begin with any natural number, establishing the truth of the property for all natural numbers greater than or equal to the starting number.
… both a useful way to approach many of these software integration jobs, as well as almost forcing calm, and the absence of dangerous rushing, with the coding tasks at hand. Yes, proving anything for one case, yesterday’s HTML Square Horizontal Rule Column Graph Tutorial one being Column Graphs, is all well and good, but it would be dangerous to step straight to integrate all four that we intend to do (those being Column, Line, Bar, Area Graphs), in one step. As mathematical induction would tell us, prove it for n + 1, that being Line Graphs in today’s case.
When you integrate for n + 1 you almost invariably sort out …
- HTML element type requirements for your current integration drive
- sharing arrangement nuances, including those coming back from email links
- data and display code places for where to differentiate, and to come back to when we start integrating the other two Graph types later
- navigation requirements within the domain of the web application, for us with this work, mainly centering around manipulations of Javascript location.hash containing the parts of a URL including and after the hash (ie. #) character
… matters that should not be rushed when several options of functionality are flying about being integrated (no doubt on the “flying about being integrated” cycle).
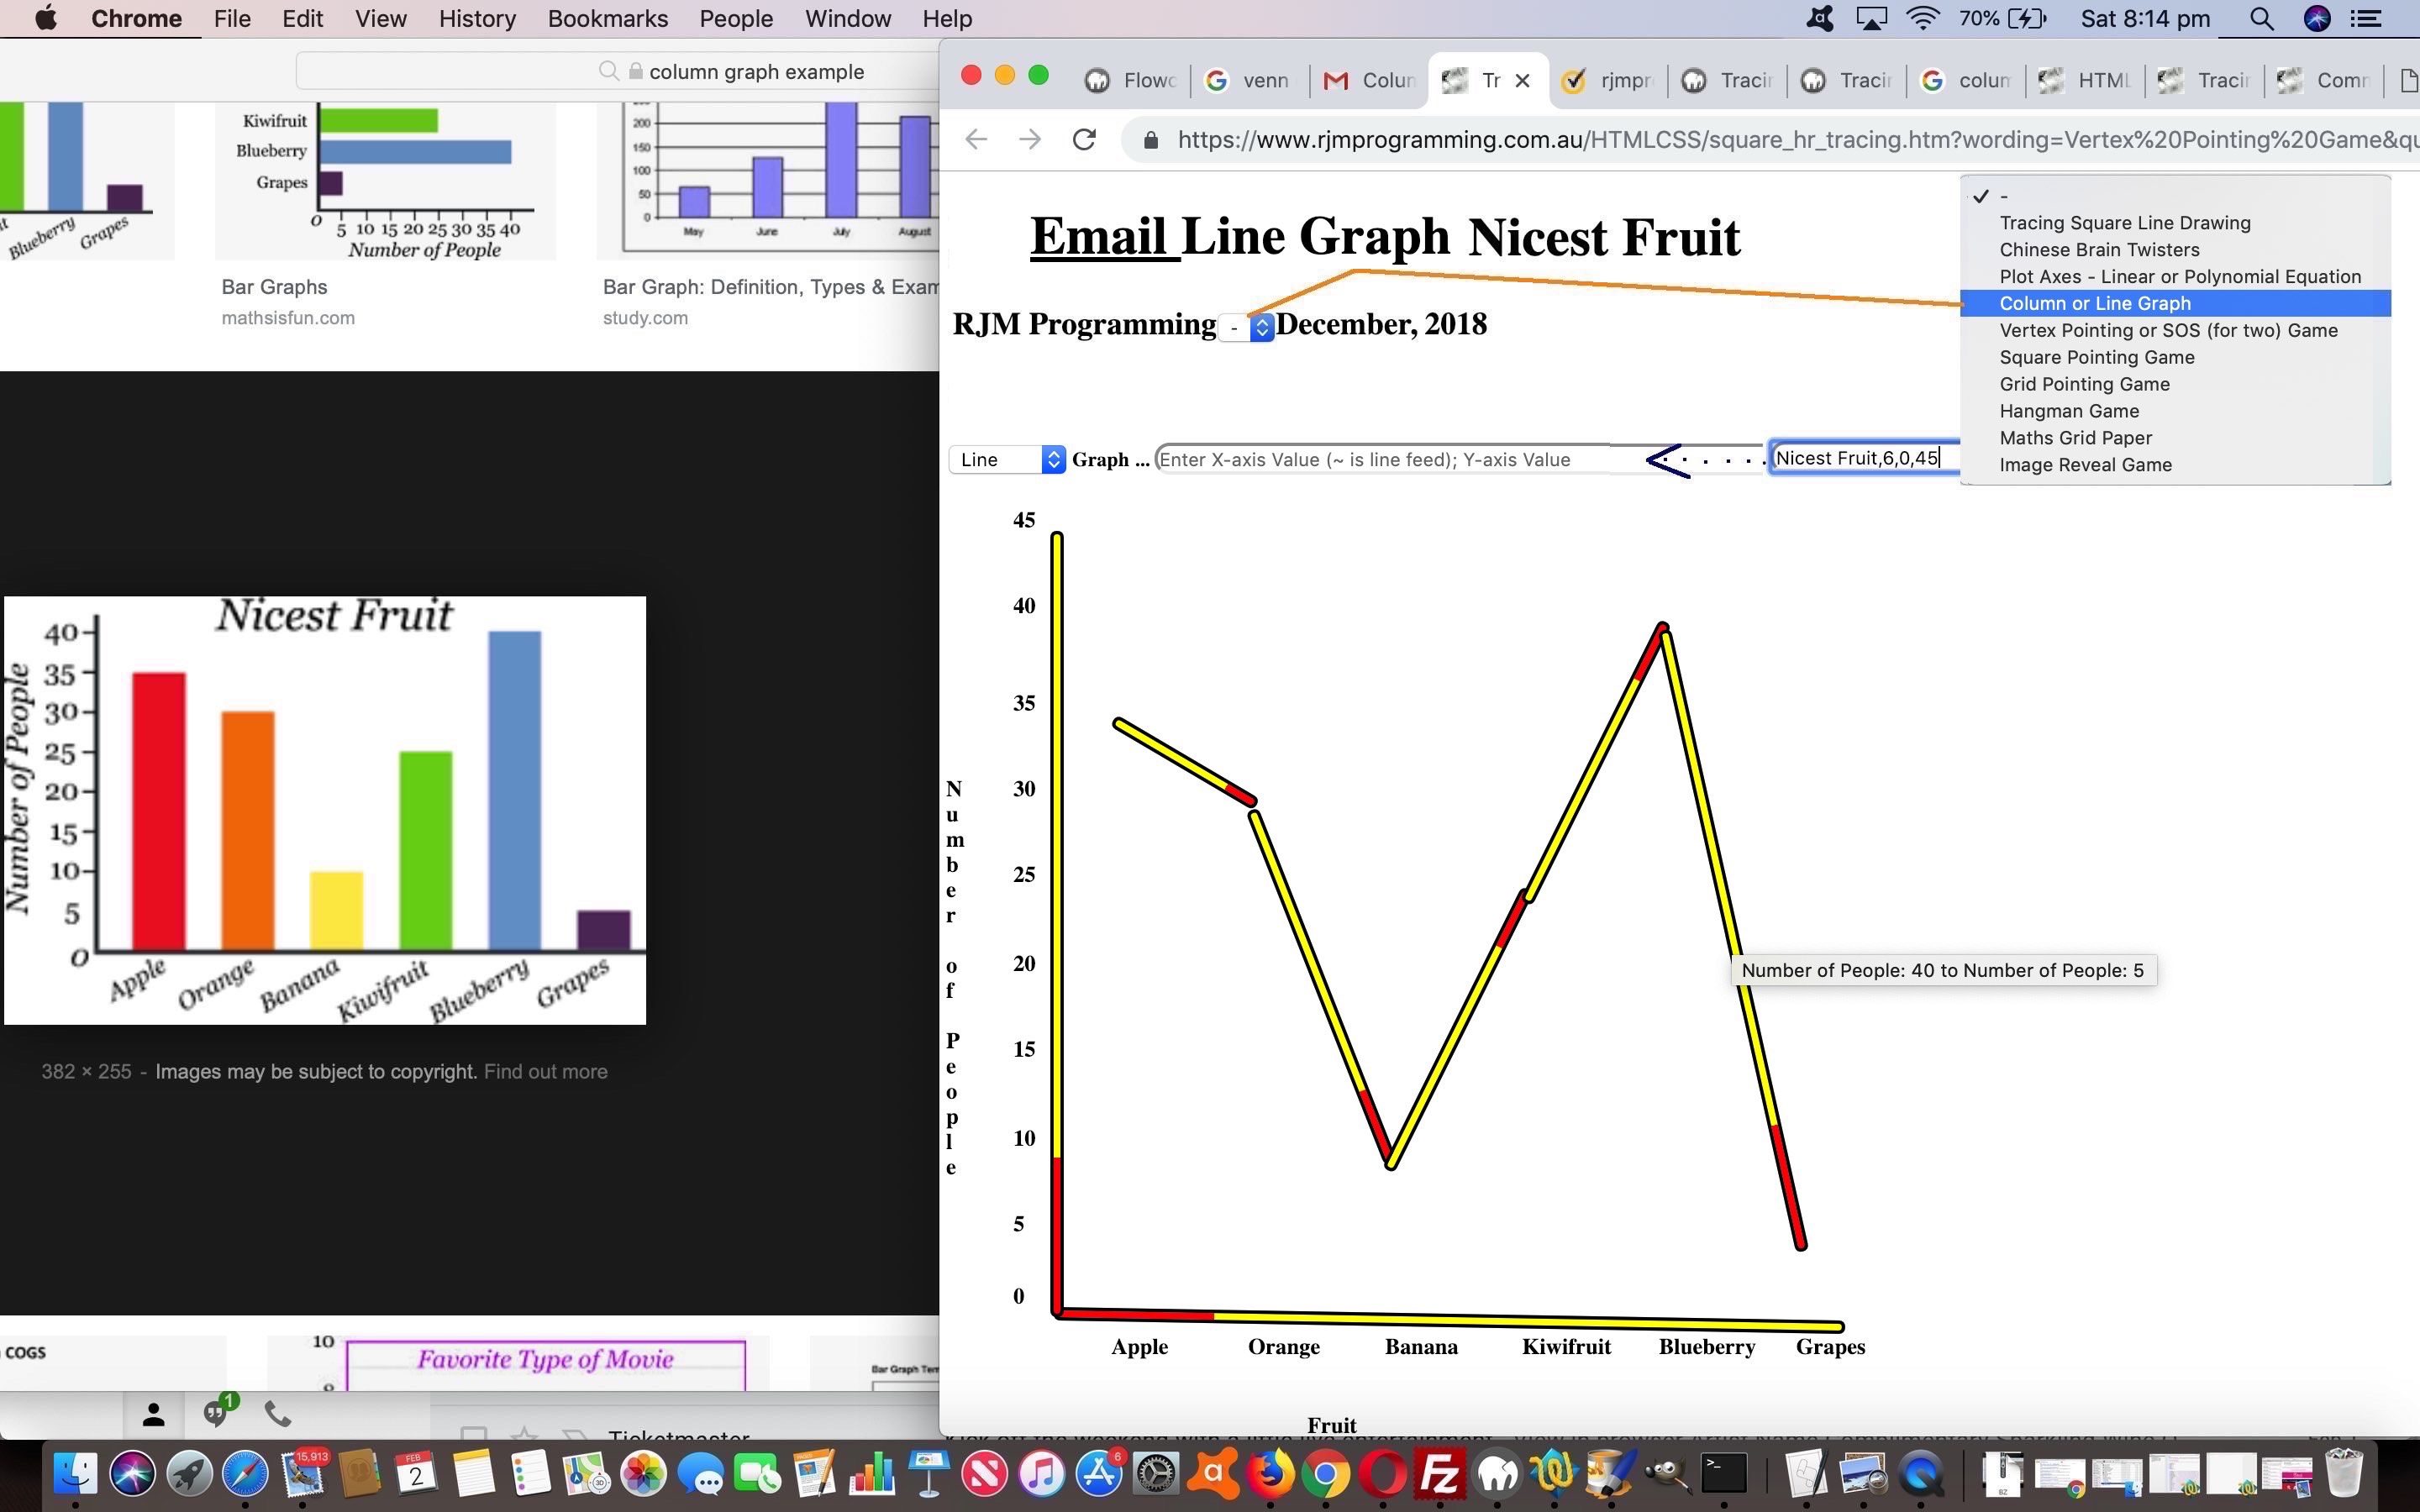
And so, even though what differentiates a Column Graph from a Line Graph is more a “display thaing” (as you might have surmised with the Google Charts integration work we’ve done here in the past), as the same data set can be represented by either Graph, from what we’ve seen, you end up spending most of the time coding for such a change readying yourself for the arrival of three new graphs, rather than the Line Graph per se. Doesn’t mean you’re wasting time, quite the contrary. Testing on two functionality parts that are similar but different can have you testing all this integration work in a systematic, ticking the boxes, way to pave the way for faster work later with integration of Graph types that do need more “display difference” thinking. Where having ground away at n + 1 Mathematical Induction helps again here, will be that thought processes can concentrate on those more tricky “display differences” without being clouded out by the “administration” issues of that list above we have gone towards roboticizing for the next stage of integration.
Again, we’d like to thank this useful link for the inspiration with today’s tutorial picture of this worked example also shown below …
Please don’t be shy trying the changed square_hr_tracing.htm‘s Line Graph live run link.
Previous relevant HTML Square Horizontal Rule Column Graph Tutorial is shown below.
We follow up yesterday’s HTML Square Horizontal Rule Plot Polynomial Tutorial mathematical theme with a mathematics meets statistics theme, today, writing some functionality to create Column Graphs. Like with the Plot functionalities we like having the vertices there, but that little bit different is that we make those vertex helpers disappear once the Column Graph has been created, and perhaps, shared, via similar Email sharing logic to that introduced yesterday.
Identical to Like yesterday we have 3 parts to user input involving that one textbox again …
- four comma separated fields involves a
plot range entry(Column Graph) Title, Number of data sets, Minimum Y (numerical), Maximum Y … whereas … three commatwo semicolon separated fields involves apolynomial equation entryX-Axis label; Y-Axis label (for numerical) … whereas …- two
commasemicolon separated fields involvesalinear equationX value; Y value ask for each of the (Number of) data sets
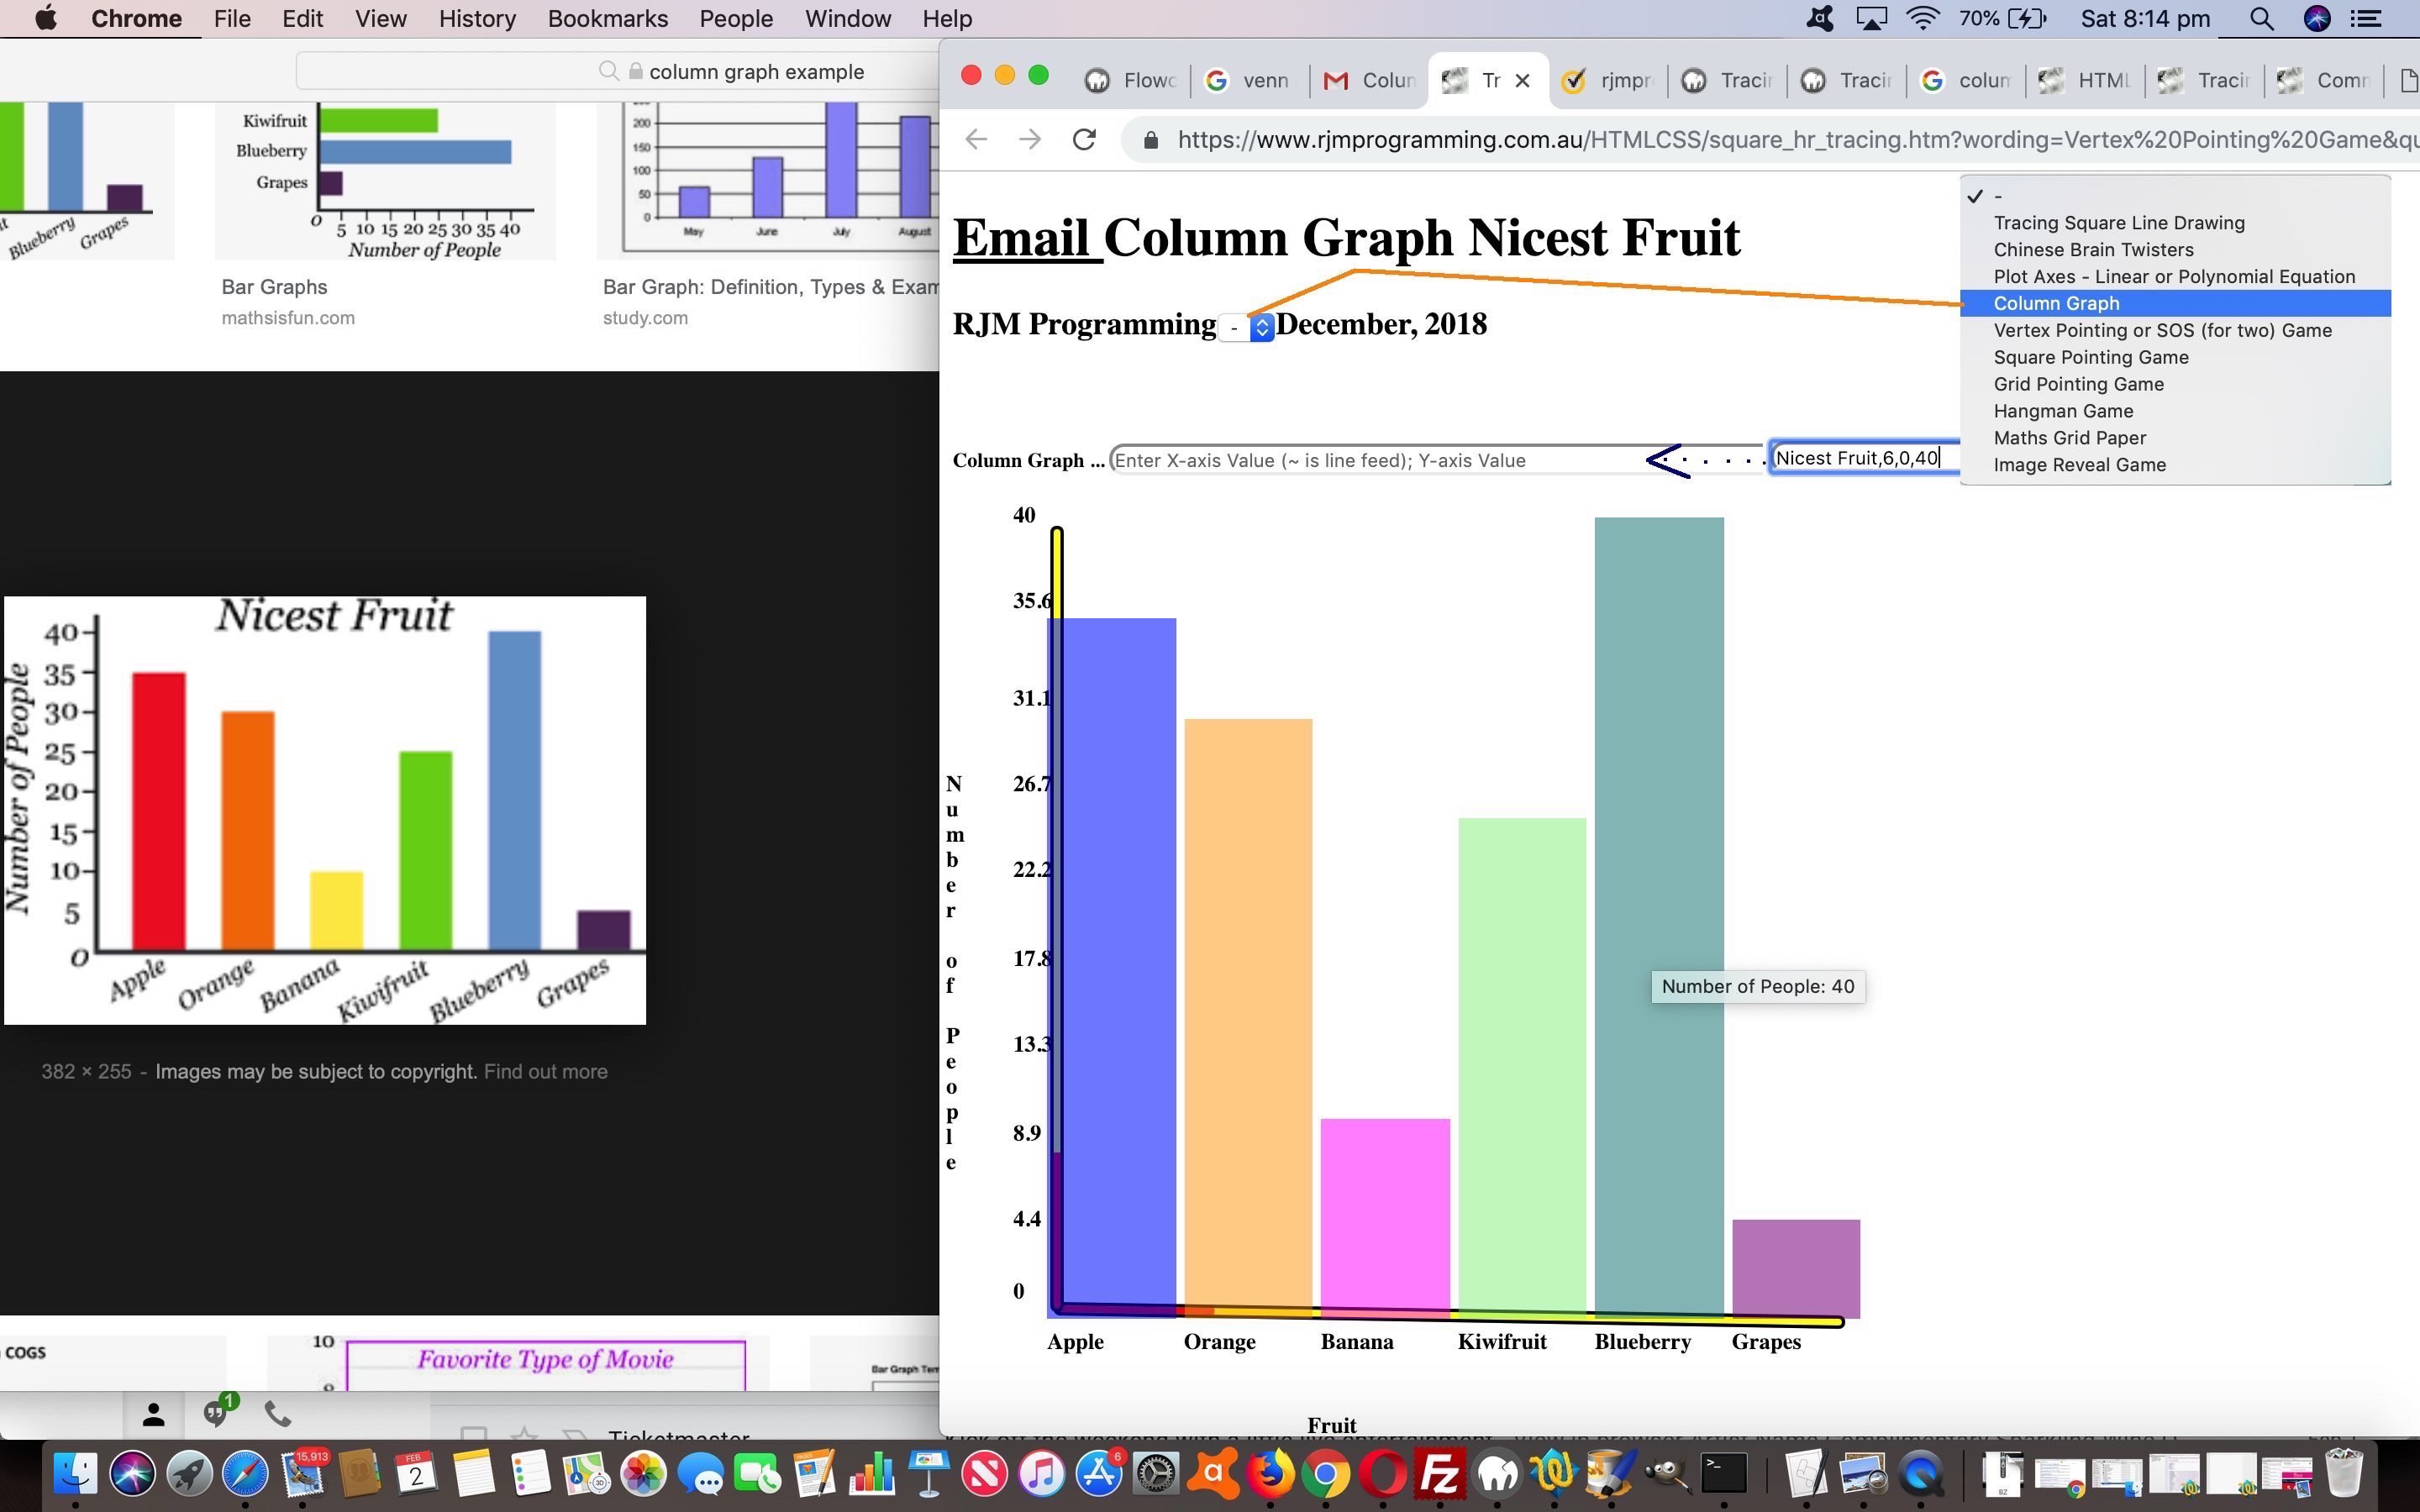
As you would know if you think about a Column Graph it is debatable on the X-Axis (non-numerical) labelling if you …
- try to fit the X-Axis labels in below the column (that we randomly colour with opacity 0.5) … or …
- create a legend
… and we’ve decided on the former, but may reserve final judgement on this over time, perhaps writing code later to determine which approach would look better, and use that approach when apt. We’ll see.
We’d like to thank this useful link for the inspiration with today’s tutorial picture of this worked example (where a trap for young players sees us setting the Maximum Y value from 40 to 45 (as a multiple of 9 (Y-axis segments left for graph (after surrounds)) to avoid “decimal fractions of people”) also shown below …
Early days, but interesting days, and it goes without saying, we would listen to your feedback on trying the changed square_hr_tracing.htm‘s Column Graph live run link.
Previous relevant HTML Square Horizontal Rule Plot Polynomial Tutorial is shown below.
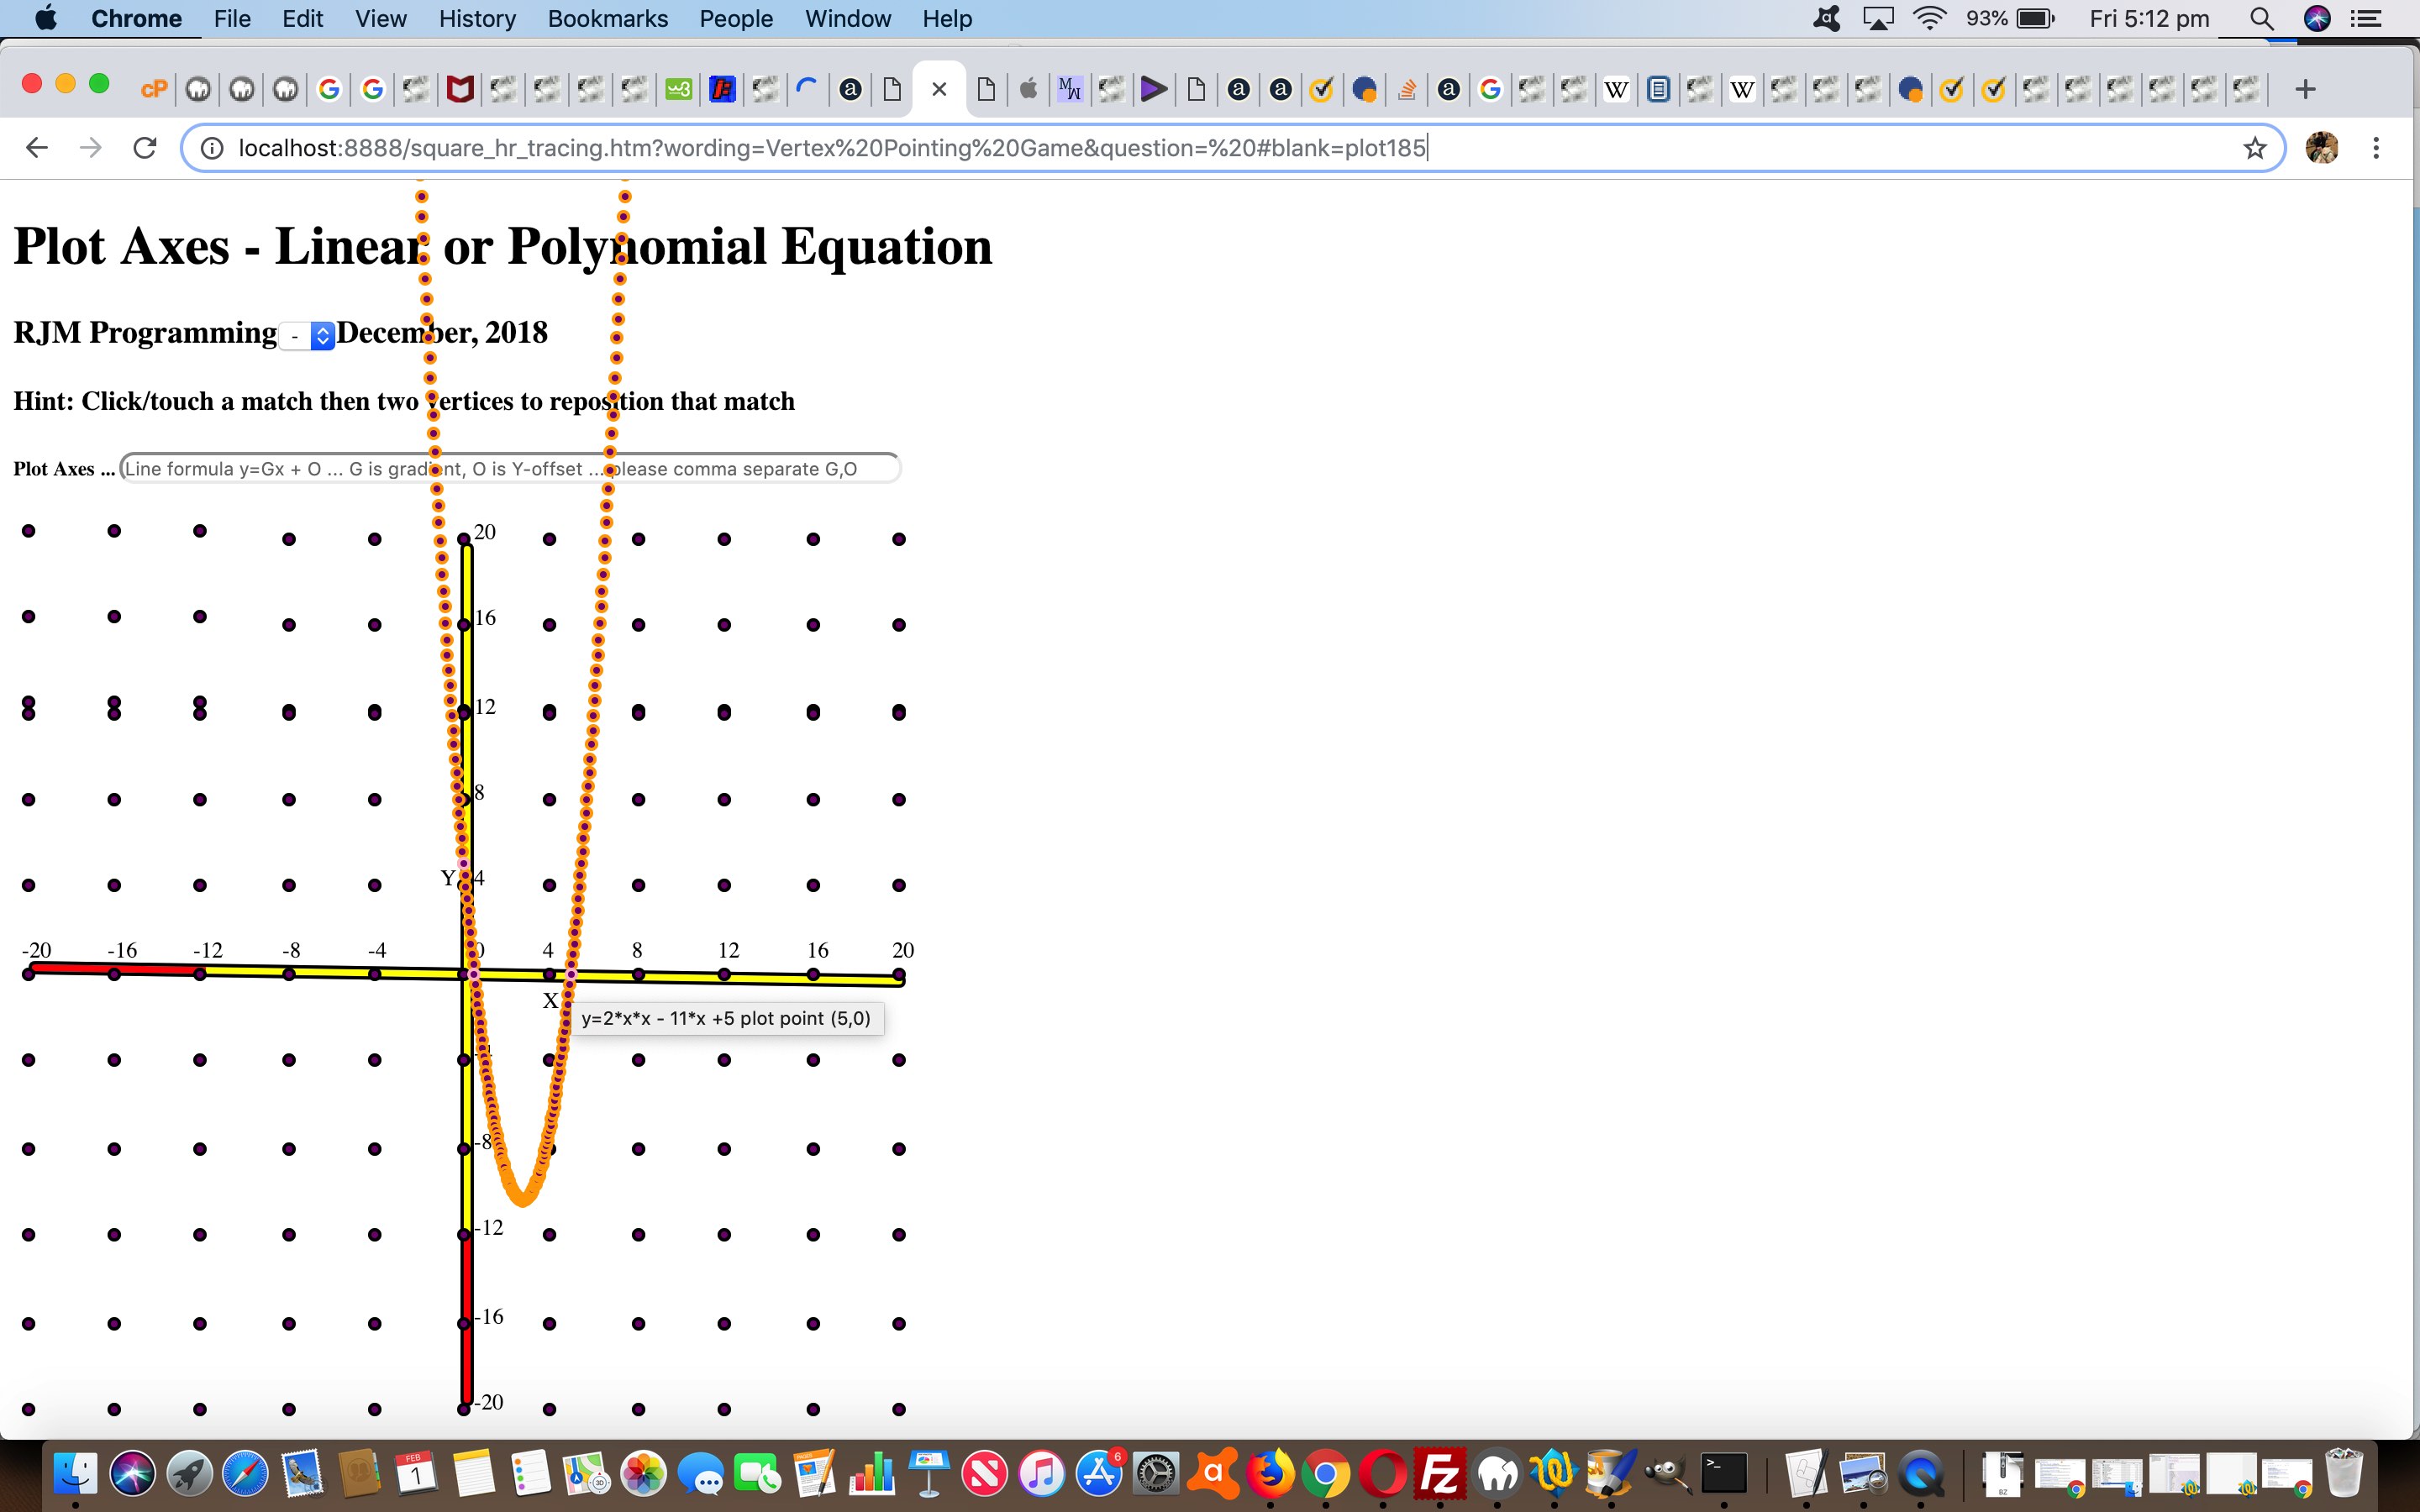
Yesterday’s HTML Square Horizontal Rule Plot Axes Tutorial start with …
- linear equation plotting … has been extended today (by one dimension) to …
- polynomial equation
… and along the way we …
- highlight Y axis intercepts and X axis intercepts
- limit the plotting range to the range the user selected first off
- label the axes … and sharing wise we allow …
- email link collaboration
What else is new to us, and perhaps to you, today? It’s the “Eat at Joes” type of idea to effectively animate an HTML input type=text textbox. Why, pray tell. Two reasons occur to us …
- as we do more and more web application coding we find the labelling of HTML input type=textbox textboxes “externally” (ie. creating another different HTML element of some sort sitting adjacent to textbox) annoying in the sense of easily making it look good … but more and more …
- as we do more and more web application coding we find the use of the “placeholder” attribute of HTML input type=textbox textboxes useful and easy … and today we do some inhouse animation, because we have two bits of functionality available and decipherable from the one textbox because an entry with …
- four comma separated fields involves a plot range entry … whereas …
- three comma separated fields involves a polynomial equation entry … whereas …
- two comma separated fields involves a linear equation … so, that being the case …
… we get that first one above as information off the user and immediately animate via a setTimeout invocation (ie. setTimeout(toggleplaceholder, 5000); ) via the textbox “placeholder” attribute via …
  function toggleplaceholder() {

    if (oiois != null) {

      if (oiois.value == '') {

         if (oiois.placeholder != 'Line formula y=Gx + O ... G is gradient, O is Y-offset ... please comma separate G,O') {

           oiois.placeholder='Line formula y=Gx + O ... G is gradient, O is Y-offset ... please comma separate G,O';

         } else {

           oiois.placeholder='Polynomial formula y=A*x*x + B*x + C ... please comma separate A,B,C';

         }

         setTimeout(toggleplaceholder, 5000);

      } else {

         oiois=null;

      }

    }

  }
The email link collaboration work has meant that we can show you below some equations “baked” ahead of time …
Example of 2 Linear Equations:

y = 2x + 12

y = -2x - 8
… and thanks to this very useful link for methodologies to discover X axis intercepts for polynomial equations …
Example of 2 Polynomial Equations and 1 Linear Equation:

y = 2x2 - 11x + 5

y = -4x2 + 12x - 9

y = 2x + 24
Feel free to peruse the HTML and Javascript and CSS code of the changed square_hr_tracing.htm‘s live run link.
Previous relevant HTML Square Horizontal Rule Plot Axes Tutorial is shown below.
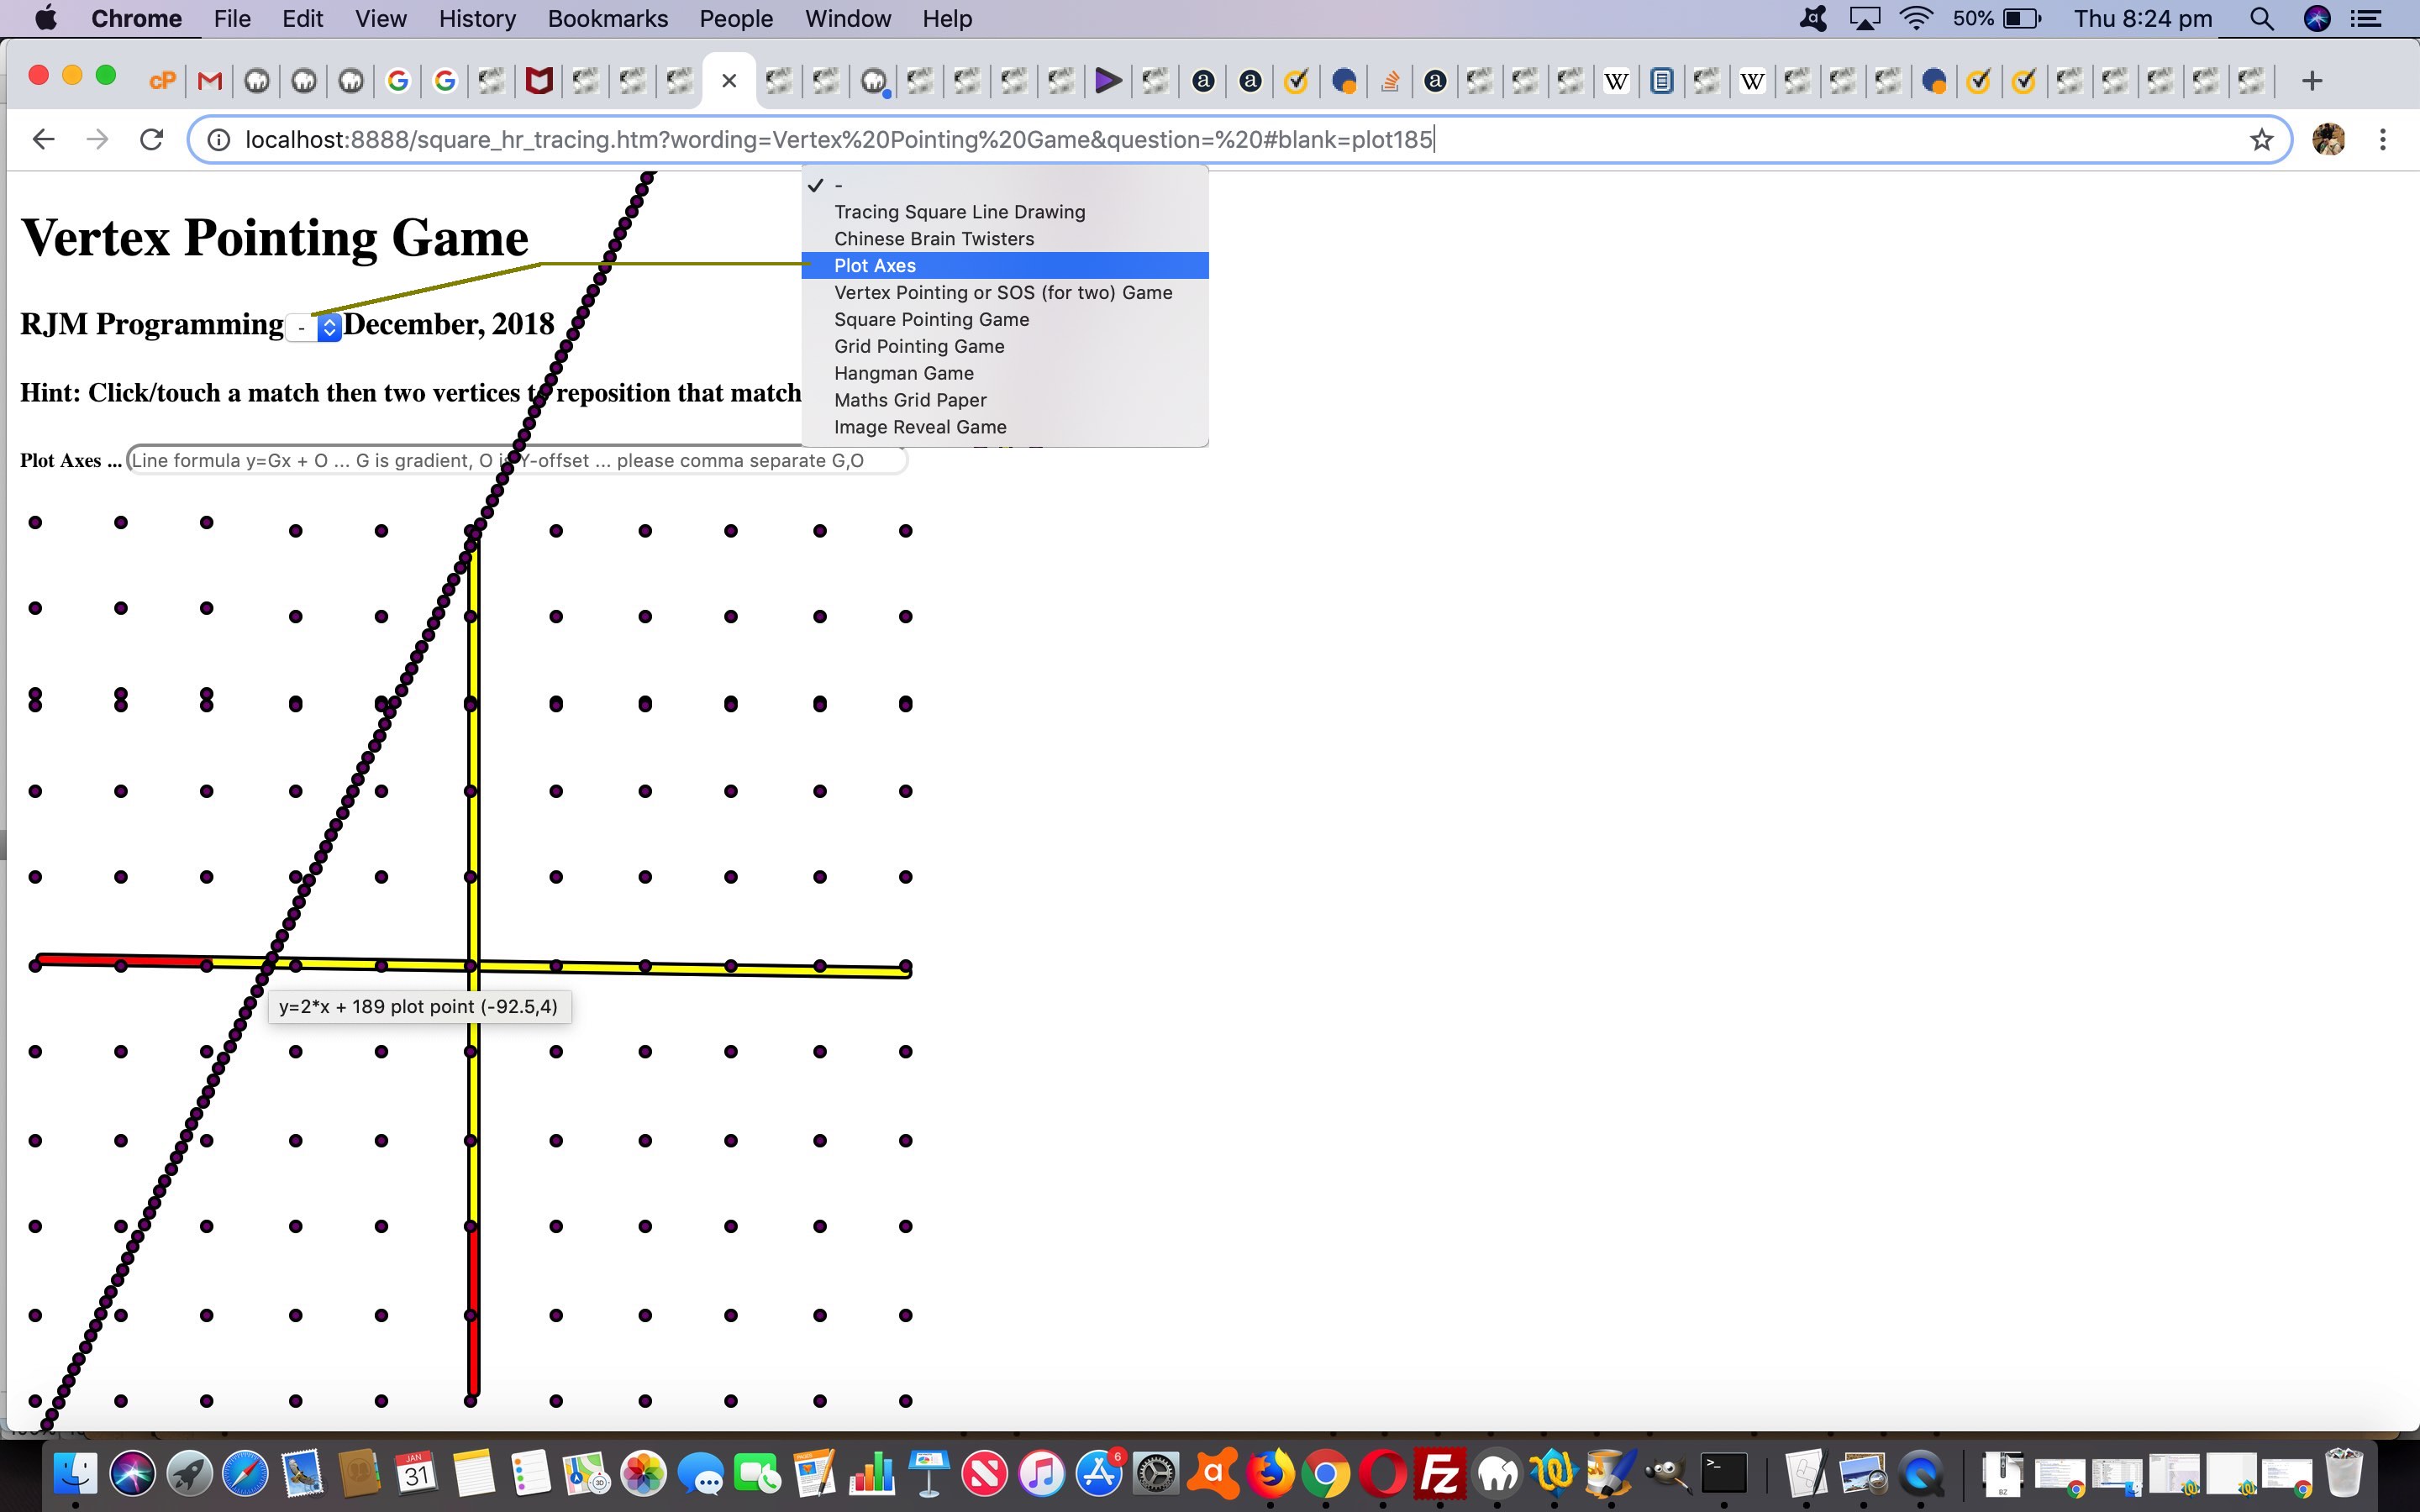
A lot of us have a goodly amount of “visual learner” in us, and the study of geometry in mathematics is full of opportunities for “visual cues” to topics that look a bit “dry” on paper. Take linear equations for instance … and I hear that the circus is a popular winner here. If we were to offer you …
y = [Gradient]x + [Y-Offset] = 2x + 189
… as a linear equation to contemplate, can you imagine it in your mind as easily as to use the “visual cue” of today’s tutorial picture? It asks this of the user information wise …
- user enters minimumX,minimumY,maximumX,maximumY for a range of interest for the plotting of the axes … perhaps a bit tricky … in today’s tutorial picture we entered -200,-200,200,200 … then …
- user enters gradient,y-offset … in today’s tutorial picture we entered 2,189 (for that linear equation above)
Onto the recent HTML Square Horizontal Rule Tracing Image Reveal Game Tutorial we added the one new dropdown menu option “Plot Axes” to get to this functionality, so why not peruse the HTML and Javascript and CSS code of square_hr_tracing.htm‘s live run link.
Previous relevant HTML Square Horizontal Rule Tracing Image Reveal Game Tutorial is shown below.
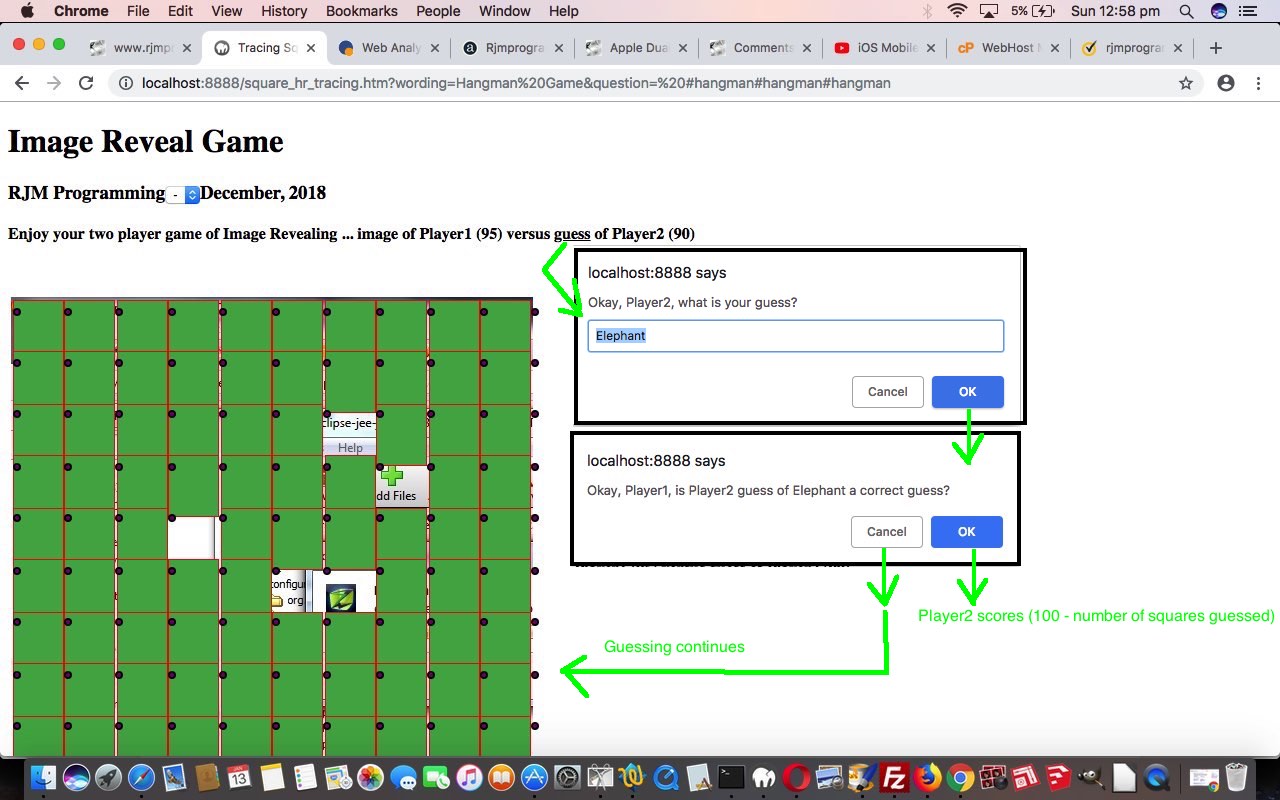
Rest assured all of yesterday’s HTML Square Horizontal Rule Tracing iOS Mobile App Tutorial thoughts will continue on with any extended functionality with our “HTML Square Horizontal Rule Tracing” inspired web application’s dropdown list of games and puzzles. With that in mind, today’s extended functionality is an Image Revealing Game. Are you a regular, and know about our design belief in categorizing (a lot of) web design ideas into one of …
… concepts? Well, today, our Image Revealing Game uses a bit of both to create its workings.
What’s the gist of the game? It’s a game for two players and the players take it in turns, with …
- One player picking an image via either …
- image URL … or
- browsed for image file on disk
… and this image is the background image for the table element consisting of that 5×5 grid of the earliest days (still) of this project’s concepts … and …
- the other player is clicking on overlayed buttons placed on top of this image to reveal 1/100th (as each table cell has four such buttons) of the image, and at any time, via the “guess” HTML “a” link means of guessing what the image contains, a correct guess, as judged by the first (image choosing) player scores that guessing player (100 – number of clicked buttons) points
To test this new game out, you could try today’s changed square_hr_tracing.htm‘s Image Revealing Game live run.
Previous relevant HTML Square Horizontal Rule Tracing iOS Mobile App Tutorial is shown below.
The design of our recent “HTML Square Horizontal Rule Tracing” suite of functionalities, with their navigational arrangements using …
- web browser (address bar) URL involving ? and & arguments … and …
- hashtags (using #)
… all possible, because the amounts of passed data is small (and so we don’t need to post to a serverside piece of code written in a language like PHP or Perl or Python (the three “P”‘s)), lends itself to (iOS) …
- on the iPad or iPhone in a web browser such as Safari …
- arrange navigation to a web application “snapshot” of the (game or puzzle or whatever) functionality of interest at its instigation …
- touch the Share link up near the top right …
- touch the “Add to Home Screen” button …
- fill in a suitable name (you can “long touch” Select All to effectively highlight what’s there already, ready) for the …
- icon you create in the Home Screen by touching the Add link at the top right
Then, from then on, those icons you create in the Home Screen could be your instant access method of “Cutting to the Chase”.
To show this, we used QuickTime Player on a MacBook Pro connected to an iPad by the (ubiquitous) Apple white lead via its New Movie Recording dropdown to “Robert’s iPad” option, to create a video called “iOS Mobile App and Web Application Nexus via Share’s Add to Home” uploaded to YouTube, and with the “blurb” …
We demonstrate some web applications that use the one HTML and Javascript and CSS codeset partitioned off to many functionalities (such as games and puzzles) visited by a Safari web browser user the once, and at instigation, are hived off to iPad Home screen icons as iOS Mobile Apps to a large degree, via the Share link’s Add to Home.
… that you can play for yourself below …
… resulting in the (best part of, but nobody’s saying “totally”) iOS Mobile App looking icons pointing at …
- Hangman Game
- Chinese Brain Twisters
- Maths Grid Paper (sorry, but missed off in video, and done later via same methodology)
- SOS Game (as of day before yesterday’s HTML Square Horizontal Rule Tracing SOS Game Tutorial)
You can also see this play out at WordPress 4.1.1’s HTML Square Horizontal Rule Tracing iOS Mobile App Tutorial.
Previous relevant HTML Square Horizontal Rule Tracing SOS Game Tutorial is shown below.
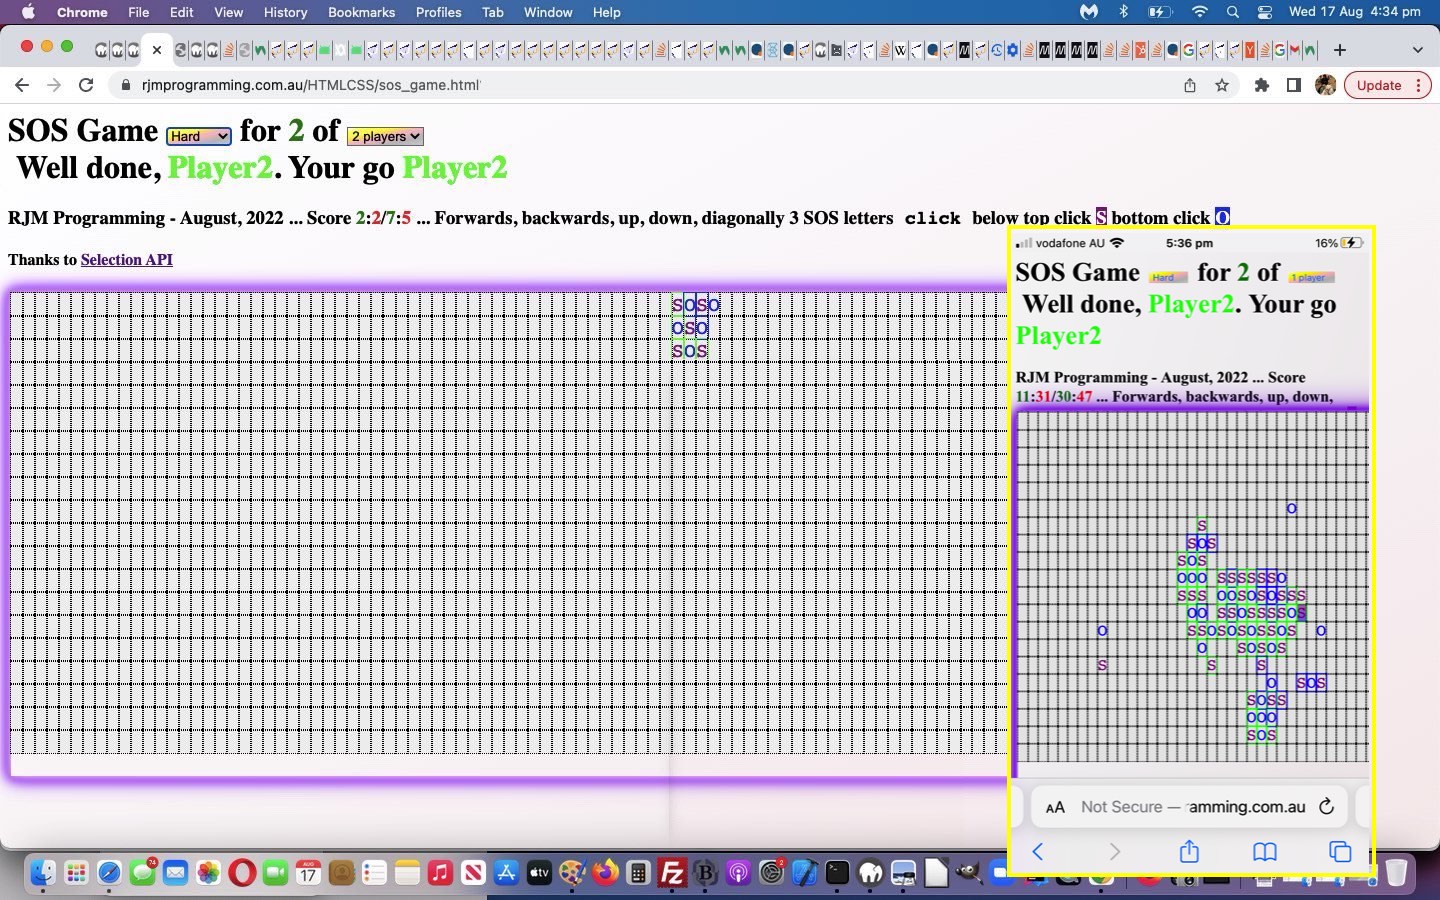
The new development today on top of yesterday’s HTML Square Horizontal Rule Tracing Maths Grid Paper Tutorial is the coding for a game we used to play at school called the SOS Game.
If the grid is filled up and the number of SOSs for each player is the same, then the game is a draw. The game can also be played where the player who creates an SOS is the winner and if no SOSs are created the game is a draw.
A technique that came into play with this as far as user interaction is concerned was to involve select (dropdown) elements (surprise, surprise) with “size=3″ for the three choices ” ” (initially) or “S” or “O”. Once the user makes a non-blank choice we adjust that select (dropdown) element’s innerHTML to still be a dropdown but just with your selected value, nullifying any duplicate “onchange” event logics, on the understanding that the “onchange” event can’t be fired from a select (dropdown) element with only one option subelement.
This is a game designed for more than one player so we organize two players to play the game in turns.
Here is the initial drawing of the SOS Game grid …
function sosize() {

    var itds=0; tds=document.getElementsByTagName('td');

    var sqsi=0, ioffset=0;

    document.getElementById('myh4').innerHTML+=' ... turn of Player1' + score1 + ' versus Player2' + score2;

    for (var itrs=0; itrs<5; itrs++) {

    for (var itds=eval(5 * itrs); itds<eval(5 + eval(5 * itrs)); itds++) {

      thisrect=tds[itds].getBoundingClientRect();

      tds[itds].style.verticalAlign='top';

      sqsi=eval(2 * itds + ioffset);

      tds[itds].innerHTML='<select title="" style=vertical-align:top;width:50%;height:50%;text-align:center; size=3 id=sqsi' + sqsi + ' onchange=sosmove(this);><option value=" "> </option><option value="S">S</option><option value="O">O</option></select>';

      tds[itds].innerHTML+='<select title="" style=vertical-align:top;width:50%;height:50%;text-align:center; size=3 id=sqsi' + eval(1 + sqsi) + ' onchange=sosmove(this);><option value=" "> </option><option value="S">S</option><option value="O">O</option></select>';

      tds[itds].innerHTML+='<br><select title="" style=vertical-align:bottom;width:50%;height:50%;text-align:center; size=3 id=sqsi' + eval(10 + sqsi) + ' onchange=sosmove(this);><option value=" "> </option><option value="S">S</option><option value="O">O</option></select>';

      tds[itds].innerHTML+='<select title="" style=vertical-align:bottom;width:50%;height:50%;text-align:center; size=3 id=sqsi' + eval(11 + sqsi) + ' onchange=sosmove(this);><option value=" "> </option><option value="S">S</option><option value="O">O</option></select>';

    }

    ioffset+=10;

    }

}
Here is the analysis of a player’s SOS Game select (dropdown) element interaction …
function checkifsos(t1, t2, t3) { //, camv) {

  //var score1=' (0)', score2=' (0)';

  //var amv=camv.split('.')[0];

  var retv=false;

  if (t1 >= 0 && t1 < 100 && t2 >= 0 && t2 < 100 && t3 >= 0 && t3 < 100) {

     if (document.getElementById('sqsi' + t1).value == 'S' && document.getElementById('sqsi' + t2).value == 'O' && document.getElementById('sqsi' + t3).value == 'S') {

       if (thisplayer == 1) {

       document.getElementById('sqsi' + t1).style.border='1px inset red';

       document.getElementById('sqsi' + t2).style.border='1px inset red';

       document.getElementById('sqsi' + t3).style.border='1px inset red';


       if (document.getElementById('sqsi' + t1).title.indexOf('2') != -1) {

       document.getElementById('sqsi' + t1).style.backgroundColor='';

       document.getElementById('sqsi' + t1).className='bicol'; //style.backgroundColor="linear-gradient(top, pink, yellow)";

       } else {

       document.getElementById('sqsi' + t1).style.backgroundColor='pink';

       }

       if (document.getElementById('sqsi' + t2).title.indexOf('2') != -1) {

       document.getElementById('sqsi' + t2).style.backgroundColor='';

       document.getElementById('sqsi' + t2).className='bicol'; //style.backgroundColor="linear-gradient(top, pink, yellow)";

       } else {

       document.getElementById('sqsi' + t2).style.backgroundColor='pink';

       }

       if (document.getElementById('sqsi' + t3).title.indexOf('2') != -1) {

       document.getElementById('sqsi' + t3).style.backgroundColor='';

       document.getElementById('sqsi' + t3).className='bicol'; //style.backgroundColor="linear-gradient(top, pink, yellow)";

       } else {

       document.getElementById('sqsi' + t3).style.backgroundColor='pink';

       }

       document.getElementById('sqsi' + t1).title+='1';

       document.getElementById('sqsi' + t2).title+='1';

       document.getElementById('sqsi' + t3).title+='1';

       } else {

       document.getElementById('sqsi' + t1).style.border='1px inset olive';

       document.getElementById('sqsi' + t2).style.border='1px inset olive';

       document.getElementById('sqsi' + t3).style.border='1px inset olive';

       if (document.getElementById('sqsi' + t1).title.indexOf('1') != -1) {

       document.getElementById('sqsi' + t1).style.backgroundColor='';

       document.getElementById('sqsi' + t1).className='bicol'; //style.backgroundColor="linear-gradient(top, pink, yellow)";

       } else {

       document.getElementById('sqsi' + t1).style.backgroundColor='yellow';

       }

       if (document.getElementById('sqsi' + t2).title.indexOf('1') != -1) {

       document.getElementById('sqsi' + t2).style.backgroundColor='';

       document.getElementById('sqsi' + t2).className='bicol'; //style.backgroundColor="linear-gradient(top, pink, yellow)";

       } else {

       document.getElementById('sqsi' + t2).style.backgroundColor='yellow';

       }

       if (document.getElementById('sqsi' + t3).title.indexOf('1') != -1) {

       document.getElementById('sqsi' + t3).style.backgroundColor='';

       document.getElementById('sqsi' + t3).className='bicol'; //style.backgroundColor="linear-gradient(top, pink, yellow)";

       } else {

       document.getElementById('sqsi' + t3).style.backgroundColor='yellow';

       }

       document.getElementById('sqsi' + t1).title+='2';

       document.getElementById('sqsi' + t2).title+='2';

       document.getElementById('sqsi' + t3).title+='2';

       }

       retv=true;

       if (thisplayer == 1) {

         score1=' (' + eval(eval(score1.split('(')[1].split(')')[0]) + 1) + ')';

       } else {

         score2=' (' + eval(eval(score2.split('(')[1].split(')')[0]) + 1) + ')';

       }

     }

  }

  return retv;

}


function sosmove(osel) {

  var cosel=osel.value, anothergo=false, prevplayer=thisplayer;

  var thistile=eval(osel.id.replace('sqsi',''));

  var surrounds='';

  var prevscore1=score1;

  var prevscore2=score2;

  if (cosel.trim() != '') {

   osel.size=1;

   osel.style.border='1px inset blue';

   osel.innerHTML='<option value=' + cosel + '>' + cosel + '</option>';

   document.getElementById('myh4').innerHTML=document.getElementById('myh4').innerHTML.replace(' Player1' + score1 + ' versus Player2' + score2,' Player02' + score2 + ' versus Player01' + score1).replace(' Player2' + score2 + ' versus Player1' + score1,' Player01' + score1 + ' versus Player02' + score2).replace(' Player0',' Player').replace(' Player0',' Player');

   // hmiddle -1 me +1

   // hend -2 -1 me

   // hstart me +1 +2

   // vmiddle -10 me +10

   // vend -20 -10 me

   // vstart me +10 +20

   // ddmiddle -11 me +11

   // ddend -22 -11 me

   // ddstart me +11 +22

   // udmiddle -9 me +9

   // udend -18 -9 me

   // udstart me +9 +18

     if (eval(thistile % 10) > 0 && eval(thistile % 10) < 9) {

     anothergo|=checkifsos(eval(-1 + thistile), thistile, eval(1 + thistile));

     }

     if (eval(thistile % 10) > 1) {

     anothergo|=checkifsos(eval(-2 + thistile), eval(-1 + thistile), thistile);

     }

     if (eval(thistile % 10) < 8 ) {

     anothergo|=checkifsos(thistile, eval(1 + thistile), eval(2 + thistile));

     }


     if (eval(thistile / 10) > 0 && eval(thistile / 10) < 9) {

     anothergo|=checkifsos(eval(-10 + thistile), thistile, eval(10 + thistile));

     }

     if (eval(thistile / 10) > 1) {

     anothergo|=checkifsos(eval(-20 + thistile), eval(-10 + thistile), thistile);

     }

     if (eval(thistile / 10) < 8 ) {

     anothergo|=checkifsos(thistile, eval(10 + thistile), eval(20 + thistile));

     }


     if (eval(thistile % 10) > 0 && eval(thistile % 10) < 9 && eval(thistile / 10) > 0 && eval(thistile / 10) < 9) {

     anothergo|=checkifsos(eval(-11 + thistile), thistile, eval(11 + thistile));

     }

     if (eval(thistile % 10) > 1 && eval(thistile / 10) > 2) {

     anothergo|=checkifsos(eval(-22 + thistile), eval(-11 + thistile), thistile);

     }

     if (eval(thistile % 10) < 8 && eval(thistile / 10) < 8 ) {

     anothergo|=checkifsos(thistile, eval(11 + thistile), eval(22 + thistile));

     }


     if (eval(thistile % 10) > 0 && eval(thistile % 10) < 9 && eval(thistile / 10) > 0 && eval(thistile / 10) < 9) {

     anothergo|=checkifsos(eval(-9 + thistile), thistile, eval(9 + thistile));

     }

     if (eval(thistile % 10) >= 0 && eval(thistile / 10) < 8 ) {

     anothergo|=checkifsos(eval(-18 + thistile), eval(-9 + thistile), thistile);

     }

     if (eval(thistile % 10) > 2 && eval(thistile / 10) < 8 ) {

     anothergo|=checkifsos(thistile, eval(9 + thistile), eval(18 + thistile));

     }


   if (!anothergo) {  thisplayer=eval(eval('' + 3) - eval('' + prevplayer));   } else {   document.getElementById('myh4').innerHTML=document.getElementById('myh4').innerHTML.replace(' Player1' + prevscore1 + ' versus Player2' + prevscore2,' Player02' + score2 + ' versus Player01' + score1).replace(' Player2' + prevscore2 + ' versus Player1' + prevscore1,' Player01' + score1 + ' versus Player02' + score2).replace(' Player0',' Player').replace(' Player0',' Player');  }

  }

}
… being simplified, considerably, via the advice of this great link, thanks, regarding CSS linear-gradient usage …
<style>

  .bicol {

background: rgb(255,255,255); /* Old browsers */

background: -moz-linear-gradient(top,  pink 0%, pink 50%, yellow 51%, yellow 100%); /* FF3.6-15 */

background: -webkit-linear-gradient(top,  pink 0%,pink 50%,yellow 51%,yellow 100%); /* Chrome10-25,Safari5.1-6 */

background: linear-gradient(to bottom,  pink 0%,pink 50%,yellow 51%,yellow 100%); /* W3C, IE10+, FF16+, Chrome26+, Opera12+, Safari7+ */

filter: progid:DXImageTransform.Microsoft.gradient( startColorstr=pink, endColorstr=yellow,GradientType=0 ); /* IE6-9 */

  }

</style>
You could try today’s changed square_hr_tracing.htm‘s SOS Game live run.
Previous relevant HTML Square Horizontal Rule Tracing Maths Grid Paper Tutorial is shown below.
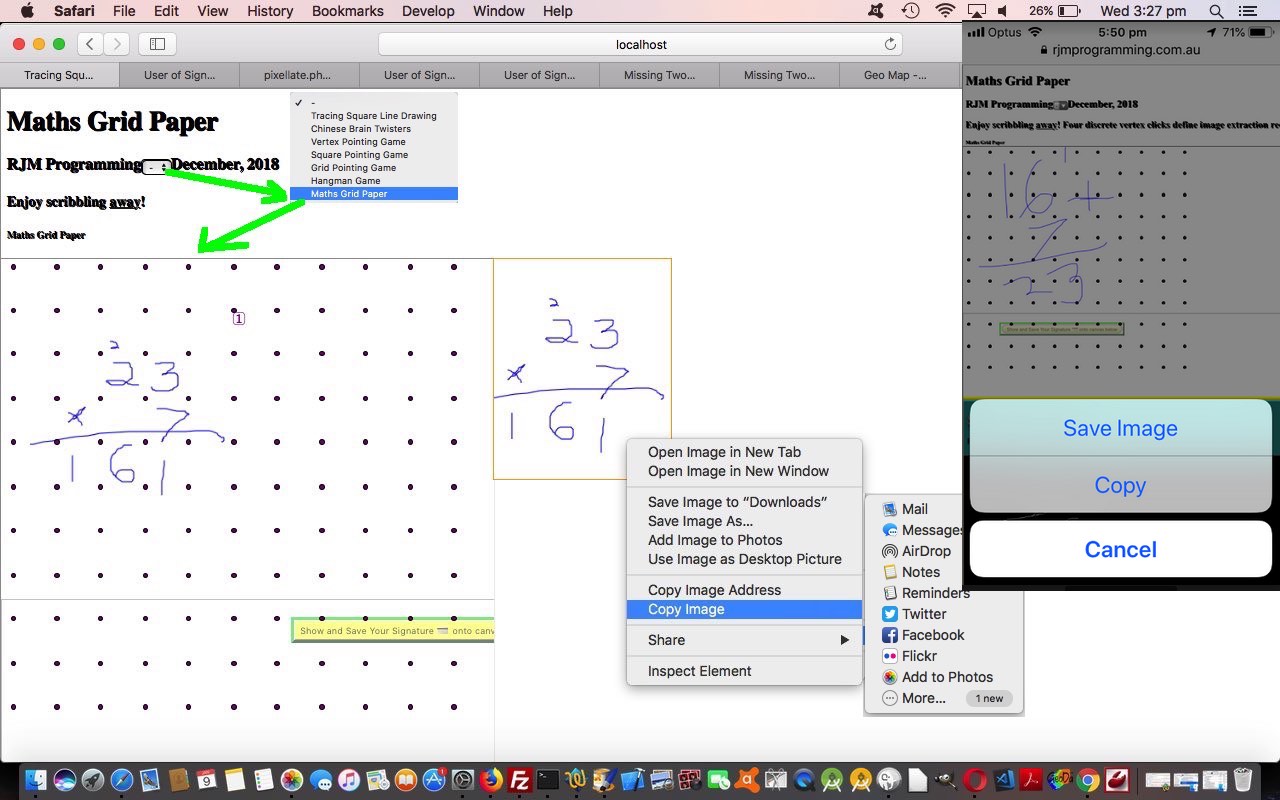
Yesterday’s HTML Square Horizontal Rule Tracing Hangman Game Tutorial set us up for today’s Maths Grid Paper web application part that involves …
- Hangman Game background is the look we want, as we want the vertices as guides for today’s grid paper work … teamed with a new idea that is …
- the top.document parent of two children that are …
- specially (hashtag #hangman-0.0) called child iframe Hangman Game peered with other child x,y positionally but slightly behind on z-index to …
- today’s changed user_of_signature_signature.html‘s User of Signature Signature live run (last changed with Email Subject Line Emojis Primer Tutorial) child iframe featuring an HTML5 canvas element overlaying the vertices … by way of (square_hr_tracing.htm’s) …
       document.getElementById('myh1').innerHTML=' ';

       document.getElementById('myh3').innerHTML=' ';

       document.getElementById('myh4').innerHTML=' ';

       document.getElementById('dhangman').innerHTML+="<iframe name=iback id=iback style='background-color:transparent;z-index:23;position:absolute;top:200px;left:0px;width:580px;height:100vh;' src=//www.rjmprogramming.com.au/HTMLCSS/user_of_signature_signature.html?rand=" + Math.floor(Math.random() * 123456) + "></iframe>";

       document.getElementById('dhangman').innerHTML+="<iframe name=ifront id=ifront style='background-color:transparent;z-index:22;position:absolute;top:0px;left:0px;width:100%;height:100vh;' src=//www.rjmprogramming.com.au/HTMLCSS/square_hr_tracing.htm#hangman-0.0></iframe>";

       document.getElementById('dhangman').innerHTML+="<div id=dback title='' style='background-color:transparent;z-index:24;position:absolute;top:200px;left:580px;'></div>";
… and along the way to get this all timed so that a child iframe (canvas) can be like a background image (that is clickably intelligent) …
- multiple hashtagging in that top.document parent is used … #mathsgrid#hangman …
   if ((' ' + location.hash).split('#').length > 2 || (' ' + location.hash).indexOf('hangman-0.0') != -1) {

       document.getElementById('myh1').innerHTML='Maths Grid Paper';

   }

   // ...

   if (bpointsx.length >= 4 && (' ' + location.hash).split('#').length > 2 || (' ' + location.hash).indexOf('hangman-0.0') != -1) {

          if (parent.document.getElementById('dback')) {

                 parent.document.getElementById('dback').title='' + bpointsx[0] +',' + eval(-200 + bpointsy[0]) + ',' + bpointsx[1] +',' + eval(-200 + bpointsy[1]) + ',' + bpointsx[2] + ',' + eval(-200 + bpointsy[2]) + ',' + bpointsx[3] +',' + eval(-200 + bpointsy[3]);

                 bpointsx=[];

                 bpointsy=[];

          }

   }
… to get the best of both worlds
That’s a discussion more with the focus on looks. Doing this, we found it to be that one stage better than (just) “looks” though, as we discovered even though the child iframe Hangman Game was “slightly behind on z-index” we could still differentiate the …
- specially (hashtag #hangman-0.0) called child iframe Hangman Game discrete vertex clicks and touches … from …
- today’s changed user_of_signature_signature.html‘s User of Signature Signature live run child iframe featuring an HTML5 canvas element (onmousemove and ontouchmove) scribbling …
 function checkdback() {

   var rco='', rcos=[];

   if (parent.document.getElementById('dback')) {

     if (imgd != '') {

       if (parent.document.getElementById('cback')) {

           parent.document.getElementById('cback').getContext('2d').putImageData(imgd,0,0);

           imgd=parent.document.getElementById('cback').toDataURL();

           parent.document.getElementById('dback').innerHTML="<img style='z-index:24;border:2px solid orange;' id=imgback src='" + imgd + "'></img>";

           imgd='';

       }

     }

     if (parent.document.getElementById('dback').title != '') {

       rco=parent.document.getElementById('dback').title;

       parent.document.getElementById('dback').title='';

       setTimeout(checkdback, 2000);

     } else {

       setTimeout(checkdback, 2000);

     }

   }

   if (rco != '') {

     rcos=rco.split(',');

     var x1=eval('' + rcos[0]);

     x1=Math.min(x1, eval('' + rcos[2]));

     x1=Math.min(x1, eval('' + rcos[4]));

     x1=Math.min(x1, eval('' + rcos[6]));

     var y1=eval('' + rcos[1]);

     y1=Math.min(y1, eval('' + rcos[3]));

     y1=Math.min(y1, eval('' + rcos[5]));

     y1=Math.min(y1, eval('' + rcos[7]));

     var x2=eval('' + rcos[0]);

     x2=Math.max(x2, eval('' + rcos[2]));

     x2=Math.max(x2, eval('' + rcos[4]));

     x2=Math.max(x2, eval('' + rcos[6]));

     var y2=eval('' + rcos[1]);

     y2=Math.max(y2, eval('' + rcos[3]));

     y2=Math.max(y2, eval('' + rcos[5]));

     y2=Math.max(y2, eval('' + rcos[7]));

     imgd=document.getElementById('topcanvas').getContext('2d').getImageData(x1,y1,x2,y2);

     parent.document.getElementById('dback').style.width='' + Math.round(eval(x2 - x1)) + 'px';

     parent.document.getElementById('dback').style.height='' + Math.round(eval(y2 - y1)) + 'px';

     parent.document.getElementById('dback').innerHTML="<canvas style=z-index:24; width='" + Math.round(eval(x2 - x1)) + "' height='" + Math.round(eval(y2 - y1)) + "' id=cback></canvas>";

   }

 }


 setTimeout(checkdback,2000);
… so …
… could also allow the user to do some Math Grid Paper scribbling and then click/touch four vertices to define a window of extraction from which a sharable image is created, ready for an email attachment or some other purpose. We weren’t sure that both data capture methods above could live in the one interfacing arrangement, so we were happy to see this working, especially as this opens the door to sharing and collaboration possibilities with this new Maths Grid Paper functionality.
Again, try today’s changed square_hr_tracing.htm‘s Maths Grid Paper live run tool.
Previous relevant HTML Square Horizontal Rule Tracing Hangman Game Tutorial is shown below.
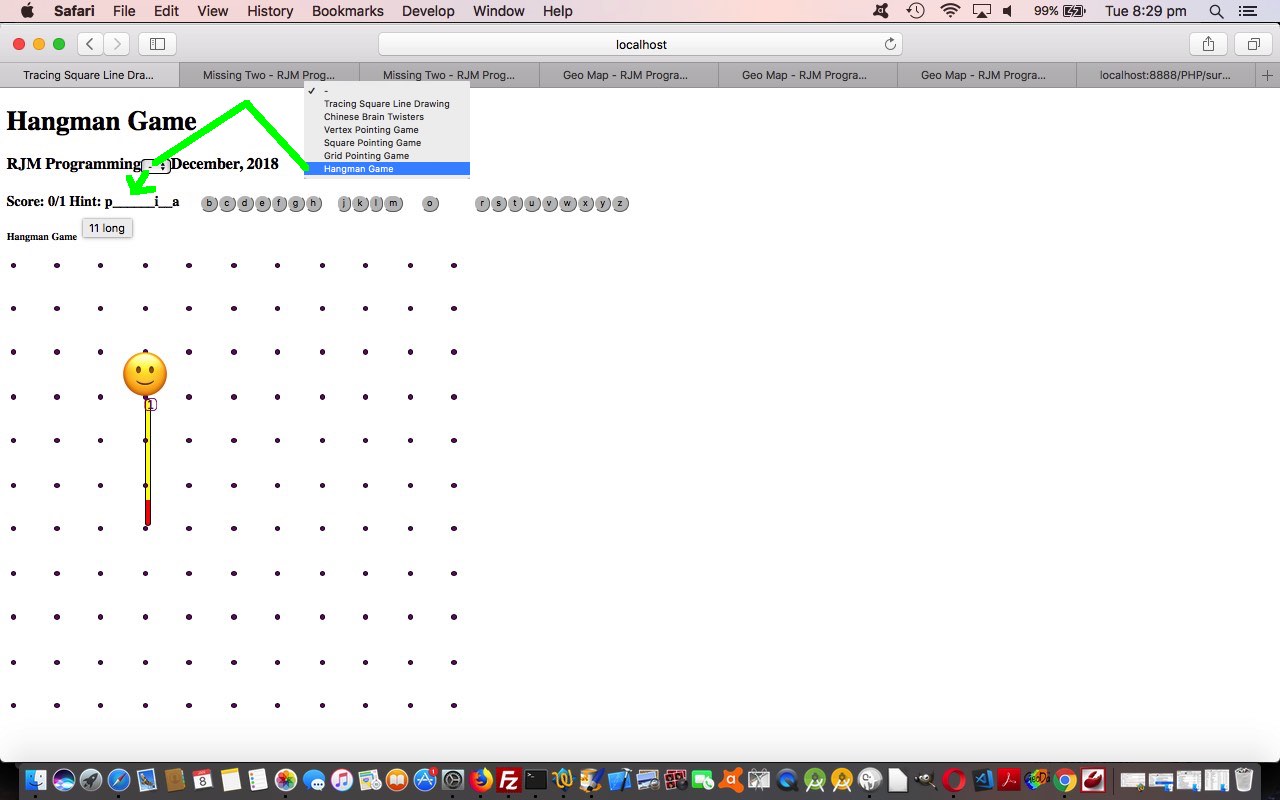
Our new Hangman Game extension to functionality (on top of HTML Square Horizontal Rule Tracing Propogation Tutorial) makes use of both …
- HTML Square Horizontal Rule Tracing … and …
- Emoji overlay … two of our usual suspect …
- position:absolute property
- z-index
… ideas
… the latter of which aids us with the head 🙂 and noose 🎀 drawing requirements … but still no purpose built imagery is required. We hope you can see how these emojis can help we graphically challenged ones … both …
- get on with projects despite that lack of image based work … and …
- work with a more and more accepted form of communication that is more Internationally understood
Of interest as far as the Javascript code for this goes is our approach of setting up some static array records consisting of multiple Javascript lines of code (separated by ; (semicolon)) that are executed via Javascript eval functionality as per …
var ihangman=0;
var hangmanc=[
" document.getElementById('dhangman').innerHTML+='<p id=phead class=face style=z-index:90;position:absolute;top:248px;left:142px;font-size:56px;>🙂</p>'; ",
" document.getElementById('hr77').click(); document.getElementById('hr137').click(); ",
" document.getElementById('hr119').click(); document.getElementById('hr77').click(); ",
" document.getElementById('hr131').click(); document.getElementById('hr77').click(); ",
" document.getElementById('hr137').click(); document.getElementById('hr234').click(); ",
" document.getElementById('hr137').click(); document.getElementById('hr246').click(); ",
" document.getElementById('hr235').click(); document.getElementById('hr256').click(); ",
" document.getElementById('hr260').click(); document.getElementById('hr256').click(); ",
" document.getElementById('hr230').click(); document.getElementById('hr235').click(); ",
" document.getElementById('hr235').click(); document.getElementById('hr20').click(); ",
" document.getElementById('hr290').style.display='none'; document.getElementById('hr260').click(); document.getElementById('hr235').click(); document.getElementById('phead').innerHTML='🤢'; document.getElementById('dhangman').innerHTML+='<p id=pnoose class=face style=background-color:blank;z-index:95;position:absolute;top:195px;left:168px;font-size:6px;>🎀<br>🎀<br>🎀<br>🎀<br>🎀<br>🎀<br>🎀<br>🎀<br>🎀<br>🎀<br>🎀<br>🎀<br>🎀<br>🎀<br>🎀<br>🎀<br>🎀</p>'; "
];
function hguess(gthis,othis) {
var ifnd=0, fnd=false, newval='';
for (ifnd=0; ifnd<vocabulary[0].length; ifnd++) {
if (vocabulary[0].substring(ifnd,eval(1 + ifnd)).toLowerCase() == gthis.toLowerCase()) {
fnd=true;
newval+=gthis;
} else {
newval+=document.getElementById('sletters').innerHTML.substring(ifnd,eval(1 + ifnd));
}
}
document.getElementById('sletters').innerHTML=newval;
document.getElementById('sletters').title=newval;
othis.style.visibility='hidden';
if (!fnd) {
eval(hangmanc[ihangman]);
ihangman++;
}
if (ihangman >= hangmanc.length) {
goes++;
newval='';
for (ifnd=0; ifnd<vocabulary[0].length; ifnd++) {
if (document.getElementById('sletters').innerHTML.substring(ifnd,eval(1 + ifnd)).toLowerCase() == "_") {
newval+='<font color=red>' + vocabulary[0].substring(ifnd,eval(1 + ifnd)) + '</font>';
} else {
newval+=document.getElementById('sletters').innerHTML.substring(ifnd,eval(1 + ifnd));
}
}
document.getElementById('sletters').innerHTML=newval;
document.getElementById('sletters').title=vocabulary[0];
setTimeout(handon, 5000);
} else if (document.getElementById('sletters').innerHTML.indexOf('_') != -1) {
} else {
score+=document.getElementById('sletters').innerHTML.length;
goes++;
setTimeout(handon, 5000);
}
}
And where do we get our English words to challenge you? We get them from the server’s English Ispell dictionary. Other servers would have other language Ispell dictionaries. Either way, you will find these dictionaries invaluable for word games.
Try today’s changed square_hr_tracing.htm‘s Hangman live run game to test your English vocabulary skills. You may find the Speech to Text Speech to Text Hangman Game Tutorial‘s Hangman Game of interest too.
Previous relevant HTML Square Horizontal Rule Tracing Propogation Tutorial is shown below.
Yesterday’s HTML Square Horizontal Rule Tracing Game Tutorial continued on with the …
- HTML hr and div elements made up to be …
- lines
- vertices
… only needing the underlying …
- table cell elements as graphical position markers only (made to have intelligence derived via use of Javascript getBoundingClientRect()), but pretty “dumb” markers at that
… but HTML and Javascript are capable of very sophisticated event propogation, and there is no reason you have to have those underlying table cell elements remaining “dumb” that way. You can, amongst many things, in Javascript, dynamically add …
- ID on the fly …
    var tds=document.getElementsByTagName('td');

    for (var itds=0; itds<tds.length; itds++) {

      tds[itds].id='td' + eval(1 + itds);

    }
- onclick event logic on the fly …
    var lastsquare=-1;

    var tds=document.getElementsByTagName('td');

    for (var itds=0; itds<tds.length; itds++) {

      tds[itds].id='td' + eval(1 + itds);

      tds[itds].onclick=function(event) { lastsquare=eval(('' + this.id).replace('td','')); goes++; if (lastsquare == sqchoice) { score++; }  if (('' + location.hash).indexOf('square') != -1) { picksq(); } else if (('' + location.hash).indexOf('grid') != -1) {  gridinfo(' in square number ' + lastsquare);  }  };

    }
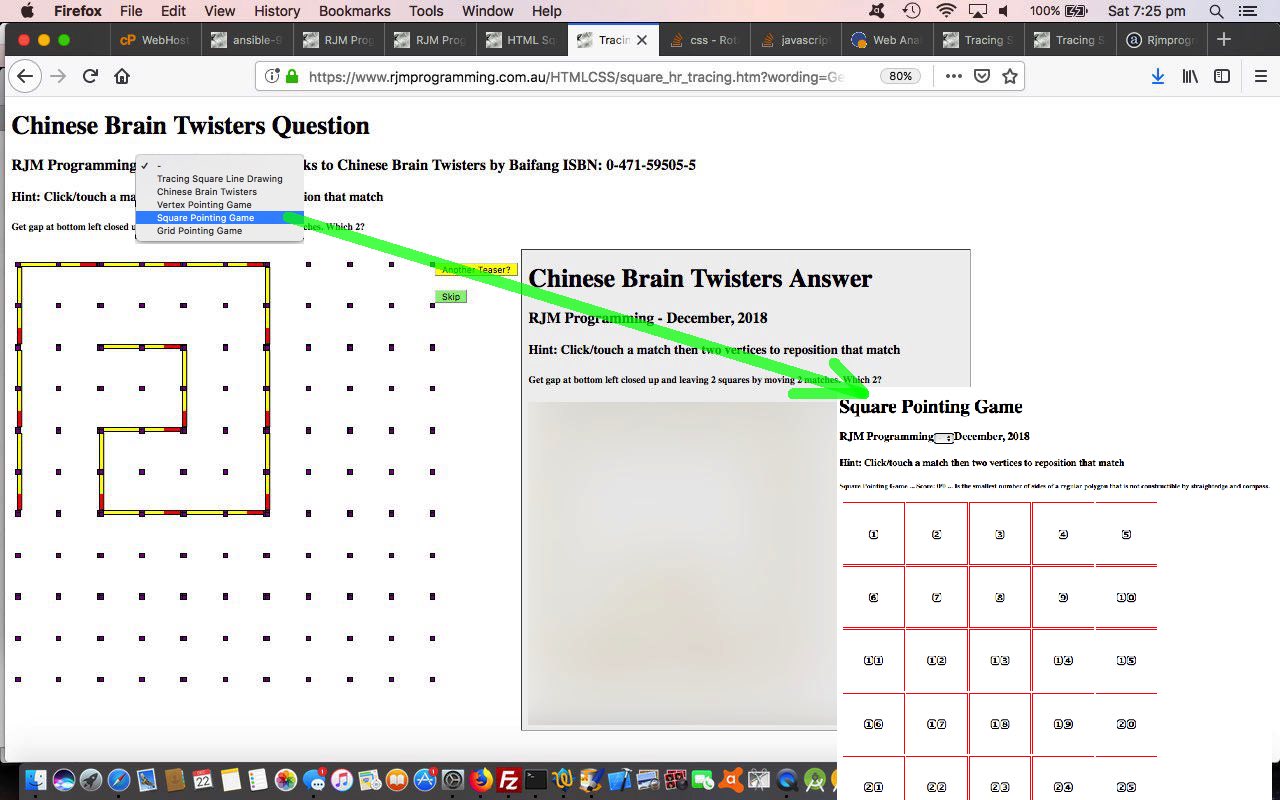
We’ve started with some other game ideas using event propogation, with the last one, in today’s changed square_hr_tracing.htm‘s live run game, that now has game options …
- Chinese Brain Twisters
- Vertex Pointing Game … just shows vertices and on a set of 4 clicks or touches, will plot a Bezier Curve (thanks to this useful link, thanks)
- Square Pointing Game … just shows the table and its numbered cells … with a number quiz
- Grid Pointing Game … shows border lines, and vertices and table cells with their thinner borders … where information is presented, relying on event propogation orders to show information from two hierarchies of event propogation
To differentiate between these forms of game (selected via a new HTML select (dropdown) element) we did not choose to use our usual address bar URL argument (via ? and &) navigation method, but rather use hashtag (via #) address bar URL methods, and in the Javascript (DOM) examine location.hash to know which “game” is applicable to a web application session.
Food for thought, we hope!
Previous relevant HTML Square Horizontal Rule Tracing Game Tutorial is shown below.
The first application of the (online web application) line drawing we started with yesterday’s HTML Square Horizontal Rule Tracing Primer Tutorial is today’s online (web application) game version of some of the excellent puzzles in the book “Chinese Brain Twisters” by Baifang (ISBN: 0-471-59505-5). It was the “stick” rearrangement puzzles in this excellent book that were the inspiration to getting together a display and user interaction set of HTML and CSS and Javascript code logics to turn a hardcopy concept into an online game.
Of course, when you start with a “proof of concept” it can need quite a bit of “tweaking” (in this case, fitting it into those concept paradigms we talk about a couple of paragraphs on) when the reality of making it practical for the user comes into play with a project like this. We, at first thought, that …
- we would display a question (about matches, rather than sticks, because we remember many a holiday game that involved the use of matches (… no, not that way) regarding patterns and counting, and because a match gives us an excuse to add some red colour as per CSS …
<style>

  hr {

       height: 4px;

       border: 2px solid black;

       background: linear-gradient(to right, yellow 80%, rgba(255,0,0,1) 20%);

  }

</style>
) and then with a button controlled by the user, “slap on” the screen the answer … then we had a mild epiphany (you had to be there) … - we would display a question and then animate the answer … which can be achieved by “slapping on” that same question, and click/touch the actions of a successful user after 2 second delays between the clicks/touches (via a setTimeout timer controlled set of Javascript calls)
We hope it gives the game a more interactive feel, and a better way to learn perhaps, because geometry can be an “ahhhh haaa” type of thing to learn, when you see graphically the steps involved.
As with many a game we’ve written we again fall back to two tried and true (and very simple) concepts …
- gather question data into simple (single dimension) arrays, additional complexity controlled within members by web application specific delimitation rules (or more singular dimensioned arrays (such as today, where there are two)) …
- get the user a randomized question for the game via Javascript code like (where “inquestions” variable below is just such an array) …
var choice=Math.floor(Math.random() * inquestions.length);
… leading to “”inquestions[choice]” containing the data required to piece together the question … along with the “inwordings[choice]” of the other such array “inwordings” that contains “Chinese Brain Twisters” instructional text
Another “game chestnut” concept for us is to have some sort of scoring mechanism, which we may attend to in upcoming posts. For now, we’ll let you “cheat in the comfort of your own conscience” when bragging about your “Chinese Brain Twisters” prowess!
Feel free to try out the changed square_hr_tracing.htm‘s live run game, and challenge yourself!
You can also see this play out at WordPress 4.1.1’s HTML Square Horizontal Rule Tracing Primer Tutorial.
Previous relevant HTML Square Horizontal Rule Tracing Primer Tutorial is shown below.
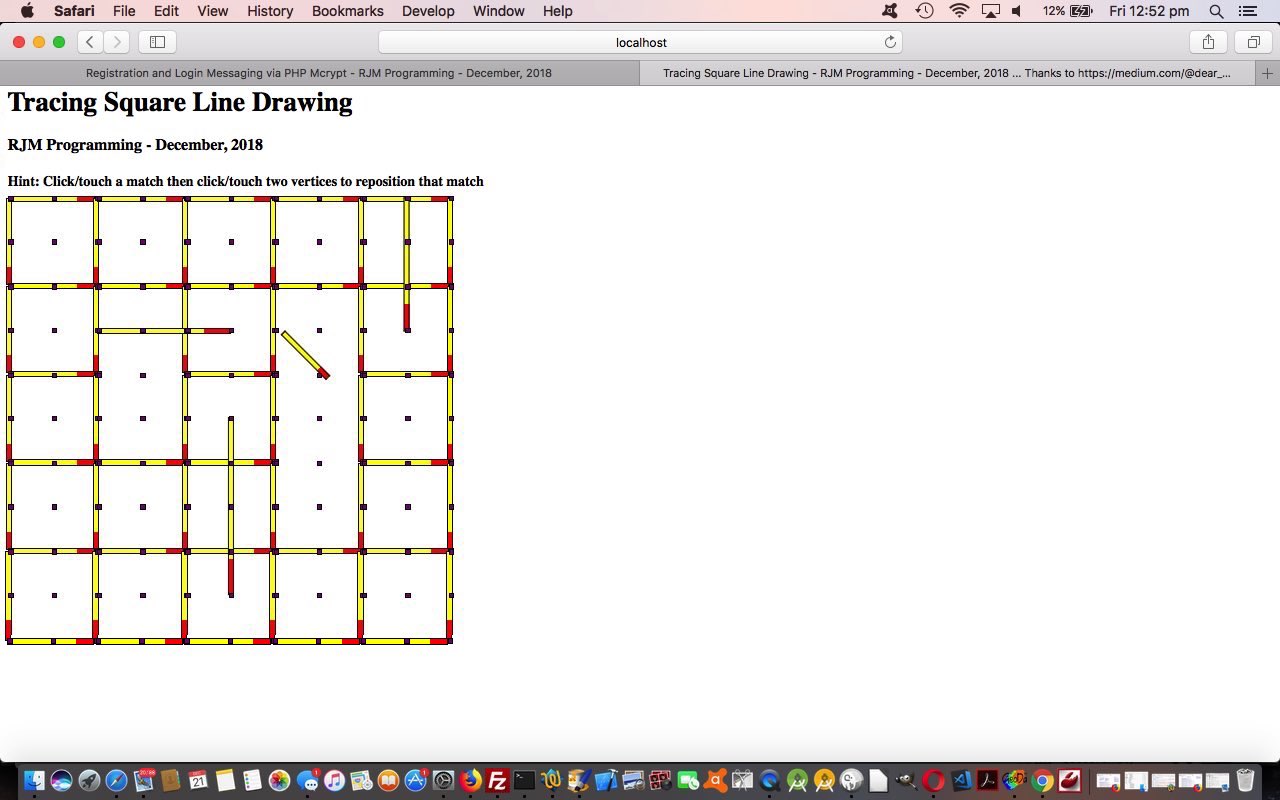
One sad thing about today’s blog posting title is it gives the game away. We’re tackling a proof of concept web application for a future venture. We want to be able to draw a grid of lines (or you could see them as matches) and we’ll want to …
- graphically present them (ie. grid square border lines (or matches)) around the edges of each grid square … and …
- graphically present vertices at match end points and half way between, and well as in the middle of squares … then let the user …
- click/touch a match … then …
- click/touch two vertices to reposition that match to the clicked vertex positioning
Now, it seems to me, off the top of the head, you could proceed along the lines of …
- HTML5 canvas element graphics … or
- SVG graphics … but we prefer … you guessed it …
- HR (Horizontal Rule) HTML elements, transformed as required, to suit our purposes
Interested?! Why not try the HTML/Javascript/CSS square_hr_tracing.html‘s live run to see what we mean here.
If this was interesting you may be interested in this too.
If this was interesting you may be interested in this too.
If this was interesting you may be interested in this too.
If this was interesting you may be interested in this too.
If this was interesting you may be interested in this too.
If this was interesting you may be interested in this too.
If this was interesting you may be interested in this too.
If this was interesting you may be interested in this too.
If this was interesting you may be interested in this too.
If this was interesting you may be interested in this too.
If this was interesting you may be interested in this too.
If this was interesting you may be interested in this too.
If this was interesting you may be interested in this too.
If this was interesting you may be interested in this too.

