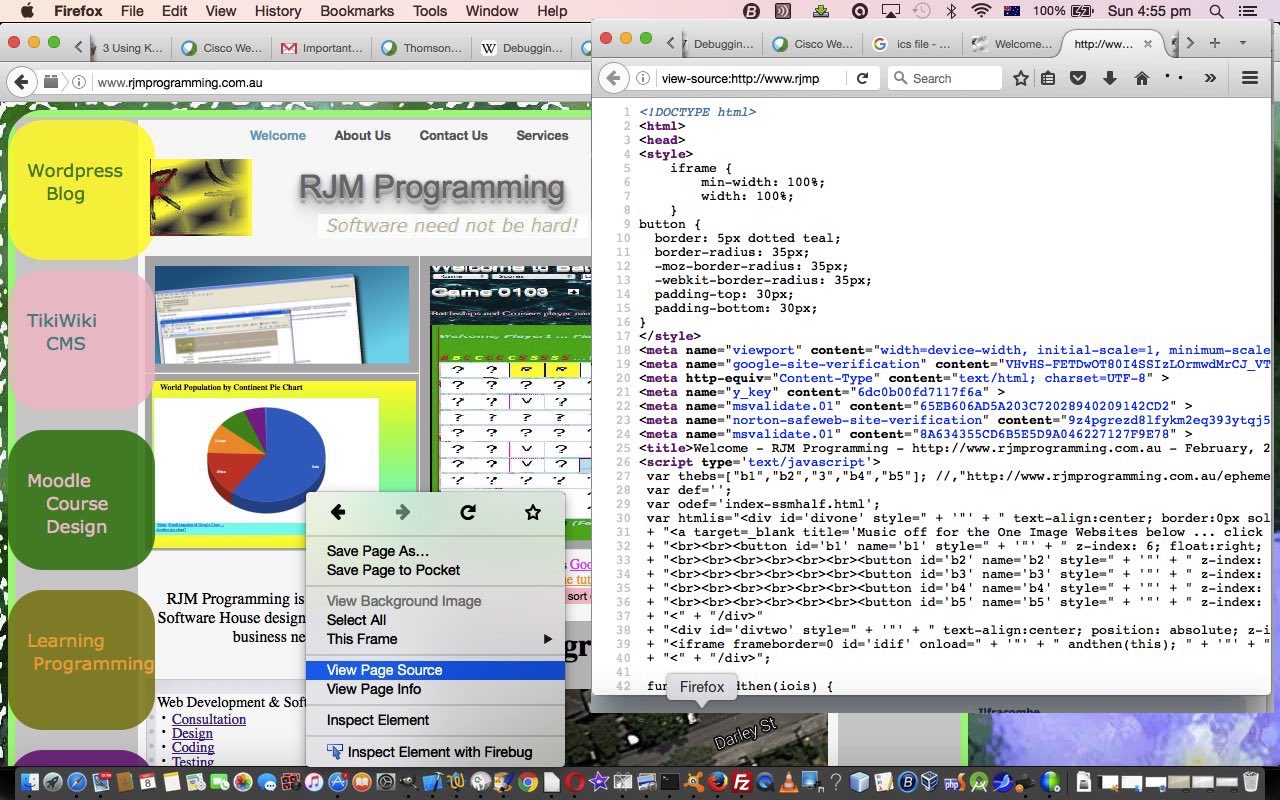
Following a “tagline” of “debugging” today, as you, the blog reader would have seen it too, we realized “infilling” was needed, because it is a bit unrepresentative to have blog postings about products such as Firefox‘s Firebug addon, as web client side debuggers, while not also dedicating a blog post to the fundamental “debug” importance of a web browser’s …
Right Click webpage (or "two finger" gesture on Mac trackpad) -> View Page Source (or Show Page Source)
… in the sense that no matter how good products like Firebug are to drill down in a debugging way into the webpage, it still remains that these products are not “out of the box” for these web browsers, like the “View Page Source” is. However, saying that, all the modern web browsers have their own versions of Firebug “in the box”. For instance Firefox has Tools -> Web Developer which does a great job, like Firebug, as well.
But “View Page Source” will help you with a lot of static HTML and CSS considerations, and even some dynamic DOM ones involving the HTML document body onload event, and you just open the HTML up (with “View Page Source”) to see the HTML before you in that straightforward “easy peasy” way.
The other consideration is that products like Firebug have a bit of a learning curve.
What we find debugging, is that “View Page Source” methods (as shown with today’s Firefox tutorial picture), resolve about 80% of the issues and products like Firebug get called for the rest.
If this was interesting you may be interested in this too.


