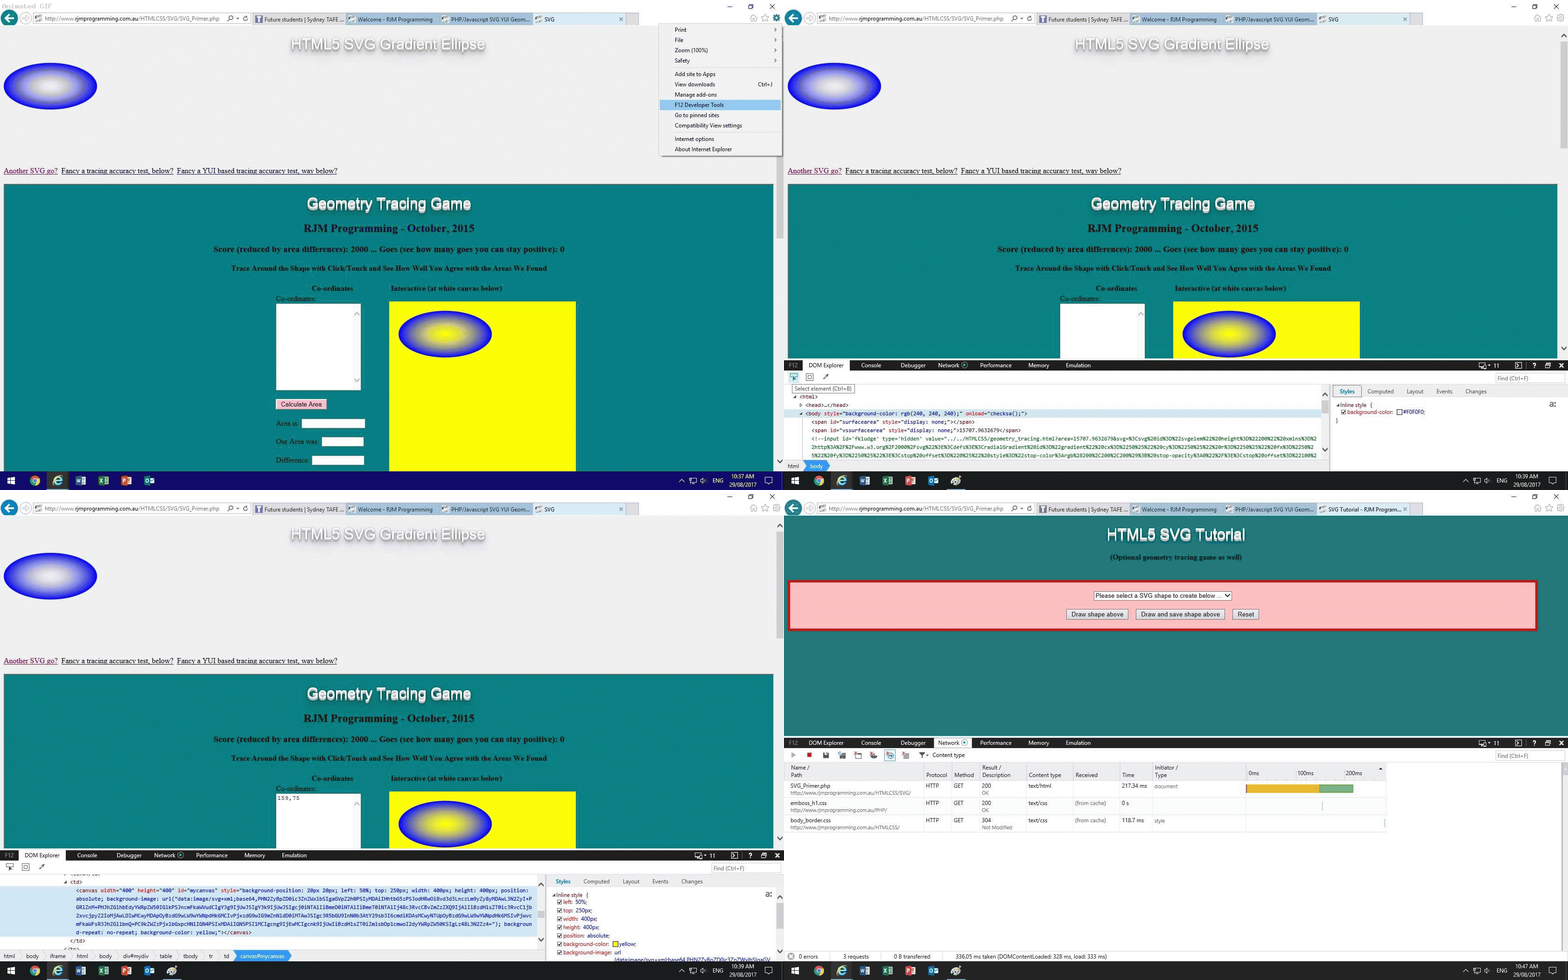
We can’t emphasise enough how important, and useful, are the modern “breed” of web browser “web inspectors”. These useful tools are written by the web browser products to enhance the experience using that web browser, though, of course, they hope you never have to visit their accompanying “web inspectors” to nut out problems, because, of course their products are perfect … tee hee.
We find the “web inspectors” great for nutting out CSS issues first and foremost, because they will all have an “Inspect HTML Element” piece of functionality (usually their top left icon) assisting the user …
- point at an HTML area of interest
- that/those HTML element(s) get highlighted
- the user picks a CSS (or Styles) tab to show what CSS “rules the roost” (ie. it is hierarchical … Cascading Style Sheet)
- strategies, as needed, can be put in place, at the proper place, to remedy for the look the user is after, to achieve, as necessary
Today, we’re visiting the Windows browsers …
- Internet Explorer
- Microsoft Edge
… regarding their “web inspectors”. For both above, they are accessed via (perhaps an initial Alt-F to get the “old” menus back, as required) …
Tools -> F12 Developer Tools
… or …
Settings (icon at top right) -> F12 Developer Tools
… and then you are presented, on a non-mobile platform, with a separate window, with the menus …
- F12
- DOM Explorer
- Console
- Debugger
- Network
- Performance
- Memory
Emulation
… and of these we spend most of our time in the “Console” tab, debugging for Javascript issues, should they arise, as that is where such error messages are shown to you, along, often with a line of code at issue, and a clickable means to get into that code, on occasions.
The “Network” menu is interesting, on instigating some PHP, in that you see the HTML and non-inline Javascript and CSS components involved in a web application, displayed to you, if you are ready with it, as you launch your web application.
If this was interesting you may be interested in this too.


